Embed Size (px)
Citation preview

1
VISUAL FIELD INTERPRETATION IN
GLAUCOMA
Danica J. Marrelli, OD, FAAOUniversity of Houston College of Optometry
FINANCIAL DISCLOSURE
In the past, I have received consulting or speaking fees from
Carl Zeiss Meditec, Alcon Laboratories, Pfizer, and Inspire.
Visual Field Interpretation
• Methods of Data Presentation• Systematic Strategy for Interpreting
Visual Field / Recognizing Visual Field Loss
• Diagnostic Criteria for Glaucoma• Classification of Visual Field Loss• Identifying Progression • Alternative Perimetry

2
RELIABILITY
• CATCH TRIALS– FIXATION LOSSES (20%)– FALSE POSITIVES (20%)***– FALSE NEGATIVES (33%)
• GAZE TRACKER
METHODS OF DATA PRESENTATION
• GRAYSCALE– GIVES A PICTURE
RESEMBLING ISOPTERS IN A GRAY TONE
– QUICKLY IDENTIFIES OVERALL DEPRESSIONS
METHODS OF DATA PRESENTATION
• NUMERIC GRID– RAW DATA
(THRESHOLD LEVELS)

3
METHODS OF DATA PRESENTATION
• TOTAL DEVIATION PLOT– DIFFERENCE BETWEEN
PATIENT’S RESPONSES AND AGE-MATCHED NORMAL POPULATION
• TOTAL DEVIATION PROBABILITY PLOT– SIGNIFICANCE OF THE
TOTAL DEVIATION PLOT
METHODS OF DATA PRESENTATION
• PATTERN DEVIATION– ADJUSTS THE TOTAL
DEVIATION FOR THE OVERALL HEIGHT OF THE HILL OF VISION
– CAN BE ADJUSTED UP OR DOWN
• PROBABILITY PLOT

4
METHODS OF DATA PRESENTATION
• GLOBAL INDICES– SINGLE NUMBER
REPRESENTATIONS OF THE VISUAL FIELD
– OVERALL GUIDELINES TO HELP ASSESS FIELD
– PROBABILITY VALUES GIVEN WHEN NUMBERS REACH SIGNIFICANT VALUES

5
GLOBAL INDICES• MEAN DEVIATION (MD)
– HEIGHT OF THE HILL OF VISION COMPARED TO AGE-MATCHED NORMALS
• PATTERN STANDARD DEVIATION (PSD)– DEGREE TO WHICH THE SHAPE OF THE
VISUAL FIELD DIFFERS FROM REFERENCE FIELD
– DOES NOT CHANGE WITH MEDIA
Glaucoma Hemifield Test
• Mirror Image Analysis Compares Superior to Inferior Field– Within Normal Limits– Borderline– Outside Normal Limits– Abnormally High
Sensitivity– General Reduction In
Sensitivity
INTERPRETATION OF THE AUTOMATED VISUAL FIELD
• RELIABILITY– MUST KNOW WHETHER OR NOT THE
DATA YOU ARE ANALYZING IS RELIABLE
• FIXATION LOSSES (20%)• FALSE POSITIVES (20%)• FALSE NEGATIVES (33%)
6
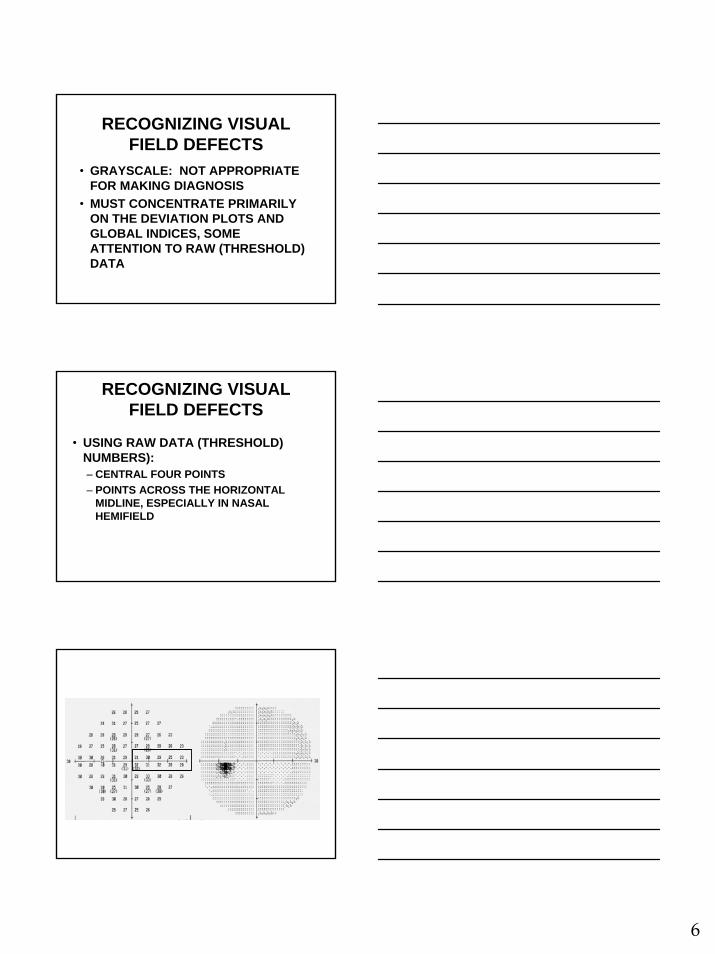
RECOGNIZING VISUAL FIELD DEFECTS
• GRAYSCALE: NOT APPROPRIATE FOR MAKING DIAGNOSIS
• MUST CONCENTRATE PRIMARILY ON THE DEVIATION PLOTS AND GLOBAL INDICES, SOME ATTENTION TO RAW (THRESHOLD) DATA
RECOGNIZING VISUAL FIELD DEFECTS
• USING RAW DATA (THRESHOLD) NUMBERS):– CENTRAL FOUR POINTS – POINTS ACROSS THE HORIZONTAL
MIDLINE, ESPECIALLY IN NASAL HEMIFIELD

7
RECOGNIZING VISUAL FIELD DEFECTS
• USING THE TOTAL OR PATTERN DEVIATION PLOTS:– FIND MOST DEPRESSED POINTS;
EXAMINE POINTS SURROUNDING THOSE
– LOOK FOR PATTERNS CONSISTENT WITH GLAUCOMA
• NASAL STEP• ARCUATE BUNDLE• PARACENTRAL
RECOGNIZING VISUAL FIELD DEFECTS
• Look at Global Indices & GHT– For diagnosis, look to see if they reach
statistical significance– For following over time, look for change

8
RECOGNIZING VISUAL FIELD DEFECTS
• SCOTOMAS AND DEPRESSIONS IN AREAS KNOWN FOR GLAUCOMA (PARACENTRAL, NASAL STEP, ARCUATE BUNDLE)
RECOGNIZING VISUAL FIELD DEFECTS
ALWAYS:1. LOOK AT BOTH FIELDS TOGETHER2. LOOK AT FIELD WITH RELATION TO
OTHER CLINICAL FINDINGS - DOES THIS MAKE SENSE, IS IT CONSISTENT WITH THE DIAGNOSIS OF GLAUCOMA?
3. DON’T OVERLOOK OTHER CAUSES OF VISUAL FIELD DEFECTS
KEY POINTS TO INTERPRETATION
• MAKE SURE YOU ARE LOOKING AT TRUSTWORTHY DATA
• WILL PROBABLY TAKE 3-4 TESTS TO ACHIEVE APPROPRIATE BASELINE
• MAKE SURE IT MAKES SENSE WITH OTHER CLINICAL FINDINGS

9
STRATEGY DECISIONS
• 30-2 vs. 24-2• Size III vs. Size V• 24-2 vs. 10-2• SITA-Standard vs. SITA-Fast (vs.
Threshold or FastPac)
3030--2 versus 242 versus 24--22
2424--2 versus 102 versus 10--22

10
Customizable Test GridsCustomizable Test Grids
•• Octopus perimetry Octopus perimetry allows custom test allows custom test grids to decrease grids to decrease separation between separation between points in areas of points in areas of concernconcern
Minimum Criteria for Diagnosis of Glaucoma VF Defect(HODAPP, ET AL, 1993)
1. GHT OUTSIDE NORMAL LIMITS ON AT LEAST TWO OCCASIONS
-OR-
Minimum Criteria for Diagnosis of Glaucoma VF Defect(HODAPP, ET AL, 1993)
2. CLUSTER OF 3 OR MORE NON-EDGE POINTS (in a typical location for glaucoma), ALL OF WHICH ARE IDENTIFIED AS SIGNIFICANT, WITH AT LEAST ONE AT THE p<1% ON TWO CONSECUTIVE TESTS
• (ON 24-2, USE ALL POINTS)-OR-

11
Minimum Criteria for Diagnosis of Glaucoma VF Defect(HODAPP, ET AL, 1993)
3. (C)PSD FLAGGED AT p<5% OR WORSE ON TWO CONSECUTIVE FIELDS
• USE PSD IF NO SHORT TERM FLUCTUATIONS USED
1.
2.
3.

12
CLASSIFICATION OF FIELD LOSS (Hodapp, et al)
• MILD (all 3 criteria must be met):• FOR 24-2 SITA STANDARD
– MD DEPRESSED BY <-5dB AND– ON PD PLOT, <25% (14) POINTS ARE
DEPRESSED BELOW THE 5% SIGNIFICANCE LEVEL and fewer than half of those points are depressed below the 1% LEVEL AND
– NONE OF CENTRAL FOUR POINTS HAS SENSITIVITY OF <20dB
14 points flagged5 points at 1% or worse
CLASSIFICATION OF VISUAL FIELD LOSS
• MODERATE (24-2 Sita)– MD -5dB TO -10dB OR– ON PD PLOT, <50% (14-28) POINTS ARE
DEPRESSED BELOW 5% LEVEL, OR 8-16 POINTS ARE BELOW THE 1% LEVEL OR
– CENTRAL POINTS BETWEEN 10-20dB IN ONE HEMIFIELD (NO POINTS IN CENTRAL 5 DEGREES WITH <10dB)

13
Moderate LossModerate Loss
14 total14 total9 below 1%9 below 1%
CLASSIFICATION OF VISUAL FIELD LOSS
• SEVERE (24-2 Sita)– MD DEPRESSED BY MORE THAN -10dB OR– ON PD PLOT, GREATER THAN 50% (28) POINTS
ARE DEPRESSED BELOW 5% OR MORE THAN 16 POINTS ARE BELOW THE 1% LEVEL OR
– BOTH HEMIFIELDS IN THE CENTRAL 5 DEGREES HAVE <20dB OR
– ANY POINT IN THE CENTRAL 5 DEGREES HAS A VALUE <10dB
Severe LossSevere Loss
20 total20 total17 at 1%17 at 1%

14
INTERPRETATION TEMPLATE
• LOOK AT RELIABILITY• LOOK AT CENTRAL LEVELS • FOR VARIATIONS OF >4dB ACROSS
HORIZONTAL MIDLINE NASALLY• TOTAL / PATTERN DEVIATION PLOT -
MOST DEPRESSED POINT AND SURROUNDING POINTS
• GLOBAL INDICES (MD, PSD, GHT)
FOR THE RECORD• STATEMENT WITH RESPECT TO
RELIABILITY• STATEMENT WITH RESPECT TO
PATTERN, DEPTH, AND SIZE OF VISUAL FIELD LOSS
• STATEMENT THAT CORRELATES OTHER EXAMINATION FINDINGS WITH VISUAL FIELD
IDENTIFYING PROGRESSION
• Much more difficult than detecting loss• Background of dynamic “noise”• No algorithm uniformly agreed upon for
detecting change• Three main changes:
– Deepening of defect– Enlargement of defect– New defect

15
IDENTIFYING PROGRESSION
• Long-term fluctuation– The single biggest problem in determining
progression– Deeper defects: more long term
fluctuation– More advanced glaucoma: more long term
fluctuation, more fatigue
IDENTIFYING PROGRESSION
• Overview printout– Grayscale– Threshold values– Total and pattern deviation plots– GHT, global indices, reliability
IDENTIFYING PROGRESSION

16
OVERVIEW
Overview PlotOverview Plot
IDENTIFYING PROGRESSION
• Total /Pattern Deviation Probability Plots– Once a black box…
• Grayscale• Threshold values

17
NTGS Criteria for Progression
• Previously normal area (baseline):– Three contiguous points, same side of
horizontal meridian now abnormal• One point changed by 10dB on total deviation
plot• Two points changed by 5dB on total deviation
plot
NTGS Criteria for Progression• Previously abnormal area (baseline of 3 tests
averaged):– Two contiguous points same side of horizontal
meridian decrease by >/= 10dB or 3x avg STF in baseline
– Suspected point’s value must be lower than ANY value obtained for that point in the baseline tests
• TO CONFIRM, CHANGE MUST BE PRESENT IN FOUR OUT OF FIVE CONFIRMING TESTS

18
GUIDED PROGRESSION ANALYSIS (GPA)
• Humphrey Field Analyzer– Based on results of GLAUCOMA patients
from mild to advanced disease– Patients took 12 different visual field tests
within a 4 week period– Developed a model for what is “expected”
test-test variation for patients with glaucoma
GPA
GPA• Uses 2 baseline exams (any strategy)
– Follow up tests must be SITA-Standard or SITA-Fast (all same strategy)
• Symbols used on Follow Up Tests– Open Triangles– Half Triangles
• Messages– Possible Progression– Likely Progression
• Rate of Progression

19
•• Minimum of three tests required: 2 baseline and 1 followMinimum of three tests required: 2 baseline and 1 follow--up up examexam
•• Each followEach follow--up compared to up compared to averaged thresholds of 2 baseline averaged thresholds of 2 baseline examsexams
•• Additional followAdditional follow--up up compared both to baseline and to 2 most compared both to baseline and to 2 most recent followrecent follow--upsups
•• Symbols:Symbols:
•• GPA GPA AlertAlertTMTM: Three in one exam denotes : Three in one exam denotes ““Possible Possible ProgressionProgression”” and three indicates and three indicates ““Likely ProgressionLikely Progression””
CRITERIA FOR CHANGE
= Progression at 95% significance levelProgression at 95% significance level
= Progressing point repeated in two consecutive examsProgressing point repeated in two consecutive exams
= Progressing point repeated in three consecutive examsProgressing point repeated in three consecutive exams
HFA Guided Progression Analysis New global metric - VFI - optimized for
progression analysis
• Visual Field Index
• Calculated for all available reliable fields.
• Age-adjusted & center-weighted to better reflect ganglion cell loss.
• Reduced sensitivity to cataracts.
• 100% = normal function
• 0% = perimetric blindness
Elements of GPA 1-Page Summary Report
••VFI (Trend VFI (Trend Analysis)Analysis)
••Baseline TestsBaseline Tests
••TodayToday’’s VFs VF

20
The VFI Bar• historical and
projected VFI loss
Loss to date
Projected future loss 100%
HFA GPA VFI Summary - Interpretation at a
Glance
ALTERNATIVE PERIMETRY
• Frequency Doubling Perimetry (FDP, FDT)– Matrix
• Short Wavelength Automated Perimetry (SWAP)
• Static vs. Kinetic• Heidelberg Edge Perimetry• GATE strategy
Frequency Doubling Technology Frequency Doubling Technology (FDT)(FDT)
•• Based on frequency doubling illusionBased on frequency doubling illusion–– Low spatial frequency grating flickered at Low spatial frequency grating flickered at
high temporal frequency (>15Hz) high temporal frequency (>15Hz) –– image image is seen as a doubled spatial gratingis seen as a doubled spatial grating
Nonlinear
Response
1 cycle/ degree or less
}
faster than 15 HzCounter-phase flicker

21
FDTFDT•• Originally thought to target My cellsOriginally thought to target My cells•• Now thought to preferentially stimulate the Now thought to preferentially stimulate the
magnocellularmagnocellular processing systemprocessing system•• Original test: up to 19 test points, 10Original test: up to 19 test points, 10°° x 10x 10°°
in threshold or screening modein threshold or screening mode•• Reported to have high specificity and Reported to have high specificity and
sensitivity for detection of glaucomasensitivity for detection of glaucoma•• Resistant to blur, illumination, small pupils, Resistant to blur, illumination, small pupils,
etc.etc.•• No advantage for following for progressionNo advantage for following for progression
Humphrey FDT Sample PrintoutsN-30 Threshold
C-20 Screening
FDT as a screening tool for FDT as a screening tool for glaucomaglaucoma
•• There is significant evidence in the There is significant evidence in the literature that FDT is a sensitive test literature that FDT is a sensitive test that is able to detect early that is able to detect early glaucomatous defects.glaucomatous defects.
•• In most of the studies, there are very In most of the studies, there are very strict inclusion/exclusion criteria, strict inclusion/exclusion criteria, including experience with perimetry, including experience with perimetry, clear media, low refractive errorsclear media, low refractive errors

22
Flicker Perimetry Flicker Perimetry -- OctopusOctopus
Matrix Matrix –– Hybrid FDT/SAPHybrid FDT/SAP
•• Uses FDT stimulus presentationUses FDT stimulus presentation•• Smaller 5Smaller 5°° targets presented in 24targets presented in 24--2 2
patternpattern
Humphrey Matrix Test Strategies
N-30-1 (-5) Screening < 1 19, 8° x10°24-2 Screening 1 55, 5° x5°24-2 Threshold 4 – 5 55, 5° x5°
Name Type Time, m Stimulus
N-30-F Threshold 2 – 3 19, 8° x10°10-2 Threshold 4 44, 2° x2°
Macula Threshold 1.5 16, 2° x2°
30-2 Threshold 5 – 6 69, 5° x5°

23
Short Wavelength Automated Perimetry Short Wavelength Automated Perimetry (SWAP)(SWAP)
•• Large blue target presented on bright yellow Large blue target presented on bright yellow backgroundbackground
•• Theory: selectively tests blue cones and the Theory: selectively tests blue cones and the koniocellularkoniocellular pathwaypathway
•• Several studies: SWAP detects defects Several studies: SWAP detects defects earlier than SAPearlier than SAP
•• Limitations: cataract/media opacity, Limitations: cataract/media opacity, compressed dynamic range, increased test compressed dynamic range, increased test timetime
•• Indications: glaucoma suspect who has Indications: glaucoma suspect who has normal SAPnormal SAP
•• Available in HFA and Octopus perimetersAvailable in HFA and Octopus perimeters
∂∂
SWAP W-W
• More time consuming, 15-17% longer using the same threshold strategy (Wild et al 1998)
• General depression of the hill of vision smaller dynamic range (no benefit of SWAP in patients with moderate to advanced field loss)
• More sensitive to cataract• Larger intersubject variability wider normal limits for threshold values
Traditional SWAP Weaknesses Compared to W-W
Slide courtesy of Boel Bengtsson Dept of Ophthalmol
Malmo University Hospital, Sweden
Full ThresholdFull ThresholdTest Test timetime: 12:50: 12:50
FastpacFastpacTest time: 7:50Test time: 7:50
SITASITATest time: 3:56Test time: 3:56
Stimulus:Stimulus: V, BlueV, Blue
Background:Background: YellowYellowStimulus:Stimulus: V, BlueV, Blue
Background:Background: YellowYellowStimulus:Stimulus: V, BlueV, Blue
Background:Background: YellowYellow
Expected Improvements with SITA SWAP:Speed and Sensitivity
Slide courtesy of Boel Bengtsson Dept of Ophthalmol
Malmo University Hospital, Sweden

24
Heidelberg Edge Perimetry (HEP)Heidelberg Edge Perimetry (HEP)
•• Disclaimer: device not FDADisclaimer: device not FDA--approved and not approved and not commercially available in the UScommercially available in the US
•• A type of flicker perimetry based on an illusionary A type of flicker perimetry based on an illusionary stimulusstimulus–– ““FlickerFlicker--defined formdefined form””–– 55°° stimulus shown on background of flickering dotsstimulus shown on background of flickering dots–– Stimulus is flickered in Stimulus is flickered in counterphasecounterphase at high temporal at high temporal
frequencyfrequency–– Phase difference between background an stimulus gives Phase difference between background an stimulus gives
rise to an illusionary rise to an illusionary ““edgeedge”” or border (circle)or border (circle)–– Reported to detect early, preReported to detect early, pre--SAP defectsSAP defects–– Defects are deeper than SAPDefects are deeper than SAP
Contour-Illusion StimulusPhase 1 + Phase 2 = Illusory “Edge” or
Contour
+ =
Stimulus - Flicker Defined Form (FDF)
Data Display – OU Results
OD results
OS results
Patient and testinformation

25
OU Printout
Patient and Test Information
Est. Sensitivity
Grayscale
Total Deviation
Pattern Deviation
Reliability Parameters
A Combined Approach to Structure & Function
Structure Function Map
Structure Function
MapStructure Function
Structure & Function Map
Inner Ring:
HRT MRAStructure Classification
Outer Ring:
HEPFunction Classification
Legend: Within Normal Limits Borderline Outside Normal Limits

26
Structure Function Reports: HRT & HEP
HEPHEP
•• Combined structureCombined structure--function plotfunction plot–– Initially with MRA baseline dataInitially with MRA baseline data–– Eventually hope to include progression Eventually hope to include progression
analysisanalysis•• Currently available in several European Currently available in several European
countriescountries•• Hope to have rollHope to have roll--out in USA in 2010out in USA in 2010
THANK YOU FOR YOUR ATTENTION.
QUESTIONS????