Embed Size (px)
Citation preview

Visual Analysis of Complex Firewall Configurations
Florian MansmannUniversity of Konstanz
Timo GöbelUniversity of Konstanz
William [email protected]
ABSTRACTFirewalls have become essential components in the securityconcept of almost any modern computer network. Due totheir relevance and central location in the network, theirprogramming logic often survives several generations of ad-ministrators and hardware. Understanding the logic behinda firewall configuration is thus an important but challeng-ing task for a network administrator. In general, there isa tendency to add new rules while old rules are only rarelychanged or removed due to unexpected consequences in thenetwork. In this paper we present a visualization tool tosupport the network administrator in this complex task ofunderstanding firewall rule sets and object group definitions.The tool consists of a hierarchical sunburst visualization,which logically groups rules or object groups according totheir common characteristics, a color-linked configurationeditor and classical tree view components for rules and ob-ject groups. All these components are interactively linked toenable both exploratory and hypotheses testing tasks aimedat understanding the complex functionality of a firewall con-figuration. To verify our design, we present two case studieson the analysis of rule usage and on nested object groupsand collected feedback from five firewall administrators.
Categories and Subject DescriptorsC.2.0 [Computer-Communication Networks]: General—Security and protection; C.3.8 [Computer Graphics]: Ap-plication; H.5.2 [Information Interfaces and Presenta-tion]: User Interfaces
General TermsDesign, Human Factors, Security
KeywordsFirewall Visualization, Rule Set Visualization, ManagingFirewalls
Permission to make digital or hard copies of all or part of this work forpersonal or classroom use is granted without fee provided that copies arenot made or distributed for profit or commercial advantage and that copiesbear this notice and the full citation on the first page. To copy otherwise, torepublish, to post on servers or to redistribute to lists, requires prior specificpermission and/or a fee.VizSec ’12 October 15 2012, Seattle, WA, USACopyright 2012 ACM 978-1-4503-1413-8/12/10 ...$15.00.
1. INTRODUCTIONFirewalls have become an integral part of the network
security infrastructure of almost every managed network.Their goal is to either protect the internal network infras-tructure from attacks, theft of data and manipulation or tolog security related events at scale. Ever since the inceptionof firewalls [4], their complexity has dramatically increasednot only in functionality, but also in the ways that peopleuse and configure these firewalls.Due to the novel exploits and the increase of threats in theinternet, administrators need to constantly adapt the pro-tection of their network. While most of these changes involvepatches of software on individual hosts, some other changesare more effective to be done through a traffic filtering ruleon a central firewall. Because of changing personnel andresponsibilities as common in many enterprises and insti-tutions, the body of rules of a firewall often grows to anunmanageable size and complexity. Since there are manyinterdependencies in the network configuration, it is espe-cially hard to change old rules. If I a rule gets deleted, whatwill break? What part of the business will suddenly havea problem? As a consequence, old rules are often kept inplace.We believe that there is a pressing need to visually sup-port network administrators in their complex task to man-age historically grown firewall rule sets. In our preliminaryexperiments on representing the interlinked information ofa firewall rule set we used graph visualizations, but soonrealized that ambiguities of linked elements (e.g., TCP ap-pearing in a almost every 2nd rule) were created so thatone could not follow a single path of a rule. However, wewere convinced that the structural information implicitlycontained in the rule set should be made explicit in the vi-sualization and we thus reverted to hierarchical visualizationtechniques. While Treemaps nicely visualize leave nodes ofa hierarchy, they were not appropriate for our case since themore important information is contained in the structure ofthe hierarchy. Therefore, we decided to use a hierarchical vi-sualization technique called Sunburst [18] to present firewallrulesets. Besides adapting this technique to group firewallrules based on their common properties, the strength of ourtool is the linkage of the textual firewall rules with theirvisual counterpart as well as the interaction to explore rule-sets in detail and to easily test hypothesis about the ruleset. Furthermore, through an adaption of the visual map-ping our tool can be used to assess performance aspects ofa firewall in a fine-granular way. Note that while we builtour tool on top of a real-world dataset, for security reasons

all data in this study was anonymized.The rest of this paper is structured as follows: Section 2covers related work, Section 3 introduces our firewall visu-alization tool, which is then demonstrated in a case studyin Section 4. Section 5 presents the critical design choicesthat we made when creating the firewall visualization tooland discusses user feedback. Finally, Section 6 concludesthis paper and outlines future work.
2. RELATED WORKThe structure and traffic of large computer networks is
one of the most challenging things to visualize not only dueto the size and interlinkage of the networks, but also due tothe fact that data needs to be captured at different vantagepoints within the network to obtain a comprehensive pictureof the network’s underlying dynamics. Some of the early ap-proaches at scale were the internet graphs by Cheswick et al.[3] and the “Visualizing Network Data” study [1] by Becker,Eick and Wilks. While the first approach focused on thetopological aspects of the internet using a scalable node-linkrepresentation, the second approach aimed at presenting ahigh-level overview of the actual traffic loads within largenetworks using maps and matrix representations.PortVis [15] was one of the first approaches to show the ac-tivity of the more than 65,000 application ports in a pixel vi-sualization. After locating interesting ports, the tool offereda time series visualization to investigate port activity overtime. TNV [8] put its focus on temporal aspects of host com-munication patterns. Its basic visual metaphor was a matrixrepresentation of time versus hosts in which traffic was in-dicated through the cell color and linkage information of se-lected hosts was drawn on top. Furthermore, an alternativevisualization showed the relation between source and desti-nation ports. Later, the Radial Traffic Analyzer [10] aimedat simultaneously investigating more dimensions of the pro-tocol information (e.g. source/target IP, source/target port,time, etc.) in a hierarchical Sunburst [18] visualization. TheHierarchical Network Maps [14] then considered the IP ad-dress space in a hierarchical fashion by taking into accountthe autonomous systems, countries and continents to whichindividual IP prefixes belonged and displayed traffic infor-mation in a color-encoded TreeMap visualization. Finally,the Knowledge Representation in [21] introduced an interac-tive pattern specification component and processing in thenetwork traffic analysis domain. For a more extensive cov-erage of the general topic of network security visualization,we refer the reader to a recently published survey [17].
Visualization of association rules or frequent patterns is afield closely related to our study. In this domain, we wantto highlight two basic approaches. First, Wong et al. [20]argued against the representation of both antecedent andconsequent of a rule as axes of a matrix and settled for a3D matrix visualization, which links rules to a selected setof items (i.e. topics) using color to distinguish between an-tecedent and consequent. The summary columns then showsupport and confidence of the respective rules. This ap-proach was applied to a collection of 3,000 text documents.For the design of the firewall rule visualization tool describedin this paper, we were inspired by FP-Viz [11], which alsobuilds upon the concept of the Sunburst visualization. Thebasic idea is to derive a hierarchy of common rule compo-nents. These components are then drawn as ring segmentsfrom the inside to the outside. Collecting the segments from
the outside to the center of the Sunburst then correspondsto the components of one rule.Rules also play an important role in the field of network se-curity. So-called intrusion detection systems often use a setof rules to classify network traffic and then output detailedhit statistics. SnortView [12] is a visualization system toanalyze the output of the popular intrusion detection sys-tem Snort. This visualization system mostly uses matrixrepresentations of source IP address vs. time or source vs.destination ip address. Statistical figures are represented inthe background whereas glyph representations in the ma-trix cells give more details about the events. VisAlert [7]is another approach to visualize such event information. Itsdesign principle is to visualize the network structure in thecenter and events on several concentric rings that representtime. The angle determines the kind of alert. The linkagebetween events and network entities is only shown for oneselected timeframe. Yet another approach in this field isSprialView [2], which presents network events on a time spi-ral. Regular events form patterns in the visualization andare thus easy to identify.To the best of our knowledge, there are currently only threeresearch papers that deal with the visualization of firewalldata. Visual Firewall [13] uses line charts, parallel coordi-nates and matrix views with a combination of color-coding,glyphs, linking and animation to represent the activity ofa firewall. In the essence, this work focuses on visualizingnetwork traffic whereas our work concentrates on visualiz-ing the components of firewall rules. In contrast to thisPolicyVis [19] presents a visualization tool to interactivelyvalidate the rules of a firewall system. Its basic visual com-ponent is a configurable matrix visualization, which allowsto set a choice of two dimensions from source/destinationIP, source/destination port as the axes of a matrix and athird dimension for labeling. Semi-transparent bands in redand green then depict accept and deny rules. Created Voids[16] is yet another approach, which can be used to assessthe relationship between different rules by transforming thevalue ranges of a rule into a geometric object. Respectivelytwo dimensions of the rules create a plane in 3D and thevalue ranges define a rectangle of this plane. Linking severalof these planes with each other creates a geometric object.Rendering several rules as geometric objects then allows toassess the interrelation between these rules. Parallel coordi-nates are used as an alternative representation of this infor-mation space. In contrast to this work, our approach offersa better overview of the ruleset since it displays rules in anon-overlapping manner without occlusion.
While network traffic visualization has been extensivelystudied, there is only little work on the topic of visualiz-ing firewall rule sets. Since appropriate tools for gaining anoverview of a firewall rule set are still missing, we show thatour mapping of the rule set into a hierarchical data spacewill help network administrators to better manage the in-trinsic complexity of firewall configurations in the followingsections.
3. VISUAL FIREWALL EDITORThis section includes a description of the firewall rule set
data that we use, a general description of our system anda detailed explanation of our visualization of the rule andobject groups.

Figure 1: Visual Firewall Editor showing the Sunburst visualization (left), the editor (top right) and twointeractive tree views for access lists (middle right) and object groups (bottom right) respectively.
3.1 Firewall Rule SetFirewall rules are usually specified in a structured tex-
tual form. To maintain an overview, individual rules aregrouped in access control lists (sometimes simply called “ac-cess lists”) and their structural elements such as protocols,source/target hosts or ports can be grouped in object groups.Therefore, one single rule can express more general concepts.As an example“all traffic to the three webservers of the com-pany on the ICMP and UDP protocols should be dropped”can be expressed in one rule rather than in six separate rules.
Object groups define groupings of similar objects, whichcan then be used within access control lists to define policiesfor the access control lists. By using object groups thereis, in most cases, no need to use individual IP addresses,protocols and ports for the access control lists. The objectgroups allow so-called multiple access control entries (ACEs)to grant or deny, for example, an entire object group of usersaccess to an object group of servers.
The rule set consisting of access control lists and objectgroups are usually stored in a firewall configuration file,which is then loaded and compiled by the actual firewallto efficiently process network traffic according to the givenrules. Firewall configuration files can become complex andcontain a large number of interdependent entries. There-fore, it can be very difficult to configure and manage theaccess control lists. Access control lists which use objectgroups tend to be smaller and more readable, which makesthe configuration and management easier [5].
3.2 System
The Visual Firewall Editor is programmed in Java andbased on the interactive visualization toolkit Prefuse [9]. Inparticular, our tool uses an adaption of the DocuBurst [6]code for the Sunburst visualization. Figure 1 shows the Vi-sual Firewall Editor with the visualization of access lists of afirewall configuration file. In principle, our tool is composedof three interface components:
1. The Sunburst visualization depicts a hierarchical viewon the firewall rules of the loaded configuration file.
2. The editor shows the textual representation of this fire-wall configuration file.
3. The interactive tree views show the created access listand object group hierarchies and enable navigation inthem.
While the Sunburst visualization will be discussed in de-tail in the next subsection, we will focus here on the othertwo interface components and their interactivity. The edi-tor on the top right of Figure 1 can be used to display acomplete firewall configuration file in textual form contain-ing both object groups and access control lists. In additionto these functional elements, configuration files commonlycontain comments written by the authors of the rules serv-ing the purpose of documenting the semantic function of therules in the historic context of the network infrastructure,which are not visible in the visualizations. To enable eas-ier interpretation of the functional elements of the rules andobject groups, we created a consistent coloring scheme for

(a) Search inside the visualization showing the high-lighted keyword “domain” in a set of 160 rules.
(b) Completely expanded tree showing the 168 object groupswith 554 port-, network-, protocol or group-objects.
Figure 2: Interaction with the Visualization
code highlighting, which is later also employed in the visu-alization.The editor’s text area is fully editable. All operations andchanges can be saved via the main menu to a new or to thealready existing file. The editor also has several interactionoptions. By pressing the right mouse button on a selectedword, a menu pops up with the options copy, paste, cut,undo and highlight. Since structural information is avail-able from the context only the element corresponding to thetext marking in the textual rule description of the editoris highlighted in the Sunburst visualization. The resultinghighlighting in the visualization is similar to the result of thesearch feature as shown in Figure 2(a). However, in contrastto the contextual highlighting, the search feature highlightsall possible occurrences of the keyword in the visualization.Further search options for the editor are accessible throughthe main menu; matched keywords in the text are then high-lighted in red.Since rules need to adhere to a strict syntax to be process-able by the firewall, we created a quick edit component tosupport the network administrator in this task. After access-ing it through the extended views menu, several drop-downboxes with predefined keywords guide the user though thecreation of a new rule in the editable text box below. Uponsubmission, this new rule is added to the current cursor po-sition in the firewall configuration file shown in the editor.
Underneath the editor, two interactive tree view compo-nents allow the structural exploration of the access controllists and object groups. This view is useful to group rulesand objects based on their structural elements. Figure 1, forexample, shows the next grouping level of all deny rules ofthe access control list “acl1” on the right side.
3.3 Rule and Object Group Visualization
The employed Sunburst [18] is a hierarchical visualizationtechnique, which puts a root node as a circle in the middleof the visualization and then recursively maps the elementsof each hierarchy level onto ring segments. In order to usethis visualization for our dataset, we need to model the fire-wall rules and object groups in a hierarchical way. In ourconcrete case, the first level after the root node for the rulesvisualization consists of the names of the different accesslists as shown in Figure 1. The second level contains the ac-cess privileges (“permit” or “deny”), the 3rd one the protocol(i.e., “tcp”, “ip”, “udp”, etc.), followed by the source and des-tination dimensions, which are usually set to values such as“any” or concrete object groups. Note that the remainingdimensions vary in values since these fields are optional forrules, which causes the spikes on the outside of the visualiza-tion. Usually these dimensions contain object groups thatdefine grouping of ports or comparisons (e.g. “gt 1023” fordestination port greater than 1023).A hierarchy is formed from our data by grouping identicalrule elements in a recursive manner according to the abovedescribed dimensional order. As a result, “acl1” in Figure 1is split up into blocks of permit and deny rules in whicheach contains among others a block of TCP and IP protocolrules. This subdivision is repeated until the end of each ruleis used.
We designed our Visual Firewall Editor in a way that itsupports two basic tasks. The first task is the explorationof firewall rules and object groups, whereas the second taskis to test certain hypotheses about a rule set. We will nowdescribe the interaction features of our visualization com-ponent according to these opposing usage strategies. Notethat a common analysis process often involves both strate-gies and the respective interaction methods can thus also beused for the opposing analysis task.

The depth level slider depicted on top of the visualiza-tion in Figure 1 defines the number of hierarchy levels to beshown in the visualization. When the depth level is set tomaximum all nodes of the visualization are displayed andthe corresponding trees on the right side are expanded. Tomake the best use of the display space, the auto zoom fea-ture automatically scales the visualization with the selecteddepth according to the size of the frame. This ensures thatthe elements of the visualization are enlarged in the bestpossible way in order to make their labels readable and toenable cross-element comparisons of their sizes. When turn-ing off the auto zoom, the user can zoom in and out of thedisplayed vector graphic. This interaction is triggered byholding down the right mouse button and moving the cur-sor up or down.To improve the visibility of a node and the readability of itslabel, the width of a segment can be changed interactivelyusing the mouse wheel. This interaction can also be used todecrease the used space of an element when it is irrelevantfor the current analysis task and to give more more spacefor the remaining elements.When the mouse cursor is set above a node in the visualiza-tion, a tooltip with is label is shown. By pressing the leftmouse button on a node in the visualization, the correspond-ing line in the text editor containing the firewall configura-tion file will be focused in the editor window and highlightedusing red background color. Furthermore, the correspondinghierarchy element in the access list or object group treeviewon the right is opened and highlighted.
The second usage scenario of our tool is to test hypothe-ses about a certain firewall configuration. In this scenario,the network administrator already has a concrete idea aboutwhat he wants to find out about the firewall rule set. Wecreated several interaction capabilities in the tool that sup-port this goal-driven search for information:First, every node can also be expanded manually to eachdepth level through a left mouse button click on the nodewithout expanding the whole tree with all nodes. Figure 3shows a node that has been expanded manually to the pro-tocols and object groups that will be permitted. As alreadydescribed above, this interaction also triggers highlightingand focusing in the text editor and the respective treeview.Second, there is also a possibility to search for a specifickeyword, which is highlighted in the visualization to obtaina closer view of a known element and its connectivity withother access lists. Figure 2(a) shows the use of the search op-tion with the keyword domain. It can be seen that “domain”is included in four access lists. The number of matches is
Figure 3: Manual node expansion
also displayed on the left side of the search field.Third, the user-defined visualization provides the ability forthe user to visualize the relationship of arbitrary rule ele-ments in a user-defined priority. For example, the user canvisualize the access control list, source objects, protocol andaccess privileges in descending order. Figure 4(a) shows thatnearly all rules for TCP protocol permit access. Another in-sightful visualization could be a comparison of the permitand deny rules for each access control list as shown in Fig-ure 4(b). All of the access control lists contain “permit”rules, whereas only 6 out of 8 contain deny blocks.
Note that both the above described visualization and in-teractions can not only be applied to firewall rules, but canbe used in exactly the same way on object groups of a fire-wall configuration. In our tool, this is done by changing theroot node from access list to object-group. The result ofthis change is shown in Figure 2(b) . It can be seen thatthere are two types of object groups with a large numberof entries (“network” and “service”) and two types with onlya few entries. If the visualization is expanded to maximumdepth level, all elements of the visualization are shown. Thefine-granular elements at the outer rings define concrete IPaddresses for host objects and port number for service ob-jects.
4. CASE STUDYThis section describes two relevant use cases within the
analysis of a firewall configuration file. The configurationfile consisted of 160 rules, which were grouped into 8 accesscontrol lists and 168 object groups. In total, this configura-tion file consisted of approximately 1150 lines of code.
4.1 Analysis of Rule UsageAnother issue of firewall configuration is the matching of
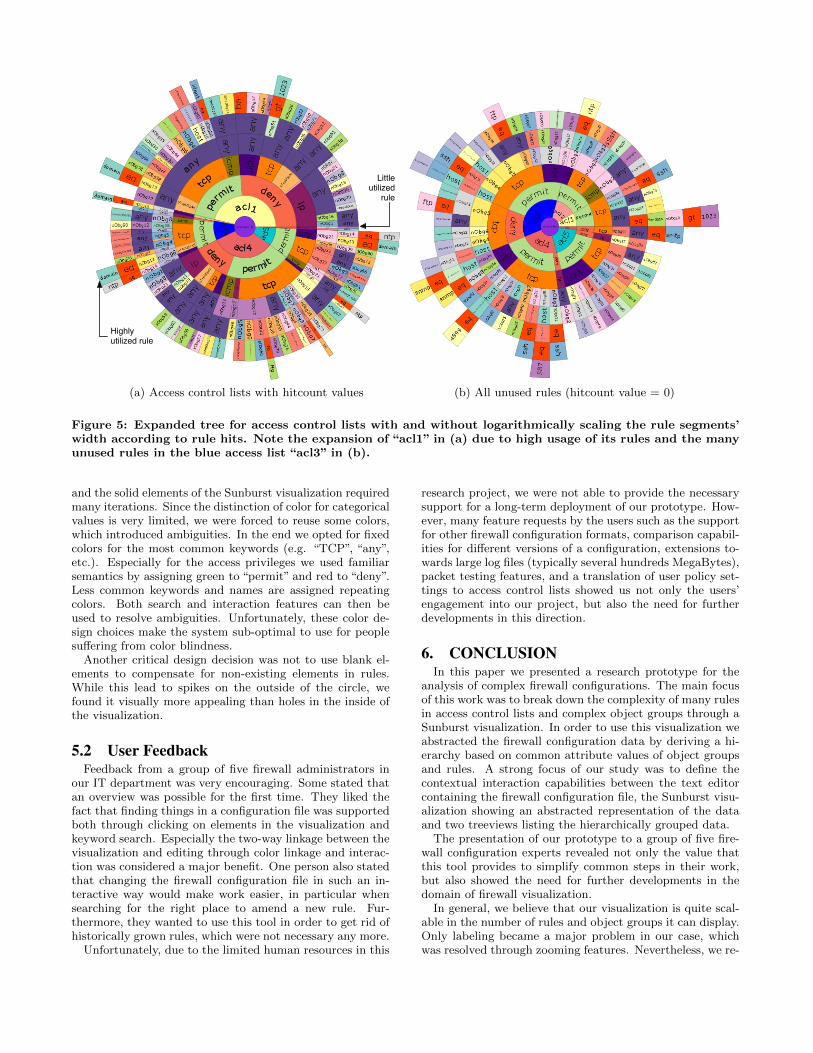
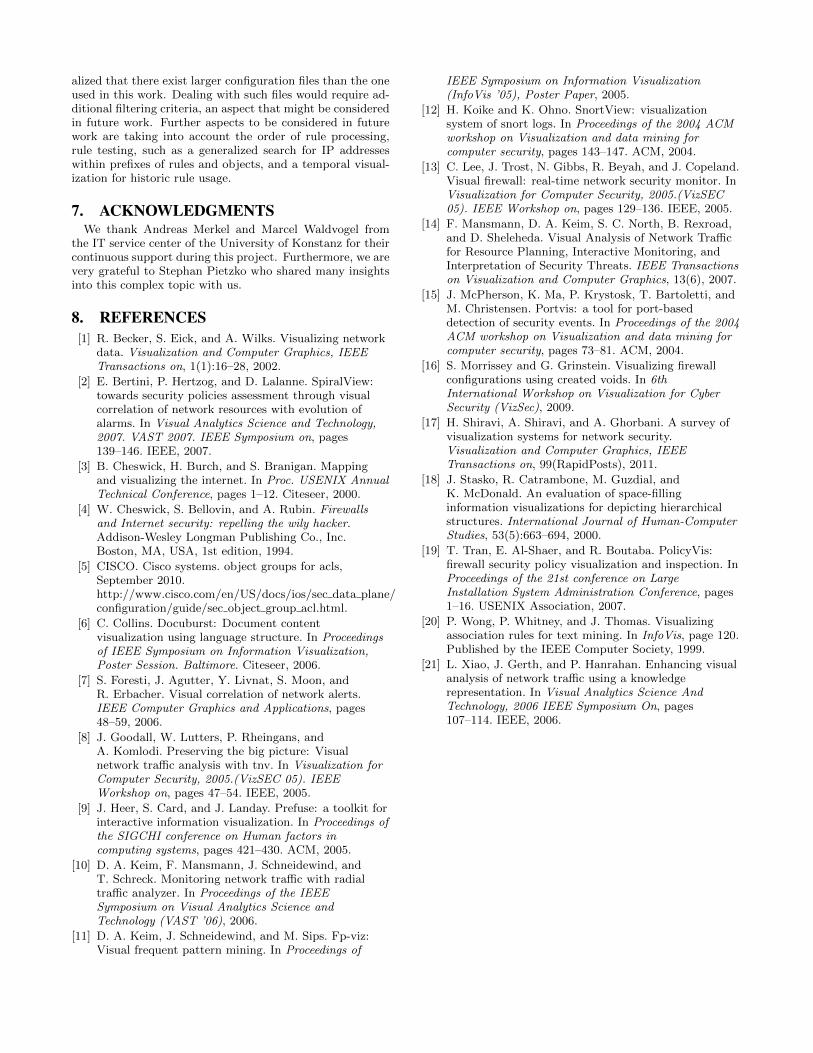
traffic for the access control entries. For this reason a hitcount value can be added to each access control entry. Thisvalue documents how often a certain rule was matched andis thus commonly used for troubleshooting connectivity andsecurity of a firewall configuration. Since it is tedious tocompare these hitcount values and to manually aggregatethem on access control lists, we configured our Visual Fire-wall Editor in such a way that it can read and aggregatethese statistical usage values. Figure 5(a) shows the result-ing visualization of access control lists with hit count values.It can be seen that the access control lists “acl1” and “acl4”are very large, which means that the the sum of all hit countvalues for those access lists is very high.Since there is a large variance in the hitcount values, weuse logarithmic scaling to determine the width of the rulesegments. While absolute comparisons are not possible anymore, this avoids the effect that one or a few standard rulecover the whole visualization space. The segment of the ac-cess control list “acl1” in Figure 5(a) is very large becauseof high hitcount values whereas the next access control list“acl2” almost disappears due to a small number of hitcountvalues. It can also be seen that the ring segment of the denyrules of “acl1” compared to the ring segment of the permitrules have almost the same size. This means that the trafficof the permit and deny rules is nearly the same. In case ofthe access control list “acl4” it can be seen that its permitrules compared to its deny rules have a larger circle segment.The hit count visualization in general gives a good overviewwhat access control lists apply for high traffic and vice versa.

(a) Access list, source object, protocol, access priv-ilege
(b) Proportions of permit and deny rules with ac-cess lists and source objects
Figure 4: Hypothesis driven analysis with user-configured visualizations. The rule hierarchy is specified frominside to outside using a subset of the rule fields (i.e. the access privileges) and/or values (e.g. tcp).
So the user can individually decide what access control listshould be inspected in detail.Furthermore, we provide the option to display unused rulesin a firewall configuration, which all have a hitcount valueof 0. Figure 5(b) shows that “acl3” and “acl5” have a verylarge number of access control entries with a hit count valueequal to 0. Access control list “acl4” is nearly half the size incontrast to the visualization of used rules in Figure 5(a). Ingeneral, the fact that a rule has no hits does not necessar-ily mean that it is not useful from a security point of view.However, some of these rules can be considered as historicartifacts, which are either not necessary any more (especiallypermit rules that were not used for several months) or arenot executed due to other executed rules that now fill theirplace.
4.2 Understanding Nested Object GroupsIn a CISCO firewall configuration, object groups provide
the feature of including other object groups in their defini-tion. While this gives more flexibility to the network admin-istrators, it also increases the complexity of a firewall con-figuration. Our firewall visualization can be used to exploresuch dependencies within object groups. Figure 6 shows thevisualization of all nested object groups of the configurationfile with a detailed view on the object group nObg22Admin.The object group nObg22Admin has several network-objectsand as a nested object group the nObg3 group object. Inthis case all details of the network-objects of the nested ob-ject group are displayed for inspection.
5. DISCUSSIONThe purpose of this section is to discuss on the one hand
the implicit and explicit design choices that we made in ourtool and on the other side the feedback that we obtainedfrom firewall administration experts.
Figure 6: Nested object groups
5.1 Design ChoicesIn the process of designing a visualization tool to sup-
port network administrators in their task to understand andmaintain a firewall configuration, we considered many op-tions. After initial tries, node link diagrams (also known asgraphs) were discarded due to emerging ambiguities whenlinking several rule elements or object group elements witheach other. Furthermore, since the information space was solarge, we opted for a compromise between showing aggrega-tions and showing the full level of details, which eventuallyconverged to the choice of using an adaptation of the Sun-burst visualization linked with classical treeviews and a texteditor.
The usage of color for establishing a linkage between thetextual elements in the text editor on white background
Highly utilized rule
Little utilized
rule
(a) Access control lists with hitcount values (b) All unused rules (hitcount value = 0)
Figure 5: Expanded tree for access control lists with and without logarithmically scaling the rule segments’width according to rule hits. Note the expansion of “acl1” in (a) due to high usage of its rules and the manyunused rules in the blue access list “acl3” in (b).
and the solid elements of the Sunburst visualization requiredmany iterations. Since the distinction of color for categoricalvalues is very limited, we were forced to reuse some colors,which introduced ambiguities. In the end we opted for fixedcolors for the most common keywords (e.g. “TCP”, “any”,etc.). Especially for the access privileges we used familiarsemantics by assigning green to “permit” and red to “deny”.Less common keywords and names are assigned repeatingcolors. Both search and interaction features can then beused to resolve ambiguities. Unfortunately, these color de-sign choices make the system sub-optimal to use for peoplesuffering from color blindness.
Another critical design decision was not to use blank el-ements to compensate for non-existing elements in rules.While this lead to spikes on the outside of the circle, wefound it visually more appealing than holes in the inside ofthe visualization.
5.2 User FeedbackFeedback from a group of five firewall administrators in
our IT department was very encouraging. Some stated thatan overview was possible for the first time. They liked thefact that finding things in a configuration file was supportedboth through clicking on elements in the visualization andkeyword search. Especially the two-way linkage between thevisualization and editing through color linkage and interac-tion was considered a major benefit. One person also statedthat changing the firewall configuration file in such an in-teractive way would make work easier, in particular whensearching for the right place to amend a new rule. Fur-thermore, they wanted to use this tool in order to get rid ofhistorically grown rules, which were not necessary any more.
Unfortunately, due to the limited human resources in this
research project, we were not able to provide the necessarysupport for a long-term deployment of our prototype. How-ever, many feature requests by the users such as the supportfor other firewall configuration formats, comparison capabil-ities for different versions of a configuration, extensions to-wards large log files (typically several hundreds MegaBytes),packet testing features, and a translation of user policy set-tings to access control lists showed us not only the users’engagement into our project, but also the need for furtherdevelopments in this direction.
6. CONCLUSIONIn this paper we presented a research prototype for the
analysis of complex firewall configurations. The main focusof this work was to break down the complexity of many rulesin access control lists and complex object groups through aSunburst visualization. In order to use this visualization weabstracted the firewall configuration data by deriving a hi-erarchy based on common attribute values of object groupsand rules. A strong focus of our study was to define thecontextual interaction capabilities between the text editorcontaining the firewall configuration file, the Sunburst visu-alization showing an abstracted representation of the dataand two treeviews listing the hierarchically grouped data.
The presentation of our prototype to a group of five fire-wall configuration experts revealed not only the value thatthis tool provides to simplify common steps in their work,but also showed the need for further developments in thedomain of firewall visualization.
In general, we believe that our visualization is quite scal-able in the number of rules and object groups it can display.Only labeling became a major problem in our case, whichwas resolved through zooming features. Nevertheless, we re-
alized that there exist larger configuration files than the oneused in this work. Dealing with such files would require ad-ditional filtering criteria, an aspect that might be consideredin future work. Further aspects to be considered in futurework are taking into account the order of rule processing,rule testing, such as a generalized search for IP addresseswithin prefixes of rules and objects, and a temporal visual-ization for historic rule usage.
7. ACKNOWLEDGMENTSWe thank Andreas Merkel and Marcel Waldvogel from
the IT service center of the University of Konstanz for theircontinuous support during this project. Furthermore, we arevery grateful to Stephan Pietzko who shared many insightsinto this complex topic with us.
8. REFERENCES[1] R. Becker, S. Eick, and A. Wilks. Visualizing network
data. Visualization and Computer Graphics, IEEETransactions on, 1(1):16–28, 2002.
[2] E. Bertini, P. Hertzog, and D. Lalanne. SpiralView:towards security policies assessment through visualcorrelation of network resources with evolution ofalarms. In Visual Analytics Science and Technology,2007. VAST 2007. IEEE Symposium on, pages139–146. IEEE, 2007.
[3] B. Cheswick, H. Burch, and S. Branigan. Mappingand visualizing the internet. In Proc. USENIX AnnualTechnical Conference, pages 1–12. Citeseer, 2000.
[4] W. Cheswick, S. Bellovin, and A. Rubin. Firewallsand Internet security: repelling the wily hacker.Addison-Wesley Longman Publishing Co., Inc.Boston, MA, USA, 1st edition, 1994.
[5] CISCO. Cisco systems. object groups for acls,September 2010.http://www.cisco.com/en/US/docs/ios/sec data plane/configuration/guide/sec object group acl.html.
[6] C. Collins. Docuburst: Document contentvisualization using language structure. In Proceedingsof IEEE Symposium on Information Visualization,Poster Session. Baltimore. Citeseer, 2006.
[7] S. Foresti, J. Agutter, Y. Livnat, S. Moon, andR. Erbacher. Visual correlation of network alerts.IEEE Computer Graphics and Applications, pages48–59, 2006.
[8] J. Goodall, W. Lutters, P. Rheingans, andA. Komlodi. Preserving the big picture: Visualnetwork traffic analysis with tnv. In Visualization forComputer Security, 2005.(VizSEC 05). IEEEWorkshop on, pages 47–54. IEEE, 2005.
[9] J. Heer, S. Card, and J. Landay. Prefuse: a toolkit forinteractive information visualization. In Proceedings ofthe SIGCHI conference on Human factors incomputing systems, pages 421–430. ACM, 2005.
[10] D. A. Keim, F. Mansmann, J. Schneidewind, andT. Schreck. Monitoring network traffic with radialtraffic analyzer. In Proceedings of the IEEESymposium on Visual Analytics Science andTechnology (VAST ’06), 2006.
[11] D. A. Keim, J. Schneidewind, and M. Sips. Fp-viz:Visual frequent pattern mining. In Proceedings of
IEEE Symposium on Information Visualization(InfoVis ’05), Poster Paper, 2005.
[12] H. Koike and K. Ohno. SnortView: visualizationsystem of snort logs. In Proceedings of the 2004 ACMworkshop on Visualization and data mining forcomputer security, pages 143–147. ACM, 2004.
[13] C. Lee, J. Trost, N. Gibbs, R. Beyah, and J. Copeland.Visual firewall: real-time network security monitor. InVisualization for Computer Security, 2005.(VizSEC05). IEEE Workshop on, pages 129–136. IEEE, 2005.
[14] F. Mansmann, D. A. Keim, S. C. North, B. Rexroad,and D. Sheleheda. Visual Analysis of Network Trafficfor Resource Planning, Interactive Monitoring, andInterpretation of Security Threats. IEEE Transactionson Visualization and Computer Graphics, 13(6), 2007.
[15] J. McPherson, K. Ma, P. Krystosk, T. Bartoletti, andM. Christensen. Portvis: a tool for port-baseddetection of security events. In Proceedings of the 2004ACM workshop on Visualization and data mining forcomputer security, pages 73–81. ACM, 2004.
[16] S. Morrissey and G. Grinstein. Visualizing firewallconfigurations using created voids. In 6thInternational Workshop on Visualization for CyberSecurity (VizSec), 2009.
[17] H. Shiravi, A. Shiravi, and A. Ghorbani. A survey ofvisualization systems for network security.Visualization and Computer Graphics, IEEETransactions on, 99(RapidPosts), 2011.
[18] J. Stasko, R. Catrambone, M. Guzdial, andK. McDonald. An evaluation of space-fillinginformation visualizations for depicting hierarchicalstructures. International Journal of Human-ComputerStudies, 53(5):663–694, 2000.
[19] T. Tran, E. Al-Shaer, and R. Boutaba. PolicyVis:firewall security policy visualization and inspection. InProceedings of the 21st conference on LargeInstallation System Administration Conference, pages1–16. USENIX Association, 2007.
[20] P. Wong, P. Whitney, and J. Thomas. Visualizingassociation rules for text mining. In InfoVis, page 120.Published by the IEEE Computer Society, 1999.
[21] L. Xiao, J. Gerth, and P. Hanrahan. Enhancing visualanalysis of network traffic using a knowledgerepresentation. In Visual Analytics Science AndTechnology, 2006 IEEE Symposium On, pages107–114. IEEE, 2006.