Embed Size (px)
Citation preview

See discussions, stats, and author profiles for this publication at: https://www.researchgate.net/publication/251877242
Visual analysis in single case experimental design studies: Brief review and
guidelines
Article in Neuropsychological Rehabilitation · July 2013
DOI: 10.1080/09602011.2013.815636 · Source: PubMed
CITATIONS
68
READS
7,370
2 authors:
Some of the authors of this publication are also working on these related projects:
Life After Academia View project
Ledford and Gast (2018) Single Case Research Methodology textbook View project
Justin D. Lane
University of Kentucky
30 PUBLICATIONS 197 CITATIONS
SEE PROFILE
David L. Gast
University of Georgia
141 PUBLICATIONS 4,130 CITATIONS
SEE PROFILE
All content following this page was uploaded by David L. Gast on 28 May 2014.
The user has requested enhancement of the downloaded file.

This article was downloaded by: [Justin Lane]On: 25 July 2013, At: 07:20Publisher: RoutledgeInforma Ltd Registered in England and Wales Registered Number: 1072954Registered office: Mortimer House, 37-41 Mortimer Street, London W1T 3JH,UK
NeuropsychologicalRehabilitation: An InternationalJournalPublication details, including instructions for authorsand subscription information:http://www.tandfonline.com/loi/pnrh20
Visual analysis in single caseexperimental design studies:Brief review and guidelinesJustin D. Lane a & David L. Gast aa Department of Special Education , The University ofGeorgia , Athens , GA , USAPublished online: 24 Jul 2013.
To cite this article: Neuropsychological Rehabilitation (2013): Visual analysis in singlecase experimental design studies: Brief review and guidelines, NeuropsychologicalRehabilitation: An International Journal
To link to this article: http://dx.doi.org/10.1080/09602011.2013.815636
PLEASE SCROLL DOWN FOR ARTICLE
Taylor & Francis makes every effort to ensure the accuracy of all theinformation (the “Content”) contained in the publications on our platform.However, Taylor & Francis, our agents, and our licensors make norepresentations or warranties whatsoever as to the accuracy, completeness, orsuitability for any purpose of the Content. Any opinions and views expressedin this publication are the opinions and views of the authors, and are not theviews of or endorsed by Taylor & Francis. The accuracy of the Content shouldnot be relied upon and should be independently verified with primary sourcesof information. Taylor and Francis shall not be liable for any losses, actions,claims, proceedings, demands, costs, expenses, damages, and other liabilitieswhatsoever or howsoever caused arising directly or indirectly in connectionwith, in relation to or arising out of the use of the Content.

This article may be used for research, teaching, and private study purposes.Any substantial or systematic reproduction, redistribution, reselling, loan, sub-licensing, systematic supply, or distribution in any form to anyone is expresslyforbidden. Terms & Conditions of access and use can be found at http://www.tandfonline.com/page/terms-and-conditions
Dow
nloa
ded
by [J
ustin
Lan
e] a
t 07:
20 2
5 Ju
ly 2
013

Visual analysis in single case experimental design
studies: Brief review and guidelines
Justin D. Lane and David L. GastDepartment of Special Education, The University of Georgia, Athens, GA, USA
Visual analysis of graphic displays of data is a cornerstone of studies using a singlecase experimental design (SCED). Data are graphed for each participant during astudywith trend, level, and stability of data assessedwithin and between conditions.Reliable interpretations of effects of an intervention are dependent on researchers’understanding and use of systematic procedures. The purpose of this paper is toprovide readers with a rationale for visual analysis of data when using a SCED, astep-by-step guide for conducting a visual analysis of graphed data, as well as tohighlight considerations for persons interested in using visual analysis to evaluatean intervention, especially the importance of collecting reliability data for depen-dent measures and fidelity of implementation of study procedures.
Keywords: Single case experimental design; Visual analysis.
INTRODUCTION
Visual analysis of graphic displays of data is the hallmark for interpretingeffects of an intervention during studies using a single case experimentaldesign (SCED; Kennedy, 2005). The independent variable is typically anintervention designed to reduce aberrant behaviour or increase pro-social oracademic behaviours (Horner et al., 2005). The expectation is behavioursare graphed for each participant by session for all conditions of a study.SCED studies are based on baseline logic, meaning participants serve astheir own control for evaluating change (Gast & Hammond, 2010). Themost basic method for evaluating a behaviour-change programme is analysis
Correspondence should be addressed to Justin D. Lane, Department of Special Education,The University of Georgia, Athens, GA 30602, USA. E-mail:[email protected]
Neuropsychological Rehabilitation, 2013http://dx.doi.org/10.1080/09602011.2013.815636
# 2013 Taylor & Francis
Dow
nloa
ded
by [J
ustin
Lan
e] a
t 07:
20 2
5 Ju
ly 2
013

of two adjacent conditions, also known as an A-B comparison. Each conditionrepresents a set of specific variables under which a behaviour is measuredcontinuously during baseline, intervention, and any subsequent conditions,with the first condition known as baseline (A) and the second conditionknown as intervention (B) (Lane, Wolery, Reichow, & Rogers, 2007). Theexpectation is that data collected during baseline are stable and change in atherapeutic direction upon introduction of the independent variable, with atleast three replications of effect across behaviours, settings, or participants(Gast & Hammond, 2010; Kennedy, 2005; Lane et al., 2007). This is in con-trast to traditional group design methods, which use at least one experimentalgroup and one control group to compare effects of treatment through appli-cation of a statistical test (e.g., ANOVA) and a significance measure (e.g.,p , .05; Kazdin, 2011). Traditional group design methods provide an oppor-tunity for summative evaluation of effect for all participants. In contrast,SCED studies allow researchers to formatively evaluate a participant’s per-formance session to session through continuous collection of individualisedbehaviour data. Researchers can modify an intervention if limited or nochange in performance is observed throughout the study (Gast, 2010; Lieber-man, Yoder, Reichow, & Wolery, 2010; Wolery & Harris, 1982).
SCED researchers traditionally code responses for each participant in vivoor following completion of a session using video records (Ayres & Gast,2010). Each participant’s performance is then calculated and transferred toa graph for purposes of visually analysing (a) trend, (b) level, and (c) stability.Researchers select a format for graphic display which best represents thepurpose of the study based on the proposed hypotheses and research questions(Spriggs & Gast, 2010). There are various examples of graphic formats forpresenting data, which include (a) cumulative records, (b) semi-logarithmiccharts, (c) bar graphs, and (d) line graphs. Cumulative records are rooted inthe field of experimental analysis of behaviour and originated from workby B. F. Skinner (Cooper, Heron, & Heward, 2007; Kennedy, 2005). Whenusing a cumulative record, participants’ responses are recorded and addedacross sessions. It is not uncommon for novice readers to report an increasingtrend across sessions since responses are added session to session. Furtherinspection of a cumulative record may indicate minimal (e.g., addition ofone response from previous session) to no change (flat line from session tosession) in responding. Regardless of the magnitude of behaviour change,one of the benefits of a cumulative record is clear depiction of total responseswithin a study. Semi-logarithmic charts provide a format for presenting rela-tive change in performance and are typically used to present rate of respond-ing and proportional change in performance. In contrast to cumulative recordsand semi-logarithmic charts, bar graphs provide a simplified format for com-parisons of discrete data or presentation of summative performance followingcompletion of a study. Finally, line graphs are the most commonly used
2 LANE AND GAST
Dow
nloa
ded
by [J
ustin
Lan
e] a
t 07:
20 2
5 Ju
ly 2
013

graphic format for presenting ongoing data collected during a study using aSCED. Performance within a session is plotted as a single data point and con-nected to subsequent data points as the study progresses (Cooper et al., 2007;Kennedy, 2005; Spriggs & Gast, 2010). For purposes of this paper, examplesand information will focus on analysis of data using a line graph.
Researchers use A-B-C notation to differentiate conditions on a graphicdisplay. A major tenet of SCED is that all conditions remain constant withexception of the introduction of one variable in the intervention condition.Additional components of an intervention may be introduced within a con-dition, also known as a phase change, but it is still recommended that anyadditional variables be introduced systematically for purposes of controllingthreats to internal validity (Gast & Spriggs, 2010; Lane et al., 2007). If anymodifications are made in a condition the expectation is to denote this altera-tion with a phase change line and a prime symbol (e.g., B’ for one modifi-cation and B’’ for an additional modification and so on). Also, if anysubsequent conditions are introduced individual letters are added in alphabe-tical order to denote a novel independent variable. When two variables arecombined in a single condition, two letters are used to denote this combi-nation (e.g., BC to represent a combination of intervention B and C). Thiscontributes to the reader’s understanding of changes that occur during asingle study for each participant (Gast & Spriggs, 2010).
Cooper et al. (2007) highlight the impact of graphic displays by indicating“an intervention that produces dramatic, replicable changes in behaviour thatlast over time are readily seen in a well-designed graphic display” (p. 149).While a “well-designed graphic display” involves multiple factors, ongoinganalysis of data contributes to a better understanding of effects of interven-tions for researchers, as well as future readers. As stated above, visual analy-sis involves evaluation of (a) trend, (b) level, and (c) stability of data. Woleryand Harris (1982) define (a) trend, as “direction. . .the data pattern is progres-sing”, (b) level, as the “relative value of the data pattern on the dependentvariables”, and (c) stability, as similarity “of scores in a given experimentalcondition” (pp. 446–447). Gast (2005) elaborates on these definitions bydefining (a) trend, as “progress over time”, (b) level, as “magnitude of thedata”, and (c) stability, as “variability or ‘bounce’ of the data” (pp. 1596–1597). Together, these three components provide the foundation for visualanalysis of behaviours within and between conditions.
Within-condition analysis refers to evaluation of data patterns within asingle condition during a study (Gast & Spriggs, 2010; Kennedy, 2005;Wolery & Harris, 1982). Beginning with baseline, researchers look for stab-ility of data prior to implementation of an intervention, with data collectedacross a minimum of at least three to five sessions prior to introduction ofan intervention (Horner et al., 2005). If variability is observed within a con-dition, the recommendation is to extend that condition until data are stable.
VISUAL ANALYSIS OF GRAPHED DATA IN SCED 3
Dow
nloa
ded
by [J
ustin
Lan
e] a
t 07:
20 2
5 Ju
ly 2
013

This also applies to behaviours changing in a therapeutic direction duringbaseline. In this instance, researchers also attend to the trend direction ofthe data. Participants may improve during a baseline condition due to matu-ration, response to specific environmental variables, or other factors outsideof the study. Regardless of cause of change in a therapeutic direction, aresearcher would be advised to wait until a clear pattern or stability isobserved (Kennedy, 2005; Wolery & Harris, 1982). One method for evaluat-ing trend direction is the split-middle method of trend estimation, which is amulti-step process and, as the name states, estimates trend direction withineach condition based on calculations of median values (Wolery & Harris,1982). The split-middle method provides researchers with a systematicprocess for estimating trend direction, but is less common in the literaturewhen compared to other evaluation methods (Gast & Spriggs, 2010; White,1972). Within-condition analysis begins during the first condition of thestudy and continues for the duration of the study, which is followed bybetween-conditions analysis of data as new conditions are introduced.
Between-conditions analysis of data refers to comparisons across adjacentconditions during a study (Gast & Spriggs, 2010; Kennedy, 2005; Wolery &Harris, 1982). A SCED researcher would look for an immediate and abruptchange in level and trend upon introduction of the independent variable.With consideration of trend and level, trend is considered more importantfor researchers conducting visual analysis of data (Gast & Spriggs, 2010).The researcher would also attend to variability in the data with considerationof overlap of data points across conditions. In the “how to” portion of thispaper, specific methods for comparing adjacent conditions are provided. Con-sider the following example in the context of an A-B design: A participantenrolled in a study evaluating an intervention to increase percent responsivityto static presentation of various facial expressions by adults may display lowand stable levels of attention (zero-celerating trend) during baseline and, uponintroduction of the intervention, attending behaviours increase from 7% (finaldata point in baseline) to 15% (first intervention session). While there was animmediate level change in attention, the goal of the study was to increaseattention over time. During subsequent sessions attending behavioursincrease and stabilise at 55% across three consecutive sessions. Thispattern in the data indicates an increasing trend in a therapeutic direction,as well as increase in level and stability of data. A replication of this effectacross at least three participants within a study would provide the researcherdata to support the likelihood of a functional relation between attending beha-viours and the intervention for increasing attending behaviours for personswho display similar pre-treatment behaviours (Gast & Spriggs, 2010;Kennedy, 2005; Reichow, Volkmar, & Cicchetti, 2008).
With consideration of identifying a functional relation, measures of gener-ality in SCED studies are evaluated through replication of effect with a single
4 LANE AND GAST
Dow
nloa
ded
by [J
ustin
Lan
e] a
t 07:
20 2
5 Ju
ly 2
013

participant (intra-subject replication) and/or across participants (inter-subjectreplication) within a study and across studies (Kennedy, 2005). To assistresearchers who want to replicate a study, detailed descriptions of proceduresand participants’ pre-treatment behaviours as they relate to the study arecrucial (Horner et al., 2005; Lane et al., 2007; Reichow et al., 2008). Whilethese general rules provide guidelines for researchers using a SCED design,attention to patterns of data and decisions based on within and between con-dition analyses should be the driving force behind a well-designed study(Horner et al., 2005; Odom et al., 2005). The remainder of this paper willprovide details for visually analysing graphed data, followed by a discussionof strengths and challenges of visual analysis of SCED studies, as well as con-siderations and recommendations for researchers.
HOW TO VISUALLY ANALYSE DATA
The purpose of this section is to apply basic principles of visual analysis usingthe above hypothetical scenario (i.e., intervention to increase percent respon-sivity to static presentation of various facial expressions by adults). Gast andSpriggs (2010) provide a detailed description for visual analysis of grapheddata using a SCED, which is the basis for the “how to” section of thispaper. Each step is numbered and designed as an assistive tool for noviceresearchers who will visually analyse data when using a SCED. Steps arebased on graphic display (see Figure 1 for hypothetical data for purposes ofexemplifying visual analysis) and divided into (a) within-condition and (b)between-conditions analysis of data (see Figure 2). Figures 3–9 providedetailed guidelines for conducting each step of the visual analysis process.
Figure 1. Graphic display using hypothetical data.
VISUAL ANALYSIS OF GRAPHED DATA IN SCED 5
Dow
nloa
ded
by [J
ustin
Lan
e] a
t 07:
20 2
5 Ju
ly 2
013

Within-condition analysis
Step 1 is assigning a letter to each condition (i.e., A-B-C notation) and Step 2is counting the number of sessions for each condition.
Step 3 is calculating the mean, median, range, and stability envelope ofdata for each condition.
Step 4a is calculating level change within each condition and 4b is calcu-lating the difference between the first and last value within each condition.
Step 5 is calculating trend using the split-middlemethod of trend estimation.Step 6 is calculating percent of data points within the stability envelope for
each condition and Step 7 is using the “freehand method” to evaluate datapaths.
Between-condition analysis
Step 1 is determining the number of variables that changed between con-ditions. It should be noted that the ideal is only one change across conditions.Step 2 is identifying trend direction across adjacent conditions as accelerat-ing, decelerating, or zero-celerating in a therapeutic or contra-therapeutic
Figure 2. Steps of visual analysis.
Figure 3. Within-condition analysis: Steps 1 and 2.
6 LANE AND GAST
Dow
nloa
ded
by [J
ustin
Lan
e] a
t 07:
20 2
5 Ju
ly 2
013

direction. Step 3 is comparing the decision from Step 6 of from thewithin-condition analysis section to Step 2 of the between-condition analysissection.
Steps 4a–d are evaluating (a) relative, (b) absolute, (c) median, and(d) mean level change.
Steps 5a–b are calculating percent of non-overlapping data (PND) andpercent of overlapping data (POD; Scruggs, Mastropieri, & Casto, 1987).
Summary of sample visual analysis
Within-condition analysis. Evaluation of each condition indicated datawere variable during baseline and intervention (Step 3). Evaluation of level
Figure 4. Within-condition analysis: Step 3.
VISUAL ANALYSIS OF GRAPHED DATA IN SCED 7
Dow
nloa
ded
by [J
ustin
Lan
e] a
t 07:
20 2
5 Ju
ly 2
013
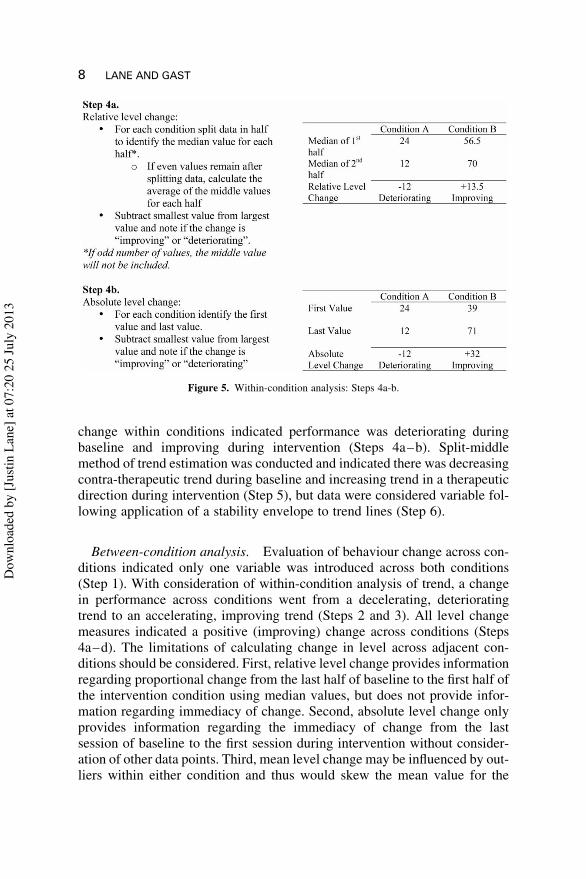
change within conditions indicated performance was deteriorating duringbaseline and improving during intervention (Steps 4a–b). Split-middlemethod of trend estimation was conducted and indicated there was decreasingcontra-therapeutic trend during baseline and increasing trend in a therapeuticdirection during intervention (Step 5), but data were considered variable fol-lowing application of a stability envelope to trend lines (Step 6).
Between-condition analysis. Evaluation of behaviour change across con-ditions indicated only one variable was introduced across both conditions(Step 1). With consideration of within-condition analysis of trend, a changein performance across conditions went from a decelerating, deterioratingtrend to an accelerating, improving trend (Steps 2 and 3). All level changemeasures indicated a positive (improving) change across conditions (Steps4a–d). The limitations of calculating change in level across adjacent con-ditions should be considered. First, relative level change provides informationregarding proportional change from the last half of baseline to the first half ofthe intervention condition using median values, but does not provide infor-mation regarding immediacy of change. Second, absolute level change onlyprovides information regarding the immediacy of change from the lastsession of baseline to the first session during intervention without consider-ation of other data points. Third, mean level change may be influenced by out-liers within either condition and thus would skew the mean value for the
Figure 5. Within-condition analysis: Steps 4a-b.
8 LANE AND GAST
Dow
nloa
ded
by [J
ustin
Lan
e] a
t 07:
20 2
5 Ju
ly 2
013

corresponding condition. Finally, due to the limitations of calculating themean value for each condition, calculating the median level change is rec-ommended since median values are less likely to be influenced by outliersin the data. Based on this information, it is the recommendation of the
Figure 6. Within-condition analysis: Step 5.
VISUAL ANALYSIS OF GRAPHED DATA IN SCED 9
Dow
nloa
ded
by [J
ustin
Lan
e] a
t 07:
20 2
5 Ju
ly 2
013

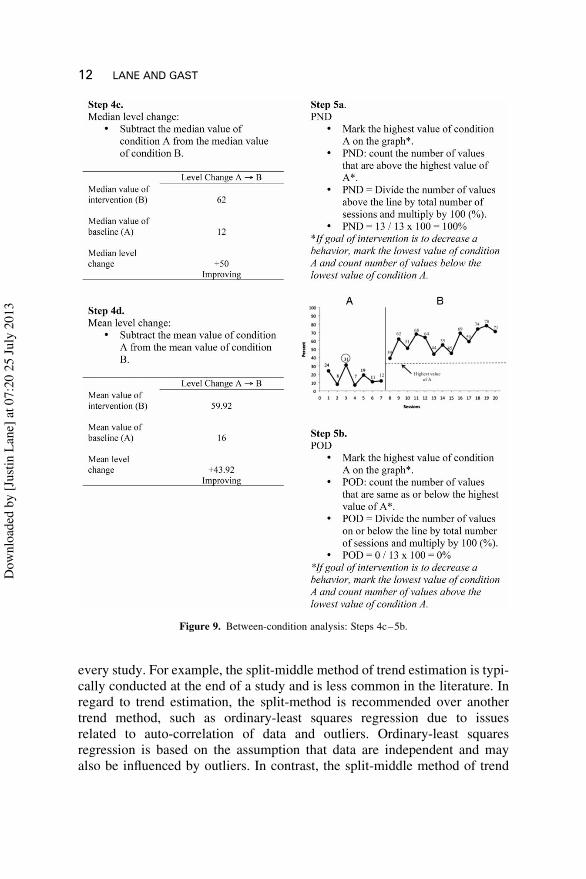
authors that none of these methods be used in isolation since there are poten-tial limitations across all. Finally, calculations of PND and POD indicatedthere were 100% non-overlap and 0% overlap of behaviours observedduring baseline and intervention (Step 5). If the results were replicatedacross participants, behaviours, or settings, investigators could report obser-vation of a functional relation (Gast & Spriggs, 2010; Kennedy, 2005;Reichow et al., 2008).
DISCUSSION
Considerations of visual analysis of SCED studies
Visual analysis of graphic displays of data collected during SCED studies is atradition in fields interested in ongoing evaluation of behaviour-change pro-grammes for individuals or groups of individuals (Wolery & Harris, 1982).This individualised approach to evaluation of behaviours allows opportunityto systematically adapt or modify a programme based on characteristicsobserved during sessions (Gast, 2005). As with any approach to evaluationof data, limitations and recommendations which maximise understanding ofresults must be addressed. First, researchers using a SCED should evaluatedata using multiple methods to better understand and improve confidencein findings (Gast, 2005). For example, PND provides a metric for measuring
Figure 7. Within-condition analysis: Steps 6 and 7.
10 LANE AND GAST
Dow
nloa
ded
by [J
ustin
Lan
e] a
t 07:
20 2
5 Ju
ly 2
013

improvement in target behaviours when compared to performance duringbaseline condition. The general idea of PND is higher percentages constitutea larger magnitude of change in a therapeutic direction, but PND is notwithout limitations. A participant may display change in a therapeutic direc-tion during baseline, and upon introduction of an intervention this changecontinues. Using PND as the only metric would incorrectly identify achange in a therapeutic direction when in reality improvement across con-ditions was not influenced by the introduction of an intervention (Gast &Spriggs, 2010). For this reason, researchers should use multiple measuresof evaluation, recognising the limitations of single approaches for interpret-ation. Second, each step listed in the “how to” section is not necessary for
Figure 8. Between-condition analysis: Steps 1–4b.
VISUAL ANALYSIS OF GRAPHED DATA IN SCED 11
Dow
nloa
ded
by [J
ustin
Lan
e] a
t 07:
20 2
5 Ju
ly 2
013
every study. For example, the split-middle method of trend estimation is typi-cally conducted at the end of a study and is less common in the literature. Inregard to trend estimation, the split-method is recommended over anothertrend method, such as ordinary-least squares regression due to issuesrelated to auto-correlation of data and outliers. Ordinary-least squaresregression is based on the assumption that data are independent and mayalso be influenced by outliers. In contrast, the split-middle method of trend
Figure 9. Between-condition analysis: Steps 4c–5b.
12 LANE AND GAST
Dow
nloa
ded
by [J
ustin
Lan
e] a
t 07:
20 2
5 Ju
ly 2
013

estimation does not require independence of data and relies on median values,which are less sensitive to outliers than mean values (Good & Shinn, 1990).Measures included in the visual analysis process should be included for pur-poses of strengthening an unbiased interpretation of effects of an intervention(Gast & Spriggs, 2010).
A third consideration when using visual analysis with SCED data is theunderstanding all possible threats to the internal validity of a study. Internalvalidity refers to control and recognition of confounds during a study thatcould possibly provide an “alternative explanation of findings” (Gast, 2010,p. 4). Some of these threats have been addressed or will be addressed inmore detail, but are listed here for readers consideration: (a) history, (b) matu-ration, (c) testing, (d) instrumentation (or reliability of measurement of thedependent variable), (e) fidelity of implementation, (f) attrition, (g) multi-treatment interference, (h) variability or instability in data, (i) adaptation,and (j) the Hawthorne effect (Cooper et al., 2007; Gast, 2010; Kennedy,2005). Finally, researchers should recognise and adhere to quality indicatorswhen conducting SCED studies. Horner et al. (2005) and Kratochwill et al.(2010) provide guidelines for researchers conducting SCED studies. It is rec-ommended that guidelines by Horner et al. (2005) and Kratochwill et al.(2010) be reviewed prior to conducting a SCED study. Some of the keyissues to consider are as follows: (a) report fidelity of implementation andreliability of measurement of the dependent variable, (b) with the goal of atleast 80% agreement or higher. In addition, (c) collect a minimum of threeto five data points for each condition, and (d) demonstrate at least three repli-cations of effect before reporting a functional relation.
Reliability of findings and fidelity of implementation
Confidence in results is mediated by reliability of measurement of the depen-dent variable and fidelity of implementation of procedures during pre-inter-vention and intervention conditions, as well as any subsequent orintermediate conditions (e.g., maintenance, generalisation probe) that mayoccur during the study (Kennedy, 2005; Wolery, 2011). While there is nota rule regarding number or percent of sessions during which reliability andfidelity data should be collected, the general expectation and recommendationis at least 20% of conditions for each participant by at least one independentobserver (i.e., person who is not implementing the intervention; Kazdin,2011; Kennedy, 2005). The general idea regarding collection of reliabilityand fidelity data is “more is better”. Baer, Wolf, and Risley (1968) emphasisethe importance of detailed behavioural definitions and technological descrip-tions of behaviour-change programmes. In their seminal work on applied be-haviour analysis (ABA), Baer et al. (1968) indicate well-written proceduresare written as such a “[novice] reader could replicate. . .procedure[s] well
VISUAL ANALYSIS OF GRAPHED DATA IN SCED 13
Dow
nloa
ded
by [J
ustin
Lan
e] a
t 07:
20 2
5 Ju
ly 2
013

enough to produce the same results” (p. 95). They continue, “explicitmeasurement of the reliability of human observers. . .becomes not merelygood technique, but a prime criterion of whether the study was appropriatelybehavioural” (p. 93).
Lack of agreement regarding measurement of the dependent variablenegates the results of visual analysis since disagreements exist about occur-rence and/or non-occurrence of the target behaviour (Gast, 2005). Forexample, a researcher interested in decreasing perseverative speech of an ado-lescent with traumatic brain injury implements an intervention acrossenvironments (i.e., home, school, vocational training site), replicatingeffects of decreasing the target behaviour to a rate of 1 occurrence per two-hour observation for the final five intervention sessions. Another researchercollects data 20% of sessions across the study across environments andagrees with primary researchers’ observations of the target behaviour onthe average of 12% (e.g., both observers agreed that the behaviour occurredor did not occur only 12/100 times). This lack of agreement reduces the like-lihood of replication since it is unclear what, if any, behaviour changed duringthe study. This uncertainty lessens trust that a proposed intervention is anappropriate choice for persons with similar pre-intervention behaviours.
Human error is expected during observation, and while exact agreement isideal, it is not a “rule” that observers agree 100% across all observations. Itshould be stressed that researchers strive for agreement between 80 and100%. While an arbitrary figure, agreement below 80% is considered a“red flag” when interpreting results of a study (Kennedy, 2005). Multiplefactors may be responsible for low-levels of agreement and require consider-ation during design and implementation of a study. Prior to beginning a study,(a) detailed descriptions of target behaviours should be provided to all personswho will collect data and (b) training should occur until agreement is con-sidered acceptable for purposes of the study. Complexity of behaviouraldescriptions may require researchers to further examine the purpose of thestudy and potentially create multiple target behaviours or remove unnecessarycomponents of a behaviour-change programme. If, at any point during thestudy, there is low-level agreement between observers the study shouldcease until issues are identified and addressed (Ayres & Gast, 2010). Tra-ditionally, agreement is reported as a percentage (and range) across a studyby participants or across all participants (Artman, Wolery, & Yoder, 2012).In an effort to address limitations of reporting agreement data as a summativemeasure, some researchers advocate for graphing these data as a means forvisually analysing agreement (or disagreement) between independent obser-vers (Ledford & Wolery [in press]; Ledford, Wolery, Meeker, & Wehby,2012).
Fidelity of implementation of procedures across conditions is another keyfactor to consider when interpreting results of a study. In a commentary on the
14 LANE AND GAST
Dow
nloa
ded
by [J
ustin
Lan
e] a
t 07:
20 2
5 Ju
ly 2
013

importance of fidelity of measurement, Wolery (2011) describes the “essenceof experimental work” as confidence that a behaviour-change programme wasresponsible for prosocial “shifts” in socially valued behaviours for purposesof improving experiences of participants’ across their lifespan (p. 156).Adherence to specific procedural descriptions, in conjunction with data tosupport appropriate implementation of procedures, gives credence tointerpretations of data using visual analysis and allows readers an opportunityto replicate these effects with participants with similar pre-treatment beha-viours. It is the responsibility of researchers to report fidelity of implemen-tation of each step of a behaviour-change programme by condition (Gast,2010). This is especially important for researchers and practitioners attempt-ing to replicate effects of an intervention. For example, a researcher attemptsto replicate an intervention designed to improve recall for persons withdementia. In their report they indicate inability to replicate the magnitudeof effect of a previous study, but only report percent and range of correctimplementation collapsed across all steps. In this example, it is unknown ifa step or multiple steps were excluded, thus impacting the magnitude of thebehaviour-change programme. Even if the purpose of a study is evaluationof necessity of steps (i.e., addition or omission of steps) in a behaviour-change programme, researchers are urged to report adherence to proceduresas written across each proposed component of an intervention. As withreliability of measurement of the dependent variable, detailed descriptionsof procedures should be provided to all persons who will implement astudy and collect data (Wolery, 1994). Specific criteria (e.g., 100% correctimplementation of procedures across three consecutive opportunities)should be used as a guideline for mastery of procedures before beginning astudy, and evaluated during a study (Ayres & Gast, 2010).
Statistics and SCED
Application of statistical methods to SCED data has received increased atten-tion in the literature, especially as it relates to calculation of an effect size forinterventions (Wolery, Busick, Reichow, & Barton, 2008). Campbell andHerzinger (2010) propose considerations regarding statistical analysis andSCED studies in that statistical tests may (a) add to the confidence ofresults of visual analysis of data, (b) “quantify strengths of outcomes”, and(c) increase objectivity of analysis (pp. 421–422). The first author conductedan informal search of on-line databases (i.e., ERIC, PsycInfo, EducationResearch Complete, and Medline) for articles on visual analysis (i.e., key-words were visual analysis, special education, psychology, education,single subject research, single subject research design, single case, singlecase experimental design, single subject, single subject experimentaldesign, in peer reviewed journals) and found 42 articles related to visual
VISUAL ANALYSIS OF GRAPHED DATA IN SCED 15
Dow
nloa
ded
by [J
ustin
Lan
e] a
t 07:
20 2
5 Ju
ly 2
013

analysis and SCED. Of the 42 articles, 22 related to application of statisticalmethods to data from SCED studies with emphasis on calculations of effectsize. The purpose of this informal search was to highlight the relativelylarge number of articles on various methods for calculating effect size, aswell as to highlight that an optimal method for calculating effect size is notcurrently available, which corresponds with Campbell and Herzinger(2010) report that “little consensus exists regarding the appropriate calcu-lation of effect sizes for single case designs” (p. 440). Campbell (2004) high-lights the issues of application of statistical methods to SCED, specifically,observations are “usually not independent” (i.e., auto-correlated) and trendof data may “confound” results of effect size calculations (p. 235). Analysisof SCED data using statistical methods is a controversial topic that currentlylacks a clear answer for researchers, but efforts are ongoing to identify appro-priate procedures that summarise effects of multiple articles (Campbell, 2004;Wolery et al., 2008).
Conclusion
As highlighted by Cooper et al. (2007), visual analysis of SCED data answerstwo questions: “(1) Did behaviour change in a meaningful way, and (2) if so,to what extent can that change in behaviour be attributed to the independentvariable” (p. 149). Baer et al. (1968) emphasise the importance and meaningof “applied” research when designing behaviour-change programmes in thatan intervention should attempt to change behaviours which benefit individualparticipants. The primary goal of visual analysis is to identify if a functionalrelation exists between the introduction of an intervention and change in asocially desirable behaviour, as well as replicate effects across multiple par-ticipants. Visual analysis is sensitive to changes in behaviour and allowsresearchers to analyse each participant’s behaviour through repeatedmeasurement and evaluation, allowing observation of abrupt, as well assubtle changes over time. Challenges of visual analysis should also be con-sidered when conducting a study. First, as seen through multiple attemptsto apply statistical methods to SCED data, it can be difficult to summarisethe effects of interventions across participants since various behaviours aremeasured, and individual modifications to an intervention may be madeduring a study. A second consideration is generality of findings to participantsoutside of studies. The issue of generality relies on researchers providingdetailed descriptions of participant’s pre-intervention behaviours to increasethe likelihood of understanding for whom and under what conditions inter-ventions may be effective. Third, researchers should evaluate agreement forresults of visual analysis conducted by independent observers. Previousstudies have found agreement can vary across persons for various reasons(Ottenbacher, 1993), but adherence to detailed procedures, as presented in
16 LANE AND GAST
Dow
nloa
ded
by [J
ustin
Lan
e] a
t 07:
20 2
5 Ju
ly 2
013

this article, and familiarity of methods for increasing agreement (e.g., train-ing) address possible variability that may arise during visual analysis of iden-tical graphs across persons (Ledford et al., 2012). Finally, researchers using acomparison design (e.g., alternating treatments design) should be aware ofspecific considerations for conducting visual analysis of graphs. For moredetail on comparison designs and visual analysis review Wolery, Gast, andHammond (2010).
The purpose of this paper is to introduce readers to visual analysis ofgraphic displays of data collected during SCED studies. Visual analysisinvolves evaluation of performance within and across conditions using sys-tematic procedures. Training using the above procedures should occur withmultiple graphical displays prior to conducting visual analysis of data for pub-lication. Agreement data should also be collected across persons training touse visual analysis. The guidelines and considerations presented shouldassist researchers in objectively evaluating behaviour-change programmesfor individual participants or groups of participants across settings, beha-viours, and participants. Confidence in findings is furthered by replicationof effect using detailed procedures and understanding of results in regard toagreement of occurrence and non-occurrence of behaviours, as well as under-standing implementation of procedures as designed. Visual analysis of datawithin a SCED framework offers researchers alternatives to understandingeffect of behaviour-change programmes outside of special education andrelated fields.
REFERENCES
Artman, K., Wolery, M., & Yoder, P. (2012). Embracing our visual inspection and analysis tra-dition: Graphing interobserver agreement data. Remedial and Special Education, 33, 71–77.
Ayres, K., & Gast, D. L. (2010). Dependent measures and measurement procedures. In D. L.Gast (Ed.), Single subject research methodology in behavioral sciences (pp. 129–165).New York, NY: Routledge.
Baer, D. M., Wolf, M. M., & Risley, T. R. (1968). Some current dimensions of applied behavioranalysis. Journal of Applied Behavior Analysis, 1, 91–97.
Campbell, J. M. (2004). Statistical comparison of four effect sizes for single-subject designs.Behavior Modification, 28, 234–246.
Campbell, J. M., & Herzinger, C. V. (2010). Statistics and single subject research methodology.In D. L. Gast (Ed.), Single subject research methodology in behavioral sciences(pp. 91–109). New York, NY: Routledge.
Cooper, J. O., Heron, T. E., & Heward, W. L. (2007). Applied behavior analysis (2nd ed.).Columbus, OH: Pearson.
Gast, D. L. (2005). Visual analysis of graphic data. In G. Sugai & R. Horner (Eds.), Encyclo-pedia of behavior modification and cognitive behavior therapy: Educational applications(Vol. 3, pp. 1595–1599). Thousand Oaks, CA: Sage.
Gast, D. L. (Ed.). (2010). General factors in measurement and evaluation. Single subjectresearch methodology in behavioral sciences (pp. 91–109). New York, NY: Routledge.
VISUAL ANALYSIS OF GRAPHED DATA IN SCED 17
Dow
nloa
ded
by [J
ustin
Lan
e] a
t 07:
20 2
5 Ju
ly 2
013

Gast, D. L., & Hammond, D. (2010). Withdrawal and reversal designs. In D. L. Gast (Ed.),Single subject research methodology in behavioral sciences (pp. 234–275). New York,NY: Routledge.
Gast, D. L., & Spriggs, A. D. (2010). Visual analysis of graphic data. In D. L. Gast (Ed.), Singlesubject research methodology in behavioral sciences (pp. 199–233). New York, NY:Routledge.
Good, R. H., & Shinn, M. R. (1990). Forecasting accuracy of slope estimates for reading curri-culum-based measurement: Empirical evidence. Behavioral Assessment, 12, 179–193.
Horner, R. H., Carr, E. G., Halle, J., McGee, G., Odom, S., & Wolery, M. (2005). The use ofsingle-subject research to identify evidence-based practice in special education. ExceptionalChildren, 71, 165–179.
Kazdin, A. E. (2011). Single-case research designs: Methods for clinical and applied settings(2nd ed.). New York, NY: Oxford University Press.
Kennedy, C. H. (2005). Single-case designs for educational research. Boston, MA: Allyn &Bacon.
Kratochwill, T. R., Hitchcock, J., Horner, R. H., Levin, J. R., Odom, S. L., Rindskopf, D. M., &Shadish, W. R. (2010). Single-case designs. Technical documentation. Retrieved fromWhatWorks Clearinghouse website: http://ies.ed.gov/ncee/wwc/pdf/wwc_scd.pdf
Lane, K., Wolery, M., Reichow, B., & Rogers, L. (2007). Describing baseline conditions: Sug-gestions for study reports. Journal of Behavioral Education, 16, 224–234.
Ledford, J. R., &Wolery, M. (in press). Effects of plotting a second observer’s data on A-B-A-Bgraphs when observer disagreement is present. Journal of Behavioral Education.
Ledford, J. R., Wolery, M., Meeker, K. A., & Wehby, J. H. (2012). The effects of graphing asecond observer’s data on judgments of functional relations in A-B-A-B graphs. Journalof Behavioral Education, 21, 350–364.
Lieberman, R. G., Yoder, P. J., Reichow, B., & Wolery, M. (2010). Visual analysis of multiplebaseline across participants’ graphs when change is delayed. School Psychology Quarterly,25, 28–44.
Odom, S. L., Brantlinger, E., Gersten, R., Horner, R. H., Thompson, B., & Harris, K. R. (2005).Research in special education: Scientific methods and evidence-based practices. ExceptionalChildren, 71, 137–148.
Ottenbacher, K. J. (1993). Interrater agreement of visual analysis in single-subject decisions:Quantitative review and analysis. American Journal of Mental Retardation, 98, 135–142.
Reichow, B., Volkmar, F. R., & Cicchetti, D. V. (2008). Development of the evaluative methodfor evaluating and determining evidence-based practices in autism. Journal of Autism andDevelopmental Disorders, 38, 1311–1319.
Scruggs, T. E., Mastropieri, M. A., & Casto, G. (1987). The quantitative synthesis of single-subject research: Methodology and validation. Remedial and Special Education, 8, 24–33.
Spriggs, A. D., & Gast, D. L. (2010). Visual representation of data. In D. L. Gast (Ed.), Singlesubject research methodology in behavioral sciences (pp. 166–198). New York, NY:Routledge.
White, O. R. (1972). The split-middle: A quickie method of trend analysis. Eugene, OR:Regional Center for Handicapped Children.
Wolery, M. (1994). Procedural fidelity: A reminder of its functions. Journal of Behavioral Edu-cation, 4, 381–386.
Wolery, M. (2011). Intervention research: The importance of fidelity measurement. Topics inEarly Childhood Special Education, 31, 155–157.
Wolery, M., Busick, M., Reichow, B., & Barton, E. E. (2008). Comparison of overlap methodsfor quantitatively synthesizing single-subject data. Journal of Special Education, 44, 18–28.
18 LANE AND GAST
Dow
nloa
ded
by [J
ustin
Lan
e] a
t 07:
20 2
5 Ju
ly 2
013

Wolery, M., Gast, D. L., & Hammond, D. (2010). Comparative intervention designs. In D. L.Gast (Ed.), Single subject research methodology in behavioral sciences (pp. 329–381).New York, NY: Routledge.
Wolery, M., & Harris, S. R. (1982). Interpreting results of single-subject research designs. Phys-ical Therapy, 62, 445–452.
Manuscript received May 2013Revised manuscript received June 2013
First published online July 2013
VISUAL ANALYSIS OF GRAPHED DATA IN SCED 19
Dow
nloa
ded
by [J
ustin
Lan
e] a
t 07:
20 2
5 Ju
ly 2
013
View publication statsView publication stats