Embed Size (px)
Citation preview
Ambit Capital and / or its affiliates do and seek to do business including investment banking with companies covered in its research reports. As a result, investors should be aware that Ambit Capital may have a conflict of interest that could affect the objectivity of this report. Investors should not consider this report as the only factor in making their investment decision.
Building strength tile by tile Premiumisation and a shift to branded/organised players are the key structural trends unfolding in the rapidly growing Indian tiles industry. Somany is building scale (doubled capacities in the last three years and adding 30% more over FY14-16), improvising its product mix (more vitrified) and fortifying its brand to participate effectually in this fast-growing industry. After 14% EBITDA CAGR and 25% PAT CAGR in FY09-14, consensus expects an attainable 24% EBITDA CAGR and 44% PAT CAGR in FY14-16, implying 9.0x FY16 EBITDA and 16.0x FY16 EPS, a material premium to its five-year average. We believe the multiples can re-rate further, as the tiles industry and Somany/Kajaria undergo a discernible shift, similar to the paints industry in the late 90s.
Competitive position: STRONG Changes to this position: POSITIVE
Fast-growing Indian tiles industry undergoing structural changes Rising urbanisation, increasing tile penetration in urban/rural areas (from 26%/3% currently) and rising income in tier-II/III/IV cities will support the fast-growing Indian tiles industry (`200bn; 15% CAGR in FY09-14). Three structural changes will unfold: (a) rising brand preference and premiumisation, (b) shrinking market share of unorganised players, and (c) decline in imports.
Somany – fortifying the product portfolio and brand Somany, the third-largest tiles player in India with a market share of 12%/6% in the organised/total market, has one of the strongest ceramic tile brands in India. Whilst it was a late entrant in the high-value polished/glazed vitrified tiles (PVT/GVT) segment, the company has gained prominence in this segment in the last 3-4 years. Investment in brand and several product launches have increased PVT/GVT revenue share to 44% in FY14 (vs 15% in FY10). The management is further investing in fortifying its brand and presence in the premium tile category.
And building scale to sustain the growth momentum Somany doubled capacities (through JVs) over FY11-14 (to 35msm from 19msm in FY11). It is adding a further 10msm in FY15 (`600mn capex). After posting 14% CAGR in volumes and EBITDA in FY09-14, the management expects the volume and EBITDA momentum to pick up after a weak FY14 given larger capacities, weaker unorganised competition, improving product mix and cost efficiencies. Alongside, lower debt servicing and RoCE expansion will deliver larger cash flows (FY09-14 cumulative CFO/FCF of `3bn/1bn).
Tiles akin to paints; Kajaria/Somany can be predominant leaders Somany is trading at 16.0x FY16 consensus EPS (`15), a 25% discount to Kajaria. The management is displaying efficient capital deployment alongside an improvised product mix. Further re-rating is possible, as the tiles industry develops and Kajaria/Somany expand leadership (first brands and then volumes). A similar trend was seen in the related paints industry, wherein Asian Paints and Berger controlled most of the industry growth over the past two decades.
Somany Ceramics NOT RATED
VISIT NOTE SOMC IN EQUITY June 02, 2014
Key financials
Year to March FY10 FY11 FY12 FY13 FY14
Net Revenues (` mn) 5,423 7,199 8,790 10,539 12,629 Operating Profits (` mn) 558 677 741 857 814 Net Profits (` mn) 208 243 254 321 289 Diluted EPS (`) 6 7 7 9 7 RoE (%) 28.2 26 22.1 23 15.2 P/E (x) 39 33.4 31.9 25.3 31.6 P/B (x) 9.8 7.8 6.4 5.3 4.0
Source: Company, Ambit Capital research
Building materials
Recommendation Mcap (bn): `9/US$0.2 6M ADV (mn): `9/US$0.1 CMP: ` 230
Flags Accounting: GREEN Predictability: GREEN Earnings Momentum: GREEN
Catalyst
Market share gains with rising JV capacities
Rising premiumisation, shrinking imports/unorganised share
Improving margins with realisation growth and cost optimisation
Performance
Source: Bloomberg, Ambit Capital research
Analyst Details
Achint Bhagat Tel: +91 22 3043 3178 achintbhagat @ambitcapital.com
Nitin Bhasin Tel: +91 22 3043 3241 [email protected]
50
90
130
170
210
250
17,000
19,000
21,000
23,000
25,000
Apr
-13
Jun-
13
Au
g-1
3
Oct
-13
Dec
-13
Feb-
14
Sensex SOMC (RHS)
Somany Ceramics
June 02, 2014 Ambit Capital Pvt. Ltd. Page 2
Somany – stepping up the ladder Somany is the second-largest floor and wall tiles manufacturer in India. The Indian tiles industry, with a market size of ~`200bn, has been expanding by 14% CAGR over the past five years. Kajaria has a market share of 11%/6% in the organised/overall market despite a capacity share of 5%. Somany has been aggressively increasing capacities (mainly through JVs to support future market share gains), investing in brand building, and increasing dealer reach in tier II/III and smaller cities. The company’s capacity has increased to 35mn sq metres (msm) in FY14 from 22msm in FY12 and is likely to increase to 46msm by FY16; most of the capacity expansion is in the high-value vitrified segment. The company’s vitrified sales mix has increased to 44% in FY14 from 17% in FY10. It has an extensive dealer reach of ~1,700 dealers across India (adding a further 75 dealers in FY15). About 65% of its sales are in the retail segment and 75% of its sales are in tier-II/III cities.
Exhibit 1: Segment-wise description
Segment Description % of
sales Capacity
(msm) Number of
plants
Ceramic glazed tiles (CGT)
Principally used for decorative and sanitary effects on walls; mostly used for wall coverings of kitchens and washrooms
56% 21.3 3
Polished vitrified tiles (PVT)
Polished vitrified tiles have low porosity and hence are stronger and offer better water absorption; they are usually used for all flooring types
29% 9.2 3
Glazed vitrified tiles (GVT)
A premium segment of tiles which offers better strength and aesthetics; they are costly due to the digital printing
15% 4.1 1
Source: Company, Ambit Capital research; Note: The company has seven plants and some of the plants produce multiple types of tiles
Exhibit 2: Profile of Somany’s JVs (all financial numbers pertain to FY13)
JV Stake acquired Year of acquisition Capacity (msm) Expansion Capacity type
Vintage Tiles 26% Jan-12 2.55
Polished vitrified tiles
Commander Vitrified 26% June-12/Dec-13 4.76
Glazed vitrified tiles/ Polished vitrified tiles
Vicon Ceramic 26% Mar-14 3.98
Industrial Tiles
Amora 51% Mar-14 2.14 2.44 (Oct-14) Ceramic wall tiles
Acer Granito 26% Mar-14 2.04 3.06 (Sep-14) Polished vitrified tiles
Source: Company, Ambit Capital research; Note: Although the above companies are classified as JVs, they are actually subsidiaries of the company for accounting and financial reporting purposes
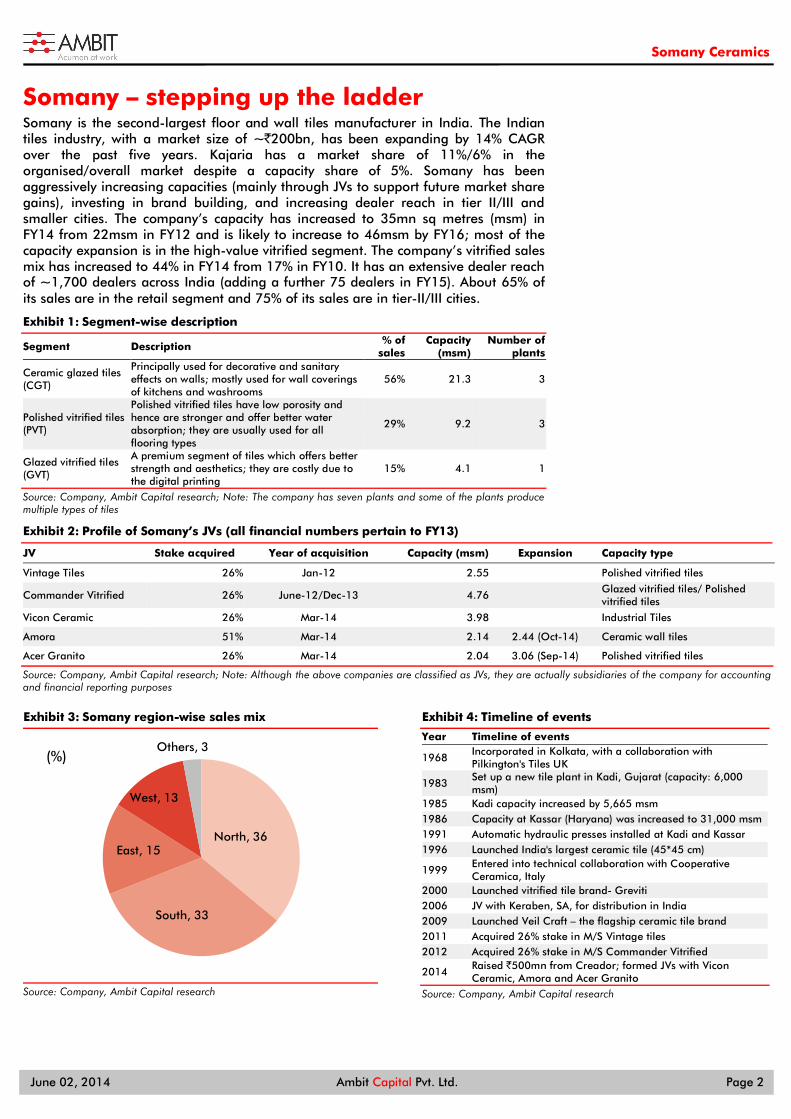
Exhibit 3: Somany region-wise sales mix
Source: Company, Ambit Capital research
Exhibit 4: Timeline of events
Year Timeline of events
1968 Incorporated in Kolkata, with a collaboration with Pilkington's Tiles UK
1983 Set up a new tile plant in Kadi, Gujarat (capacity: 6,000 msm)
1985 Kadi capacity increased by 5,665 msm 1986 Capacity at Kassar (Haryana) was increased to 31,000 msm 1991 Automatic hydraulic presses installed at Kadi and Kassar 1996 Launched India's largest ceramic tile (45*45 cm)
1999 Entered into technical collaboration with Cooperative Ceramica, Italy
2000 Launched vitrified tile brand- Greviti 2006 JV with Keraben, SA, for distribution in India 2009 Launched Veil Craft – the flagship ceramic tile brand 2011 Acquired 26% stake in M/S Vintage tiles 2012 Acquired 26% stake in M/S Commander Vitrified
2014 Raised `500mn from Creador; formed JVs with Vicon Ceramic, Amora and Acer Granito
Source: Company, Ambit Capital research
North, 36
South, 33
East, 15
West, 13
Others, 3(%)
Somany Ceramics
June 02, 2014 Ambit Capital Pvt. Ltd. Page 3
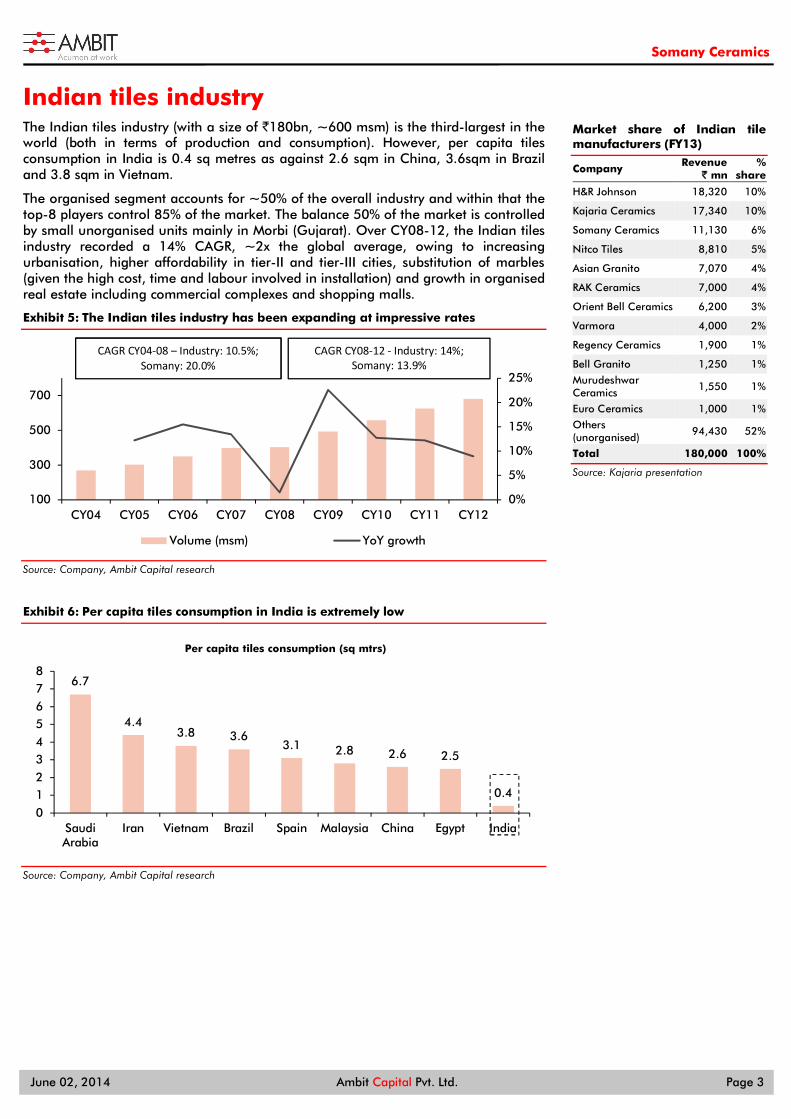
Indian tiles industry The Indian tiles industry (with a size of `180bn, ~600 msm) is the third-largest in the world (both in terms of production and consumption). However, per capita tiles consumption in India is 0.4 sq metres as against 2.6 sqm in China, 3.6sqm in Brazil and 3.8 sqm in Vietnam.
The organised segment accounts for ~50% of the overall industry and within that the top-8 players control 85% of the market. The balance 50% of the market is controlled by small unorganised units mainly in Morbi (Gujarat). Over CY08-12, the Indian tiles industry recorded a 14% CAGR, ~2x the global average, owing to increasing urbanisation, higher affordability in tier-II and tier-III cities, substitution of marbles (given the high cost, time and labour involved in installation) and growth in organised real estate including commercial complexes and shopping malls.
Exhibit 5: The Indian tiles industry has been expanding at impressive rates
Source: Company, Ambit Capital research
Exhibit 6: Per capita tiles consumption in India is extremely low
Source: Company, Ambit Capital research
0%
5%
10%
15%
20%
25%
100
300
500
700
CY04 CY05 CY06 CY07 CY08 CY09 CY10 CY11 CY12
Volume (msm) YoY growth
6.7
4.43.8 3.6
3.1 2.8 2.6 2.5
0.4
012345678
SaudiArabia
Iran Vietnam Brazil Spain Malaysia China Egypt India
Per capita tiles consumption (sq mtrs)
CAGR CY04-08 – Industry: 10.5%; Somany: 20.0%
CAGR CY08-12 - Industry: 14%; Somany: 13.9%
Market share of Indian tile manufacturers (FY13)
Company Revenue
` mn %
share
H&R Johnson 18,320 10%
Kajaria Ceramics 17,340 10%
Somany Ceramics 11,130 6%
Nitco Tiles 8,810 5%
Asian Granito 7,070 4%
RAK Ceramics 7,000 4%
Orient Bell Ceramics 6,200 3%
Varmora 4,000 2%
Regency Ceramics 1,900 1%
Bell Granito 1,250 1%
Murudeshwar Ceramics
1,550 1%
Euro Ceramics 1,000 1%
Others (unorganised)
94,430 52%
Total 180,000 100%
Source: Kajaria presentation
Somany Ceramics
June 02, 2014 Ambit Capital Pvt. Ltd. Page 4
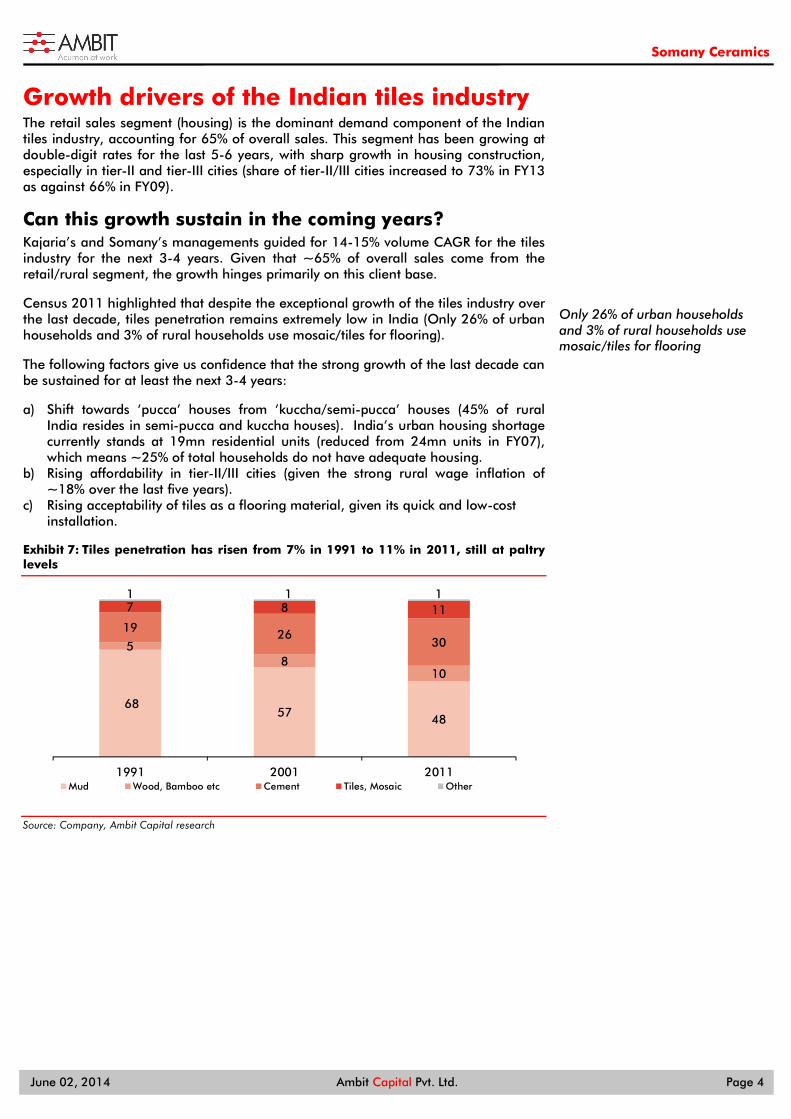
Growth drivers of the Indian tiles industry The retail sales segment (housing) is the dominant demand component of the Indian tiles industry, accounting for 65% of overall sales. This segment has been growing at double-digit rates for the last 5-6 years, with sharp growth in housing construction, especially in tier-II and tier-III cities (share of tier-II/III cities increased to 73% in FY13 as against 66% in FY09).
Can this growth sustain in the coming years? Kajaria’s and Somany’s managements guided for 14-15% volume CAGR for the tiles industry for the next 3-4 years. Given that ~65% of overall sales come from the retail/rural segment, the growth hinges primarily on this client base.
Census 2011 highlighted that despite the exceptional growth of the tiles industry over the last decade, tiles penetration remains extremely low in India (Only 26% of urban households and 3% of rural households use mosaic/tiles for flooring).
The following factors give us confidence that the strong growth of the last decade can be sustained for at least the next 3-4 years:
a) Shift towards ‘pucca’ houses from ‘kuccha/semi-pucca’ houses (45% of rural India resides in semi-pucca and kuccha houses). India’s urban housing shortage currently stands at 19mn residential units (reduced from 24mn units in FY07), which means ~25% of total households do not have adequate housing.
b) Rising affordability in tier-II/III cities (given the strong rural wage inflation of ~18% over the last five years).
c) Rising acceptability of tiles as a flooring material, given its quick and low-cost installation.
Exhibit 7: Tiles penetration has risen from 7% in 1991 to 11% in 2011, still at paltry levels
Source: Company, Ambit Capital research
68 57 48
58
10
19 2630
7 8 111 1 1
1991 2001 2011Mud Wood, Bamboo etc Cement Tiles, Mosaic Other
Only 26% of urban households and 3% of rural households use mosaic/tiles for flooring

Somany Ceramics
June 02, 2014 Ambit Capital Pvt. Ltd. Page 5
The shift to tiles in a growing industry Industry participants expect the tiles industry’s growth momentum to continue in the coming years, with rising urbanisation, recovery in real estate construction and growth in discretionary spending in tier-II/III cities. Whilst real estate construction has slowed down in recent years, housing construction continues to be stable, especially in tier-II and tier-III cities in India. Kajaria and Somany derive roughly two-thirds of their revenue from tier-II/III cities. Furthermore, a recovery in real estate construction (which has been extremely weak in the last two years) could also contribute to the industry growth.
In this context, we see three clear trends unfolding in the industry:
(1) Shift to higher-value products
Whilst the Indian tiles industry has been historically dominated by floor ceramic tiles, consumers are increasingly shifting towards value-added products (such as GVT, PVT and wall ceramic tiles), as these products are stronger, stain-resistant and offer better designs with low water absorption. Here are excerpts from interviews with tiles experts:
“GVT and PVT continue to rise in popularity led by 2ft x 1ft tiles with advanced Digital Printing Technology replicating marbles, stones, metal, wood, wallpaper, colours and gradients in colour, textile patterns and floral designs. 2ft x 2ft tiles in matte finish are the most in demand currently”.
“GVT which comes in a rectangular shape in a size of 2ft x 2ft and 2ft x 3ft is also highly in demand since it gives a more close-to-marble look”.
As shown in the exhibit below, the growth rates of PVT and GVT have been far higher than CGT (albeit on a lower base) and the share of PVT and GVT in overall tiles sales has increased to 36% in FY13 vs 32% in FY11. Increasing industry realisation also signifies a shift to higher-value products. Furthermore, even ceramic tiles have seen an increasing shift to higher-value wall tiles from floor tiles.
Exhibit 8: The share of PVT and GVT in overall tiles sales has been rising
Segment (msm) % of total Price range
FY11 FY12 FY13 FY11 FY12 FY13 (`/sq mtr)
CGT 334 367 400 68% 66% 64% 225-1,000
PVT 145 170 200 29% 31% 32% 425-1,200
GVT 15 20 25 3% 4% 4% 600-1,800
Total 494 557 625 100% 100% 100%
Source: Company, Ambit Capital research
(2) Shift from unorganised to organised segment
Currently, 50% of domestic tiles sales are controlled by the unorganised players in Morbi. Rising costs of inputs (primarily gas prices), higher indirect taxes, increasing brand preference/awareness amongst house builders and rising transportation costs, are driving these units to partner with organised companies to piggyback on their distribution channels.
We hear that the Morbi-based players are losing their cost competitiveness, as the Gujarat Pollution Control Board has ordered to stop the use of coal-based gasifiers. Using coal instead of gas helped Morbi-based unorganised players to under-report production and hence pay lower indirect taxes, thus keeping their products relatively cheap than organised players. Shifting to gas-based production will diminish this advantage of unorganised players and hence they may look to partner with larger players. Given that the larger brands guarantee higher sales growth and a higher capacity utilisation, more and more unorganised players would be attracted to partner with these companies to sustain/improve their profitability.
Rising industry realisation
Source: Industry
223 223 226 235
250
CY08 CY09 CY10 CY11 CY12
Industry realisation (`/ sq mtr)
Somany Ceramics
June 02, 2014 Ambit Capital Pvt. Ltd. Page 6
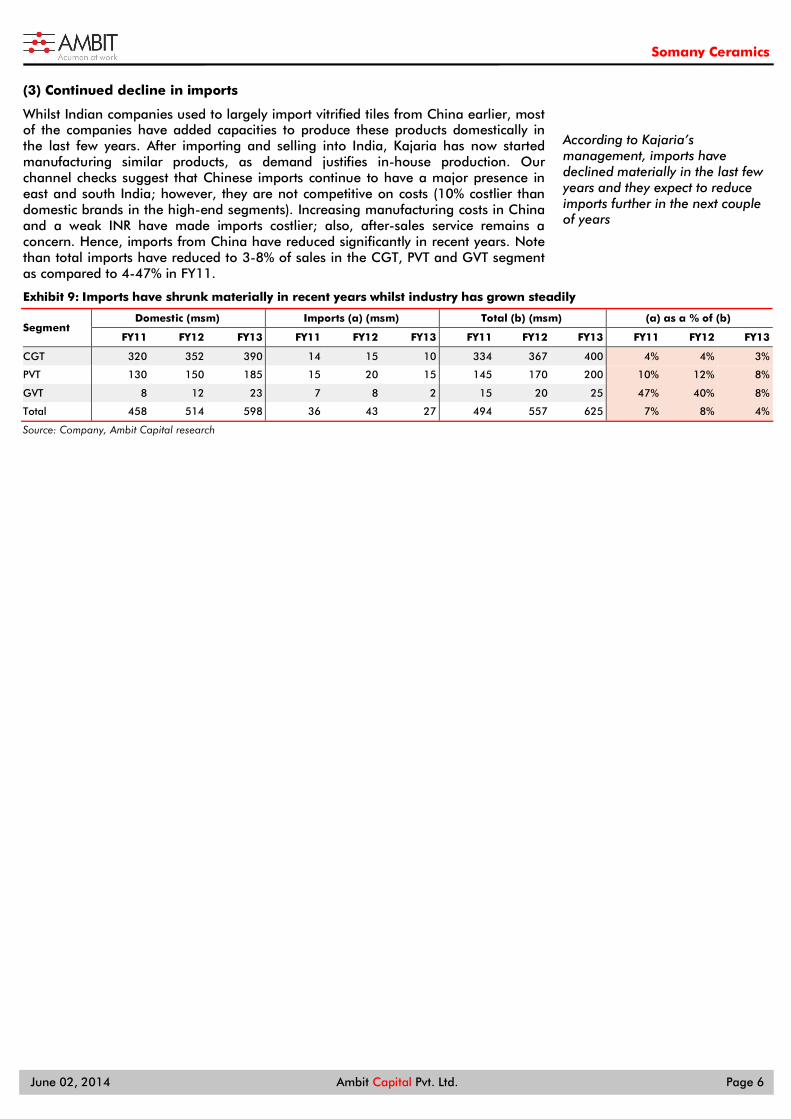
(3) Continued decline in imports
Whilst Indian companies used to largely import vitrified tiles from China earlier, most of the companies have added capacities to produce these products domestically in the last few years. After importing and selling into India, Kajaria has now started manufacturing similar products, as demand justifies in-house production. Our channel checks suggest that Chinese imports continue to have a major presence in east and south India; however, they are not competitive on costs (10% costlier than domestic brands in the high-end segments). Increasing manufacturing costs in China and a weak INR have made imports costlier; also, after-sales service remains a concern. Hence, imports from China have reduced significantly in recent years. Note than total imports have reduced to 3-8% of sales in the CGT, PVT and GVT segment as compared to 4-47% in FY11.
Exhibit 9: Imports have shrunk materially in recent years whilst industry has grown steadily
Segment Domestic (msm) Imports (a) (msm) Total (b) (msm) (a) as a % of (b)
FY11 FY12 FY13 FY11 FY12 FY13 FY11 FY12 FY13 FY11 FY12 FY13
CGT 320 352 390 14 15 10 334 367 400 4% 4% 3%
PVT 130 150 185 15 20 15 145 170 200 10% 12% 8%
GVT 8 12 23 7 8 2 15 20 25 47% 40% 8%
Total 458 514 598 36 43 27 494 557 625 7% 8% 4%
Source: Company, Ambit Capital research
According to Kajaria’s management, imports have declined materially in the last few years and they expect to reduce imports further in the next couple of years

Somany Ceramics
June 02, 2014 Ambit Capital Pvt. Ltd. Page 7
Competitive mapping on financial metrics Somany ranks second amongst the Indian tiles companies on financial parameters (after Kajaria), due to: (a) strong volume and revenue growth over the last 3-6 years, (b) better RoCE than most of its peers (barring Kajaria), (c) strong cash flow generation (highest CFO/EBITDA in the industry), and (d) low debt/equity (0.5x).
Exhibit 10: Kajaria is the best Indian tiles company on financial parameters
Company Size Profitability Cash flows Balance sheet
strength Final
ranking
Kajaria 1 1 2 2 1
Somany 2 2 1 3 2
Orient Bell 3 3 3 4 3
Murudeshwar 5 4 4 1 4
Nitco 4 5 5 5 5
Source: Company, Ambit Capital research Note: for lack of financials of Johnson tiles for comparison, the same is not considered in above analysis
Exhibit 11: Numbers behind our ranking
Company
Size Revenue
CAGR Volume growth
Avg realisation (`/sq mtr)
Profitability (6-year average)
Cash flows (6-year average)
Balance sheet strength
Volume FY13
(msm)
Market Share (Total)
3-yr 6-yr 3-yr 6-yr 3-yr 6-yr RoCE EBITDA Margin
CE Turn (x)
CFO/EBITDA D/E (x)
H & R Johnson*
NA 10.5% NA 19% NA NA NA NA 6% 7.7% 1.5 53% 1.3*
Kajaria 45.6 10.2% 30% 24% 22% 14% 337 314 19.4% 15.2% 2.3 89% 0.3
Somany 33.4 9.6% 25% 24% 13% 16% 286 260 14.5% 9.1% 3.2 91% 0.5
Orient Bell 20.3 3.4% 29% 21% 5% 3% 237 189 10.4% 10.4% 2.0 88% 0.5
Murudeshwar 3.9 0.9% -1% -9% -6% -9% 290 293 5.7% 30.9% 0.4 84% 0.2
Nitco 15.9 4.9% 27% 14% 22% 10% 445 422 3.2% 10.1% 0.6 -46% 4.4
Source: Company, Ambit Capital research. Note: * H & R Johnson is the tiles division of Prism Cement
Ranking methodology
Size and revenue: Somany is the third-largest tiles company in India, with a market share of ~6% in the overall market. Furthermore, it has been one of the fastest-growing tiles company (both in terms of revenues and volumes) in the last 3-6 years. Somany’s realisations are materially lower than Kajaria’s, due to a lower vitrified tiles mix and a lower-notch brand placement.
Profitability: Somany’s six-year average RoCE is the second highest in the India tiles industry. Somany’s CE turnover is higher than Kajaria’s (as it follows an asset-light model and outsources 50% of its production) but Kajaria’s profitability is better due to higher margins. Somany has actively pursued low-cost capacity additions, cost savings and brand-building measures in the last few years, which should improve RoCEs in the future.
Cash flows: Somany’s CFO/EBITDA is the highest in the industry, signifying superior cash conversion.
Balance sheet strength: Kajaria’s debt/equity declined to 0.8x in FY13 from 2.2x in FY08, as net worth expanded by 2.3x (although absolute debt remained broadly the same). Currently, Kajaria’s debt/equity ratio is the second lowest in the industry (behind Murudeshwar). As on December 2013, Kajaria’s debt/equity receded further to 0.4x.
Note that we have excluded H&R Johnson from the ranking above (despite it being the largest tiles company in India), as the financial numbers for its tiles division cannot be determined separately.
Somany ranks the second best in financial parameters amongst the tiles companies in India

Somany Ceramics
June 02, 2014 Ambit Capital Pvt. Ltd. Page 8
Competitive mapping on operational parameters Somany is the third-largest tile manufacturer in India (after H&R Johnson, the tiles division of Prism Cement). It is a strong player on operational parameters, given that it has: (a) the third-highest installed capacity, (b) a pan-India presence with an extensive distribution reach, and (c) a reasonably strong brand recall across India (based on our dealer checks). Somany scores low on the vitrified tiles sales mix (lower than Kajaria, H&R Johnson and Nitco) and its brand is positioned slightly lower than Kajaria., which is evident from lower realisations.
Exhibit 12: Kajaria appears to be the best Indian tiles company on operational parameters
Company Number of plants
Plant location Capacity
(mn sq m) Capacity -
Own:JV Vitrified share
(value) FY13 Sales presence
Sales points
Brand perception
H&R Johnson 9 MP, Maharashtra, Karnataka, Pondicherry, Gujarat, AP, HP
54.0 45:55 50% North, South, Central, East, West
6,500 Very Strong
Kajaria 7 Rajasthan, UP, Gujarat, AP
46.6 65:35 51% North, South, Central, East, West
6,500 Very Strong
Somany 6 Gujarat, Haryana 35.0 55:45 44% North, South, Central, East, West
6,500 Very Strong
Orient Bell 3 UP, Gujarat, Karnataka 25.0 100:0 30% North, South, Central, East, West
4,000 Moderate
Murudeshwar 3 Karnataka, Tamil Nadu 11.4 100:0 60% South, East 1,000 Moderate Nitco 2 Maharashtra 16.0 50:50 55% North, West, South 1,100 Strong
Source: Company, dealer checks, Ambit Capital research
Dealers highlight Somany’s improving brand in the premium tiles segment Material improvement in brand positioning in the last few years: A large Mumbai-based dealer highlighted that Somany’s brand positioning has improved significantly in the last few years and the company has become fairly competitive in the value-added segment.
Somany has become very aggressive in GVT/PVT: Somany has been a late entrant in high-value tiles like GVT (with a presence only for the last three years as compared to Kajaria’s presence of ~10 years). Dealers highlight that Somany has been very aggressive in the PVT/GVT segment in the last few years and has managed to improve its brand in this segment materially. They also highlight that Somany has done a fair bit of work with architects (in terms of organising conferences to improve visibility among them).
Customers pre-determine what they want to buy: Dealer highlight that customers pre-determine (based on their discussions with their architect or interior designers), what brand they want to purchase. Hence, a stronger brand has a ‘pull factor’. Dealers in tier-II cities highlight that Somany is amongst the best ceramic tile brands but it is still a few notches below Kajaria in vitrified tiles.
Quality is not a differentiating factor: Dealers highlight that the quality of tiles does not make a material difference, as the buyer’s decision is driven by brand perception. They believe that the quality of tiles is similar for most domestic players (both organised and unorganised players) and the pricing premium is driven by the strength of the brand.
Somany’s distribution is as good as Kajaria: Dealers do not see any difference in Somany’s delivery time as compared to Kajaria. They highlight that both are equally prompt in deliveries. Somany has 11 depots across India, and hence despite centralised manufacturing around west/north India, the lag-time in deliveries in other regions is not much.
Somany’s brand positioning has improved significantly in the last few years and the company has become fairly competitive in the value-added segment.
Dealers highlight that the quality of tiles does not make a material difference, as the buyer’s decision is driven by brand perception.
Dealers do not see any difference in Somany’s delivery time as compared to Kajaria.

Somany Ceramics
June 02, 2014 Ambit Capital Pvt. Ltd. Page 9
Building scale and efficiencies; improving product mix Somany has followed an asset-light business model, with a high proportion of outsourced sales (25-40% of overall sales over FY08-13), which aided volume and revenue growth (24% CAGR). Somany’s strategy has been to leverage its brand and distribution network to increase sales and keep capital deployment limited by outsourcing production. Whilst it enjoys the highest capital employed turnover in the industry, its margins have been materially lower than Kajaria’s, due to: (a) low trading margins in outsourced sales, and (b) lower realisations, as its brand placement is a notch below Kajaria. From FY12 onwards, the company started building scale by entering into JVs with unorganised peers, which confers low-cost capacity expansion alongside cost advantages like low-cost sourcing and better reach.
Exceptional volume and revenue growth …
Somany recorded 15% volume CAGR and 24% revenue CAGR over FY08-13, supported by the strong growth of the Indian tile industry (14% CAGR over FY08-13) and rising mix of high value products. The rising share of outsourced volumes (39% of overall volumes in FY14 as against 25% in FY08) contributed to the strong volume growth despite no material capacity enhancement. The management has guided for a revenue growth of more than 20% in FY15, given the sharp increase in capacities in FY14 and upcoming capacities in FY15. Consensus expects 20% sales CAGR over FY14-16.
Exhibit 13: Somany reported volume/revenue CAGR of 16%/20% over FY05-14
Source: Company, Ambit Capital research
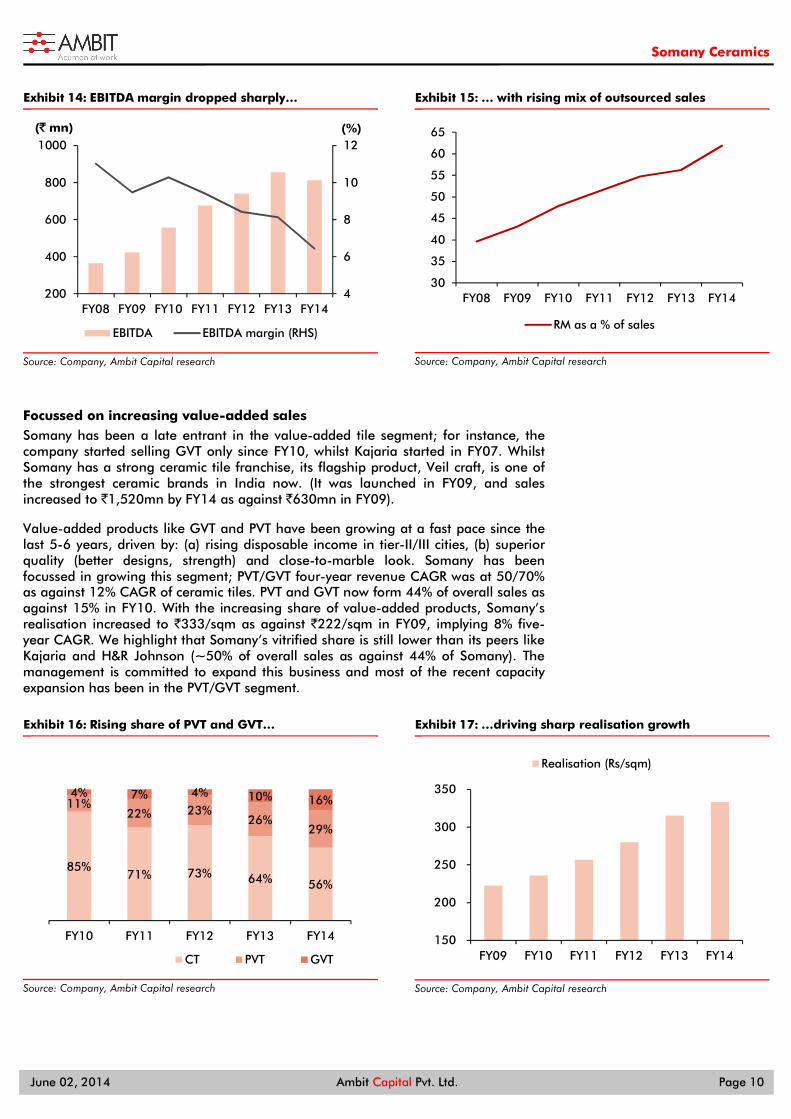
….but declining EBITDA margins
Whilst revenue grew at a sharp rate, EBITDA margin declined from 11% in FY08 to 6% in FY14, on account of: (a) rising share of low-margin outsourced sales, (b) steep increase in gas prices and INR depreciation, and (c) increasing investments in selling and distribution. Increasing scale will confer operating leverage benefits and aid better fixed cost recovery. However, the key lever to margin improvement is a shift to a more profitable product mix. Consensus expects EBITDA margin to improve to 6.7% in FY15 and 6.9% in FY16 (as against 6.4% in FY14). Consensus estimates imply 24% EBITDA CAGR over FY14-16.
10
20
30
40
1,000
3,000
5,000
7,000
9,000
11,000
13,000
15,000
FY05 FY06 FY07 FY08 FY09 FY10 FY11 FY12 FY13 FY14
(msm)(` mn)
Revenue Volume (RHS)
Somany’s strategy has been to leverage its brand and distribution network to increase sales and keep capital deployment limited by outsourcing production
The rising share of outsourced volumes (39% of overall volumes in FY14 as against 25% in FY08) contributed to the strong volume growth despite no material capacity enhancement.
The key lever to margin improvement is a shift to a more profitable product mix.
Somany Ceramics
June 02, 2014 Ambit Capital Pvt. Ltd. Page 10
Exhibit 14: EBITDA margin dropped sharply…
Source: Company, Ambit Capital research
Exhibit 15: … with rising mix of outsourced sales
Source: Company, Ambit Capital research
Focussed on increasing value-added sales Somany has been a late entrant in the value-added tile segment; for instance, the company started selling GVT only since FY10, whilst Kajaria started in FY07. Whilst Somany has a strong ceramic tile franchise, its flagship product, Veil craft, is one of the strongest ceramic brands in India now. (It was launched in FY09, and sales increased to `1,520mn by FY14 as against `630mn in FY09).
Value-added products like GVT and PVT have been growing at a fast pace since the last 5-6 years, driven by: (a) rising disposable income in tier-II/III cities, (b) superior quality (better designs, strength) and close-to-marble look. Somany has been focussed in growing this segment; PVT/GVT four-year revenue CAGR was at 50/70% as against 12% CAGR of ceramic tiles. PVT and GVT now form 44% of overall sales as against 15% in FY10. With the increasing share of value-added products, Somany’s realisation increased to `333/sqm as against `222/sqm in FY09, implying 8% five-year CAGR. We highlight that Somany’s vitrified share is still lower than its peers like Kajaria and H&R Johnson (~50% of overall sales as against 44% of Somany). The management is committed to expand this business and most of the recent capacity expansion has been in the PVT/GVT segment.
Exhibit 16: Rising share of PVT and GVT…
Source: Company, Ambit Capital research
Exhibit 17: …driving sharp realisation growth
Source: Company, Ambit Capital research
4
6
8
10
12
200
400
600
800
1000
FY08 FY09 FY10 FY11 FY12 FY13 FY14
(%)(` mn)
EBITDA EBITDA margin (RHS)
30
35
40
45
50
55
60
65
FY08 FY09 FY10 FY11 FY12 FY13 FY14
RM as a % of sales
85%71% 73% 64% 56%
11%22% 23%
26%29%
4% 7% 4% 10% 16%
FY10 FY11 FY12 FY13 FY14
CT PVT GVT
150
200
250
300
350
FY09 FY10 FY11 FY12 FY13 FY14
Realisation (Rs/sqm)
Somany Ceramics
June 02, 2014 Ambit Capital Pvt. Ltd. Page 11
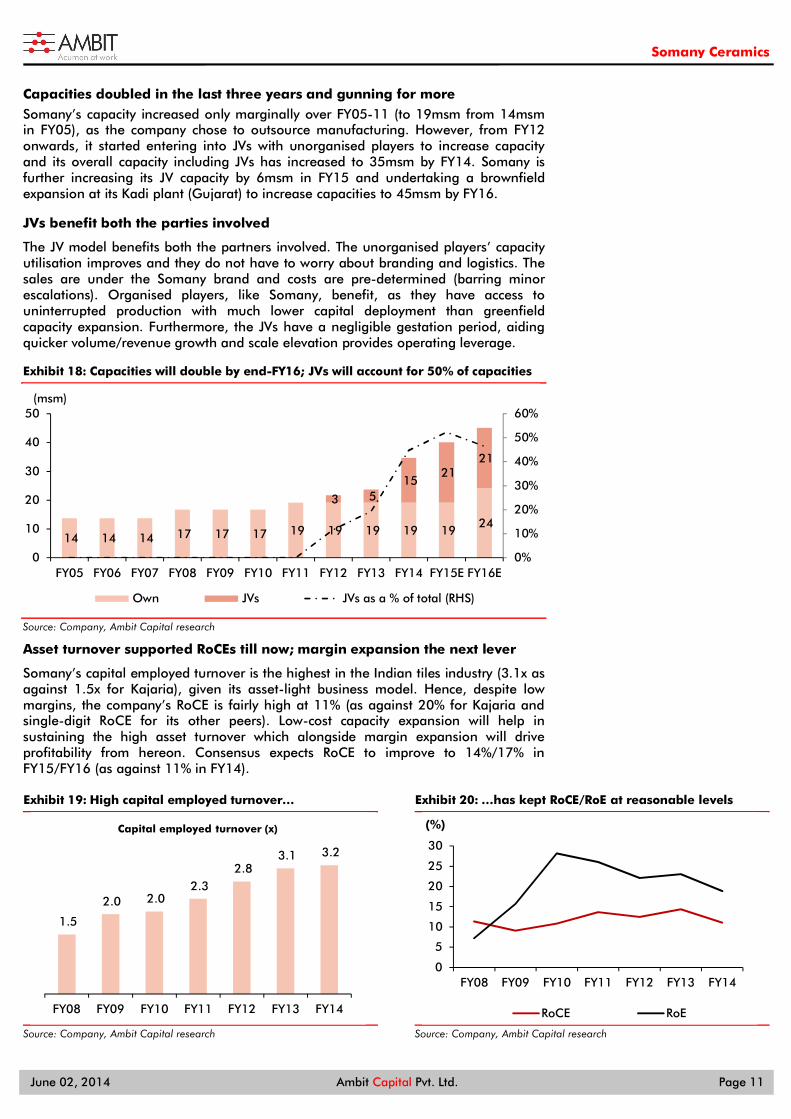
Capacities doubled in the last three years and gunning for more
Somany’s capacity increased only marginally over FY05-11 (to 19msm from 14msm in FY05), as the company chose to outsource manufacturing. However, from FY12 onwards, it started entering into JVs with unorganised players to increase capacity and its overall capacity including JVs has increased to 35msm by FY14. Somany is further increasing its JV capacity by 6msm in FY15 and undertaking a brownfield expansion at its Kadi plant (Gujarat) to increase capacities to 45msm by FY16.
JVs benefit both the parties involved
The JV model benefits both the partners involved. The unorganised players’ capacity utilisation improves and they do not have to worry about branding and logistics. The sales are under the Somany brand and costs are pre-determined (barring minor escalations). Organised players, like Somany, benefit, as they have access to uninterrupted production with much lower capital deployment than greenfield capacity expansion. Furthermore, the JVs have a negligible gestation period, aiding quicker volume/revenue growth and scale elevation provides operating leverage.
Exhibit 18: Capacities will double by end-FY16; JVs will account for 50% of capacities
Source: Company, Ambit Capital research
Asset turnover supported RoCEs till now; margin expansion the next lever
Somany’s capital employed turnover is the highest in the Indian tiles industry (3.1x as against 1.5x for Kajaria), given its asset-light business model. Hence, despite low margins, the company’s RoCE is fairly high at 11% (as against 20% for Kajaria and single-digit RoCE for its other peers). Low-cost capacity expansion will help in sustaining the high asset turnover which alongside margin expansion will drive profitability from hereon. Consensus expects RoCE to improve to 14%/17% in FY15/FY16 (as against 11% in FY14).
Exhibit 19: High capital employed turnover…
Source: Company, Ambit Capital research
Exhibit 20: …has kept RoCE/RoE at reasonable levels
Source: Company, Ambit Capital research
14 14 14 17 17 17 19 19 19 19 19 24
3 5 15
21 21
0%
10%
20%
30%
40%
50%
60%
0
10
20
30
40
50
FY05 FY06 FY07 FY08 FY09 FY10 FY11 FY12 FY13 FY14 FY15E FY16E
(msm)
Own JVs JVs as a % of total (RHS)
1.5
2.0 2.0 2.3
2.8 3.1 3.2
FY08 FY09 FY10 FY11 FY12 FY13 FY14
Capital employed turnover (x)
0
5
10
15
20
25
30
FY08 FY09 FY10 FY11 FY12 FY13 FY14
(%)
RoCE RoE
Somany Ceramics
June 02, 2014 Ambit Capital Pvt. Ltd. Page 12
No constraints for meeting capex commitments
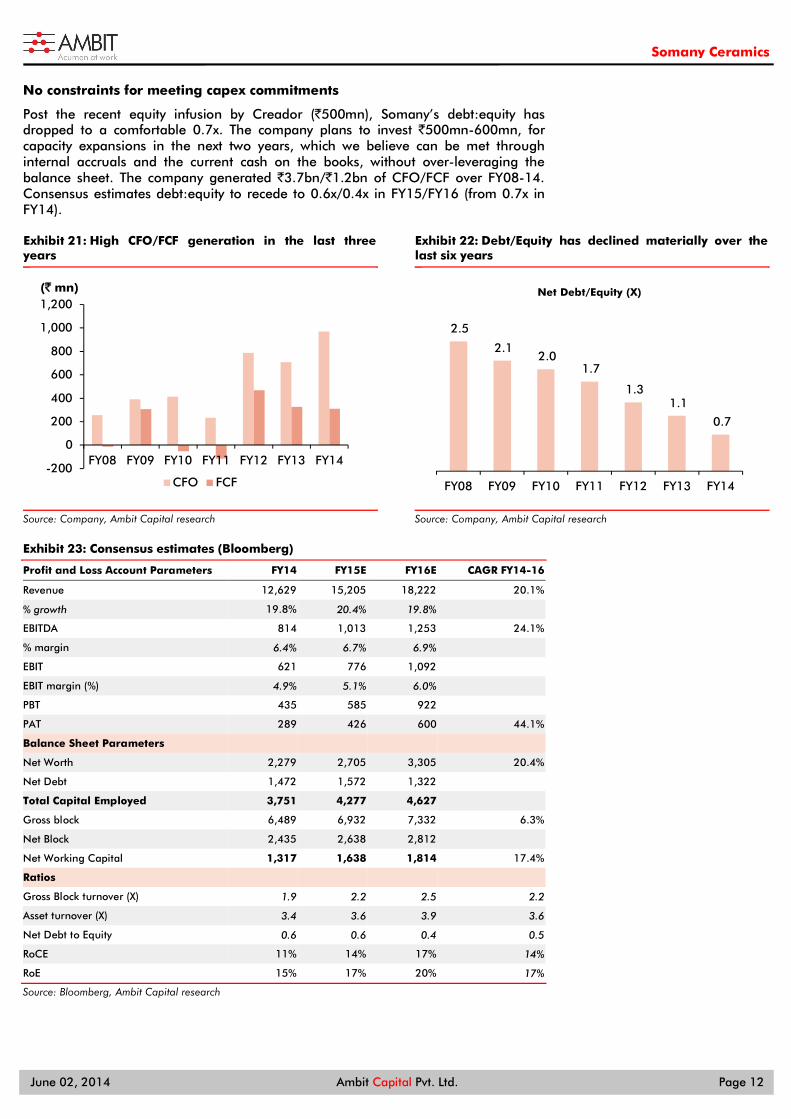
Post the recent equity infusion by Creador (`500mn), Somany’s debt:equity has dropped to a comfortable 0.7x. The company plans to invest `500mn-600mn, for capacity expansions in the next two years, which we believe can be met through internal accruals and the current cash on the books, without over-leveraging the balance sheet. The company generated `3.7bn/`1.2bn of CFO/FCF over FY08-14. Consensus estimates debt:equity to recede to 0.6x/0.4x in FY15/FY16 (from 0.7x in FY14).
Exhibit 21: High CFO/FCF generation in the last three years
Source: Company, Ambit Capital research
Exhibit 22: Debt/Equity has declined materially over the last six years
Source: Company, Ambit Capital research
Exhibit 23: Consensus estimates (Bloomberg)
Profit and Loss Account Parameters FY14 FY15E FY16E CAGR FY14-16
Revenue 12,629 15,205 18,222 20.1%
% growth 19.8% 20.4% 19.8%
EBITDA 814 1,013 1,253 24.1%
% margin 6.4% 6.7% 6.9%
EBIT 621 776 1,092
EBIT margin (%) 4.9% 5.1% 6.0%
PBT 435 585 922
PAT 289 426 600 44.1%
Balance Sheet Parameters
Net Worth 2,279 2,705 3,305 20.4%
Net Debt 1,472 1,572 1,322
Total Capital Employed 3,751 4,277 4,627
Gross block 6,489 6,932 7,332 6.3%
Net Block 2,435 2,638 2,812
Net Working Capital 1,317 1,638 1,814 17.4%
Ratios
Gross Block turnover (X) 1.9 2.2 2.5 2.2
Asset turnover (X) 3.4 3.6 3.9 3.6
Net Debt to Equity 0.6 0.6 0.4 0.5
RoCE 11% 14% 17% 14%
RoE 15% 17% 20% 17%
Source: Bloomberg, Ambit Capital research
-200
0
200
400
600
800
1,000
1,200
FY08 FY09 FY10 FY11 FY12 FY13 FY14
(` mn)
CFO FCF
2.5
2.1 2.0
1.7
1.3 1.1
0.7
FY08 FY09 FY10 FY11 FY12 FY13 FY14
Net Debt/Equity (X)
Somany Ceramics
June 02, 2014 Ambit Capital Pvt. Ltd. Page 13
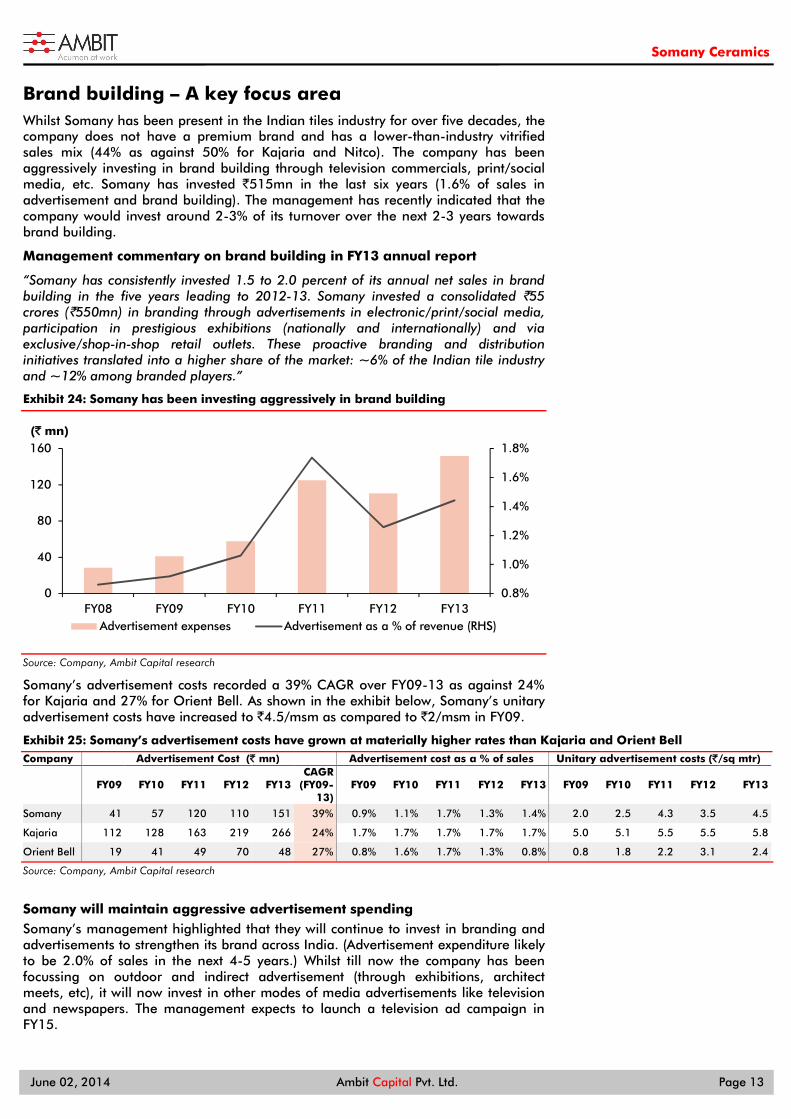
Brand building – A key focus area Whilst Somany has been present in the Indian tiles industry for over five decades, the company does not have a premium brand and has a lower-than-industry vitrified sales mix (44% as against 50% for Kajaria and Nitco). The company has been aggressively investing in brand building through television commercials, print/social media, etc. Somany has invested `515mn in the last six years (1.6% of sales in advertisement and brand building). The management has recently indicated that the company would invest around 2-3% of its turnover over the next 2-3 years towards brand building.
Management commentary on brand building in FY13 annual report
“Somany has consistently invested 1.5 to 2.0 percent of its annual net sales in brand building in the five years leading to 2012-13. Somany invested a consolidated `55 crores (`550mn) in branding through advertisements in electronic/print/social media, participation in prestigious exhibitions (nationally and internationally) and via exclusive/shop-in-shop retail outlets. These proactive branding and distribution initiatives translated into a higher share of the market: ~6% of the Indian tile industry and ~12% among branded players.”
Exhibit 24: Somany has been investing aggressively in brand building
Source: Company, Ambit Capital research
Somany’s advertisement costs recorded a 39% CAGR over FY09-13 as against 24% for Kajaria and 27% for Orient Bell. As shown in the exhibit below, Somany’s unitary advertisement costs have increased to `4.5/msm as compared to `2/msm in FY09.
Exhibit 25: Somany’s advertisement costs have grown at materially higher rates than Kajaria and Orient Bell Company Advertisement Cost (` mn) Advertisement cost as a % of sales Unitary advertisement costs (`/sq mtr)
FY09 FY10 FY11 FY12 FY13
CAGR (FY09-
13) FY09 FY10 FY11 FY12 FY13 FY09 FY10 FY11 FY12 FY13
Somany 41 57 120 110 151 39% 0.9% 1.1% 1.7% 1.3% 1.4% 2.0 2.5 4.3 3.5 4.5
Kajaria 112 128 163 219 266 24% 1.7% 1.7% 1.7% 1.7% 1.7% 5.0 5.1 5.5 5.5 5.8
Orient Bell 19 41 49 70 48 27% 0.8% 1.6% 1.7% 1.3% 0.8% 0.8 1.8 2.2 3.1 2.4
Source: Company, Ambit Capital research
Somany will maintain aggressive advertisement spending Somany’s management highlighted that they will continue to invest in branding and advertisements to strengthen its brand across India. (Advertisement expenditure likely to be 2.0% of sales in the next 4-5 years.) Whilst till now the company has been focussing on outdoor and indirect advertisement (through exhibitions, architect meets, etc), it will now invest in other modes of media advertisements like television and newspapers. The management expects to launch a television ad campaign in FY15.
0.8%
1.0%
1.2%
1.4%
1.6%
1.8%
0
40
80
120
160
FY08 FY09 FY10 FY11 FY12 FY13
(` mn)
Advertisement expenses Advertisement as a % of revenue (RHS)
Somany Ceramics
June 02, 2014 Ambit Capital Pvt. Ltd. Page 14
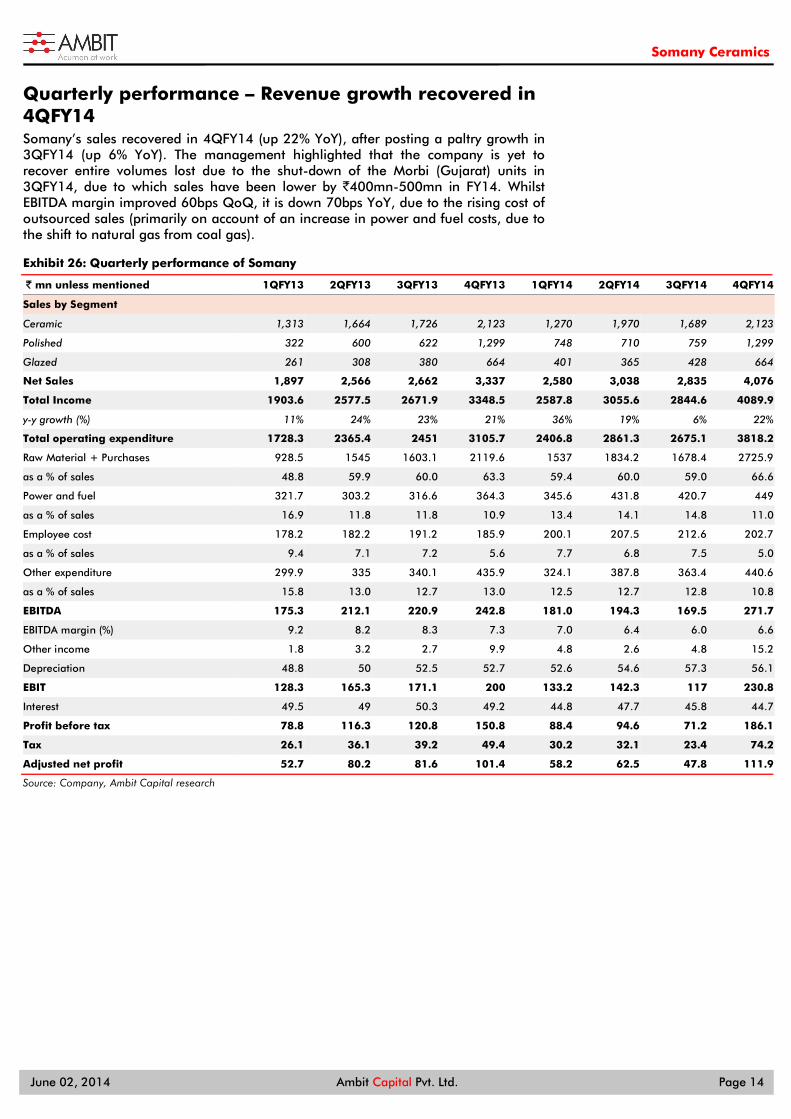
Quarterly performance – Revenue growth recovered in 4QFY14 Somany’s sales recovered in 4QFY14 (up 22% YoY), after posting a paltry growth in 3QFY14 (up 6% YoY). The management highlighted that the company is yet to recover entire volumes lost due to the shut-down of the Morbi (Gujarat) units in 3QFY14, due to which sales have been lower by `400mn-500mn in FY14. Whilst EBITDA margin improved 60bps QoQ, it is down 70bps YoY, due to the rising cost of outsourced sales (primarily on account of an increase in power and fuel costs, due to the shift to natural gas from coal gas).
Exhibit 26: Quarterly performance of Somany
` mn unless mentioned 1QFY13 2QFY13 3QFY13 4QFY13 1QFY14 2QFY14 3QFY14 4QFY14
Sales by Segment
Ceramic 1,313 1,664 1,726 2,123 1,270 1,970 1,689 2,123
Polished 322 600 622 1,299 748 710 759 1,299
Glazed 261 308 380 664 401 365 428 664
Net Sales 1,897 2,566 2,662 3,337 2,580 3,038 2,835 4,076
Total Income 1903.6 2577.5 2671.9 3348.5 2587.8 3055.6 2844.6 4089.9
y-y growth (%) 11% 24% 23% 21% 36% 19% 6% 22%
Total operating expenditure 1728.3 2365.4 2451 3105.7 2406.8 2861.3 2675.1 3818.2
Raw Material + Purchases 928.5 1545 1603.1 2119.6 1537 1834.2 1678.4 2725.9
as a % of sales 48.8 59.9 60.0 63.3 59.4 60.0 59.0 66.6
Power and fuel 321.7 303.2 316.6 364.3 345.6 431.8 420.7 449
as a % of sales 16.9 11.8 11.8 10.9 13.4 14.1 14.8 11.0
Employee cost 178.2 182.2 191.2 185.9 200.1 207.5 212.6 202.7
as a % of sales 9.4 7.1 7.2 5.6 7.7 6.8 7.5 5.0
Other expenditure 299.9 335 340.1 435.9 324.1 387.8 363.4 440.6
as a % of sales 15.8 13.0 12.7 13.0 12.5 12.7 12.8 10.8
EBITDA 175.3 212.1 220.9 242.8 181.0 194.3 169.5 271.7
EBITDA margin (%) 9.2 8.2 8.3 7.3 7.0 6.4 6.0 6.6
Other income 1.8 3.2 2.7 9.9 4.8 2.6 4.8 15.2
Depreciation 48.8 50 52.5 52.7 52.6 54.6 57.3 56.1
EBIT 128.3 165.3 171.1 200 133.2 142.3 117 230.8
Interest 49.5 49 50.3 49.2 44.8 47.7 45.8 44.7
Profit before tax 78.8 116.3 120.8 150.8 88.4 94.6 71.2 186.1
Tax 26.1 36.1 39.2 49.4 30.2 32.1 23.4 74.2
Adjusted net profit 52.7 80.2 81.6 101.4 58.2 62.5 47.8 111.9
Source: Company, Ambit Capital research
Somany Ceramics
June 02, 2014 Ambit Capital Pvt. Ltd. Page 15
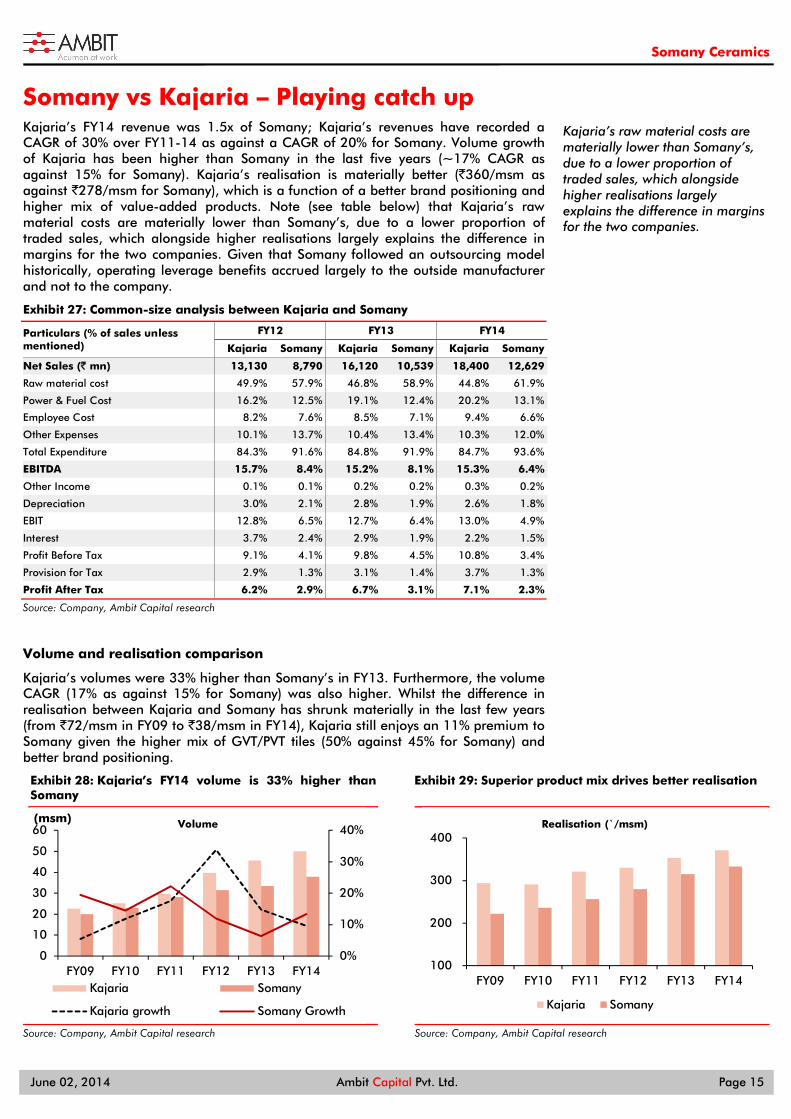
Somany vs Kajaria – Playing catch up Kajaria’s FY14 revenue was 1.5x of Somany; Kajaria’s revenues have recorded a CAGR of 30% over FY11-14 as against a CAGR of 20% for Somany. Volume growth of Kajaria has been higher than Somany in the last five years (~17% CAGR as against 15% for Somany). Kajaria’s realisation is materially better (`360/msm as against `278/msm for Somany), which is a function of a better brand positioning and higher mix of value-added products. Note (see table below) that Kajaria’s raw material costs are materially lower than Somany’s, due to a lower proportion of traded sales, which alongside higher realisations largely explains the difference in margins for the two companies. Given that Somany followed an outsourcing model historically, operating leverage benefits accrued largely to the outside manufacturer and not to the company.
Exhibit 27: Common-size analysis between Kajaria and Somany
Particulars (% of sales unless mentioned)
FY12 FY13 FY14
Kajaria Somany Kajaria Somany Kajaria Somany
Net Sales (` mn) 13,130 8,790 16,120 10,539 18,400 12,629
Raw material cost 49.9% 57.9% 46.8% 58.9% 44.8% 61.9%
Power & Fuel Cost 16.2% 12.5% 19.1% 12.4% 20.2% 13.1%
Employee Cost 8.2% 7.6% 8.5% 7.1% 9.4% 6.6%
Other Expenses 10.1% 13.7% 10.4% 13.4% 10.3% 12.0%
Total Expenditure 84.3% 91.6% 84.8% 91.9% 84.7% 93.6%
EBITDA 15.7% 8.4% 15.2% 8.1% 15.3% 6.4%
Other Income 0.1% 0.1% 0.2% 0.2% 0.3% 0.2%
Depreciation 3.0% 2.1% 2.8% 1.9% 2.6% 1.8%
EBIT 12.8% 6.5% 12.7% 6.4% 13.0% 4.9%
Interest 3.7% 2.4% 2.9% 1.9% 2.2% 1.5%
Profit Before Tax 9.1% 4.1% 9.8% 4.5% 10.8% 3.4%
Provision for Tax 2.9% 1.3% 3.1% 1.4% 3.7% 1.3%
Profit After Tax 6.2% 2.9% 6.7% 3.1% 7.1% 2.3%
Source: Company, Ambit Capital research
Volume and realisation comparison
Kajaria’s volumes were 33% higher than Somany’s in FY13. Furthermore, the volume CAGR (17% as against 15% for Somany) was also higher. Whilst the difference in realisation between Kajaria and Somany has shrunk materially in the last few years (from `72/msm in FY09 to `38/msm in FY14), Kajaria still enjoys an 11% premium to Somany given the higher mix of GVT/PVT tiles (50% against 45% for Somany) and better brand positioning.
Exhibit 28: Kajaria’s FY14 volume is 33% higher than Somany
Source: Company, Ambit Capital research
Exhibit 29: Superior product mix drives better realisation
Source: Company, Ambit Capital research
0%
10%
20%
30%
40%
0
10
20
30
40
50
60
FY09 FY10 FY11 FY12 FY13 FY14
(msm) Volume
Kajaria Somany
Kajaria growth Somany Growth
100
200
300
400
FY09 FY10 FY11 FY12 FY13 FY14
Realisation (`/msm)
Kajaria Somany
Kajaria’s raw material costs are materially lower than Somany’s, due to a lower proportion of traded sales, which alongside higher realisations largely explains the difference in margins for the two companies.
Somany Ceramics
June 02, 2014 Ambit Capital Pvt. Ltd. Page 16
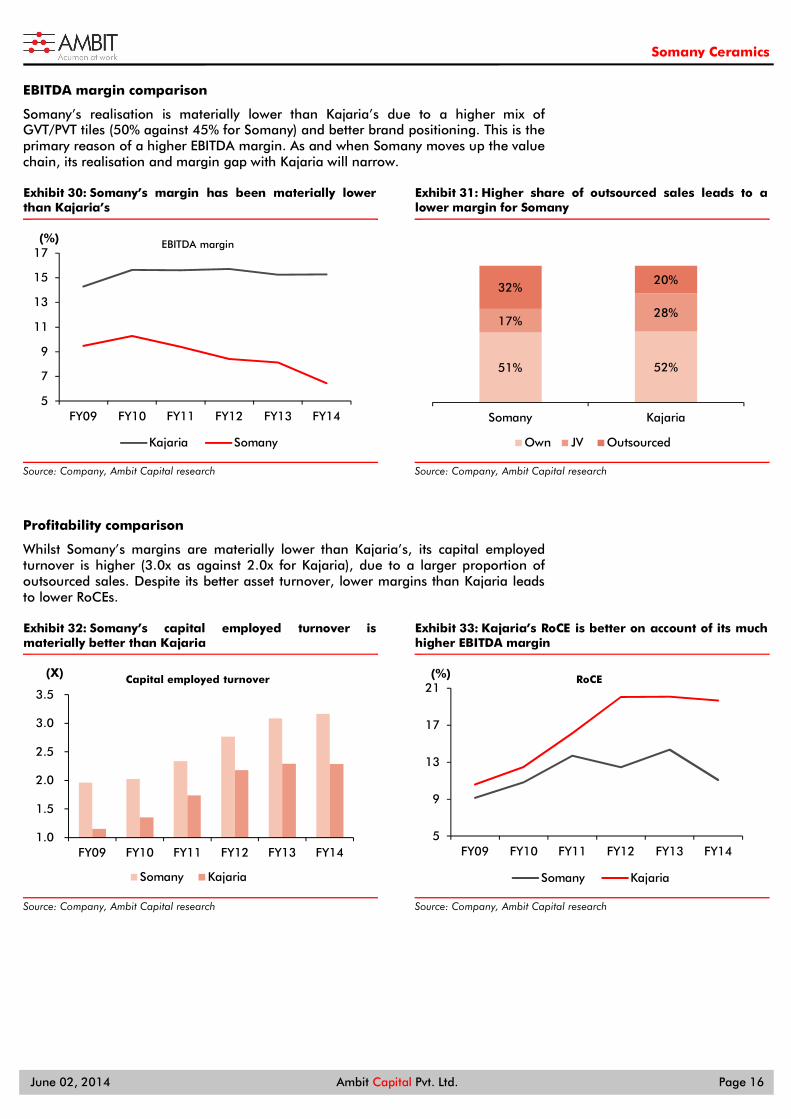
EBITDA margin comparison
Somany’s realisation is materially lower than Kajaria’s due to a higher mix of GVT/PVT tiles (50% against 45% for Somany) and better brand positioning. This is the primary reason of a higher EBITDA margin. As and when Somany moves up the value chain, its realisation and margin gap with Kajaria will narrow.
Exhibit 30: Somany’s margin has been materially lower than Kajaria’s
Source: Company, Ambit Capital research
Exhibit 31: Higher share of outsourced sales leads to a lower margin for Somany
Source: Company, Ambit Capital research
Profitability comparison
Whilst Somany’s margins are materially lower than Kajaria’s, its capital employed turnover is higher (3.0x as against 2.0x for Kajaria), due to a larger proportion of outsourced sales. Despite its better asset turnover, lower margins than Kajaria leads to lower RoCEs.
Exhibit 32: Somany’s capital employed turnover is materially better than Kajaria
Source: Company, Ambit Capital research
Exhibit 33: Kajaria’s RoCE is better on account of its much higher EBITDA margin
Source: Company, Ambit Capital research
5
7
9
11
13
15
17
FY09 FY10 FY11 FY12 FY13 FY14
(%) EBITDA margin
Kajaria Somany
51% 52%
17%28%
32%20%
Somany Kajaria
Own JV Outsourced
1.0
1.5
2.0
2.5
3.0
3.5
FY09 FY10 FY11 FY12 FY13 FY14
(X) Capital employed turnover
Somany Kajaria
5
9
13
17
21
FY09 FY10 FY11 FY12 FY13 FY14
(%) RoCE
Somany Kajaria
Somany Ceramics
June 02, 2014 Ambit Capital Pvt. Ltd. Page 17
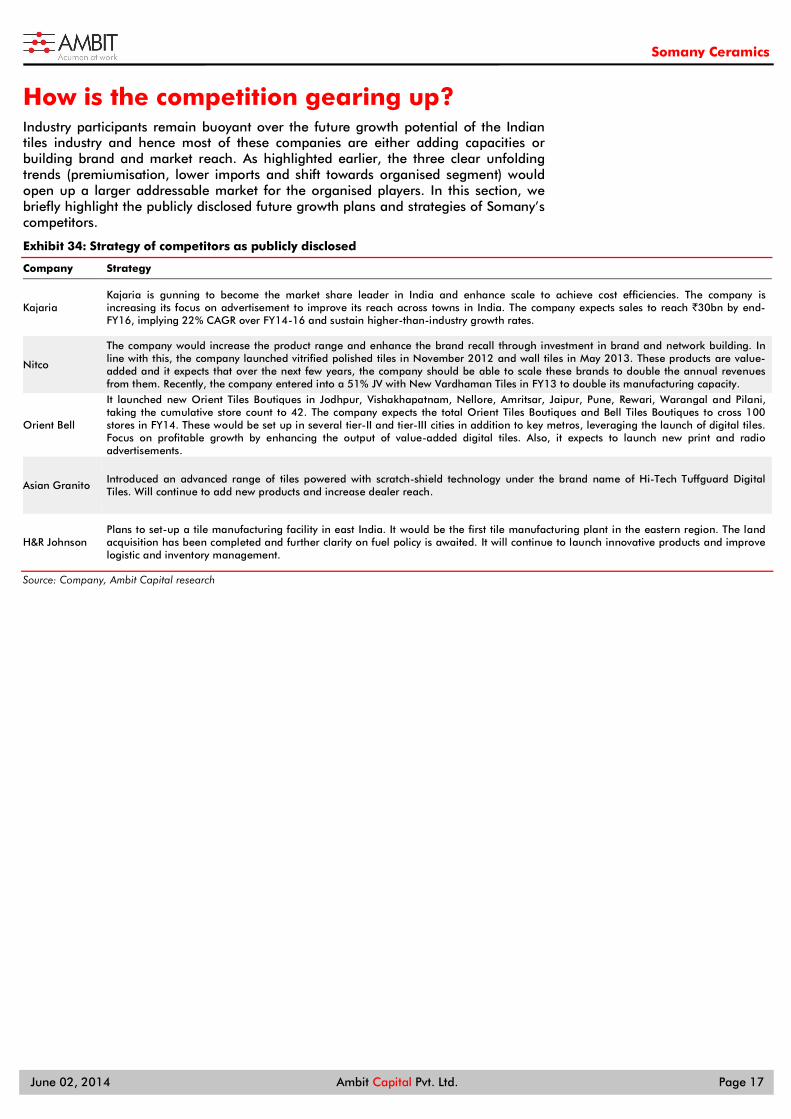
How is the competition gearing up? Industry participants remain buoyant over the future growth potential of the Indian tiles industry and hence most of these companies are either adding capacities or building brand and market reach. As highlighted earlier, the three clear unfolding trends (premiumisation, lower imports and shift towards organised segment) would open up a larger addressable market for the organised players. In this section, we briefly highlight the publicly disclosed future growth plans and strategies of Somany’s competitors.
Exhibit 34: Strategy of competitors as publicly disclosed
Company Strategy
Kajaria Kajaria is gunning to become the market share leader in India and enhance scale to achieve cost efficiencies. The company is increasing its focus on advertisement to improve its reach across towns in India. The company expects sales to reach `30bn by end-FY16, implying 22% CAGR over FY14-16 and sustain higher-than-industry growth rates.
Nitco
The company would increase the product range and enhance the brand recall through investment in brand and network building. In line with this, the company launched vitrified polished tiles in November 2012 and wall tiles in May 2013. These products are value-added and it expects that over the next few years, the company should be able to scale these brands to double the annual revenues from them. Recently, the company entered into a 51% JV with New Vardhaman Tiles in FY13 to double its manufacturing capacity.
Orient Bell
It launched new Orient Tiles Boutiques in Jodhpur, Vishakhapatnam, Nellore, Amritsar, Jaipur, Pune, Rewari, Warangal and Pilani, taking the cumulative store count to 42. The company expects the total Orient Tiles Boutiques and Bell Tiles Boutiques to cross 100 stores in FY14. These would be set up in several tier-II and tier-III cities in addition to key metros, leveraging the launch of digital tiles. Focus on profitable growth by enhancing the output of value-added digital tiles. Also, it expects to launch new print and radio advertisements.
Asian Granito Introduced an advanced range of tiles powered with scratch-shield technology under the brand name of Hi-Tech Tuffguard Digital Tiles. Will continue to add new products and increase dealer reach.
H&R Johnson Plans to set-up a tile manufacturing facility in east India. It would be the first tile manufacturing plant in the eastern region. The land acquisition has been completed and further clarity on fuel policy is awaited. It will continue to launch innovative products and improve logistic and inventory management.
Source: Company, Ambit Capital research
Somany Ceramics
June 02, 2014 Ambit Capital Pvt. Ltd. Page 18
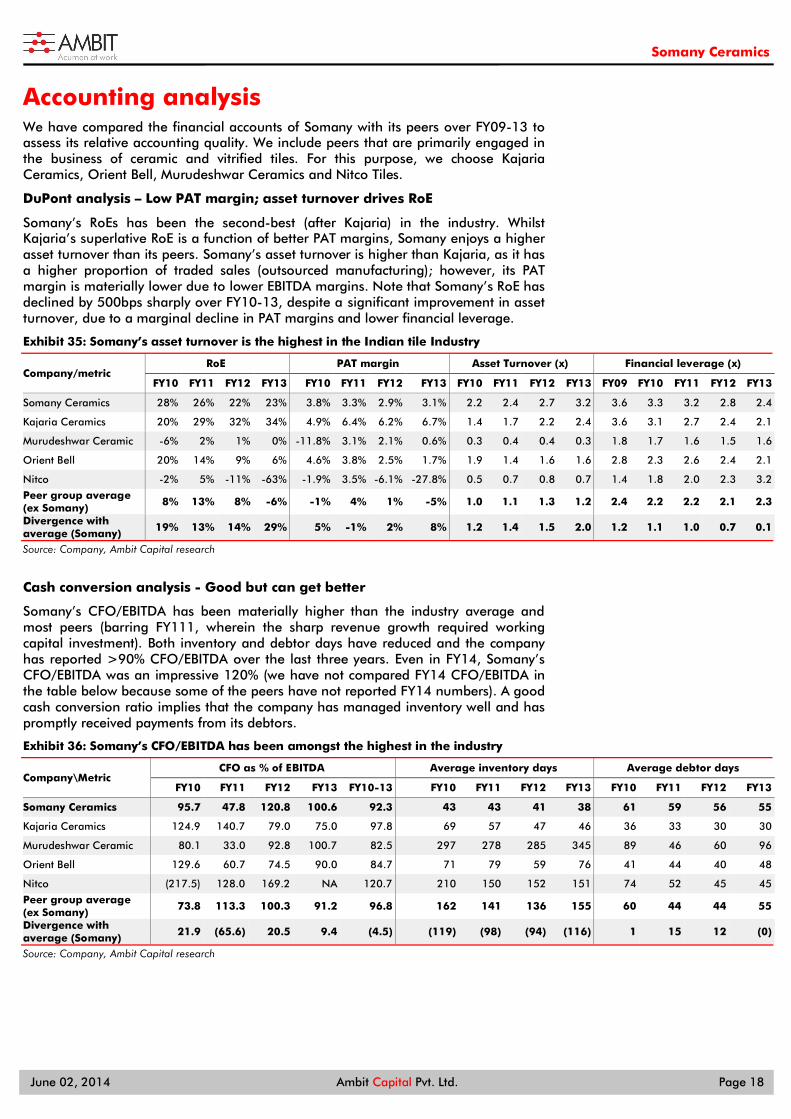
Accounting analysis We have compared the financial accounts of Somany with its peers over FY09-13 to assess its relative accounting quality. We include peers that are primarily engaged in the business of ceramic and vitrified tiles. For this purpose, we choose Kajaria Ceramics, Orient Bell, Murudeshwar Ceramics and Nitco Tiles.
DuPont analysis – Low PAT margin; asset turnover drives RoE
Somany’s RoEs has been the second-best (after Kajaria) in the industry. Whilst Kajaria’s superlative RoE is a function of better PAT margins, Somany enjoys a higher asset turnover than its peers. Somany’s asset turnover is higher than Kajaria, as it has a higher proportion of traded sales (outsourced manufacturing); however, its PAT margin is materially lower due to lower EBITDA margins. Note that Somany’s RoE has declined by 500bps sharply over FY10-13, despite a significant improvement in asset turnover, due to a marginal decline in PAT margins and lower financial leverage.
Exhibit 35: Somany’s asset turnover is the highest in the Indian tile Industry
Company/metric RoE PAT margin Asset Turnover (x) Financial leverage (x)
FY10 FY11 FY12 FY13 FY10 FY11 FY12 FY13 FY10 FY11 FY12 FY13 FY09 FY10 FY11 FY12 FY13
Somany Ceramics 28% 26% 22% 23% 3.8% 3.3% 2.9% 3.1% 2.2 2.4 2.7 3.2 3.6 3.3 3.2 2.8 2.4
Kajaria Ceramics 20% 29% 32% 34% 4.9% 6.4% 6.2% 6.7% 1.4 1.7 2.2 2.4 3.6 3.1 2.7 2.4 2.1
Murudeshwar Ceramic -6% 2% 1% 0% -11.8% 3.1% 2.1% 0.6% 0.3 0.4 0.4 0.3 1.8 1.7 1.6 1.5 1.6
Orient Bell 20% 14% 9% 6% 4.6% 3.8% 2.5% 1.7% 1.9 1.4 1.6 1.6 2.8 2.3 2.6 2.4 2.1
Nitco -2% 5% -11% -63% -1.9% 3.5% -6.1% -27.8% 0.5 0.7 0.8 0.7 1.4 1.8 2.0 2.3 3.2
Peer group average (ex Somany)
8% 13% 8% -6% -1% 4% 1% -5% 1.0 1.1 1.3 1.2 2.4 2.2 2.2 2.1 2.3
Divergence with average (Somany)
19% 13% 14% 29% 5% -1% 2% 8% 1.2 1.4 1.5 2.0 1.2 1.1 1.0 0.7 0.1
Source: Company, Ambit Capital research
Cash conversion analysis - Good but can get better
Somany’s CFO/EBITDA has been materially higher than the industry average and most peers (barring FY111, wherein the sharp revenue growth required working capital investment). Both inventory and debtor days have reduced and the company has reported >90% CFO/EBITDA over the last three years. Even in FY14, Somany’s CFO/EBITDA was an impressive 120% (we have not compared FY14 CFO/EBITDA in the table below because some of the peers have not reported FY14 numbers). A good cash conversion ratio implies that the company has managed inventory well and has promptly received payments from its debtors.
Exhibit 36: Somany’s CFO/EBITDA has been amongst the highest in the industry
Company\Metric CFO as % of EBITDA Average inventory days Average debtor days
FY10 FY11 FY12 FY13 FY10-13 FY10 FY11 FY12 FY13 FY10 FY11 FY12 FY13
Somany Ceramics 95.7 47.8 120.8 100.6 92.3 43 43 41 38 61 59 56 55
Kajaria Ceramics 124.9 140.7 79.0 75.0 97.8 69 57 47 46 36 33 30 30
Murudeshwar Ceramic 80.1 33.0 92.8 100.7 82.5 297 278 285 345 89 46 60 96
Orient Bell 129.6 60.7 74.5 90.0 84.7 71 79 59 76 41 44 40 48
Nitco (217.5) 128.0 169.2 NA 120.7 210 150 152 151 74 52 45 45
Peer group average (ex Somany)
73.8 113.3 100.3 91.2 96.8 162 141 136 155 60 44 44 55
Divergence with average (Somany)
21.9 (65.6) 20.5 9.4 (4.5) (119) (98) (94) (116) 1 15 12 (0)
Source: Company, Ambit Capital research
Somany Ceramics
June 02, 2014 Ambit Capital Pvt. Ltd. Page 19
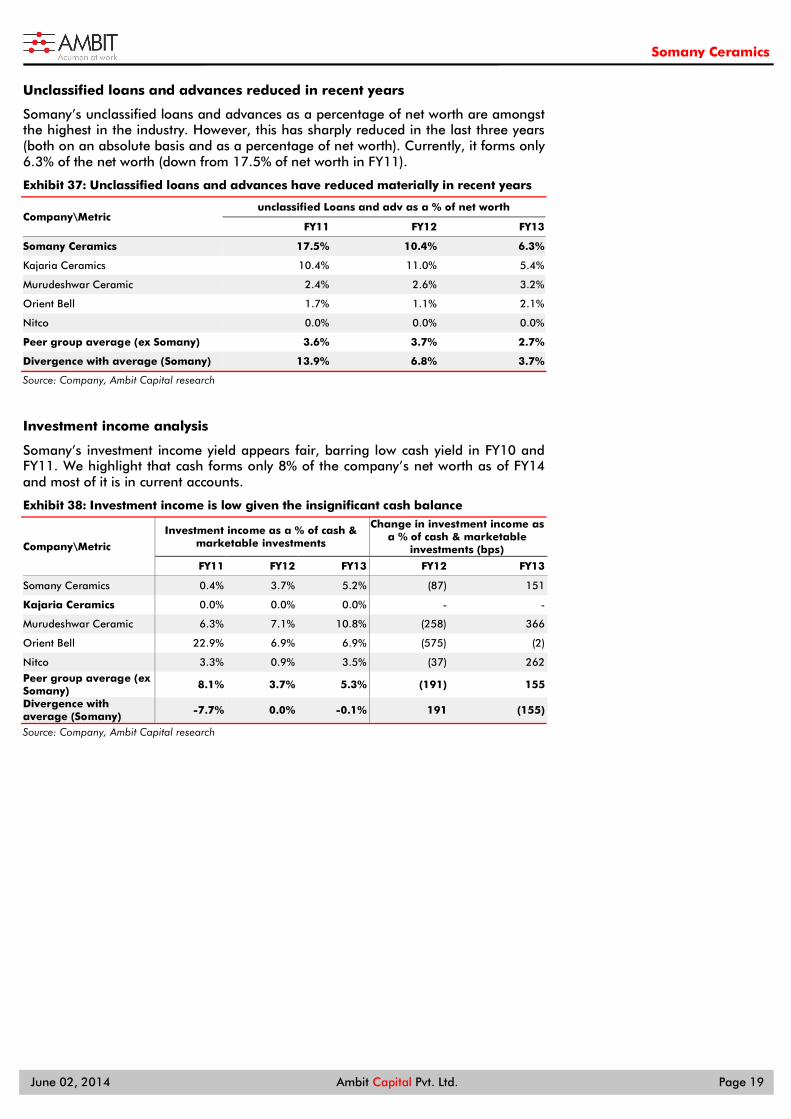
Unclassified loans and advances reduced in recent years
Somany’s unclassified loans and advances as a percentage of net worth are amongst the highest in the industry. However, this has sharply reduced in the last three years (both on an absolute basis and as a percentage of net worth). Currently, it forms only 6.3% of the net worth (down from 17.5% of net worth in FY11).
Exhibit 37: Unclassified loans and advances have reduced materially in recent years
Company\Metric unclassified Loans and adv as a % of net worth
FY11 FY12 FY13
Somany Ceramics 17.5% 10.4% 6.3%
Kajaria Ceramics 10.4% 11.0% 5.4%
Murudeshwar Ceramic 2.4% 2.6% 3.2%
Orient Bell 1.7% 1.1% 2.1%
Nitco 0.0% 0.0% 0.0%
Peer group average (ex Somany) 3.6% 3.7% 2.7%
Divergence with average (Somany) 13.9% 6.8% 3.7%
Source: Company, Ambit Capital research
Investment income analysis
Somany’s investment income yield appears fair, barring low cash yield in FY10 and FY11. We highlight that cash forms only 8% of the company’s net worth as of FY14 and most of it is in current accounts.
Exhibit 38: Investment income is low given the insignificant cash balance
Company\Metric
Investment income as a % of cash & marketable investments
Change in investment income as a % of cash & marketable
investments (bps)
FY11 FY12 FY13 FY12 FY13
Somany Ceramics 0.4% 3.7% 5.2% (87) 151
Kajaria Ceramics 0.0% 0.0% 0.0% - -
Murudeshwar Ceramic 6.3% 7.1% 10.8% (258) 366
Orient Bell 22.9% 6.9% 6.9% (575) (2)
Nitco 3.3% 0.9% 3.5% (37) 262
Peer group average (ex Somany)
8.1% 3.7% 5.3% (191) 155
Divergence with average (Somany)
-7.7% 0.0% -0.1% 191 (155)
Source: Company, Ambit Capital research
Somany Ceramics
June 02, 2014 Ambit Capital Pvt. Ltd. Page 20
Relative valuation Trading at a discount to Kajaria but at a premium to global peers
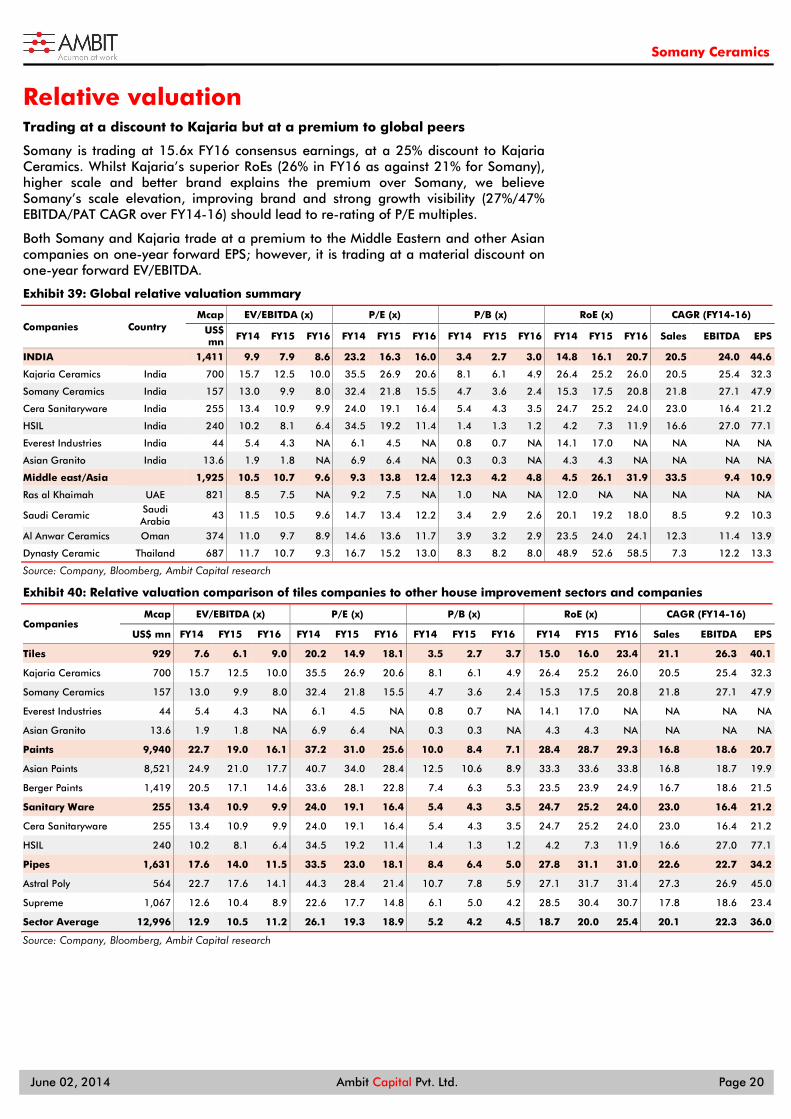
Somany is trading at 15.6x FY16 consensus earnings, at a 25% discount to Kajaria Ceramics. Whilst Kajaria’s superior RoEs (26% in FY16 as against 21% for Somany), higher scale and better brand explains the premium over Somany, we believe Somany’s scale elevation, improving brand and strong growth visibility (27%/47% EBITDA/PAT CAGR over FY14-16) should lead to re-rating of P/E multiples.
Both Somany and Kajaria trade at a premium to the Middle Eastern and other Asian companies on one-year forward EPS; however, it is trading at a material discount on one-year forward EV/EBITDA.
Exhibit 39: Global relative valuation summary
Companies Country Mcap EV/EBITDA (x) P/E (x) P/B (x) RoE (x) CAGR (FY14-16)
US$ mn FY14 FY15 FY16 FY14 FY15 FY16 FY14 FY15 FY16 FY14 FY15 FY16 Sales EBITDA EPS
INDIA
1,411 9.9 7.9 8.6 23.2 16.3 16.0 3.4 2.7 3.0 14.8 16.1 20.7 20.5 24.0 44.6
Kajaria Ceramics India 700 15.7 12.5 10.0 35.5 26.9 20.6 8.1 6.1 4.9 26.4 25.2 26.0 20.5 25.4 32.3
Somany Ceramics India 157 13.0 9.9 8.0 32.4 21.8 15.5 4.7 3.6 2.4 15.3 17.5 20.8 21.8 27.1 47.9
Cera Sanitaryware India 255 13.4 10.9 9.9 24.0 19.1 16.4 5.4 4.3 3.5 24.7 25.2 24.0 23.0 16.4 21.2
HSIL India 240 10.2 8.1 6.4 34.5 19.2 11.4 1.4 1.3 1.2 4.2 7.3 11.9 16.6 27.0 77.1
Everest Industries India 44 5.4 4.3 NA 6.1 4.5 NA 0.8 0.7 NA 14.1 17.0 NA NA NA NA
Asian Granito India 13.6 1.9 1.8 NA 6.9 6.4 NA 0.3 0.3 NA 4.3 4.3 NA NA NA NA
Middle east/Asia 1,925 10.5 10.7 9.6 9.3 13.8 12.4 12.3 4.2 4.8 4.5 26.1 31.9 33.5 9.4 10.9
Ras al Khaimah UAE 821 8.5 7.5 NA 9.2 7.5 NA 1.0 NA NA 12.0 NA NA NA NA NA
Saudi Ceramic Saudi Arabia
43 11.5 10.5 9.6 14.7 13.4 12.2 3.4 2.9 2.6 20.1 19.2 18.0 8.5 9.2 10.3
Al Anwar Ceramics Oman 374 11.0 9.7 8.9 14.6 13.6 11.7 3.9 3.2 2.9 23.5 24.0 24.1 12.3 11.4 13.9
Dynasty Ceramic Thailand 687 11.7 10.7 9.3 16.7 15.2 13.0 8.3 8.2 8.0 48.9 52.6 58.5 7.3 12.2 13.3
Source: Company, Bloomberg, Ambit Capital research
Exhibit 40: Relative valuation comparison of tiles companies to other house improvement sectors and companies
Companies Mcap EV/EBITDA (x) P/E (x) P/B (x) RoE (x) CAGR (FY14-16)
US$ mn FY14 FY15 FY16 FY14 FY15 FY16 FY14 FY15 FY16 FY14 FY15 FY16 Sales EBITDA EPS
Tiles 929 7.6 6.1 9.0 20.2 14.9 18.1 3.5 2.7 3.7 15.0 16.0 23.4 21.1 26.3 40.1
Kajaria Ceramics 700 15.7 12.5 10.0 35.5 26.9 20.6 8.1 6.1 4.9 26.4 25.2 26.0 20.5 25.4 32.3
Somany Ceramics 157 13.0 9.9 8.0 32.4 21.8 15.5 4.7 3.6 2.4 15.3 17.5 20.8 21.8 27.1 47.9
Everest Industries 44 5.4 4.3 NA 6.1 4.5 NA 0.8 0.7 NA 14.1 17.0 NA NA NA NA
Asian Granito 13.6 1.9 1.8 NA 6.9 6.4 NA 0.3 0.3 NA 4.3 4.3 NA NA NA NA
Paints 9,940 22.7 19.0 16.1 37.2 31.0 25.6 10.0 8.4 7.1 28.4 28.7 29.3 16.8 18.6 20.7
Asian Paints 8,521 24.9 21.0 17.7 40.7 34.0 28.4 12.5 10.6 8.9 33.3 33.6 33.8 16.8 18.7 19.9
Berger Paints 1,419 20.5 17.1 14.6 33.6 28.1 22.8 7.4 6.3 5.3 23.5 23.9 24.9 16.7 18.6 21.5
Sanitary Ware 255 13.4 10.9 9.9 24.0 19.1 16.4 5.4 4.3 3.5 24.7 25.2 24.0 23.0 16.4 21.2
Cera Sanitaryware 255 13.4 10.9 9.9 24.0 19.1 16.4 5.4 4.3 3.5 24.7 25.2 24.0 23.0 16.4 21.2
HSIL 240 10.2 8.1 6.4 34.5 19.2 11.4 1.4 1.3 1.2 4.2 7.3 11.9 16.6 27.0 77.1
Pipes 1,631 17.6 14.0 11.5 33.5 23.0 18.1 8.4 6.4 5.0 27.8 31.1 31.0 22.6 22.7 34.2
Astral Poly 564 22.7 17.6 14.1 44.3 28.4 21.4 10.7 7.8 5.9 27.1 31.7 31.4 27.3 26.9 45.0
Supreme 1,067 12.6 10.4 8.9 22.6 17.7 14.8 6.1 5.0 4.2 28.5 30.4 30.7 17.8 18.6 23.4
Sector Average 12,996 12.9 10.5 11.2 26.1 19.3 18.9 5.2 4.2 4.5 18.7 20.0 25.4 20.1 22.3 36.0
Source: Company, Bloomberg, Ambit Capital research

Somany Ceramics
June 02, 2014 Ambit Capital Pvt. Ltd. Page 21
Somany trades at similar valuations to Supreme; at a material discount to Astral
Somany trades at a similar one-year forward P/E multiple to Supreme but at a 25% discount to Astral Poly. Whilst the pipe companies’ profitability is superior to Somany’s, we highlight that the future growth opportunity of Somany is much higher, as the importance of brand and premiumisation is much higher in tiles as compared to pipes.
Tiles vs paints – Palpable similarities Paints and tiles are both part of the overall home improvement/aspirational spend. In our view, the tiles industry’s characteristics are comparable to the paints industry, as: (a) both of them include significant customer association (hence high brand relevance), (b) both of them form a large proportion of the internal housing construction expenditure, (c) they have similar growth drivers (urbanisation, growth in tier II/III cities), and (d) brand building and distribution is the key to a successful franchise.
Exhibit 41: Similarities and differences between tiles and paints
Similarities Differences
Used mainly for internal housing construction/decoration Paints is a matured and a much bigger market as compared to tiles (2x of tiles)
High customer involvement (hence brand has a major relevance) Paints demand is largely driven by replacement (70:30 whereas tile demand is largely first-time users)
High proportion of internal housing expenditure The replacement cycle is much longer for tiles (10 years vs 2-3 years for paints) Branding and distribution network is the main driver of a successful franchise; quality does not play a major role
Unorganised segment is much larger in tiles (50% as compared to 30% in paints)
Market is shifting towards premium products (water-based paints from solvent paints and vitrified tiles from ceramic tiles)
Paint companies can set-up manufacturing units across India; however, tiles companies' plants are centered around raw material sources like ceramic clay and porcelain
Unorganised industry is shrinking as brand consciousness among customers is increasing Growth driven by rising urbanisation, real estate and growth in tier II/III cities Source: Company, Ambit Capital research
Discount to paint companies could narrow in the future
We have compared the valuations of Somany to paint companies like Asian Paints and Berger Paints (see the table in the previous page). Although the business dynamics of the paints industry are comparable to tiles, we believe the size of the tiles industry and especially the leading brands in tiles is too small currently, and hence the high differentials between Kajaria’s valuations and major paints companies.
Somany trades at a 45%/32% discount to Asian Paints/Berger Paints on one-year forward EPS, whilst the paint companies have superior RoEs, higher scale and stronger brands. We believe that the tile companies have fast-growing home improvement products and rising penetration of tiles will keep the future growth buoyant. Kajaria and Somany will benefit the most from the fast-paced growth of the tiles industry, given their strong positioning in terms of market share, brand and reach.
Kajaria and Somany can emulate Asian Paints’ and Berger’s success story in paints We believe that Kajaria and Somany together can command a much higher market share in the Indian tiles Industry, as consolidation rises/unorganised market shrinks and brand and logistics becomes the key to market share gains. A similar trend was seen in the paints industry in the late 90s, when Asian Paints and Berger grew much faster than the industry averages. (The two companies’ combined market share is ~70% currently from ~50% in the early 2000s.)
Somany Ceramics
June 02, 2014 Ambit Capital Pvt. Ltd. Page 22
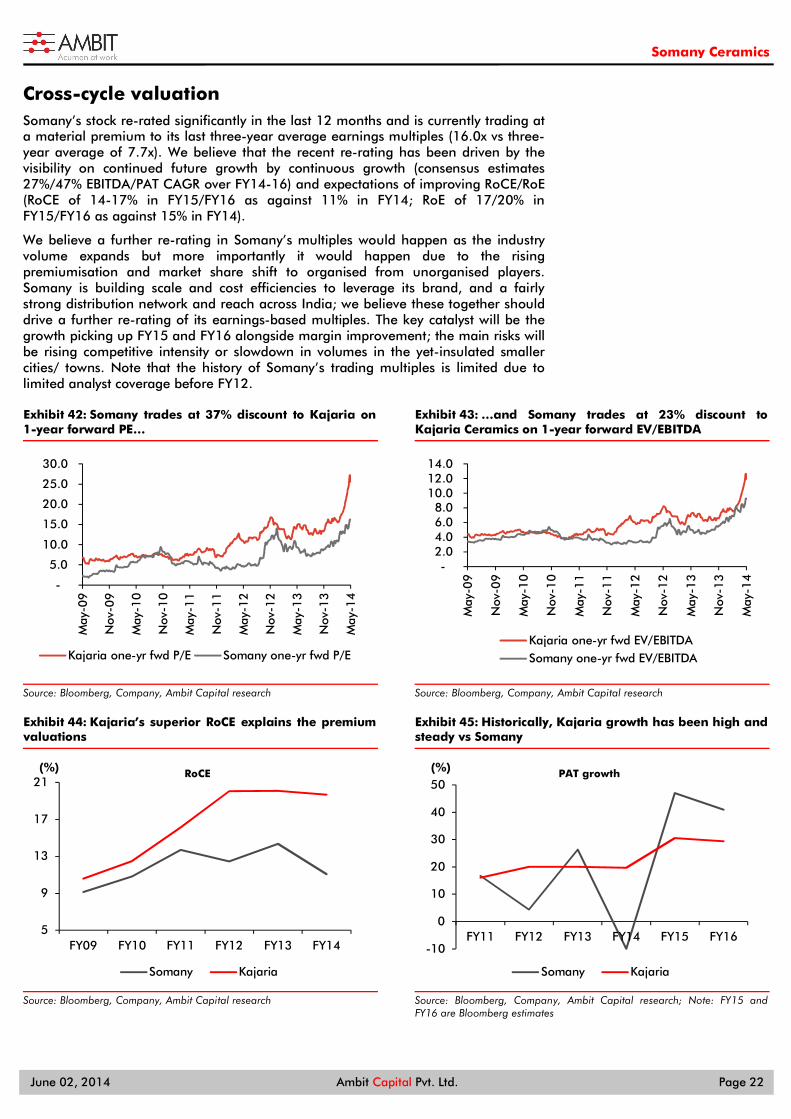
Cross-cycle valuation Somany’s stock re-rated significantly in the last 12 months and is currently trading at a material premium to its last three-year average earnings multiples (16.0x vs three-year average of 7.7x). We believe that the recent re-rating has been driven by the visibility on continued future growth by continuous growth (consensus estimates 27%/47% EBITDA/PAT CAGR over FY14-16) and expectations of improving RoCE/RoE (RoCE of 14-17% in FY15/FY16 as against 11% in FY14; RoE of 17/20% in FY15/FY16 as against 15% in FY14).
We believe a further re-rating in Somany’s multiples would happen as the industry volume expands but more importantly it would happen due to the rising premiumisation and market share shift to organised from unorganised players. Somany is building scale and cost efficiencies to leverage its brand, and a fairly strong distribution network and reach across India; we believe these together should drive a further re-rating of its earnings-based multiples. The key catalyst will be the growth picking up FY15 and FY16 alongside margin improvement; the main risks will be rising competitive intensity or slowdown in volumes in the yet-insulated smaller cities/ towns. Note that the history of Somany’s trading multiples is limited due to limited analyst coverage before FY12.
Exhibit 42: Somany trades at 37% discount to Kajaria on 1-year forward PE…
Source: Bloomberg, Company, Ambit Capital research
Exhibit 43: …and Somany trades at 23% discount to Kajaria Ceramics on 1-year forward EV/EBITDA
Source: Bloomberg, Company, Ambit Capital research
Exhibit 44: Kajaria’s superior RoCE explains the premium valuations
Source: Bloomberg, Company, Ambit Capital research
Exhibit 45: Historically, Kajaria growth has been high and steady vs Somany
Source: Bloomberg, Company, Ambit Capital research; Note: FY15 and FY16 are Bloomberg estimates
-
5.0
10.0
15.0
20.0
25.0
30.0
May
-09
Nov
-09
May
-10
Nov
-10
May
-11
Nov
-11
May
-12
Nov
-12
May
-13
Nov
-13
May
-14
Kajaria one-yr fwd P/E Somany one-yr fwd P/E
- 2.0 4.0 6.0 8.0
10.0 12.0 14.0
May
-09
Nov
-09
May
-10
Nov
-10
May
-11
Nov
-11
May
-12
Nov
-12
May
-13
Nov
-13
May
-14
Kajaria one-yr fwd EV/EBITDASomany one-yr fwd EV/EBITDA
5
9
13
17
21
FY09 FY10 FY11 FY12 FY13 FY14
(%) RoCE
Somany Kajaria
-10
0
10
20
30
40
50
FY11 FY12 FY13 FY14 FY15 FY16
(%) PAT growth
Somany Kajaria
Somany Ceramics
June 02, 2014 Ambit Capital Pvt. Ltd. Page 23
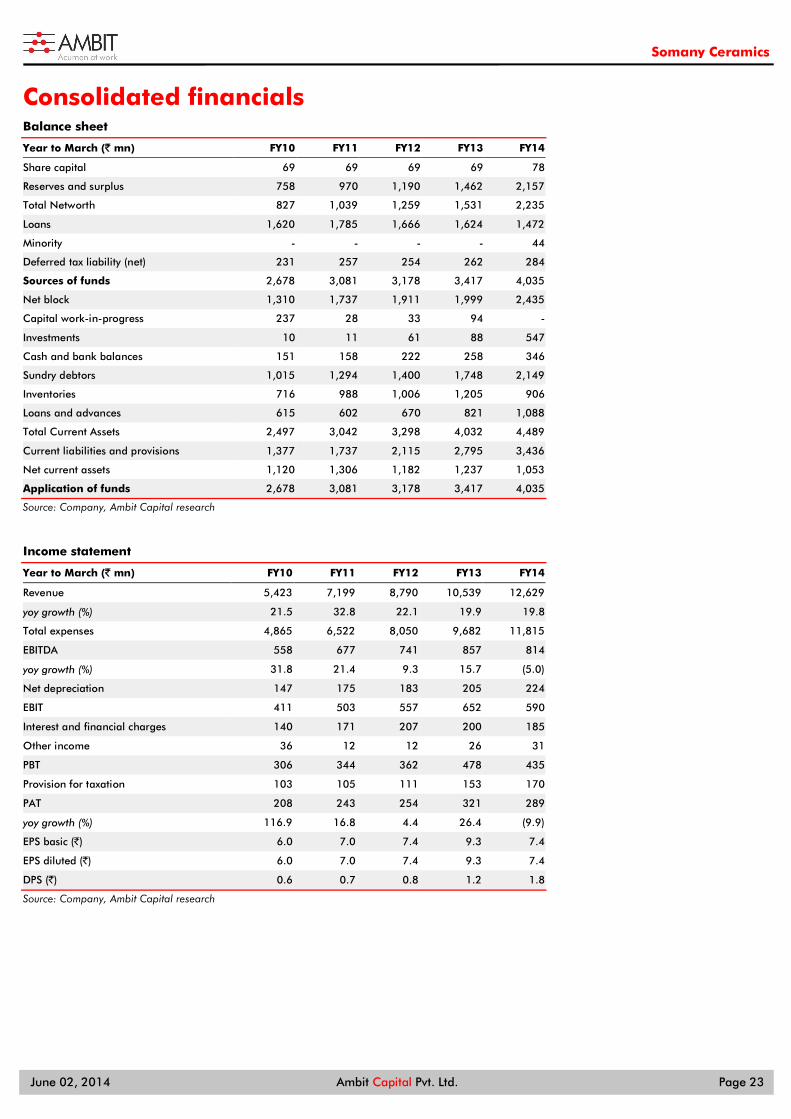
Consolidated financials Balance sheet
Year to March (` mn) FY10 FY11 FY12 FY13 FY14
Share capital 69 69 69 69 78
Reserves and surplus 758 970 1,190 1,462 2,157
Total Networth 827 1,039 1,259 1,531 2,235
Loans 1,620 1,785 1,666 1,624 1,472
Minority - - - - 44
Deferred tax liability (net) 231 257 254 262 284
Sources of funds 2,678 3,081 3,178 3,417 4,035
Net block 1,310 1,737 1,911 1,999 2,435
Capital work-in-progress 237 28 33 94 -
Investments 10 11 61 88 547
Cash and bank balances 151 158 222 258 346
Sundry debtors 1,015 1,294 1,400 1,748 2,149
Inventories 716 988 1,006 1,205 906
Loans and advances 615 602 670 821 1,088
Total Current Assets 2,497 3,042 3,298 4,032 4,489
Current liabilities and provisions 1,377 1,737 2,115 2,795 3,436
Net current assets 1,120 1,306 1,182 1,237 1,053
Application of funds 2,678 3,081 3,178 3,417 4,035
Source: Company, Ambit Capital research
Income statement
Year to March (` mn) FY10 FY11 FY12 FY13 FY14
Revenue 5,423 7,199 8,790 10,539 12,629
yoy growth (%) 21.5 32.8 22.1 19.9 19.8
Total expenses 4,865 6,522 8,050 9,682 11,815
EBITDA 558 677 741 857 814
yoy growth (%) 31.8 21.4 9.3 15.7 (5.0)
Net depreciation 147 175 183 205 224
EBIT 411 503 557 652 590
Interest and financial charges 140 171 207 200 185
Other income 36 12 12 26 31
PBT 306 344 362 478 435
Provision for taxation 103 105 111 153 170
PAT 208 243 254 321 289
yoy growth (%) 116.9 16.8 4.4 26.4 (9.9)
EPS basic (`) 6.0 7.0 7.4 9.3 7.4
EPS diluted (`) 6.0 7.0 7.4 9.3 7.4
DPS (`) 0.6 0.7 0.8 1.2 1.8
Source: Company, Ambit Capital research

Somany Ceramics
June 02, 2014 Ambit Capital Pvt. Ltd. Page 24
Cash flow statement
Year to March (` mn) FY10 FY11 FY12 FY13 FY14
PBT 306 344 364 478 435
Depreciation 147 175 183 205 224
Others 6 (2) 9 (6) 24
Interest paid 134 180 199 184 185
CFO before change in WC 594 696 755 861 868
Change in working capital (60) (373) 141 1 272
Direct taxes paid (120) (88) (110) (155) (170)
CFO 414 235 786 707 970
Net capex (462) (346) (311) (377) (660)
Net investments (3) 2 (43) (19) (459)
CFI (464) (344) (353) (396) (1,120)
Proceeds from borrowings 256 318 (136) (42) 152
Change in share capital - - - - 415
Interest & finance charges paid (140) (184) (205) (202) (185)
Dividends paid (12) (24) (28) (32) (48)
CFF 103 110 (369) (276) 237
Net increase in cash 53 1 64 36 88
FCF (48) (111) 476 330 310
Source: Company, Ambit Capital research
Ratio analysis
Year to March FY10 FY11 FY12 FY13 FY14
Revenue growth 21.5 32.8 22.1 19.9 19.8
EBITDA growth 31.8 21.4 9.3 15.7 (5.0)
PAT growth 116.9 16.8 4.4 26.4 (9.9)
EPS norm (dil) growth 116.9 16.8 4.4 26.4 (9.9)
EBITDA margin 10.3 9.4 8.4 8.1 6.4
EBIT margin 7.6 7.0 6.3 6.2 4.7
Net margin 3.8 3.4 2.9 3.0 2.3
Dividend Payout (%) 10.0 9.9 10.9 12.9 24.2
RoCE 10.8 13.7 12.5 14.4 11.0
RoIC 11.8 13.7 13.6 15.9 13.0
RoE 28.2 26.0 22.1 23.0 15.2
Gross Block Turnover (X) 1.8 2.0 2.3 2.6 2.7
Working capital Turnover (X) 2.0 2.3 2.8 3.1 3.1
Source: Company, Ambit Capital research
Valuation parameters
Year to March FY10 FY11 FY12 FY13 FY14
P/E (x) 39.0 33.4 31.9 25.3 31.6
P/B(x) 9.8 7.8 6.4 5.3 4.0
Debt/Equity(x) 2.0 1.7 1.3 1.1 0.6
Net debt/Equity(x) 1.8 1.6 1.1 0.8 0.3
EV/Sales(x) 2.0 1.5 1.2 1.0 0.8
EV/EBITDA(x) 19.0 15.9 14.3 12.2 12.6
Source: Company, Ambit Capital research
Somany Ceramics
June 02, 2014 Ambit Capital Pvt. Ltd. Page 25
Institutional Equities Team
Saurabh Mukherjea, CFA CEO, Institutional Equities (022) 30433174 [email protected]
Research
Analysts Industry Sectors Desk-Phone E-mail
Nitin Bhasin - Head of Research E&C / Infrastructure / Cement (022) 30433241 [email protected]
Aadesh Mehta Banking / Financial Services (022) 30433239 [email protected]
Achint Bhagat Cement / Infrastructure (022) 30433178 [email protected]
Aditya Khemka Healthcare (022) 30433272 [email protected]
Akshay Wadhwa Banking & Financial Services (022) 30433005 [email protected] Ashvin Shetty, CFA Automobile (022) 30433285 [email protected]
Bhargav Buddhadev Power / Capital Goods (022) 30433252 [email protected]
Dayanand Mittal, CFA Oil & Gas / Metals & Mining (022) 30433202 [email protected]
Deepesh Agarwal Power / Capital Goods (022) 30433275 [email protected] Gaurav Mehta, CFA Strategy / Derivatives Research (022) 30433255 [email protected]
Karan Khanna Strategy (022) 30433251 [email protected]
Krishnan ASV Real Estate (022) 30433205 [email protected]
Nitin Jain Technology (022) 30433291 [email protected]
Pankaj Agarwal, CFA Banking / Financial Services (022) 30433206 [email protected]
Pratik Singhania Retail (022) 30433264 [email protected]
Parita Ashar Metals & Mining / Oil & Gas (022) 30433223 [email protected]
Rakshit Ranjan, CFA Consumer / Retail (022) 30433201 [email protected]
Ravi Singh Banking / Financial Services (022) 30433181 [email protected]
Ritesh Vaidya Consumer (022) 30433246 [email protected] Ritika Mankar Mukherjee, CFA Economy / Strategy (022) 30433175 [email protected]
Ritu Modi Automobile (022) 30433292 [email protected]
Tanuj Mukhija, CFA E&C / Infrastructure (022) 30433203 [email protected]
Sales
Name Regions Desk-Phone E-mail
Sarojini Ramachandran - Head of Sales UK +44 (0) 20 7614 8374 [email protected]
Deepak Sawhney India / Asia (022) 30433295 [email protected]
Dharmen Shah India / Asia (022) 30433289 [email protected]
Dipti Mehta India / USA (022) 30433053 [email protected]
Nityam Shah, CFA USA / Europe (022) 30433259 [email protected]
Parees Purohit, CFA UK / USA (022) 30433169 [email protected]
Praveena Pattabiraman India / Asia (022) 30433268 [email protected]
Production
Sajid Merchant Production (022) 30433247 [email protected]
Sharoz G Hussain Production (022) 30433183 [email protected]
Joel Pereira Editor (022) 30433284 [email protected]
Nikhil Pillai Database (022) 30433265 [email protected]
E&C = Engineering & Construction
Somany Ceramics
June 02, 2014 Ambit Capital Pvt. Ltd. Page 26
Explanation of Investment Rating
Investment Rating Expected return
(over 12-month period from date of initial rating)
Buy >5%
Sell <5%
Disclaimer
This report or any portion hereof may not be reprinted, sold or redistributed without the written consent of Ambit Capital. AMBIT Capital Research is disseminated and available primarily electronically, and, in some cases, in printed form.
Additional information on recommended securities is available on request.
Disclaimer 1. AMBIT Capital Private Limited (“AMBIT Capital”) and its affiliates are a full service, integrated investment banking, investment advisory and brokerage group. AMBIT Capital is a Stock Broker, Portfolio
Manager and Depository Participant registered with Securities and Exchange Board of India Limited (SEBI) and is regulated by SEBI 2. The recommendations, opinions and views contained in this Research Report reflect the views of the research analyst named on the Research Report and are based upon publicly available information
and rates of taxation at the time of publication, which are subject to change from time to time without any prior notice. 3. AMBIT Capital makes best endeavours to ensure that the research analyst(s) use current, reliable, comprehensive information and obtain such information from sources which the analyst(s) believes to
be reliable. However, such information has not been independently verified by AMBIT Capital and/or the analyst(s) and no representation or warranty, express or implied, is made as to the accuracy or completeness of any information obtained from third parties. The information or opinions are provided as at the date of this Research Report and are subject to change without notice.
4. If you are dissatisfied with the contents of this complimentary Research Report or with the terms of this Disclaimer, your sole and exclusive remedy is to stop using this Research Report and AMBIT Capital shall not be responsible and/ or liable in any manner.
5. If this Research Report is received by any client of AMBIT Capital or its affiliate, the relationship of AMBIT Capital/its affiliate with such client will continue to be governed by the terms and conditions in place between AMBIT Capital/ such affiliate and the client.
6. This Research Report is issued for information only and should not be construed as an investment advice to any recipient to acquire, subscribe, purchase, sell, dispose of, retain any securities. Recipients should consider this Research Report as only a single factor in making any investment decisions. This Research Report is not an offer to sell or the solicitation of an offer to purchase or subscribe for any investment or as an official endorsement of any investment.
7. If 'Buy', 'Sell', or 'Hold' recommendation is made in this Research Report such recommendation or view or opinion expressed on investments in this Research Report is not intended to constitute investment advice and should not be intended or treated as a substitute for necessary review or validation or any professional advice. The views expressed in this Research Report are those of the research analyst which are subject to change and do not represent to be an authority on the subject. AMBIT Capital may or may not subscribe to any and/ or all the views expressed herein.
8. AMBIT Capital makes no guarantee, representation or warranty, express or implied; and accepts no responsibility or liability as to the accuracy or completeness or currentess of the information in this Research Report. AMBIT Capital or its affiliates do not accept any liability whatsoever for any direct or consequential loss howsoever arising, directly or indirectly, from any use of this Research Report.
9. Past performance is not necessarily a guide to evaluate future performance. 10. AMBIT Capital and/or its affiliates (as principal or on behalf of its/their clients) and their respective officers directors and employees may hold positions in any securities mentioned in this Research
Report (or in any related investment) and may from time to time add to or dispose of any such securities (or investment). Such positions in securities may be contrary to or inconsistent with this Research Report.
11. This Research Report should be read and relied upon at the sole discretion and risk of the recipient. 12. The value of any investment made at your discretion based on this Research Report or income therefrom may be affected by changes in economic, financial and/ or political factors and may go down as
well as up and you may not get back the full or the expected amount invested. Some securities and/ or investments involve substantial risk and are not suitable for all investors. 13. This Research Report is being supplied to you solely for your information and may not be reproduced, redistributed or passed on, directly or indirectly, to any other person or published, copied in whole
or in part, for any purpose. Neither this Research Report nor any copy of it may be taken or transmitted or distributed, directly or indirectly within India or into any other country including United States (to US Persons), Canada or Japan or to any resident thereof. The distribution of this Research Report in other jurisdictions may be strictly restricted and/ or prohibited by law or contract, and persons into whose possession this Research Report comes should inform themselves about such restriction and/ or prohibition, and observe any such restrictions and/ or prohibition.
14. Neither AMBIT Capital nor its affiliates or their respective directors, employees, agents or representatives, shall be responsible or liable in any manner, directly or indirectly, for views or opinions expressed in this Report or the contents or any errors or discrepancies herein or for any decisions or actions taken in reliance on the Report or inability to use or access our service or this Research Report or for any loss or damages whether direct or indirect, incidental, special or consequential including without limitation loss of revenue or profits that may arise from or in connection with the use of or reliance on this Research Report or inability to use or access our service or this Research Report.
Conflict of Interests 15. In the normal course of AMBIT Capital’s business circumstances may arise that could result in the interests of AMBIT Capital conflicting with the interests of clients or one client’s interests conflicting with
the interest of another client. AMBIT Capital makes best efforts to ensure that conflicts are identified and managed and that clients’ interests are protected. AMBIT Capital has policies and procedures in place to control the flow and use of non-public, price sensitive information and employees’ personal account trading. Where appropriate and reasonably achievable, AMBIT Capital segregates the activities of staff working in areas where conflicts of interest may arise. However, clients/potential clients of AMBIT Capital should be aware of these possible conflicts of interests and should make informed decisions in relation to AMBIT Capital’s services.
16. AMBIT Capital and/or its affiliates may from time to time have investment banking, investment advisory and other business relationships with companies covered in this Research Report and may receive compensation for the same. Research analysts provide important inputs into AMBIT Capital’s investment banking and other business selection processes.
17. AMBIT Capital and/or its affiliates may seek investment banking or other businesses from the companies covered in this Research Report and research analysts involved in preparing this Research Report may participate in the solicitation of such business.
18. In addition to the foregoing, the companies covered in this Research Report may be clients of AMBIT Capital where AMBIT Capital may be required, inter alia, to prepare and publish research reports covering such companies and AMBIT Capital may receive compensation from such companies in relation to such services. However, the views reflected in this Research Report are objective views, independent of AMBIT Capital’s relationship with such company.
19. In addition, AMBIT Capital may also act as a market maker or risk arbitrator or liquidity provider or may have assumed an underwriting commitment in the securities of companies covered in this Research Report (or in related investments) and may also be represented in the supervisory board or on any other committee of those companies.
Additional Disclaimer for U.S. Persons 20. The research report is solely a product of AMBIT Capital 21. AMBIT Capital is the employer of the research analyst(s) who has prepared the research report 22. Any subsequent transactions in securities discussed in the research reports should be effected through J.P.P. Euro-Securities, Inc. (“JPP”). 23. JPP does not accept or receive any compensation of any kind for the dissemination of the AMBIT Capital research reports. 24. The research analyst(s) preparing the research report is resident outside the United States and is/are not associated persons of any U.S. regulated broker-dealer and that therefore the analyst(s) is/are
not subject to supervision by a U.S. broker-dealer, and is/are not required to satisfy the regulatory licensing requirements of FINRA or required to otherwise comply with U.S. rules or regulations regarding, among other things, communications with a subject company, public appearances and trading securities held by a research analyst account.
Additional Disclaimer for Canadian Persons 25. AMBIT Capital is not registered in the Province of Ontario and /or Province of Québec to trade in securities nor is it registered in the Province of Ontario and /or Province of Québec to provide advice
with respect to securities. 26. AMBIT Capital's head office or principal place of business is located in India. 27. All or substantially all of AMBIT Capital's assets may be situated outside of Canada. 28. It may be difficult for enforcing legal rights against AMBIT Capital because of the above. 29. Name and address of AMBIT Capital's agent for service of process in the Province of Ontario is: Torys LLP, 79 Wellington St. W., 30th Floor, Box 270, TD South Tower, Toronto, Ontario M5K 1N2
Canada. 30. Name and address of AMBIT Capital's agent for service of process in the Province of Montréal is Torys Law Firm LLP, 1 Place Ville Marie, Suite 1919 Montréal, Québec H3B 2C3 Canada.
© Copyright 2014 AMBIT Capital Private Limited. All rights reserved.
Ambit Capital Pvt. Ltd. Ambit House, 3rd Floor 449, Senapati Bapat Marg, Lower Parel, Mumbai 400 013, India. Phone: +91-22-3043 3000 Fax: +91-22-3043 3100 CIN: U74140MH1997PTC107598 www.ambitcapital.com