Embed Size (px)
Citation preview
Confidential
PREFACE
Agrifood Consulting International
TA 7762-NEP Preparation of the
Agricultural Development Strategy (ADS)
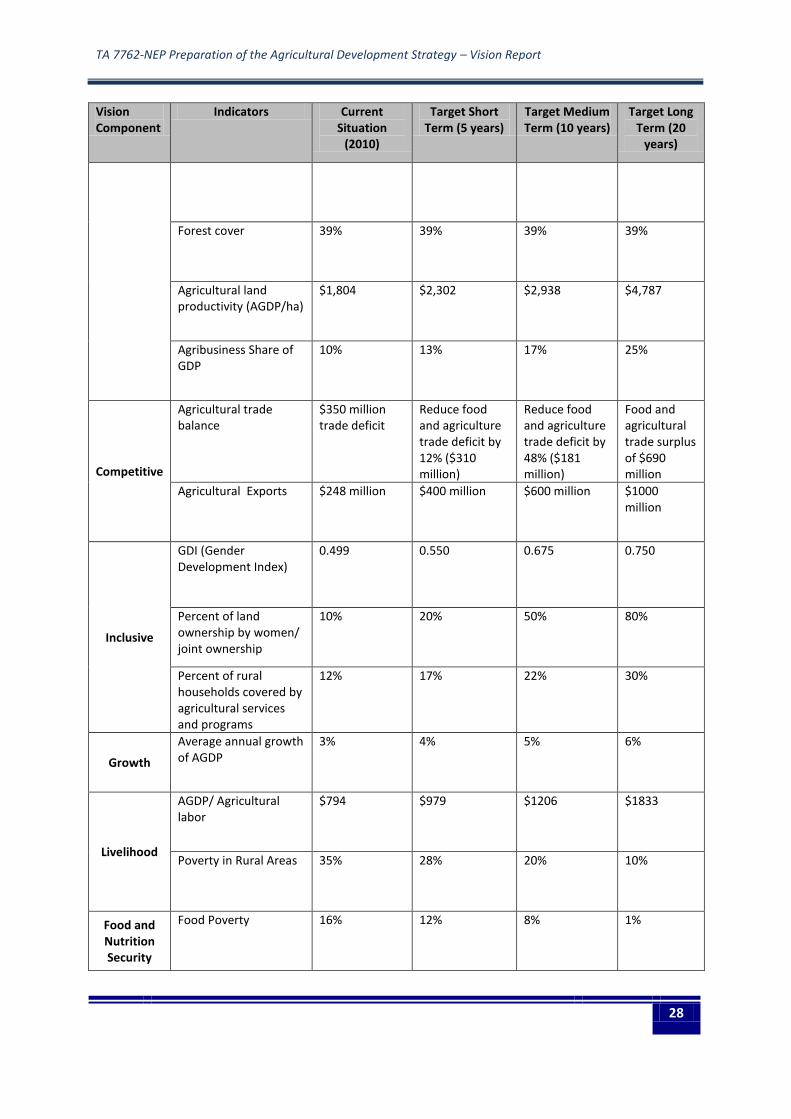
Vision Report
Prepared for
Government of Nepal
With the support of
ADB, IFAD, EU, FAO, SDC, JICA, WFP, USAID, DANIDA, World Bank,
DfID, and AusAID
Kathmandu, 19 December 2012
Dec 2012

TA 7762-NEP Preparation of the Agricultural Development Strategy – Vision Report
i
PREFACE This document1 is the Vision Report for the Asian Development Bank’s Technical Assistance (TA) No. 7762-NEP on Preparation of the Agricultural Development Strategy. The Vision Report draws upon the consultations and analytical work conducted by the TA Team of consultants in collaboration with senior officers from Ministry of Agriculture Development. The report takes into account the consultations held with numerous stakeholders including the participants to the Regional Workshops in Biratnagar (3 November 2011), Butwal (6 November 2011), and Nepalganj (9 November 2011); the ADS Conference held in Kathmandu on 29 November 2011; the Vision Workshop held in Kathmandu on 30 November 2011; the comments by the Ministry of Agriculture Development, Asian Development Bank, and IFAD; the reviews from other ministries (Environment, Land) and National Planning Commission; and extensive consultation with Farmer Organizations representatives from the Peasants’ Coalition. The views presented in the report are the responsibility of the TA Team and do not necessarily reflect the view of the Government of Nepal, Asian Development Bank, IFAD, and other supporting agencies. Francesco Goletti TA 7762-NEP Team Leader and Policy and Institutional Specialist Agrifood Consulting International, Inc. (ACI) Kathmandu, 19 December 2012
1 To be referred to as “ADB 7762-NEP (2011) Vision Report. Technical Assistance for the Preparation of the
Agricultural Development Strategy, Asian Development Bank, December 2012”.

TA 7762-NEP Preparation of the Agricultural Development Strategy – Vision Report
ii
CONTRIBUTORS TO THE VISION REPORT Anil Raj Bhattarai, Agriculture Insurance Specialist Bhushan Shah, Agricultural Value Chain Specialist Chris Landon-Lane, Agriculture Economist Dala Ram Pradhan, Livestock Specialist David Tansey, Tax Specialist Deep Swar, Fishery Specialist Deepak Lochan Adhikari, Micro Irrigation Specialist Dina Mani Pokharel, Legislation and Regulation Specialist in Food Safety and Quality Francesco Goletti, Team Leader and Policy and Institutional Specialist Govind Das Shrestha, Legislation and Regulation Specialist in Governance Institution and Planning Grant Vinning, Agricultural Value Chain and Marketing Specialist Indra Lal Kalu, Irrigation Specialist Jagadish Chandra Gautam, Agri Economist Jitzchak Alster, Legislation and Regulation Specialist John Mellor, Eminent Person Jon Cook, Irrigated Agriculture and Water Resources Specialist Keith Chapman, Agriculture and Agribusiness Specialist Madan Kumar Dahal, Tax Specialist Matrika Prasad Maraseni, Legislation and Regulation Specialist in Commerce and Trade Michael Lloyd, Rural Finance Specialist Narendra Raj Khanal, Environment, Climate Change and Natural Resources Management Specialist Nav Raj Baral, Forestry Specialist Neeraj Joshi, Social Development Specialist Neeranjan Rajbhandari, Field Crops Specialist Posh Raj Pandey, Trade Specialist Prakash Mani Sharma, Legislation and Regulation Specialist in Natural Resources Purna Man Shakya, Legislation and Regulation Specialist in Public Enterprise Reform Purushottam Mainali, Deputy Team Leader and Policy and Institutional Specialist Ratna Dhwoj Shahi, Horticulture Specialist Shabnam Shivakoti, Senior Agriculture Officer, MOAD Shuva Kantha Sharma, Rural Infrastructure Specialist Surya Poudel, Senior Livestock Development Officer, MOAD Yamuna Ghale, Research and Extension Specialist

TA 7762-NEP Preparation of the Agricultural Development Strategy – Vision Report
iii
TABLE OF CONTENTS
SUMMARY 1
1 INTRODUCTION 4
1.1 Organization of the Vision Report 4
2 FUTURE TRENDS AFFECTING THE AGRICULTURAL SECTOR IN NEPAL 5
2.1 Introduction 5
2.2 Agricultural Transformation 5
2.3 Main Lessons from the Review of Agricultural Transformation 7
2.4 Implications of the Lessons from Agricultural Transformation for the ADS 14
2.5 Future Trends and Their Relevance for the Food and Agricultural Sector 15
2.6 Baseline and Scenarios 18
3 VISION FOR AGRICULTURAL SECTOR IN NEPAL 21
3.1 Introduction 21
3.2 Vision Statement 21
3.3 Slogan 21
3.4 Key Elements of the Vision 21
3.5 Targets and Indicators 26
APPENDIX 1. THE ADS PREPARATION IN BRIEF 29
APPENDIX 2. ADS WORK PLAN 30
APPENDIX 3. DEVELOPMENT PARTNERS AND THE ADS 32
APPENDIX 4. FOOD SOVEREIGNTY 33
APPENDIX 5. EXAMPLES OF VISION STATEMENTS 40
APPENDIX 6. S.M.A.R.T. GOALS 43

TA 7762-NEP Preparation of the Agricultural Development Strategy – Vision Report
iv
LIST OF TABLES Table 1 Differents Options for Increasing Value of Agricultural Production .......................................... 7 Table 2 Baseline and Scenarios for Agricultural Sector ........................................................................ 19 Table 3 Preliminary Indicators and Targets for ADS Vision .................................................................. 26
LIST OF FIGURES Figure 1 Share of Agriculture in GDP and Labor as GDP/capita increases .............................................. 6 Figure 2 Analytics of the Process of Agricultural Transformation .......................................................... 6 Figure 3 Agricultural Output and TFP Growth (1961-2007) .................................................................... 9 Figure 4 Increasing TFP Contribution to Agricultural Growth in Asia ..................................................... 9 Figure 5 Public Agricultural Research Expenditures as % of GDP (1981-2000) .................................... 10 Figure 6 Key Elements of a Value Chain ................................................................................................ 12 Figure 7 Smallholders in Indonesia Integrated with Supermarkets ...................................................... 13 Figure 8 Relation between GDP per capita and Agriculture and Agribusiness GDP ............................. 14 Figure 9 Four lessons from Agricultural Transformation ...................................................................... 15 Figure 10: Agricultural labor force ........................................................................................................ 15
LIST OF BOXES Box 1 Inequality and Poverty ................................................................................................................ 11
TA 7762-NEP Preparation of the Agricultural Development Strategy – Vision Report
v
ABBREVIATIONS ACI Agrifood Consulting International ADB Asian Development Bank ADBN Agriculture Development Bank Nepal AGDP Agricultural Gross Domestic Product AIC Agricultural Inputs Corporation AICL Agricultural Inputs Company Limited AoA Agreement on Agriculture APP Agriculture Perspective Plan APP-IAP APP Implementation Action Plan APP-ISR APP Implementation Status Review APPMAU APP Monitoring and Analytical Unit APPSP Agriculture Perspective Plan Support Programme AR Agricultural Roads ARSs Agricultural Research Stations ASCs Agriculture Service Centers ASPR Agriculture Sector Performance Review AusAID Australian Agency for International Development BA Bangkok Agreement BIMST-EC Bengal Initiative for Multi-sectoral Technical and Economic Co-operation BISEP-ST Biodiversity Sector Support Programme – Siwalik Terai BMI Body Mass Index BSP Biogas Support Programme CADIC Central Agriculture Development Implementation Committee CBOs Community Based Organizations CBS Central Bureau of Statistics CDO Chief District Officers CDR Central Development Regions CF Community Forestry CGISP Community Groundwater Irrigation Sector Project CGS Competitive Grant System CLDP Community Livestock Development Project CPI Consumer Price Index DADC District Agricultural Development Committee DADOs District Agriculture Development Office/Officer DDC District Development Committee DDCN Dairy Development Corporation Nepal DFCC District Forest co-ordination Committee DFID UK Department for International Development DFO District Forest Officer DLS Department of Livestock Services DLSO District Livestock Office DOA Department of Agriculture DOF Department of Forests DOI Department of Irrigation DOLIDAR Department of Local Infrastructure Development and Agricultural Roads DOLS Department of Livestock Services DOSTAMI Department of Shallow Tube Well and Minor Irrigation DRR Disaster Risk Reduction DRRM Disaster Risk Reduction and Management DSCW Department of Soil and Water Conservation DTO District Technical Office DTWs Deep Tube Wells EA Executing Agency

TA 7762-NEP Preparation of the Agricultural Development Strategy – Vision Report
vi
EDR Eastern Development Regions EIA Environmental Impact Assessment EU European Union FAO Food and Agriculture Organization FCO Fertiliser Control Order, 1999 FECOFUN Federation of Community Forestry User Groups Nepal's FFE Food for Education FFW Food for Work FG Farmer’s Group FIs Fertilizer Inspectors FSN Food Security and Nutrition FTA Free Trade Area FU Fertilizer Unit FWDR Far Western Development Regions FY Fiscal Year GAP Government Action Plan GATT General Agreements on Tariffs and Trade GDP Gross Domestic Product GEED Gender Equity and Environment Division GI Geographical Identification GO Government Organizations GON Government of Nepal GTZ Gesellschaft für Technische Zusammenarbeit, GmbH ha hectare HARP Hill Agriculture Research Project HIV/AIDS Human Immunodeficiency Virus/Acquired Immune Deficiency Syndrome HLTF High Level Task Force HMGN His Majesty Government of Nepal HRD Human resources development HRM Human resources management HRP Hill Research Programme HVCA Hazard, Vulnerability and Capacity Assessment HVCs High Value Commodities IAPP Interim Agriculture Perspective Plan IAU Independent Analytical Unit ICT Information and Communication Technologies IDA Iron Deficiency Anemia IDD Iodine Deficiency Disorder IEE Initial Environmental Examination IFAD International Fund for Agriculture Development INGO International Non Government Organizations IP Irrigation Policy IPC Integrated Food Security Phase Classification IPM Integrated Pest Management IPNMS Integrated Plant Nutrient Management Systems JICA Japan International Cooperation Agency km kilometer LF Leasehold Forestry LFP Livelihoods and Forestry Programme LSC Livestock Service Centre LSGA Local Self Governance Act M&E Monitoring and Evaluation MDG(s) Millennium Development Goal(s) MFN Most Favored Nation MFSC Ministry of Forest and Soil Conservation MOAC Ministry of Agriculture and Cooperatives
TA 7762-NEP Preparation of the Agricultural Development Strategy – Vision Report
vii
MOAD Ministry of Agriculture Development MOE Ministry of Environment MOEN Ministry of Energy MOF Ministry of Finance MOI Ministry of Irrigation MOH Ministry of Health MOLD Ministry of Local Development MoST Ministry of Science and Technology MoU Memorandum of Understanding MoWR Ministry of Water Resources MSNP Multi-sectoral Nutritional Plan mt Metric ton MTEF Medium Term Expenditure Framework MWDR Mid Western Development Region NADC National Agriculture Development Committee NAP National Agricultural Policy NAPA National Adaptation Programme of Action to Climate Change NARC Nepal Agriculture Research Council NARDF National Agriculture Research and Development Fund NBS National Bio-Diversity Strategies NDAC National Development Action Committee NEA Nepal Electricity Authority NEPAP Nepal Environmental Protection Action Plan NFP National Fertilizer Policy 2002 NGO Non-Governmental Organization NGO Non Government Organisation NITP New Irrigation Technology Projects NLSS National Living Standard Survey NPC National Planning Commission NSC National Seed Company Private Limited NSC National Support Committee NTFPs Non Timber Forest Products O&M Operation and Maintenance OFMP Operational Forest Management Plan PF Private Forests PPP Prioritized Productivity Package PPP Public Private Partnership PPS Pocket Package Strategy PRA Participatory Risk Assessments PRSP Poverty Reduction Strategy Paper PTA Preferential Trade Agreement RADC Regional Agriculture Development Committee RAP Rural Access Programme RARS Regional Agricultural Research Station RCA Root-cause analysis REDP Rural Energy Development Programme RIP Rural Infrastructure Development Policy RO Rural Organization Rs Nepali Rupees RTAs Regional Trading Agreements SAFTA South Asian Free Trade Area SAPL Second Agriculture Programme Loan SAPTA South Asian Preferential Trading Arrangement SC Service Centers SDC Swiss Agency for Development and Cooperation SOP Standard Operations Procedures
TA 7762-NEP Preparation of the Agricultural Development Strategy – Vision Report
viii
SPS Sanitary and Phyto-Sanitary Measures SRI System of Rice Intensification SSC Service Sub Centers SSN Social Safety Nets STWs Shallow Tube Wells TA Technical Assistance TLDP Third Livestock Development Project TRIPs Trade Related Intellectual Property rights TU Tribhuvan University TWT Technical Working Team VAD Vitamin A Deficiency VAM Vulnerability Assessment Map VARG Vulnerability and Adaptation Resource Group VAT Value Added Tax VDC Village Development Committee WDR Western Development Regions WFP World Food Programme WHO World Health Organization WTO World Trade Organization WUAs Water User Associations
TA 7762-NEP Preparation of the Agricultural Development Strategy – Vision Report
ix
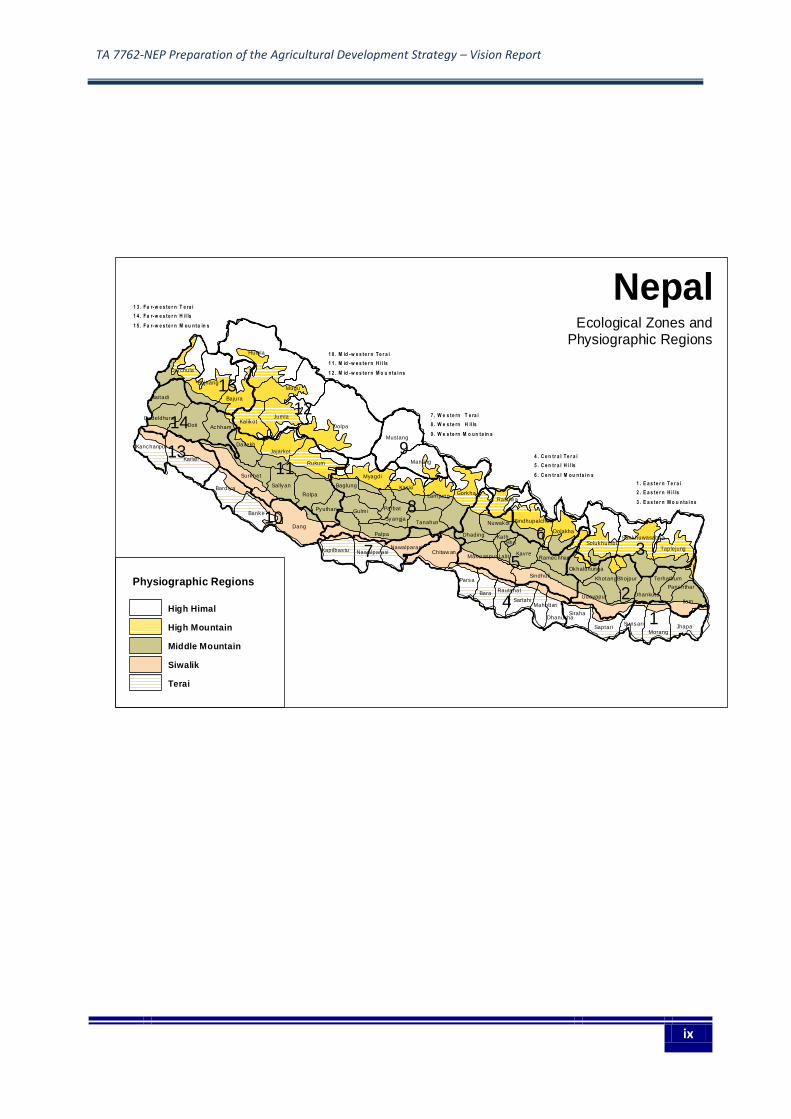
NepalEcological Zones and
Physiographic Regions
High Himal
High Mountain
Middle Mountain
Siwalik
Terai
Physiographic Regions
Dolpa
Humla
Mugu
Dang
Kailali
Doti
Gorkha
Jumla
Bajhang
Mustang
Rukum
Ilam
Taplejung
Kaski
Bajura
Rolpa
Surkhet Myagdi
Sindhuli
Banke
Manang
Jajarkot
Solukhumbu
Dolakha
Jhapa
Bara
Bardiya
Darchula
Palpa
Chitaw an
Morang
Kalikot
Dhading
Parsa
Baitadi
Udayapur
Sankhuwasabha
Makw anpur
Baglung
Achham
Gulm i
Saptari
Lam jung
Sarlahi
Rasuw a
Nawalparasi
Tanahun
Kapilbas tu
Pyuthan
Dadeldhura
Ramechhap
Rautahat
Dhanusha
Dhankuta
Kavre
Parbat
Kanchanpur Dailekh
Sallyan
Nawalparasi
SyangjaNuwakot
Kath.
Lalit
Bha
Sindhupalchok
Okhaldhunga
Mahottari
Siraha
BhojpurKhotang
Sunsari
Panchthar
Terhathum
1
2
3
4
5
67
8
9
10
11
12
13
14
15
7 . W e s te rn T e ra i
8 . W e s te rn H il ls
9 . W e s te rn M o u n ta in s
4 . C e n tr a l T e r a i
5 . C e n tr a l H i l ls
6 . C e n tr a l M o u n ta i n s
1 . E a s te r n T e r a i
2 . E a s te r n H i l ls
3 . E a s te r n M o u n ta i n s
1 0 . M id -w e s te r n T e r a i
1 1 . M id -w e s te r n H i l ls
1 2 . M id -w e s te r n M o u n ta i n s
1 3 . F a r-w e s te r n T e ra i
1 4 . F a r-w e s te r n H il ls
1 5 . F a r-w e s te r n M o u n ta in s

TA 7762-NEP Preparation of the Agricultural Development Strategy – Vision Report
1
SUMMARY
1. The Vision Report for the Technical Assistance (TA) 7762-NEP Preparation of the Agricultural Development Strategy presents the vision for the agricultural sector that will inform the formulation of the agricultural development strategy (ADS). The vision presented in the report is based on a number of consultations at the regional and national level and summarize the collective opinion of stakeholders. The vision report concludes Phase 2 of the Agricultural Development Strategy.
2. The TA is funded by Government of Nepal with support of the Asian Development Bank (ADB), International Fund for Agricultural Development (IFAD), European Union (EU), Food and Agriculture Organization (FAO), Swiss Agency for Development and Cooperation (SDC), Japan International Cooperation Agency (JICA), Denmark Agency for International Development (DANIDA), the World Food Program (WFP), the United States Agency for International Development (USAID), the Department for International Development (DfID), the World Bank, and the Australian Agency for International Development (AusAID). The Executing Agency (EA) is the Ministry of Agriculture Development (MOAD). The Steering Committee is co-chaired by Ministry of Finance (MOF) and MOAD. 3. The formulation of the vision takes into account four lessons from the review of the process of agricultural transformation in other countries, namely:
i. Total Factor Productivity (TFP) growth is the main source of future agricultural growth. ii. At early stage of development, agricultural growth is the main engine of poverty reduction.
Lower inequality enhances the impact of growth on poverty reduction. iii. Integration of smallholder farmers with modern value chains is a feasible response to the
urbanization challenge. iv. As the economy moves closer to middle income status, the development of the rural non-
farm sector becomes increasingly important in closing the gap between rural and urban areas.
4. The implications for the formulation of the agricultural development strategy are:
i. Accelerate investment in Science and Technology. Invest in the Knowledge Triangle – research, education, and extension.
ii. Ensure broad-based and inclusive agricultural growth. Invest in programs to moderate social and geographic inequalities.
iii. Integrate smallholder farmers with competitive value chains. iv. Promote rural infrastructure and rural agro-enterprises.
5. The vision takes into account the following trends:
i. Declining Agricultural Labor Force ii. Increasing Urbanization iii. Changing in Diet iv. Globalization and Trade v. Outmigration vi. Green technology and Low Carbon Emissions vii. Diversification viii. Modernization of Distribution Systems
TA 7762-NEP Preparation of the Agricultural Development Strategy – Vision Report
2
ix. Increasing importance of Quality and Safety Standards x. Rising Cost of energy xi. Impact of Climate Change xii. Degradation of natural resources xiii. Pressure for Fiscal discipline
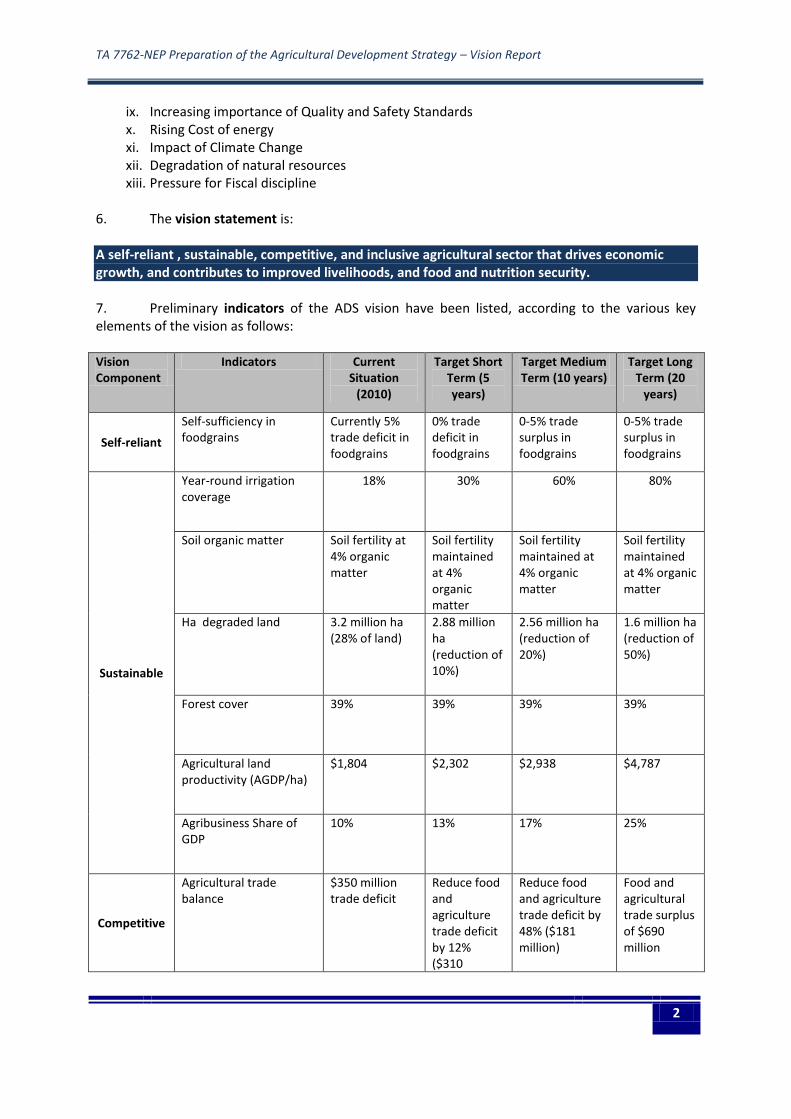
6. The vision statement is: A self-reliant , sustainable, competitive, and inclusive agricultural sector that drives economic growth, and contributes to improved livelihoods, and food and nutrition security. 7. Preliminary indicators of the ADS vision have been listed, according to the various key elements of the vision as follows:
Vision Component
Indicators Current Situation
(2010)
Target Short Term (5 years)
Target Medium Term (10 years)
Target Long Term (20
years)
Self-reliant
Self-sufficiency in foodgrains
Currently 5% trade deficit in foodgrains
0% trade deficit in foodgrains
0-5% trade surplus in foodgrains
0-5% trade surplus in foodgrains
Sustainable
Year-round irrigation coverage
18% 30% 60% 80%
Soil organic matter Soil fertility at 4% organic matter
Soil fertility maintained at 4% organic matter
Soil fertility maintained at 4% organic matter
Soil fertility maintained at 4% organic matter
Ha degraded land 3.2 million ha (28% of land)
2.88 million ha (reduction of 10%)
2.56 million ha (reduction of 20%)
1.6 million ha (reduction of 50%)
Forest cover 39% 39% 39% 39%
Agricultural land productivity (AGDP/ha)
$1,804 $2,302 $2,938 $4,787
Agribusiness Share of GDP
10% 13% 17% 25%
Competitive
Agricultural trade balance
$350 million trade deficit
Reduce food and agriculture trade deficit by 12% ($310
Reduce food and agriculture trade deficit by 48% ($181 million)
Food and agricultural trade surplus of $690 million

TA 7762-NEP Preparation of the Agricultural Development Strategy – Vision Report
3
Vision Component
Indicators Current Situation
(2010)
Target Short Term (5 years)
Target Medium Term (10 years)
Target Long Term (20
years)
million)
Agricultural Exports $248 million $400 million $600 million $1000 million
Inclusive
GDI (Gender Development Index)
0.499
0.550
0.675
0.750
Percent of land ownership by women/ joint ownership
10% 20% 50% 80%
Percent of rural households covered by agricultural services and programs
12% 17% 22% 30%
Growth
Average annual growth of AGDP
3% 4% 5% 6%
Livelihood
AGDP/ Agricultural labor $794 $979 $1206 $1833
Poverty in Rural Areas 35% 28% 20% 10%
Food and Nutrition Security
Food Poverty 16% 12% 8% 1%
Chronic Malnutrition as measured by - % stunting (height for age) among under 5 children - Underweight (weight for age) among under 5 children - Wasting (weight for height) among under 5 children - Women with chronic energy deficiency (measured as BMI)
41.5% stunting; 31.1%
underweight; 13.7% wasting
Reduction Consistent with MSNP and FSNPA
Reduction Consistent with
MSNP and FSNPA
Reduction Consistent with MSNP and FSNPA
8. At this stage we can evaluate whether or not the targets are specific, measurable, and timely. Their attainability and realism depend on the initial conditions, the strategy to be adopted, and the commitment of policy makers. The next phases of the ADS TA will focus on road map. As such, the next phase of the ADS TA will need to evaluate the attainability, realism, and feasibility of reaching the targets indicated at this stage. Some targets might be reformulated as the result of additional analysis and consultations.

TA 7762-NEP Preparation of the Agricultural Development Strategy – Vision Report
4
1 INTRODUCTION
9. This document is the Vision Report for the Technical Assistance (TA) 7762-NEP on Preparation of the Agricultural Development Strategy (henceforth, the TA will be referred as simply “ADS”). The TA is funded by Government of Nepal (GON) with support2 by Asian Development Bank (ADB), International Fund for Agricultural Development (IFAD), European Union (EU), Food and Agriculture Organization (FAO), Swiss Agency for Development and Cooperation (SDC), Japan International Cooperation Agency (JICA), Denmark Agency for International Development (DANIDA), the World Food Program (WFP), the United States Agency for International Development (USAID), the Department for International Development (DfID), the World Bank, and the Australia Agency for International Development (AusAID).
10. The report is the third main deliverable of the ADS Preparation Team, after the Inception Report and the Assessment Report3. The Inception Report presented the objectives, the approach and methodology, and the work plan for the TA. It also provided a short review of trends and key issues. APPENDIX 1 summarizes the main features of the TA.
11. The Vision Report main objective is to present a vision for the agricultural sector that is the outcome of the consultation with stakeholders. The vision is to be achieved over the next 20 years. Combined with the assessment of the agricultural sector (conducted during Phase 1 of the TA), the vision provides the basis upon which to build subsequent phases of the ADS preparation (see APPENDIX 2 for a summary of the ADS work plan). The vision provides the main outcome of Phase 2 of the ADS TA. The immediate next phase (Phase 3) is the Policy Option Phase, in which the TA Team will identify alternative policies, institutional mechanisms, and investment needed to achieve the vision.
1.1 Organization of the Vision Report 12. This report is organized into 3 chapters as follows:
Chapter 1. Introduction Chapter 2. Future Trends affecting the Agricultural Sector in Nepal Chapter 3. Vision, Targets, and Indicators
13. The report includes 6 appendices as follows:
Appendix 1. The ADS Preparation in Brief Appendix 2. ADS Work Plan Appendix 3. Development Partners and the ADS Appendix 4. Food Sovereignty Appendix 5. Examples of Vision Statements Appendix 6. S.M.A.R.T Goals
2 See APPENDIX 3 for the list of development partners engaging in the ADS.
3 ADB 7762-NEP (2011) Inception Report. Technical Assistance for the Preparation of the Agricultural
Development Strategy, Asian Development Bank, September 2011; and ADB 7762-NEP (2011) Assessment Report. October 2011.

TA 7762-NEP Preparation of the Agricultural Development Strategy – Vision Report
5
2 FUTURE TRENDS AFFECTING THE AGRICULTURAL SECTOR IN NEPAL
2.1 Introduction 14. The discussion of future trends in this chapter provides a context for the formulation of the vision of the agricultural sector in Nepal. A vision for Nepal is not an exercise in isolation of what happens in the rest of the world. A realistic and solid vision is anchored on an in depth understanding of the current situation and overall trends that affect Nepal in a regional and global context. 15. A better understanding of the future trends could be gained from the process of agricultural transformation. The key features of the agricultural transformation are summarized in the next section, before discussing specific trends and their impact on the formulation of the vision of the agricultural sector. 16. It should also be noted that the formulation of the vision is the outcome of discussions with stakeholders in the regions and at the national level.
2.2 Agricultural Transformation 17. Over the 20-year period 2010-2030, one possible scenario is for GDP/capita of Nepal to increase substantially from the current level of $635 to $2,220, implying that Nepal will move towards middle income country status. This scenario is consistent with the potential of the country and improvement in policies and institutions that will result in accelerated growth. 18. The relevance of this scenario for the agricultural sector is that during this movement towards middle income country status, Nepal will go through the process of agricultural transformation, a process whereby the economic structure of a society changes from one based on agriculture to one based on industry and services. 19. The process of agricultural transformation is one through which most countries have gone through. There is solid and extensive statistical evidence pointing out that the higher the GDP per capita, the lowest the share of agriculture in GDP and labor (see Figure 1). The process has been studied at length4. Its conceptualization and review of its lessons provide useful insights for the formulation of the ADS.
4 C. Peter Timmer 2007. A World without Agriculture. The Structural Transformation in Historical Perspective.
The Henry Wendt Lecture Series. AEI Press, Washington, D.C.

TA 7762-NEP Preparation of the Agricultural Development Strategy – Vision Report
6
Figure 1 Share of Agriculture in GDP and Labor as GDP/capita increases
20. The analytics of the process of agricultural transformation is illustrated in Figure 2. Figure 2 Analytics of the Process of Agricultural Transformation
Source: Adapted from Timmer 2007.
4
% Agriculture Labor Force
0%
100%
20%
40%
60%
80%
LOW
HIGH
% Agriculture in GDP
Poor RichPer Capita Income
Tota
l Val
ue
Value of Agricultural Output per Worker in Agriculture
Total Value of Agricultural GDP
TA 7762-NEP Preparation of the Agricultural Development Strategy – Vision Report
7
21. During the process of transformation, several things take place at the same time. Agricultural GDP and labor share of agriculture decline, but at the same time agricultural productivity and agricultural GDP increase. So, in spite of being less as a share of total GDP, agricultural GDP is still growing bigger. This could be described in terms of two paradoxes. PARADOX 1 – (more is less) 22. The more productive agriculture becomes, the less important in terms of GDP share it becomes. As the value of agricultural output per worker increases, the GDP and labor share of agriculture in the total economy reduces. PARADOX 2 (less is more) 23. The less important agriculture becomes the more influential farmers become (they exert more political influence, more lobbying, more subsidies, etc.). This is very obvious in rich countries where agricultural sector is less than 3% of the economy and yet the lobbying and influence of farmers is disproportionately higher than their small numbers. This is becoming increasingly the case even in middle income countries such as Thailand and Malaysia. Typically the outcome of this lobbying is a set of measures, most notably subsidies, to farmers and agro-based industries.
2.3 Main Lessons from the Review of Agricultural Transformation 24. Four lessons from the process of agricultural transformation are relevant to the formulation of ADS’s vision. The lessons can be summarized as follows:
1. Total Factor Productivity (TFP) growth is the main source of future agricultural growth. 2. At early stage of development, agricultural growth is the main engine of poverty reduction.
Lower inequality enhances the impact of growth on poverty reduction. 3. Integration of smallholder farmers with modern value chains is a feasible response to the
urbanization challenge. 4. As the economy moves closer to middle income status, the development of the rural non-
farm sector becomes increasingly important in closing the gap between rural and urban areas.
2.3.1 Productivity Matters 25. The first lesson is about growth. Growth can be achieved in different ways, including expansion of factors of production, increase in modern inputs resulting in yield enhancement, increase in value added, and improvement in comparative and competitive advantage (see Table 1). Table 1 Differents Options for Increasing Value of Agricultural Production
How to Increase Value of Production
Example Remarks
Factors of Production Labor, land, water; inputs such as seeds, fertilizer, breeds, equipment.
Land abundant countries expand area (eg Thailand, Cambodia). Labor abundant countries increase labor (China in the past) Most countries expand irrigation

TA 7762-NEP Preparation of the Agricultural Development Strategy – Vision Report
8
Yields HYV, fertilizers, chemicals, irrigation (Green Revolution).
Green Revolution in foodgrains (all over Asia; started in the 60-70s, accelerated in the 80s and 90s.
Value Added Processing, Diversification, Storage, Packaging, Postharvest system improvement.
Changing diet livestock revolution, more convenient food for urban consumers, more concern for food safety.
Comparative Advantage
Eliminate distortions in exchange rate and trade policy; improve transportation.
`
Competitive Advantage
Integrated value chain, logistics improvements, branding, consistent quality assurance.
Ability to meet consumer demand consistently through innovations.
Source: ADS Consultant Team
26. As seen above (see section 2.2) the increase in agricultural productivity is the main stylized fact of agricultural transformation. In Asia, the most vivid example of growth in agricultural productivity is the growth in food grains (mostly rice and wheat, but also corn) brought about by the Green Revolution. Agricultural productivity immediate impact was on greater food availability and consequently on food security. 27. Increased productivity allows freeing up resources (labor and capital) for the development of other sectors. It also contributes to higher income and therefore higher demand by rural population for goods and services produced by the non-agricultural sector. 28. Increased productivity can be achieved in different ways, by using factors of production more intensively and efficiently, by adopting new production technology, by expanding values, by improving exchange rates, and by innovating along the value chain. 29. Total factor productivity (TFP) represents the intangibles explaining productivity growth. The main driver of growth in modern economy is total factor productivity (TFP), which is the part of growth output not explained by growth in inputs. TFP requires knowledge and relies upon intangible things such as technology, innovation, efficiency, creativity, and governance.
Growth of Output = Growth of Inputs + Growth in TFP 30. TFP growth contributed between 40% and 70% to agricultural output growth in Asia (see

TA 7762-NEP Preparation of the Agricultural Development Strategy – Vision Report
9
31. Figure 3). In high income growth, TFP contributed to output growth more than 100% (because input growth was negative in some cases). Over time in Asia, TFP contributes more and more to output growth (see Figure 4).

TA 7762-NEP Preparation of the Agricultural Development Strategy – Vision Report
10
Figure 3 Agricultural Output and TFP Growth (1961-2007)
Source: Keith O. Fuglie, 2010, Total Factor Productivity in the Global Agricultural Economy: Evidence from FAO Data.
Figure 4 Increasing TFP Contribution to Agricultural Growth in Asia
Source: Keith O. Fuglie, 2010, Total Factor Productivity in the Global Agricultural Economy: Evidence from FAO
Data.
32. The factors affecting TFP growth in agriculture include accelerated investments in agricultural research, extension, and education (REE). Paradoxically, the countries at early stage of agricultural transformation invest less in REE, even though they could benefit most in terms of reduced poverty (see Figure 5).
0
0.5
1
1.5
2
2.5
3
3.5
4
4.5
NE Asia Southeast Asia South Asia High Income
0%
20%
40%
60%
80%
100%
TFP in Asia NE Asia Southeast Asia
South Asia
61-69
70-79
80-89
90-99
00-07

TA 7762-NEP Preparation of the Agricultural Development Strategy – Vision Report
11
Figure 5 Public Agricultural Research Expenditures as % of GDP (1981-2000)
Source: Nienke M. Beintema and Gert-Jan Stads, 2008, Measuring Agricultural Research Investments, Agricultural Science and Technology Indicators, ASTI Background Note
2.3.2 Poverty and Inequality Matters 33. The historical record shows that no country (city states excepted) has ever seen rapid economic growth without substantial growth of its agriculture. In many cases the increases in agricultural output have preceded the major expansions of manufacturing. This would be the case for the UK in the 17th and 18th C, as well as many of the recent East Asian growth stars, such as China, South Korea, Indonesia, and Taiwan. Moreover, agricultural productivity growth contributes to overall productivity growth – agriculture is a large sector at initial stage of development, has strong growth linkages with the rural and urban economies. 34. In fact, even more interesting, agricultural growth has a strong poverty reduction effect, particularly at early stages of development. Agricultural Growth reduces poverty as most of the poor live in rural areas and agriculture is the main occupation of rural population at initial stages of development. Moreover, farming:
can use relatively large amounts of unskilled labor compared to capital, so that agricultural growth results in increased demand for unskilled labor, thus creating jobs and tending to raise the rural wage rate;
generates returns to land, an asset that some of the poor have when they have few other assets than their labor power;
tends to push down the price of produce, including food, to the immense benefit of the majority of the poor who have to buy in food staples.
35. In fact, food productivity growth contributes to higher calories per capita and reduction of real prices of food – food expenditure is the major budget share of the poor. 36. Quantitative comparisons across countries using regression analysis tell a similar story. Irz et al. (2001) estimate that for every 10% increase in farm yields there is a 7% reduction in poverty in Africa and a 5% reduction in Asia. Growth in manufacturing and services has no such effect. (need references).
Public agricultural research expenditures as % agr GDP, 1981-2000
1976-81
1981-91
1991-2000
Global Average = 1%High Income Avg = 2%Low-Middle Income Avg = 0.5%Nepal Avg = 0.2%

TA 7762-NEP Preparation of the Agricultural Development Strategy – Vision Report
12
37. While the link between agricultural growth and poverty reduction is well established, the link between agricultural growth and inequality is not clearly established in the literature. The evidence is mixed. In some cases (Korea, Taiwan, China) economic transformation reduced income inequality. In other cases, the opposite has occurred (India).
38. There is however an indirect link between agricultural growth and inequality that could be best appreciated through the introduction of the concept of Growth Elasticity of Poverty Reduction (GE). GE is the proportionate change in the measure of poverty that results from a given rate of growth. A large negative GE reveals that even a modest growth rate can bring rapid poverty reduction. For the US$1-a-day poverty rate, the average GE is about -2, meaning that a growth rate of, say, 5% in household income per capita will reduce the share of the population living below the poverty line by 10 percent a year (in proportionate terms).
Box 1 Inequality and Poverty Higher inequality reduces the growth elasticity of poverty reduction (GE). Then the same growth will have a much lower effect on poverty reduction. On average GE=-2 for developing countries; it varies between -1 for high inequality countries to -3 to low inequality countries. Consider two countries one with low inequality (and GE=-3) and one with high inequality (and GE=-1); the same growth rate (2% per year) will have dramatically different impacts on poverty reduction in the two countries. In the country with low inequality, it will take 11 years to half poverty and in the country with high inequality it will take 35 years.
Source: Martin Ravallion. 2007. Economic Growth and Poverty Reduction: Do Poor Countries Need to Worry
about Inequality? 2020 Focus Brief on the World’s Poor and Hungry People. Washington, DC: IFPRI. 2.3.3 Cities Matter 39. Most of urban growth in the world will occur in Asia. Larger cities and urban populations present various challenges:
More food is supplied from diverse and distant sources.
Food is more processed, more conveniently prepared, better packaged and stored, more scrutinized for quality and safety.
Low Inequality (GINI coefficient = 0.3)
GE = -3
High Inequality (GINI coefficient = 0.6)
GE = -1
GROWTH RATE = 2% per year
Yearly Poverty reduction = 6%
Yearly Poverty reduction = 2%
TIME TO HALF POVERTY = 11 YEARS
TIME TO HALF POVERTY = 35 YEARS
TA 7762-NEP Preparation of the Agricultural Development Strategy – Vision Report
13
Agricultural land particularly peri-urban land is under pressure for conversion to non-farm uses.
Increasing need for improved food logistics and infrastructure
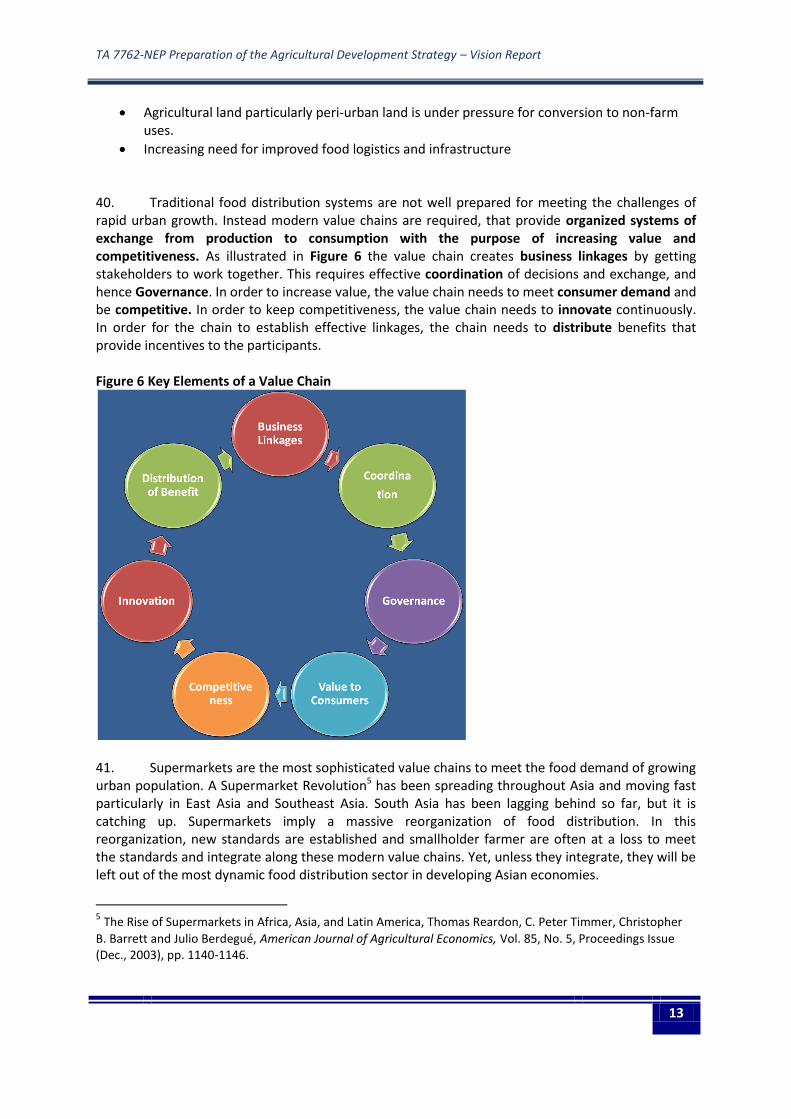
40. Traditional food distribution systems are not well prepared for meeting the challenges of rapid urban growth. Instead modern value chains are required, that provide organized systems of exchange from production to consumption with the purpose of increasing value and competitiveness. As illustrated in Figure 6 the value chain creates business linkages by getting stakeholders to work together. This requires effective coordination of decisions and exchange, and hence Governance. In order to increase value, the value chain needs to meet consumer demand and be competitive. In order to keep competitiveness, the value chain needs to innovate continuously. In order for the chain to establish effective linkages, the chain needs to distribute benefits that provide incentives to the participants. Figure 6 Key Elements of a Value Chain
41. Supermarkets are the most sophisticated value chains to meet the food demand of growing urban population. A Supermarket Revolution5 has been spreading throughout Asia and moving fast particularly in East Asia and Southeast Asia. South Asia has been lagging behind so far, but it is catching up. Supermarkets imply a massive reorganization of food distribution. In this reorganization, new standards are established and smallholder farmer are often at a loss to meet the standards and integrate along these modern value chains. Yet, unless they integrate, they will be left out of the most dynamic food distribution sector in developing Asian economies.
5 The Rise of Supermarkets in Africa, Asia, and Latin America, Thomas Reardon, C. Peter Timmer, Christopher
B. Barrett and Julio Berdegué, American Journal of Agricultural Economics, Vol. 85, No. 5, Proceedings Issue (Dec., 2003), pp. 1140-1146.
TA 7762-NEP Preparation of the Agricultural Development Strategy – Vision Report
14
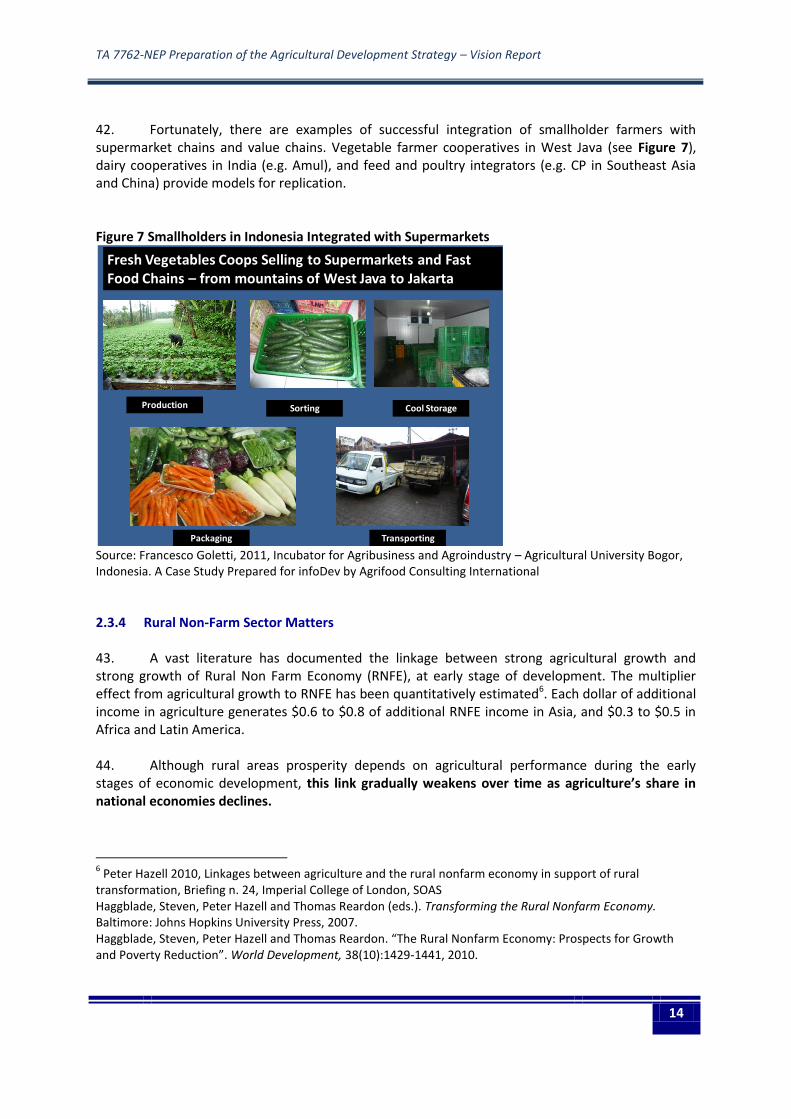
42. Fortunately, there are examples of successful integration of smallholder farmers with supermarket chains and value chains. Vegetable farmer cooperatives in West Java (see Figure 7), dairy cooperatives in India (e.g. Amul), and feed and poultry integrators (e.g. CP in Southeast Asia and China) provide models for replication. Figure 7 Smallholders in Indonesia Integrated with Supermarkets
Source: Francesco Goletti, 2011, Incubator for Agribusiness and Agroindustry – Agricultural University Bogor, Indonesia. A Case Study Prepared for infoDev by Agrifood Consulting International
2.3.4 Rural Non-Farm Sector Matters 43. A vast literature has documented the linkage between strong agricultural growth and strong growth of Rural Non Farm Economy (RNFE), at early stage of development. The multiplier effect from agricultural growth to RNFE has been quantitatively estimated6. Each dollar of additional income in agriculture generates $0.6 to $0.8 of additional RNFE income in Asia, and $0.3 to $0.5 in Africa and Latin America. 44. Although rural areas prosperity depends on agricultural performance during the early stages of economic development, this link gradually weakens over time as agriculture’s share in national economies declines.
6 Peter Hazell 2010, Linkages between agriculture and the rural nonfarm economy in support of rural
transformation, Briefing n. 24, Imperial College of London, SOAS Haggblade, Steven, Peter Hazell and Thomas Reardon (eds.). Transforming the Rural Nonfarm Economy. Baltimore: Johns Hopkins University Press, 2007. Haggblade, Steven, Peter Hazell and Thomas Reardon. “The Rural Nonfarm Economy: Prospects for Growth and Poverty Reduction”. World Development, 38(10):1429-1441, 2010.
Fresh Vegetables Coops Selling to Supermarkets and Fast Food Chains – from mountains of West Java to Jakarta
Production Sorting Cool Storage
Packaging Transporting

TA 7762-NEP Preparation of the Agricultural Development Strategy – Vision Report
15
45. Evidence from India, for example, suggests that rapid rural nonfarm growth is occurring along transport corridors linked to major urban centers, largely independent of their agricultural base. Similarly, in Southeast Asia and in China high population density and low transport costs have led to rapid growth in urban-to-rural subcontracting for labor-intensive manufactures destined for international export markets, and to astonishing rates of rural-urban migration. 46. The relation between rural non-farm economy and agriculture has different dimensions:
• Rural non-farm activities improve food security by diversifying income sources and improving the ability of rural households to cope with shocks
• Rural non-farm activities generate employment for the poor • Growth of employment in the non-farm sector is typically faster than in the rural farm sector
47. Agribusiness is one of the most important non-farm activities. In particular, it is the non-farm industry most closely linked to farming. Agribusiness includes a broad array of activities (processing, input supply, storage, distribution) aimed at adding value on the agricultural raw material. 48. Agribusiness share in GDP increases as agricultural share is declining (see Figure 8). In US for example, while farming is less than 1% of GDP, agribusiness (food and fiber system) sector contributes about 12%.
Figure 8 Relation between GDP per capita and Agriculture and Agribusiness GDP
2.4 Implications of the Lessons from Agricultural Transformation for the ADS
1. Accelerate investment in Science and Technology. Invest in the Knowledge Triangle – research, education, and extension.
2. Ensure broad-based and inclusive agricultural growth. Invest in programs to moderate social and geographic inequalities.
3. Integrate smallholder farmers with competitive value chains. 4. Promote rural infrastructure and rural agro-enterprises.

TA 7762-NEP Preparation of the Agricultural Development Strategy – Vision Report
16
Figure 9 Four lessons from Agricultural Transformation
2.5 Future Trends and Their Relevance for the Food and Agricultural Sector 2.5.1 Agricultural Labor Force 49. An over-arching demographic and economic trend is the structural transformation of labor gradually moving from agriculture to secondary processing and manufacturing industries and tertiary services industries. The growth rate in agricultural labor force is declining, from 2.5% (1988-98) to 2.1% (1998-2008), and is forecast at 1.7% (2010-20) (FAO 2010). For example, Figure 10 shows that the agricultural labor force in Nepal is much higher than in a more diversified economy such as Bangladesh. Driving this trend are rapid population increase, urbanization, reduction in poverty, rising non-farm incomes and employment, new technologies, increasing access to information technology (46% ownership of telephone/mobile in Nepal), increasing competition for land and water for agriculture and non-agricultural use, globalization, rising costs of energy, and climate change. Figure 10: Agricultural labor force
0 10 20 30 40 50 60 70 80 90
Nepal
Myanmar
Vietnam
China
India
Bangladesh
Thailand
Source: FAO 2010

TA 7762-NEP Preparation of the Agricultural Development Strategy – Vision Report
17
2.5.2 Urbanization 50. An increasing urban population needs to be fed. For this population, food demand will be richer in protein, requires more stringent quality standards, and be more convenient to prepare. Increasing urbanization implies more pressure on agricultural land in peri-urban areas. Food distribution systems appropriate for urban areas require improved marketing and distribution infrastructure. An increasing amount of food will be distributed via modern outlets and supermarkets. Agroindustry will need to develop, in order to provide with enhanced features such as storability, convenience, improved packaging, and diversified products. 2.5.3 Change in Diet 51. Due to increasing income and urbanization, diets will be more diversified, richer in protein and micronutrients. More animal products and more processed foods will be consumed. Also, more people will be more conscious of health issues (cholesterol, diabetes …) related to food and food safety. 2.5.4 Globalization and Trade
52. Increase in cross-border trade will require Nepal to have an adequate network of double tax agreements in place with major trading partners and be competitive with more countries. 2.5.5 Outmigration 53. Youths are less interested in agriculture. Many youths are emigrating leaving women, children, and old people in the villages. Labor shortage might push for increased mechanization. Outmigration might also accelerate the process of increasing farm size. 2.5.6 Green technology and Low Carbon Emissions
54. There will be global pressure for countries to implement green technologies (e.g. solar power) and reduce carbon emissions (e.g. Rs. 50/tonne coal tax in India).
2.5.7 Diversification 55. Developing a more commercial and competitive agricultural sector is essential to face the trends that have direct impacts on the food and agricultural sector. Rising incomes are changing food demand from cereals towards more protein, fruit, vegetables and processed foods. In the South Asia region, per capita consumption of rice declined from 20% to 15% of consumer food spending (1980-2008), while 85% of consumer food spending is on vegetables, meat, dairy and fish (Chen, 2011). Following this trend, farmers get about four times the income per ha from high value products than from rice.
TA 7762-NEP Preparation of the Agricultural Development Strategy – Vision Report
18
2.5.8 Distribution Systems 56. Markets are increasingly open and will be increasingly homogenized toward international tastes and requirements for levels of quality, packaging, safety, and even process attributes such as socially or environmentally friendly methods. New distribution channels, dominated by larger firms including supermarket retailers, will impose high performance demands on their value chains. Food production, distribution and marketing chains are changing with improving infrastructure, communications, vertical business structures, integration into the world market, and the rapid rise of supermarkets. Some 80% of the consumer price of food is formed in the post-farm value chain, yet the policy is very focused on farm productivity. In the ASEAN country group, 75% of the food economy is in urban areas, in wholesale, post-harvest logistics, processing and food retail, and increases in efficiency post-farm therefore have strong impact on competitiveness (Chen 2011). The supermarket revolution is advancing in India and starting in Nepal. In China the top 47 food retail chains turned over USD 13 billion in 2001, rising extremely rapidly to USD 92 billion by 2009. Increasing foreign direct investment within the Asian region helps drive the integration of the regional agri-food economy. Intra-region trade and competition is growing faster than with other regions.
2.5.9 Quality and Safety 57. In the regional and global context, agricultural quality and safety systems are based on standards of best practice operating procedures, internal control systems and product traceability. They require strong government regulatory systems with sufficient capacity for monitoring, regulation and enforcement, supported by non-government industry-based institutions to provide training, certification, auditing and analytical laboratory services. The regulatory capacity must encompass the whole food chain, from rigorous assessment and registration of agricultural inputs (such as pesticides, veterinary medicines and biotechnology products) and livestock feeds, through to food processing additives. The tragic 2008 “melamine in milk” episode shocked Asia. The fact that melamine was not previously monitored as it was not considered a potential agricultural input highlighted the need for dynamic and rigorous food safety system. Despite such headline-grabbing events, the most frequent agricultural food safety events are due to bacterial contamination such as the deaths in the USA caused by from E. coli in tomatoes in 2007 and bean sprouts in Germany in 2011. In all cases, a system to trace the source of contaminated products was essential to rapid and effective response.
2.5.10 Cost of energy 58. Rising costs of energy will drive up costs of fertilizers, irrigation, mechanization and thus food. In this context, profitable farming systems and their genetic materials need to be highly efficient, not necessarily relying on high-fertilizer and water input systems such as hybrid wet rice. Aerobic rice systems are emerging as more efficient and provide better yield in marginal conditions and under climate change. Increasing urbanization and agro-industry development results in large-scale concentrated waste that continues to be costly and polluting, and in response many countries are using this waste to manufacture bio-fertilizer.
TA 7762-NEP Preparation of the Agricultural Development Strategy – Vision Report
19
2.5.11 Climate Change 59. Climate change, input and output market price fluctuations, trans-boundary disease and natural disasters have had major local and regional impacts on agriculture. India, for example, has developed agricultural insurance and disaster response mechanisms for primary (crop failures) and to some extent secondary (livestock deaths) consequences of climate variability. Risks in commercial agriculture may be mitigated by response mechanisms that include catastrophe protection insurance and the protection of farmers under bankruptcy legislation.
2.5.12 Degradation of natural resources 60. Degradation of so-called renewable resources including agricultural land and water presents another set of challenges. Improving the land tenure system, markets for water rights, land use zoning, and regulatory capacity to ensure sustainable land and water resource use management are some of the policy and institutional mechanisms that have proven effective. 2.5.13 Fiscal discipline
61. Pressure for increased integrity of the tax system, including the administration of the taxation of agriculture will be an increasingly feature of more modern agricultural systems.
2.6 Baseline and Scenarios 62. The baseline data below was used to provide some information for the working group discussion held during regional and national consultative meetings with stakeholders. Each working group was requested to reflect on different scenarios over the next 5, 10, and 20 years so as to inform their vision statements. 63. Scenarios for short, medium, and long term based on growth rates reported in Table 2 are hypothetical. They are not intended to be either predictions or targets. They are reported here only as aids to the formulation of the vision.

TA 7762-NEP Preparation of the Agricultural Development Strategy – Vision Report
20
Table 2 Baseline and Scenarios for Agricultural Sector
Indicator 2010 2015 2020 2030 Short
Term (Years)
Medium Term (Years)
Long Term (Years)
Unit Growth Rate
(Baseline) 5 10 20
Population Million 1.40% 26.6 28.5 30.6 35.1
Urban Population Million 4% 4.5 5.5 6.7 9.9
Rural Population Million 0.7% 22.1 23.0 23.9 25.2
GDP $ Billion 8% 16.9 24.8 36.5 78.8
GDP/cap $/cap 6.5% $635 $871 $1,194 $2,242
AGDP Billion 5.0% $6 7.1 9.1 14.8
AGDP share % -2.8% 33% 29% 25% 19%
Total Labor Million 2.0% 10.64 11.7 13.0 15.8
Total Labor in Agriculture Million 0.7% 7.0 7.3 7.5 8.1
Labor Share in Agriculture
% -1.3% 66% 62% 58% 51%
GDP/Labor $/cap 5.9% 1588 2114 2813 4982
AGDP/Labor in Agriculture
$/cap 4.3% 794 979 1206 1833
Poverty % -7.7% 25% 18% 11% 5%
Malnutrition of children – Stunting
% -5.0% 42% 35% 25% 15%
Population with access to telephone
% 3.5% 50% 70% 99% 100%
Strategic Road Network (SRN) - km
km 7.2% 20,000 25,000 40,000 80,000
Rice yield (kg/ha) kg/ha 3.7% 2,900 3500 4000 6000
Dairy cow productivity (l/lactation)
Liters/ lactation) 7.9%
435 637 933 2000
Source: Scenarios elaborated by TA Team.
64. The assumption of annual growth of population of 1.4% is based on the latest figures released by the Bureau of Statistics. The growth rate has declined considerably from the level of 2.2% over the previous decade. Over the course of the next 20 years it is conceivable that population growth might decline even further, thus lowering the total level of 35.1 million indicated in the scenario of
TA 7762-NEP Preparation of the Agricultural Development Strategy – Vision Report
21
65. Table 2. The most interesting future trend is urbanization, where it is envisaged that urban population in Nepal might double from 4.5 million to almost 10 million over the course of the ADS period. The observations pointed out in the previous sections 2.3.3 and 2.5.2 are therefore quite relevant in the context of Nepal. 66. Under GDP and AGDP growth assumptions of 8% and 5% indicated in Table 2, agricultural GDP will more than double from its current level of about $6 billion to almost $15 billion; this will occur while the share of agriculture of GDP in agriculture declines from 33% to 19% and labor productivity in agriculture increases from $794 per agricultural worker to $1,833. The scenario represented here is fully consistent with the agricultural transformation stylized facts described in section 2.2. It is also important to highlight that in this scenario the gap in labor productivity between agriculture and the rest of the economy grows from 2 ($1,588/$794) to 2.7 ($4,982/$1,833). So, in spite of improvement in poverty and living standards highlighted by growth in income and productivity, the gap between agriculture and the rest of the economy persists and even increases, representing either a possible source of social tension or a futher incentive for rural outmigration.
67. There are other implications of the scenarios presented in Table 2. First, the mobile phone revolution will mean that probably even before the year 2030, 100% of the population will have access to mobile phone. This will facilitate access to information such as prices, technologies, markets, regulations, and disasters. Such information could in turn lead to improved decisions to affect living standards positively. The access to this information presents also new opportunities for introducing innovations in methods of agricultural extension.
68. Physical infrastructure such as roads will more than quadruple over the next 20 years, making it easier for remote region to access the market.
69. Increase in rice yield implies lower need of expansion of agricultural land. Combined with a lower per capita consumption of rice (due to higher income and urbanization) and a higher population (increase by 32%), the doubling of rice yields is consistent with food security objective and even the possible reallocation of some rice land to other crops.

TA 7762-NEP Preparation of the Agricultural Development Strategy – Vision Report
22
3 VISION FOR AGRICULTURAL SECTOR IN NEPAL
3.1 Introduction 70. The vision statement reported in this chapter is the outcome of a number of consultations at the regional and national level. The formulation below is based on (i) the National Workshop held in Kathmandu on 30 November 2011; and (ii) subsequent consultations with farmer organizations during 2012. 71. The statement incorporates several elements that address most of the concerns and aspirations of Nepali as they relate to the food and agricultural sector.
3.2 Vision Statement7 A self-reliant, sustainable, competitive, and inclusive agricultural sector that drives economic growth, and contribute to improved livelihoods and food and nutrition security.
3.3 Slogan Agriculture-led prosperous Nepal
3.4 Key Elements of the Vision 3.4.1 Self-reliance
72. Self-reliance relates to the capacity of the country to produce sufficient food to feed its own population. Currently, not only the food and agricultural trade balance of Nepal is in deficit, but also its major food staples are in deficit, including rice, wheat, and maize. 73. Self-reliance is based on the belief that domestic production of the country’s main foodgrains should be increased and Nepal should not be dependent on imports for its food staples; it is also based on the realization that even moderate increases in productivity of the main cereals would attain foodgrains self-sufficiency. 74. The concept of self-reliance does not imply that for each and every commodity Nepal should be self-sufficiency. Nepal should be self-reliant overall for food and agricultural products; for several individual food and agricultural products Nepal will continue to import.
7 The discussion during the Vision Workshop in Kathmandu was also about the issue of whether or not to
include the words “food sovereignty” rather than “food security and nutrition”. The discussion of the use of the term “food sovereignty” outside of Nepal and in the Nepal Interim Constitution is presented in APPENDIX 4. In the vision statement presented in the text the concept of self-reliance is introduced.

TA 7762-NEP Preparation of the Agricultural Development Strategy – Vision Report
23
3.4.2 Sustainability 75. Sustainable agriculture includes environmental, economic, and social dimensions. If good practices in agriculture are followed, agriculture could be environmentally sustainable and even contribute to the improvement in biodiversity. Intercropping systems, no tillage cultivation, and agroforestry are some examples. Efficient water use management including non-conventional irrigation, treatment of wastes in livestock and agroprocessing, biogas and biomass clean technologies, balances use of nutrients, and plant and nutrient soil management contribute to an environmentally sustainable agriculture. Clean development mechanisms (CDM) that generate carbon credit to farmers engaged in agroforestry or community forestry activities might combine environmental sustainability with economic sustainability, and mitigation response to climate change. 76. Available evidence on climate change in Nepal indicates increasing temperatures and different patterns of monsoon precipitations. The impact of climate change on agriculture in Nepal is currently studied, but even the preliminary evidence suggests the need of introducing appropriate adaption mechanisms to increase resilience of farmers to climate change. At the same time it is important to understand the feasibility of mitigation mechanisms including clean development mechanisms and disaster risk reduction that could be beneficial to farmers. The issue is how to ensure sustainable modernization of agriculture and commercialization while strengthening resilience to climate change. 77. From an economic point of view, fluctuations in world prices, availability of labor, and production risks associated with major outbreaks of pests and diseases are major challenges. Current world prices are high, but are also highly variable. Labor is becoming more expensive and less available for farm work, driven by the economic transformation of the country, the movement of labor toward non-farm activities, and the exodus towards urban areas and abroad. Rising labor costs will have to be counterbalanced by improved productivity, bigger farm size, and outsourcing of some operations to specialized companies and business service providers. Outbreaks of pests and diseases are a serious risk for which Nepal has to prepare and respond. Research and technology transfer programmes have to be expanded considerably in order to ensure preparedness for the future. Given low farm size, economic sustainability relies upon high value added and increasing productivity. In the longer term, consolidation of farms will be unavoidable, but before that occurs, the majority of farmers will be smallholder farmers who have to make a livelihood from their land. 78. From a social point of view, sustainability of agriculture increasingly depends on women. Women are becoming the major labor force in agriculture, but their economic importance is not adequately reflected into control of resources and decision about use of resources. Ethnic groups and marginal groups are constrained in the stewardship of natural resources that impact on sustainability of agriculture and biodiversity. Addressing the constraints of these groups will contribute to social sustainability of the programs adopted in the ADS. 3.4.3 Competitiveness 79. Nepal is ranking very low in competitiveness measures. Constraints to competitiveness include poor infrastructure, weak governance, limited capacity and human resources, an overvalued exchange rate, difficulty to access credit and doing business. Improvement in competitiveness of Nepal agriculture could result in a strong performance of high value exports. Currently
TA 7762-NEP Preparation of the Agricultural Development Strategy – Vision Report
24
competitiveness of agricultural products from Nepal is low and declining. Most exported products are in raw forms and value addition is done in destination markets. The potential for high value food and agricultural exports is limited by the lack of a well functioning system for quality and safety control, low technology, difficulty of doing business, and poor infrastructure. 80. Competitiveness is more than just productivity and profitability. Competitiveness implies a production and distribution system oriented towards the market and meeting consumers demand effectively by providing higher value. Competitive products are not necessarily cheaper products. Competitive products are products that are able to meet the preferences and budgets of the consumers. This will imply the organization of effective and efficient value chains. A competitive Nepali agriculture will have implications for redressing the large food and agriculture trade deficit. Competitiveness is based on comparative advantage, but goes one step further: rather than focusing only on cheaper costs, it looks at higher value added, quality, and safety. 3.4.4 Inclusion
81. Poverty, social and geographic exclusion, and massive youth outmigration have multiple and complex links with agricultural development. The high differentiation of Nepal society has led in the past to polarization and social conflict. The ADS will need to identify mechanisms that value diversity, eliminate or reduce polarization, and create cooperative arrangements for mutual benefits of the parties involved. This will need to be realistically formulated given the economic stage of development, the resources available, and the support of a leadership able to promote consensus around the strategy and its implementation. Budget allocations are often silent over how to enhance women’s strategic positions through recognizing women as independent and autonomous farmers, ensuring women’s access to means of production, enhancing their leadership competence and creating acceptance, and improving women’s position in different structures of the government, non-government and private sectors.
82. The benefits of agricultural development should be shared by different groups, including the farmers, the land owners, the farm workers, and the enterprises. In particular, the vision indicates that marginal groups should be included to the possible extent into programs and sharing of benefits of agriculture. 83. Land is the most important asset of farmers. Land distribution in Nepal indicates that a large majority (about 82%) own less than 1 ha. Rural population could be roughly classified into three groups comprising 18% of small commercial farmers (with 1 to 5 ha of land); 17% of subsistence farmers (with 0.5 to 1 ha of land); and the landless and near landless (less than 0.25 ha) comprising about 65% of the rural population. Similarly, the livestock herd size averages 2 to 3 livestock units. An effective agricultural strategy will directly benefit the small commercial farmers and could substantially raise the productivity of the subsistence farmers, whereas the impact on the landless and near landless with be mostly through employment effects. Subsistence farmers might require the formulation of a special extension program. 3.4.5 Economic growth 84. Consistently with the theory and insights of agricultural transformation, a more dynamic agriculture is accompanied by higher productivity growth and lower share of agricultural labor in agriculture. Growth of agricultural-based activities will have rural non-farm effects and imply increased employment in non-farm employment. This will typically include agroprocessing, storage,
TA 7762-NEP Preparation of the Agricultural Development Strategy – Vision Report
25
trade, food service, production services, and agritourism. Higher economic growth of agricultural sector will in turn contribute to higher GDP. 85. Economic growth has to accelerate relatively to the past. During the APP period (1995 to 2010) average growth rate of agricultural GDP was 3%. This growth has to accelerate so that, combined with a reduced population growth rate and reduced growth of agricultural labor, GDP per capita in agriculture will increase sufficiently to result in poverty reduction and improvement in living standards in rural areas. 3.4.6 Improved livelihood8
86. A livelihood comprises the capabilities, assets (including both material and social resources) and activities required for a means of living. A livelihood is sustainable when it can cope with and recover from stresses and shocks, maintain or enhance its capabilities and assets, while not undermining the natural resource base (see Chambers and Conway (1992). 87. Five key elements of the definition can be recognized; the first three focus on livelihoods, linking concerns over work and employment with poverty reduction with broader issues of adequacy, security, well-being and capability. The last two elements add the sustainability dimension, looking, in turn, at the resilience of livelihoods and the natural resource base on which, in part, they depend.
i) Creation of working days – This relates to the ability of a particular combination of livelihood strategies to create gainful employment for a certain portion of the year. This may be on or off-farm, part of a wage labor system or subsistence production. In terms of the income/production aspects, various target levels have been suggested, but 200 days a year appears to be widely used as a minimum level to create a livelihood (Lipton 1991; 1993).
ii) Poverty reduction – The poverty level is a key criterion in the assessment of livelihoods. Various measures can be used to develop an absolute ‘poverty line’ measure based on income or consumption levels (Ravallion 1992; Baulch 1996). Alternatively, relative poverty and inequality can be assessed using Gini coefficient measures. There are a range of pros and cons for each measure, as well as some major measurement challenges (Greeley 1994). However, such quantitative assessments of poverty can be used in combination with more qualitative indicators of livelihoods (Jodha, 1988; Schaffer 1996).
iii) Well-being and capabilities – The notions of ‘well-being’ (cf. Chambers 1995; 1997) and
‘capability’ (Sen 1984; 1987) provide a wider definitional scope for the livelihoods concept. Sen sees capabilities as ‘what people can do or be with their entitlements’, a concept which encompasses far more than the material concerns of food intake or income. Such ideas represent more than the human capital which allows people to do things, but also the intrinsically valued elements of ‘capability’ or ‘well-being’. Chambers (1997) argues that such a well-being approach to poverty and livelihood analysis may
8 This section is adapted from Ian Scones 1998, Sustainable Rural Livelihoods. A Framework for Analysis, IDS
Working Paper 72.

TA 7762-NEP Preparation of the Agricultural Development Strategy – Vision Report
26
allow people themselves to define the criteria which are important. This may result in a range of sustainable livelihood outcome criteria, including diverse factors such as self-esteem, security, happiness, stress, vulnerability, power, exclusion, as well as more conventionally measured material concerns (Chambers 1989).
iv) Livelihood adaptation, vulnerability and resilience – The ability of a livelihood to be able
to cope with and recover from stresses and shocks is central to the definition of sustainable livelihoods. Such resilience in the face of stresses and shocks is key to both livelihood adaptation and coping (Davies 1996). Those who are unable to cope (temporary adjustments in the face of change) or adapt (longer term shifts in livelihood strategies) are inevitably vulnerable and unlikely to achieve sustainable livelihoods. Assessing resilience and the ability to positively adapt or successfully cope requires an analysis of a range of factors, including an evaluation of historical experiences of responses to various shocks and stresses. Different types of shock or stress, in turn, may result in different responses, including avoidance, repartitioning, resistance or tolerance mechanisms (Payne and Lipton 1994: 15).
v) Natural resource base sustainability – Most rural livelihoods are reliant on the natural
resource base at least to some extent. Following Conway (1985), Holling (1993) and others, natural resource base sustainability refers to the ability of a system to maintain productivity when subject to disturbing forces, whether a ‘stress’ (a small, regular, predictable disturbance with a cumulative effect) or a ‘shock’ (a large infrequent, unpredictable disturbance with immediate impact). This implies avoiding depleting stocks of natural resources to a level which results in an effectively permanent decline in the rate at which the natural resource base yields useful products or services for livelihoods. Measuring natural resource sustainability is notoriously difficult, as it is critical to link indicators of resource depletion or accumulation (e.g. soil fertility levels, vegetation cover etc.) to both the temporal dynamics of system resilience (i.e. the ability to recover from disturbance) and livelihood needs (i.e. an assessment of whether natural resource change results in ‘effectively permanent declines in useful products or services’).
3.4.7 Food and nutrition security
88. The definition of food and nutrition security proposed by FAO in 1996 entails the aspect of food availability, food access, food use and utilization, and stability. Even though agriculture is not the only determinant of food security, it is however a major one. The vision for agricultural sector in Nepal implies that growth is reflected not only in additional income but in the availability, access, and utilization of more nutritious food, particularly of those who are currently food insecure. Food and nutrition security is also related to the dimensions of inclusion and livelihoods of the vision statement. 89. There is a need to clarify to what extent nutritional security requires an emphasis on a more diversified agricultural production system with a larger role of animal and horticultural products than foodgrains. As urban markets and international food trade increase, food safety issues will also become more important aspects of food and nutrition security.
90. The GON is currently in the process of finalizing a Multi-Sectoral Nutritional Plan (MSNP) that has established goals to attain reduction of chronic malnutrition. The ADS vision will be

TA 7762-NEP Preparation of the Agricultural Development Strategy – Vision Report
27
consistent with the MSNP and also with the ongoing formulation of the Food and Nutrition Security Plan of Action (FNSPA) currently undertaken by GON with the support of FAO.
3.5 Targets and Indicators 91. The formulation of targets at this stage of the ADS formulation should be taken with caution as a first indication of what is intended to achieve. 92. Targets should be specific, measurable, attainable, realistic, and timely (S.M.A.R.T. principle, see APPENDIX 6). 93. In fact, only when the full policy options analysis and action plan is specified, it will be possible to clearly understand if the targets established at this stage comply with the SMART principles. Phase 3 and Phase 4 of the ADS TA will conduct such analysis and action plan. 94. Targets are listed for the short term (5 years ), medium term (10 years), and long term (20 years). 95. Each target is accompanied by indicators that allow to measure progress (or lack thereof) towards the target. 96. At this stage we can only evaluate whether or not the targets are specific, measurable, and timely. Their attainability and realism depend on the initial conditions, the strategy to be adopted, and the commitment of policy makers. The next phases of the ADS TA will focus on policy options, action plans, and road map. As such, the next phases of the ADS TA will need to evaluate the attainability, realism, and feasibility of reaching the targets indicated at this stage. Some targets might be reformulated as the result of the analysis and consultations in Phase 3 and Phase 4. Table 3 Preliminary Indicators and Targets for ADS Vision Vision Component
Indicators Current Situation
(2010)
Target Short Term (5 years)
Target Medium Term (10 years)
Target Long Term (20
years)
Self-reliant
Self-sufficiency in foodgrains
Currently 5% trade deficit in foodgrains
0% trade deficit in foodgrains
0-5% trade surplus in foodgrains
0-5% trade surplus in foodgrains
Sustainable
Year-round irrigation coverage
18% 30% 60% 80%
Soil organic matter Soil fertility at 4% organic matter
Soil fertility maintained at 4% organic matter
Soil fertility maintained at 4% organic matter
Soil fertility maintained at 4% organic matter
Ha degraded land 3.2 million ha (28% of land)
2.88 million ha (reduction of 10%)
2.56 million ha (reduction of 20%)
1.6 million ha (reduction of 50%)
TA 7762-NEP Preparation of the Agricultural Development Strategy – Vision Report
28
Vision Component
Indicators Current Situation
(2010)
Target Short Term (5 years)
Target Medium Term (10 years)
Target Long Term (20
years)
Forest cover 39% 39% 39% 39%
Agricultural land productivity (AGDP/ha)
$1,804 $2,302 $2,938 $4,787
Agribusiness Share of GDP
10% 13% 17% 25%
Competitive
Agricultural trade balance
$350 million trade deficit
Reduce food and agriculture trade deficit by 12% ($310 million)
Reduce food and agriculture trade deficit by 48% ($181 million)
Food and agricultural trade surplus of $690 million
Agricultural Exports $248 million $400 million $600 million $1000 million
Inclusive
GDI (Gender Development Index)
0.499
0.550
0.675
0.750
Percent of land ownership by women/ joint ownership
10% 20% 50% 80%
Percent of rural households covered by agricultural services and programs
12% 17% 22% 30%
Growth
Average annual growth of AGDP
3% 4% 5% 6%
Livelihood
AGDP/ Agricultural labor
$794 $979 $1206 $1833
Poverty in Rural Areas 35% 28% 20% 10%
Food and Nutrition Security
Food Poverty 16% 12% 8% 1%

TA 7762-NEP Preparation of the Agricultural Development Strategy – Vision Report
29
Vision Component
Indicators Current Situation
(2010)
Target Short Term (5 years)
Target Medium Term (10 years)
Target Long Term (20
years)
Chronic Malnutrition as measured by - % stunting (height for age) among under 5 children - Underweight (weight for age) among under 5 children - Wasting (weight for height) among under 5 children - Women with chronic energy deficiency (measured as BMI)
41.5% stunting; 31.1%
underweight; 13.7% wasting
Reduction Consistent with
MSNP and FSNPA
Reduction Consistent with
MSNP and FSNPA
Reduction Consistent with MSNP and FSNPA
Sources for Baseline: Agricultural trade balance and Agricultural Exports: TEPC, Nepal Foreign Trade Statistcs 2009/2010. Year-round irrigation coverage, Department of Irrigation Soil organic matter: MFSC Ha degraded land: MoEST, 2006. Rural Energy Policy. Ministry of Environment Science and Technology Forest cover: MFSC Agricultural land productivity (AGDP/ha): Based on Statistical Information of Nepalese Agriculture, MOAD, 2010/11. Agribusiness Share of GDP: Economic Survey 2010/11. GDI (Gender Development Index): UN Women Percent of land ownership by women/ joint ownership: UN Women Percent of rural households covered by agricultural services and programs: Nepal Living Standard Survey Average annual growth of AGDP: Economic Survey 2010/11. AGDP/ Agricultural labor: Economic Survey 2010/11. Poverty in Rural Areas: Central Bureau of Statistics Self-sufficiency in foodgrains: Based on Statistical Information of Nepalese Agriculture, MOAD, 2010/11. Stunting of children 0-60 months: Nepal and Health Demographic Survey Proportion of food insecure: Nepal Living Standard Survey

TA 7762-NEP Preparation of the Agricultural Development Strategy – Vision Report
30
APPENDIX 1. THE ADS PREPARATION IN BRIEF 97. The Technical Assistance (TA) 7762-NEP Preparation of the Agricultural Development Strategy is funded by Government of Nepal with support of the Asian Development Bank (ADB), International Fund for Agricultural Development (IFAD), European Union (EU), Food and Agriculture Organization (FAO), Swiss Agency for Development and Cooperation (SDC), Japan International Cooperation Agency (JICA), Denmark Agency for International Development (DANIDA), and United States Agency for International Development (USAID). Other development partners including WFP, the World Bank, USAID, AusAID, CIDA, FINNIDA, and DfID, have expressed interest in engaging in the process of preparation of the strategy. The Executing Agency (EA) is the Ministry of Agriculture Development (MOAD). The Steering Committee is co-chaired by Ministry of Finance (MOF) and MOAD. 98. The objective of the TA is to prepare an agriculture development strategy (ADS) with a 20-year vision and a 10-year planning horizon. The impact is sustainable growth in value in an agriculture sector that is more resilient to climate change. The outcome is a draft of the ADS submitted to the MOAD and approved.
99. The scope of the ADS includes: (i) Food security, agricultural productivity, connectivity and resilience; (ii) Sustainable production and resource management through climate change mitigation; (iii) Adaptation and improved land and water management and water allocation; (iv) Increased private sector development (including cooperative sector), delivering fair reward to all stakeholders in the value chain; and (v) Policies, institutions, and investments. 100. The approach of the TA is based on the combination of three pillars: (i) a broad view of the agricultural sector; (ii) external peer reviews; and (iii) effective communication and broad consultations. The TA will be implemented over 4 phases.
101. Phase 1-Assessment will address the key question: Where are we now and why? This will involve a review and assessment of the agricultural sector, its trends, the key constraints, and the policy and institutional issues and gaps. Phase 2-Vision will address the key question: Where do we want to be over the next 20 years? This will entail to articulate a long-term vision for the agricultural sector in Nepal. Phase 3-Policy Options will address the key question: How do we go from where we are (the current situation of agricultural sector in 2011) to where we want to be (the vision for 2030)? The effort will be to explore different options for policy and investments. Phase 4-Road Map and Action Plan will address the key question: what road map will we choose and what milestones will be along the road map? The idea here is to select the strategy and formulate action plans that guide the implementation of the strategy.
102. A number of mechanisms ensure that the preparation of the ADS is based not only on sound analytical work but also on extensive consultations with a broad range of stakeholders. Consultations will involve: (i) key informants interviews; (ii) policy roundtables; (iii) national and regional workshop; (iv) a national conference; (v) thematic groups; (vi) external reviews; (viii) field work; and (ix) steering committee meetings. There will be 12 thematic groups on different topics to help the TA Team improve formulation of the ADS.

TA 7762-NEP Preparation of the Agricultural Development Strategy – Vision Report
31
APPENDIX 2. ADS WORK PLAN 103. The TA for the preparation of the ADS will occur over the period April 2011 to April 2013. The length of the period is justified by:
1. The complexity of the task 2. The need of numerous and frequent consultations at the central and local level 3. The inclusion of both strategy and action plan in the final document 4. The number of intermediate deliverables
A2.1. Phases of the TA 104. The work plan of the TA is organized into four phases. The duration of each phase is as follows:
Phase 1 – Assessment: Phase 2 – Vision: Phase 3 – Policy Options: Phase 4 – Road Map and Action Plan:
A2.2. Activities 105. During Phase 1, the main outcome is the assessment of the current situation for the agricultural sector. The TA will establish an office on the premise provided by the EA. The TA Team will be mobilized by the different agencies supporting the implementation including the counterpart officers provided by the EA, the consultants contracted by ADB, and the consultants provided by FAO, SDC, JICA, and other agencies that will support the ADS. Initial administrative, financial, and management systems will be established and compilation of data and literature will be organized into a server system on the TA office. In addition to consultations conducted by all TA Team member with key stakeholders through key informant interviews, the TA Team will undertake more systematic consultations including: (i) thematic group meetings; (ii) national and regional workshops; (iii) field work consultations with communities; (iv) project steering committee meetings; and (v) external reviews of deliverables. The main deliverables in this phase include the Inception Report and the Assessment Report. Intermediate outputs will include summary of events and background reports of the TA Team experts. 106. During Phase 2, the main outcome is the preparation of the vision for ADS. In addition to the consultations at the local, regional, and central level undertaken through a combination of field work, regional and national workshops, key informant interviews, focus group discussions, thematic group meetings, and steering committee meetings, the TA Team will organize a National ADS Conference. The Conference will include invited papers by national and international experts, both from the TA Team and external experts. The objective of the Conference is to have a broad set of contributions to stimulate new ideas about the assessment, the vision, and the strategic directions of the ADS. 107. During Phase 3, the main outcome is the identification of policy options to move from the current situation to the vision. For each policy option, an in-depth discussion of the advantages and

TA 7762-NEP Preparation of the Agricultural Development Strategy – Vision Report
32
disadvantages, and the institutional, policy, and legal requirements will be conducted by Team Members. The discussion should aim to identify a set of policy options that will form the core of the strategy and action plan. In addition to the analytical work, the TA Team will conduct consultations at the local, regional, and central level through a combination of field work, regional and national workshops, key informant interviews, focus group discussions, thematic group meetings, and steering committee meetings.
108. During Phase 4, the main outcome is the submission of the ADS document including both strategy and action plans. A detailed road map and action plans for the policy options identified in the previous phase will be undertaken, including costs and benefits, detailed institutional policy and legal requirements, milestones, and monitoring and evaluation framework. A preliminary draft will be prepared by March 2013, after extensive discussion with the EA, the Steering Committee, the NPC, and the External Panel Review. Regional consultations will also be undertaken to have additional feedback on the proposed strategy before submitting the March 2013 draft. A Final Workshop will be organized in March 2013. The Final Draft will be submitted by mid-April 2013.

TA 7762-NEP Preparation of the Agricultural Development Strategy – Vision Report
33
APPENDIX 3. DEVELOPMENT PARTNERS AND THE ADS
No. Partner Already Engaged As of 31 January 2012
Level of Engagement
1. ADB $1.5 million
2. IFAD $0.5 million
3. EU Support International Consultant (6 person months)
4. FAO Support 5 National Consultants (13 person months)
5. SDC Support 1 National Consultant (3 person months)
6. JICA Support 1 National Consultant (3 person months)
7. DANIDA Support 2 International Consultants (5 person month) Support 1 National Consultant (5 person months)
8. USAID Support 2 Workshops
9. WFP Preparation of Background Paper on Monitoring and Evaluation Systems for Food Security and Nutrition
10. World Bank Supports 2 consultants on land issues, 1 on research management, 1 on rangeland management, and 3 peer reviewers
11. DfID Supports 1 international and 1 local consultant on private sector development
12. AusAID Supports further dialogues and consultation with farmer organization, civil society, and media.

TA 7762-NEP Preparation of the Agricultural Development Strategy – Vision Report
34
APPENDIX 4. FOOD SOVEREIGNTY 109. In the course of the Workshop on a Vision for the agricultural sector of Nepal a proposal was made to include the term “Food Sovereignty” as part of the Vision. The current appendix discusses the term Food Sovereignty in its global context and the manner it has been used and applied in Nepal. 110. The term Food Sovereignty, used by the Via Campesina movement (VC) was brought to the forefront at World Food Summit in 1996. The VC defines12 Food Sovereignty as:
The peoples’, Countries’ or State Unions’ RIGHT to define their agricultural and food policy, without any dumping vis-à-vis third countries. Food sovereignty includes:
prioritizing local agricultural production in order to feed the people, access of peasants and
landless people to land, water, seeds, and credit. Hence the need for land reforms, for
fighting against GMOs (Genetically Modified Organisms), for free access to seeds, and for
safeguarding water as a public good to be sustainably distributed.
the right of farmers, peasants to produce food and the right of consumers to be able to
decide what they consume, and how and by whom it is produced.
the right of Countries to protect themselves from too low priced agricultural and food
imports.
agricultural prices linked to production costs : they can be achieved if the Countries or Unions
of States are entitled to impose taxes on excessively cheap imports, if they commit
themselves in favour of a sustainable farm production, and if they control production on the
inner market so as to avoid structural surpluses.
the populations taking part in the agricultural policy choices.
the recognition of women farmers’ rights, who play a major role in agricultural production
and in food.
111. The VC statement contains three types of rights, as follows; a. Individual rights such as land reform, access to resources and rights of women
farmers;
b. Political rights such as the right of the populations to take part in agricultural
choices; and
c. States’ rights, to object to the globalization trends, including to the
commercialization of the agricultural production.
12
See: http://viacampesina.org/en
TA 7762-NEP Preparation of the Agricultural Development Strategy – Vision Report
35
112. The VC principles seem strongly connected to the anti-globalization movement and in particular to the control of agricultural production in certain countries by multi-national companies that control agricultural inputs such as GM seeds, production and marketing. The power of fruit companies in Central America (but not only) come into mind. 113. VC principles were further elaborated in a conference that took place in 2003 in Nyeleni, Mali. The Nyeleni Declaration, reproduced in the Annexure hereto, is a rather strong call against all commercialization of the agricultural sector. Food Sovereignty is viewed as the people’s right to determine their own agricultural and food production policies without external interference. 114. The Food Sovereignty concept is therefore a policy statement. The various statements encourage the people to adopt the Food Sovereignty policy as state policies thereby transferring the sovereignty over food to the people.
115. It seems that the term Food Sovereignty in Nepali law has a rather different meaning13. The term Food Sovereignty is mentioned three times in the Nepali Interim Constitution, as follows:
Article 18 (3): Right regarding Employment and Social Security Every citizen shall have the right to food sovereignty as provided for in the law. Article 33: Responsibilities of the State: The State shall have the following responsibilities: (h) To pursue a policy of establishing the rights of all citizens to education, health,
housing, employment and food sovereignty Article 35: State Policies: (10) The State shall pursue a policy which will help to promote the interest of the
marginalized communities and the peasants and labourers living below poverty line, including economically and socially backward indigenous tribes, Madhesis, Dalits, by making reservation for a certain period of time with regard to education, health, housing, food sovereignty and employment
116. The term Food Sovereignty was included in the IC at the insistence of certain farmer groups and NGOs and supported by some of the political parties (elements in the CPN-UML and the Maoists). The term is nor defined in the IC nor is its meaning in the IC very clear, as explained further below
d. Article 18 is part of the fundamental rights chapter of the IC which deals with individual
rights of the citizens of Nepal and the Article’s heading is Rights Regarding Employment
and Social Security. Indeed section (1) of Article 18 deals with the right of employment
and section (2) deals with the right to social security. The right to Food Sovereignty is
bundled together with additional individual rights i.e. education, health, housing and
employment. It appears therefore that the term Food Sovereignty is used in the context
of an individual fundamental right similar to rights such as education and health, etc. It
does not seem a collective right or a policy statement on the conduct of the agricultural
sector. I was told that petitioners from one of the districts with a food deficit petitioned
the Supreme Court on the basis of their right to Food Sovereignty and the Court, in
13
It can be of course that some or all of the proponents of the inclusion of the term in the Interim Constitution wished to adopt the VC meaning thereof. As explained herein, the language of the IC does not support that interpretation.
TA 7762-NEP Preparation of the Agricultural Development Strategy – Vision Report
36
accepting their petition interpreted the right to Food Sovereignty as a right to food,
perhaps as a right to food sufficiency.
It should also be noted that the rights in Article 18 (3) are “as provided by law”, thus one cannot interpret Food Sovereignty as an abstract right but only a right whose practical implication is as provided by legislation.
e. In Articles 33 and 35 (Responsibilities of the State and State Policies respectively) the
term Food Sovereignty is listed in the same context as in Article 18, i.e. bundled together
with education, health, housing and employment. In Article 33 (h) the IC provides that
the State pursue a policy of promoting the individual rights listed in Article 18 (3) by
listing the exact same rights also in Article 33 (h). Hence Article 33 (h) is the mirror image
of Article 18 (3) whereby the Government takes upon itself to pursue a policy of
promoting these rights. If the interpretation of Food Sovereignty in Article 18 (3) is the
right of food sufficiency the same would apply to Article 33 (h) as well.
f. Article 35 (10) is a temporary policy undertaking that the State will provide certain rights
to the disadvantaged. In addition to the bundling of education, health, housing and
employment with Food Sovereignty in the same manner as in Article 33 (h) the
temporary nature of the policy shows that it was the intent that it deals with food
sufficiency rather than the more general, anti-globalization of the VC movement on Food
Sovereignty.
g. It should also be noted that Article 36 of the IC negates the right of enforcing the
responsibilities and policies listed in Article 33 and 35 in a court of law, i.e. there is no
private right of action.
2. Conclusion and Recommendation
117. The term Food Sovereignty has a different generic meaning than what the strict language of the IC would suggest. It appears that the IC refers to Food Sovereignty more as a right to food sufficiency. 118. 119. To avoid the inclusion of a controversial term into the vision statement one could either substitute the term food sovereignty with the term food sufficiency or food security, or in the alternative, attach to the vision statement an interpretative note. Since the nature of (controversial) interpretive notes is to disconnected from the statement itself, the first proposal, would be recommended.

TA 7762-NEP Preparation of the Agricultural Development Strategy – Vision Report
37
Annexure
Declaration of Nyeleni
We, more than 500 representatives from more than 80 countries, of organizations of peasants/family farmers, artisanal fisherfolk, indigenous peoples, landless peoples, rural workers, migrants, pastoralists, forest communities, women, youth, consumers and environmental and urban movements have gathered together in the village of Nyéléni in Sélingué, Mali to strengthen a global movement for food sovereignty. We are doing this, brick by brick as we live here in huts constructed by hand in the local tradition and eat food that is produced and prepared by the Sélingué community. We give our collective endeavour the name “Nyéléni” as a tribute to and inspiration from a legendary Malian peasant woman who farmed and fed her peoples well. Most of us are food producers and are ready, able and willing to feed all the world’s peoples. Our heritage as food producers is critical to the future of humanity. This is specially so in the case of women and indigenous peoples who are historical creators of knowledge about food and agriculture. But this heritage and our capacities to produce healthy, good and abundant food are being threatened and undermined by neo-liberalism and global capitalism. Food sovereignty gives us the hope and power to preserve, recover and build on our food producing knowledge and capacity. Food sovereignty is the right of peoples to healthy and culturally appropriate food produced through ecologically sound and sustainable methods, and their right to define their own food and agriculture systems. It puts the aspirations and needs of those who produce, distribute and consume food at the heart of food systems and policies rather than the demands of markets and corporations. It defends the interests and inclusion of the next generation. It offers a strategy to resist and dismantle the current corporate trade and food regime, and directions for food, farming, pastoral and fisheries systems determined by local producers and users. Food sovereignty prioritises local and national economies and markets and empowers peasant and family farmer-driven agriculture, artisanal - fishing, pastoralist-led grazing, and food production, distribution and consumption based on environmental, social and economic sustainability. Food sovereignty promotes transparent trade that guarantees just incomes to all peoples as well as the rights of consumers to control their food and nutrition. It ensures that the rights to use and manage lands, territories, waters, seeds, livestock and biodiversity are in the hands of those of us who produce food. Food sovereignty implies new social relations free of oppression and inequality between men and women, peoples, racial groups, social and economic classes and generations. In Nyéléni, through numerous debates and interactions, we are deepening our collective understanding of food sovereignty and learning about the realities of the struggles of our respective movements to retain autonomy and regain our powers. We now understand better the tools we need to build our movement and advance our collective vision. What are we fighting for?

TA 7762-NEP Preparation of the Agricultural Development Strategy – Vision Report
38
A world where… …all peoples, nations and states are able to determine their own food producing systems and policies that provide every one of us with good quality, adequate, affordable, healthy and culturally appropriate food; ...there is recognition and respect of women’s roles and rights in food production, and representation of women in all decision making bodies; …all peoples in each of our countries are able to live with dignity, earn a living wage for their labour and have the opportunity to remain in their homes, if they so choose; ...where food sovereignty is considered a basic human right, recognised and implemented by communities, peoples, states and international bodies; …we are able to conserve and rehabilitate rural environments, fish populations, landscapes and food traditions based on ecologically sustainable management of land, soils, water, seas, seeds, livestock and all other biodiversity; …we value, recognize and respect our diversity of traditional knowledge, food, language and culture, and the way we organise and express ourselves; …. there is genuine and integral agrarian reform that guarantees peasants full rights to land, defends and recovers the territories of indigenous peoples, ensures fishing communities’ access and control over their fishing areas and eco-systems, honours access and control by pastoral communities over pastoral lands and migratory routes, assures decent jobs with fair remuneration and labour rights for all, and a future for young people in the countryside; where agrarian reform revitalises inter-dependence between producers and consumers, ensures community survival, social and economic justice, ecological sustainability, and respect for local autonomy and governance with equal rights for women and men ...where agrarian reform guarantees rights to territory and self-determination for our peoples; ... we share our lands and territories peacefully and fairly among our peoples, be we peasants, indigenous peoples, artisanal fishers, pastoralists, or others; …in the case of natural and human-created disasters and conflict-recovery situations, food
TA 7762-NEP Preparation of the Agricultural Development Strategy – Vision Report
39
sovereignty acts as a form of “insurance” that strengthens local recovery efforts and mitigates negative impacts ... where we remember that communities affected by disasters are not helpless, and where strong local organization for self-help is the key to recovery; ... peoples’ power to make decisions about their material, natural and spiritual heritage are defended; ... all peoples have the right to defend their territories from the actions of transnational corporations; What are we fighting against? Imperialism, neo-liberalism, neo-colonialism and patriarchy, and all systems that impoverish life, resources and eco-systems, and the agents that promote the above such as international financial institutions, the World Trade Organisation, free trade agreements, transnational corporations, and governments that are antagonistic to their peoples; The dumping of food at prices below the cost of production in the global economy; The domination of our food and food producing systems by corporations that place profits before people, health and the environment; Technologies and practices that undercut our future food producing capacities, damage the environment and put our health at risk. These include transgenic crops and animals, terminator technology, industrial aquaculture and destructive fishing practices, the so-called White Revolution of industrial dairy practices, the so-called ‘old’ and ‘new’ Green Revolutions, and the “Green Deserts” of industrial bio-fuel monocultures and other plantations; The privatisation and commodification of food, basic and public services, knowledge, land, water, seeds, livestock and our natural heritage; Development projects/models and extractive industries that displace people and destroy our environments and natural heritage; Wars, conflicts, occupations, economic blockades, famines, forced displacement of peoples and confiscation of their lands, and all forces and governments that cause and support these; Post disaster and conflict reconstruction programmes that destroy our environments and capacities; The criminalization of all those who struggle to protect and defend our rights;
TA 7762-NEP Preparation of the Agricultural Development Strategy – Vision Report
40
Food aid that disguises dumping, introduces GMOs into local environments and food systems and creates new colonialism patterns; The internationalisation and globalisation of paternalistic and patriarchal values that marginalisewomen, and diverse agricultural, indigenous, pastoral and fisher communities around the world; What can and will we do about it? Just as we are working with the local community in Sélingué to create a meeting space at Nyéléni, we are committed to building our collective movement for food sovereignty by forging alliances, supporting each others’ struggles and extending our solidarity, strengths, and creativity to peoples all over the world who are committed to food sovereignty. Every struggle, in any part of the world for food sovereignty, is our struggle. We have arrived at a number of collective actions to share our vision of food sovereignty with all peoples of this world, which are elaborated in our synthesis document. We will implement these actions in our respective local areas and regions, in our own movements and jointly in solidarity with other movements. We will share our vision and action agenda for food sovereignty with others who are not able to be with us here in Nyéléni so that the spirit of Nyéléni permeates across the world and becomes a powerful force to make food sovereignty a reality for peoples all over the world. Finally, we give our unconditional and unwavering support to the peasant movements of Maliand ROPPA in their demands that food sovereignty become a reality in Mali and by extension inall of Africa. Now is the time for food sovereignty!
TA 7762-NEP Preparation of the Agricultural Development Strategy – Vision Report
41
APPENDIX 5. EXAMPLES OF VISION STATEMENTS Overall Agricultural Sector
1. Nepal has a highly productive and commercial agriculture sector that is integrated and competitive in the regional and global agri-food business, and which meets the food and livelihood needs of its people, both rural and urban by 2030
2. Nepalese farmers will have access to accountable, functional, participatory, inclusive and decentralized agricultural knowledge and information systems.
3. Nepal has a productive, resilient, sustainable, and commercial agriculture sector that meets the food and livelihood needs of its people.
4. Nepal has a highly profitable and sustainable agriculture sector that meets the food and livelihood needs of its people.
5. Nepal has a highly productive, commercial, inclusive, and decentralized sustainable agriculture sector that is integrated and competitive in the regional and global agri-food business, and which meets the food and livelihood needs of its people, both rural and urban, and contributing to the national economy.
6. Competitive agriculture that meets the needs of its people, and generates net exports. 7. Socially inclusive, environmentally responsible, globally integrated, and competitive
agriculture. 8. Resilient, competitive agriculture that contributes to food security and poverty reduction. 9. Competitive and sustainable agriculture with higher growth that ensures the livelihood of its
people. 10. Resilient, sustainable, competitive and profitable agriculture that makes a major
contribution to livelihood and poverty reduction. 11. An agricultural sector that provides opportunities and choices to …. 12. Resilient, sustainable, competitive and profitable agriculture that makes a major
contribution to that national economy, livelihood and poverty reduction. 13. Nepal has dynamic, resilient, sustainable and profitable agriculture sector that meets the
food and livelihood needs of its people 14. Priority to meet domestic demand of food, and emphasis to export high value agro products. 15. Profitable, sustainable agricultural contribution to livelihood and economic growth.
Institutions A competitive agriculture supported by effective policy implementation mechanisms and well functioning institutions based on performance management system. Horticulture To increase income and employment opportunities by increasing productivity of horticultural crops through commercialization and marketing management. Livestock Increase productions of livestock products through commercialization to meet its increasing demand and make the country self sufficient. Improve the quality of livestock products for safeguard of consumers and export to international market.
TA 7762-NEP Preparation of the Agricultural Development Strategy – Vision Report
42
Research and Extension Nepalese farmers will have access to accountable, functional, participatory, inclusive and decentralized agricultural knowledge and information systems. Social and Gender Inclusion Sustainable and increased agricultural productivity across the country through enhanced regional equity and participation of all gender and excluded groups in policies, programs and projects Irrigation By 2030, the irrigated agriculture sector will have expanded in terms of production by 100% over 2011 levels (4%/year), reducing food insecurity by 75% (in terms of the number of food insecure households) and increasing household income for rural Nepalis by at least 50% in real terms. Agricultural Production Nepal’s Agricultural Production increases at an average annual rate of at least 5% over the ADS period 2013 to 2030, with rural poverty reduced by at least 70% and increased food and nutrition security, with improved a highly productive, competitive commercial agriculture sector serviced by an efficient, effective decentralized agricultural knowledge and information systems and supported by well developed Agribusiness Enterprises. High Value Products To increase the income and employment opportunities by increasing productivity of high value crops
through commercialization and functional value chain network. Livestock Livestock (Agriculture) sector is commercialized and production increases at an average annual rate of 5% over ADS period, with rural poverty reduced to less than 10%, effect of climate change is managed and food and nutrition security is achieved. Forestry To meet the people/s basic needs of forest products and to contribute to local and national economic growth through intensive management of forests , lands and value addition of forest products. NAP 2004 The long-term vision of the agricultural sector is improved living standards through sustainable agricultural development by transforming the subsistence agricultural system into a commercial and competitive agricultural system. Agribusiness and Trade Nepal has a highly productive and commercial agriculture sector that is integrated and competitive in the regional and global agri-food business, and which meets the food and livelihood needs of its people, both rural and urban by 2030 Tax Tax policy will support the development of an efficient commercialized agricultural sector through providing subsidies and targeted tax incentives, until the sector has reached a sufficient level of maturity and sustainability that those subsidies and incentives may be phased out.

TA 7762-NEP Preparation of the Agricultural Development Strategy – Vision Report
43
Finance A collection of diverse, private-sector, viable and sustainable agricultural finance providers, free from Government influence in operations, that provide a variety of competitive, demand-driven loan and credit-related products readily available to all actors at all stages of agricultural value chains.
Food Crops A self reliant, food-secure and prosperous nation with an average AGDP growth rate of 6 per cent per year over the next 20 years through an innovative, commercially oriented modern agriculture.

TA 7762-NEP Preparation of the Agricultural Development Strategy – Vision Report
44
APPENDIX 6. S.M.A.R.T. GOALS While formulating the vision try to follow the principle of establishing smart goals. S.M.A.R.T. stands for:
Specific
Measurable
Attainable
Realistic
Timely
Specific: A specific goal has a much greater chance of being accomplished than a general goal. To set a specific goal you must answer the six “W” questions:
*Who: Who is involved?
*What: What do I want to accomplish?
*Where: Identify a location.
*When: Establish a time frame.
*Which: Identify requirements and constraints.
*Why: Specific reasons, purpose or benefits of accomplishing the goal.
Measurable - Establish concrete criteria for measuring progress toward the attainment of each goal you set.
When you measure your progress, you stay on track, reach your target dates, and experience the exhilaration of achievement that spurs you on to continued effort required to reach your goal.
To determine if your goal is measurable, ask questions such as……
How much? How many?
How will I know when it is accomplished?
Attainable – When you identify goals that are most important to you, you begin to figure out ways you can make them come true. You develop the attitudes, abilities, skills, and

TA 7762-NEP Preparation of the Agricultural Development Strategy – Vision Report
45
financial capacity to reach them. You begin seeing previously overlooked opportunities to bring yourself closer to the achievement of your goals.
Realistic- To be realistic, a goal must represent an objective toward which you are both willing and able to work. A goal can be both high and realistic; you are the only one who can decide just how high your goal should be. But be sure that every goal represents substantial progress.
Timely – A goal should be grounded within a time frame. With no time frame tied to it there’s no sense of urgency