Embed Size (px)
Citation preview

VISION / PROGRESS MONITORING UPDATE
Student Outcome Goals 1 & 5 | MAP UPDATE
APRIL 8, 2021
STUDENT OUTCOME GOAL 1
Student Outcome Goal 12018-19 Actual
2019-20 COVID Pause
2020-21 Targets
2020-21 Actual
Mid-YearOn
Track? 2021-22Target
2022-23Target
2023-24Target
2024-25Target
Goal 1Student achievement on state assessments in all subjects in Domain 1 will increase from 46 to 58 by June 2025. 46 n/a 43 / 48
-- --51 53 56 58
GPM 1.1Student achievement on TEKS aligned district assessments in all state assessed subjects using the Domain 1 calculation will increase from 45 to 57 by January 2025. (BOY ACP) 45 42 / 47 N/A ? 50 52 55 57
GPM 1.2
African American student achievement on TEKS aligned district assessments in all state assessed subjects using the Domain 1 calculation will increase from 37 to 54 by January 2025. (BOY ACP) 37 34 / 40 N/A ? 44 47 51 54
GPM 1.3
Student achievement on TEKS aligned district assessments in all state assessed subjects at Meets performance level or above will increase from 32.3% to 40.0% by January 2025. (BOY ACP) 32.3
30.0 / 34.0 N/A ? 37.0 39.0 42.0 44.0
2Notes: For the 2020-21 targets, the green text is the original target, and the red text is the Board-adjusted target due to COVID-19.
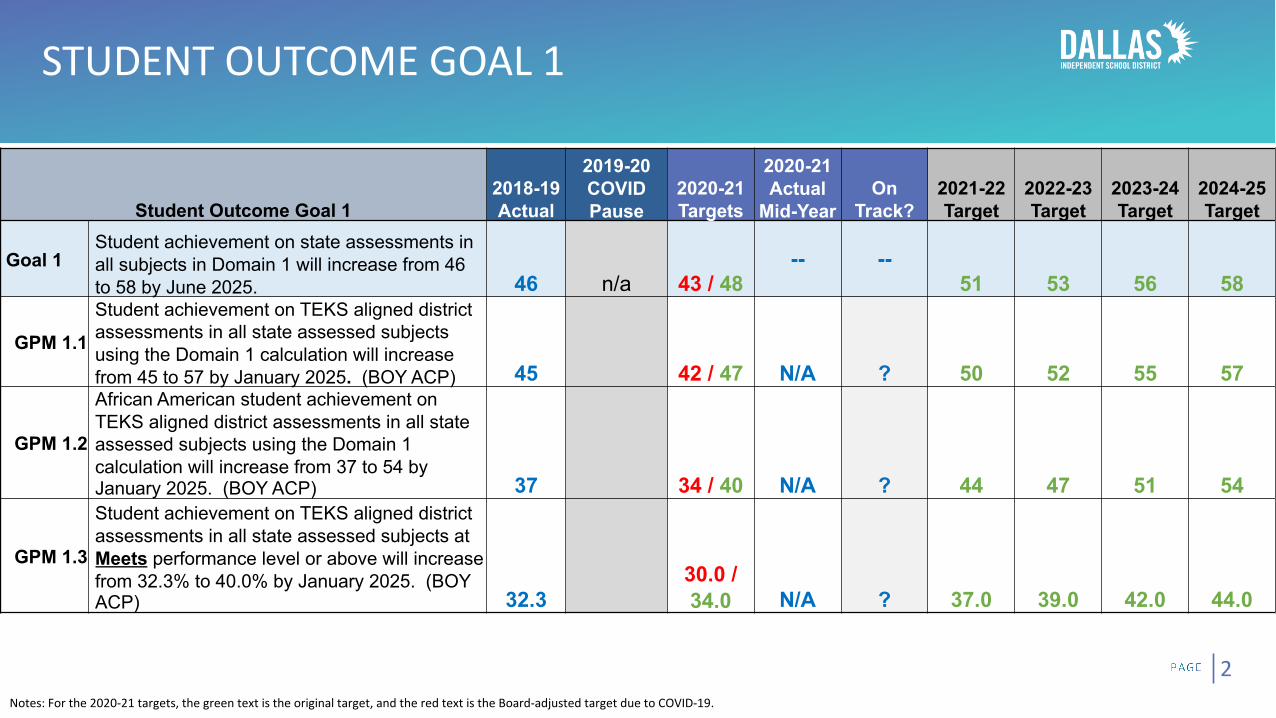
STUDENT OUTCOME GOAL 5
3
Student Outcome Goal 52018-19 Actual
2019-20 COVID Pause
2020-21 Targets
2020-21 Actual
Mid-YearOn
Track? 2021-22Target
2022-23Target
2023-24Target
2024-25Target
Goal 5 Middle-grade (grades 6-8) student achievement on state assessments in all subjects in Domain 1 will increase from 40 to 50 by June 2025. 40 n/a 39 / 42
-- --44 46 48 50
GPM 5.1
Middle-grade (grades 6- 8) student achievement on TEKS aligned district assessments in all state assessed subjects using the Domain 1 calculation will increase from 40 to 48 by January 2025. (BOY ACP) 40 40 / 42 N/A ? 44 46 48 50
GPM 5.2
Middle-grade African American (grades 6-8) student achievement on TEKS aligned district assessments in all state assessed subjects using the Domain 1 calculation will increase from 33 to 46 by January 2025. (BOY ACP) 33 33 / 36 N/A ? 39 41 43 46
GPM 5.3The percent of middle-grade students (grades 6-8) scoring at or above the 50th percentile on a standardized reading assessment will increase from 40.0% to 44.0% by June 2025. (MAP EOY) n/a
Baseline
39.0 /40.0 39.4 Yes 41.0 42.0 43.0 44.0
Notes: For the 2020-21 targets, the green text is the original target, and the red text is the Board-adjusted target due to COVID-19.
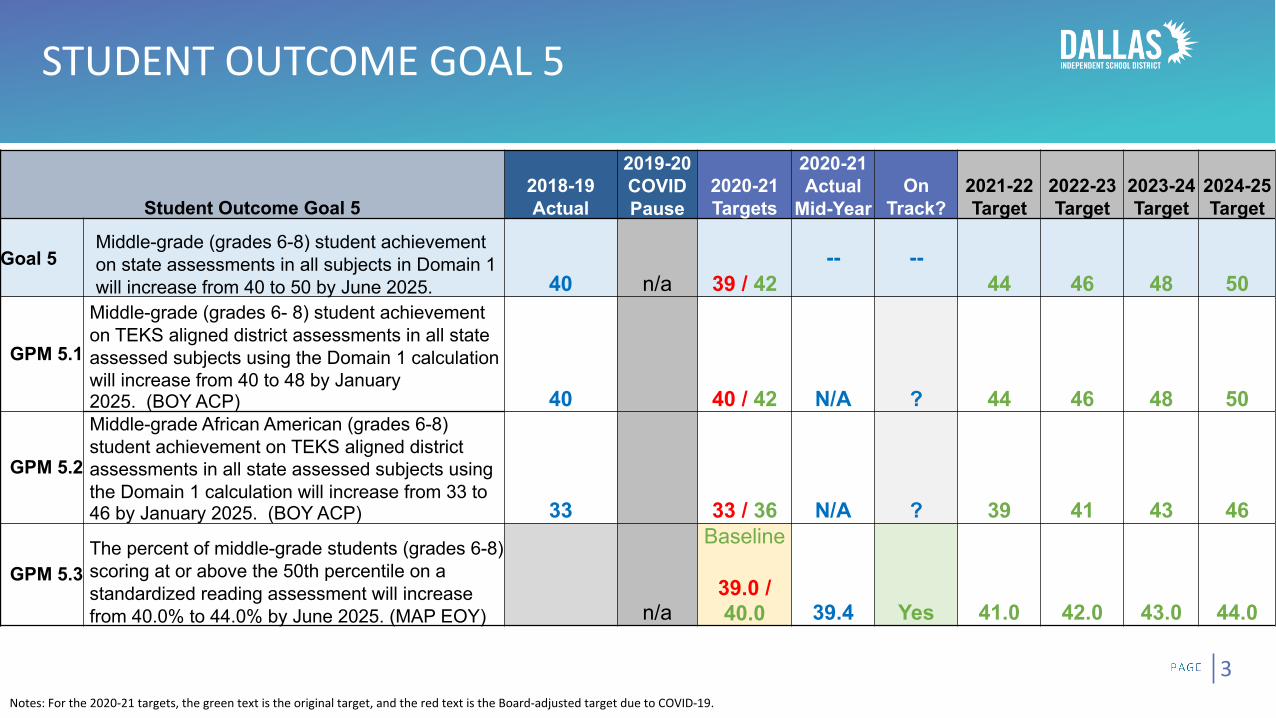
LIMITATIONS OF THE DATA
4
Only Math and Reading scores are included (no Science, Social Studies, or Writing data are available)• Therefore, Domain 1 estimates here are limited and are not an actual Domain 1 calculation with all content areas
Reading projections and domain calculations include English only results (Spanish projections unavailable)
MAP participation rates were not uniformly consistent across grades and student groups Grades 3-11 only
Note that the next update on achievement data will not come until August 2021
! Note the following limitations of the data that impact interpretation and projections
These limitations make it difficult to provide comprehensive “on/off-track” projections for upcoming STAAR achievement.
GOAL 1 | GRADES 3-8 MATH AND READING MAP (ENGLISH ONLY)
5
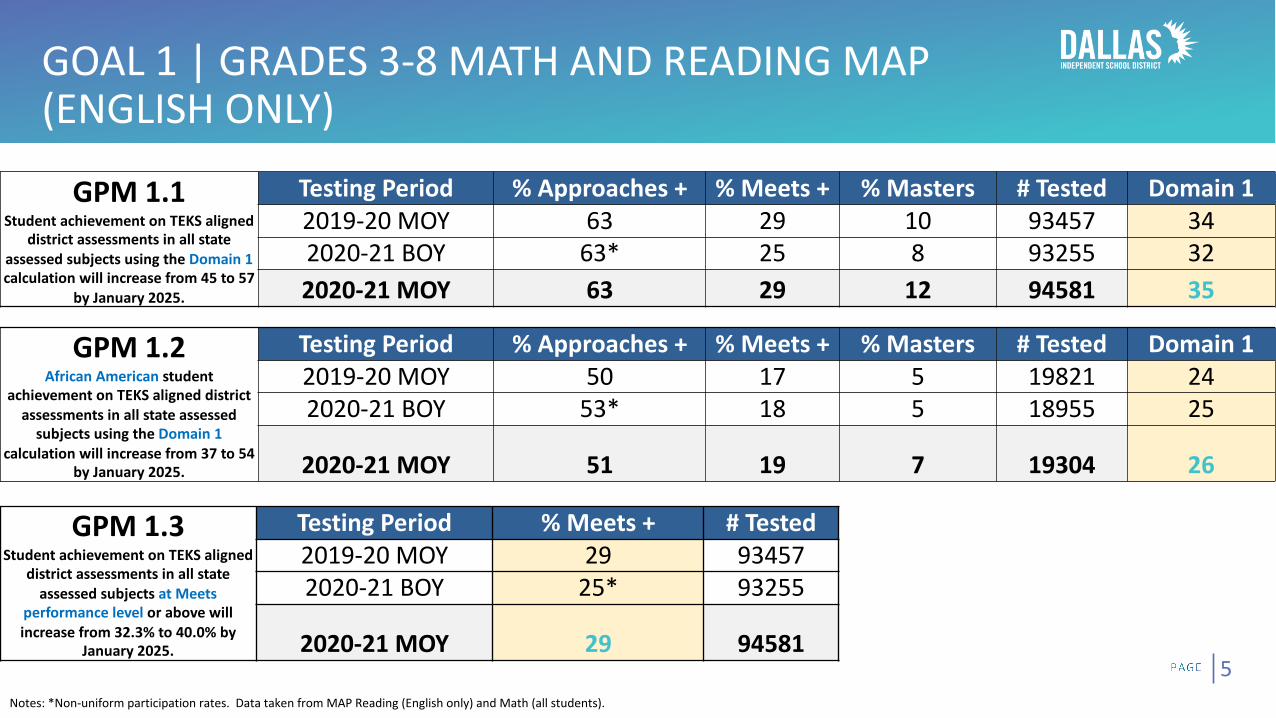
GPM 1.1Student achievement on TEKS aligned
district assessments in all state assessed subjects using the Domain 1 calculation will increase from 45 to 57
by January 2025.
Testing Period % Approaches + % Meets + % Masters # Tested Domain 12019-20 MOY 63 29 10 93457 342020-21 BOY 63* 25 8 93255 322020-21 MOY 63 29 12 94581 35
GPM 1.2African American student
achievement on TEKS aligned district assessments in all state assessed
subjects using the Domain 1 calculation will increase from 37 to 54
by January 2025.
Testing Period % Approaches + % Meets + % Masters # Tested Domain 12019-20 MOY 50 17 5 19821 242020-21 BOY 53* 18 5 18955 25
2020-21 MOY 51 19 7 19304 26
GPM 1.3Student achievement on TEKS aligned
district assessments in all state assessed subjects at Meets
performance level or above will increase from 32.3% to 40.0% by
January 2025.
Testing Period % Meets + # Tested2019-20 MOY 29 934572020-21 BOY 25* 93255
2020-21 MOY 29 94581
Notes: *Non-uniform participation rates. Data taken from MAP Reading (English only) and Math (all students).
GOAL 5 | GRADES 6-8 MATH AND READING MAP (ENGLISH ONLY)
4
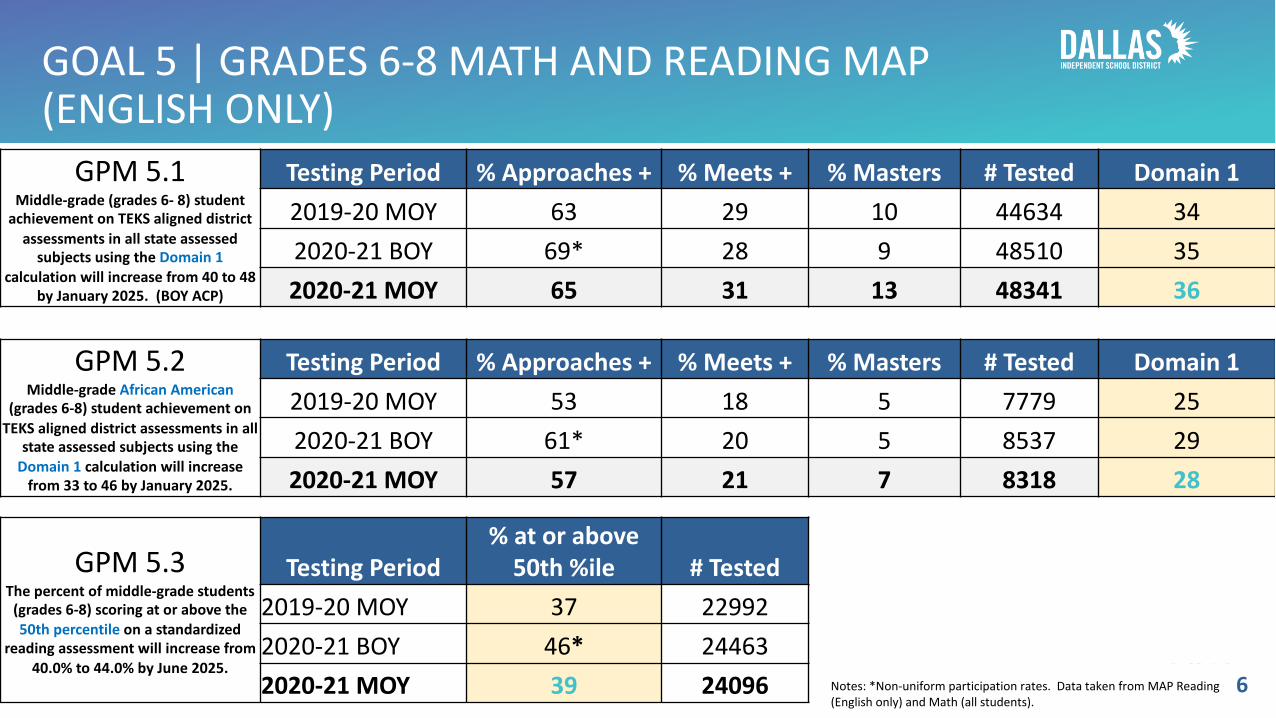
GPM 5.1Middle-grade (grades 6- 8) student
achievement on TEKS aligned district assessments in all state assessed
subjects using the Domain 1 calculation will increase from 40 to 48
by January 2025. (BOY ACP)
Testing Period % Approaches + % Meets + % Masters # Tested Domain 12019-20 MOY 63 29 10 44634 342020-21 BOY 69* 28 9 48510 352020-21 MOY 65 31 13 48341 36
GPM 5.2Middle-grade African American
(grades 6-8) student achievement on TEKS aligned district assessments in all
state assessed subjects using the Domain 1 calculation will increase
from 33 to 46 by January 2025.
Testing Period % Approaches + % Meets + % Masters # Tested Domain 12019-20 MOY 53 18 5 7779 252020-21 BOY 61* 20 5 8537 292020-21 MOY 57 21 7 8318 28
GPM 5.3The percent of middle-grade students
(grades 6-8) scoring at or above the 50th percentile on a standardized
reading assessment will increase from 40.0% to 44.0% by June 2025.
Testing Period% at or above
50th %ile # Tested2019-20 MOY 37 229922020-21 BOY 46* 244632020-21 MOY 39 24096 Notes: *Non-uniform participation rates. Data taken from MAP Reading
(English only) and Math (all students). 6
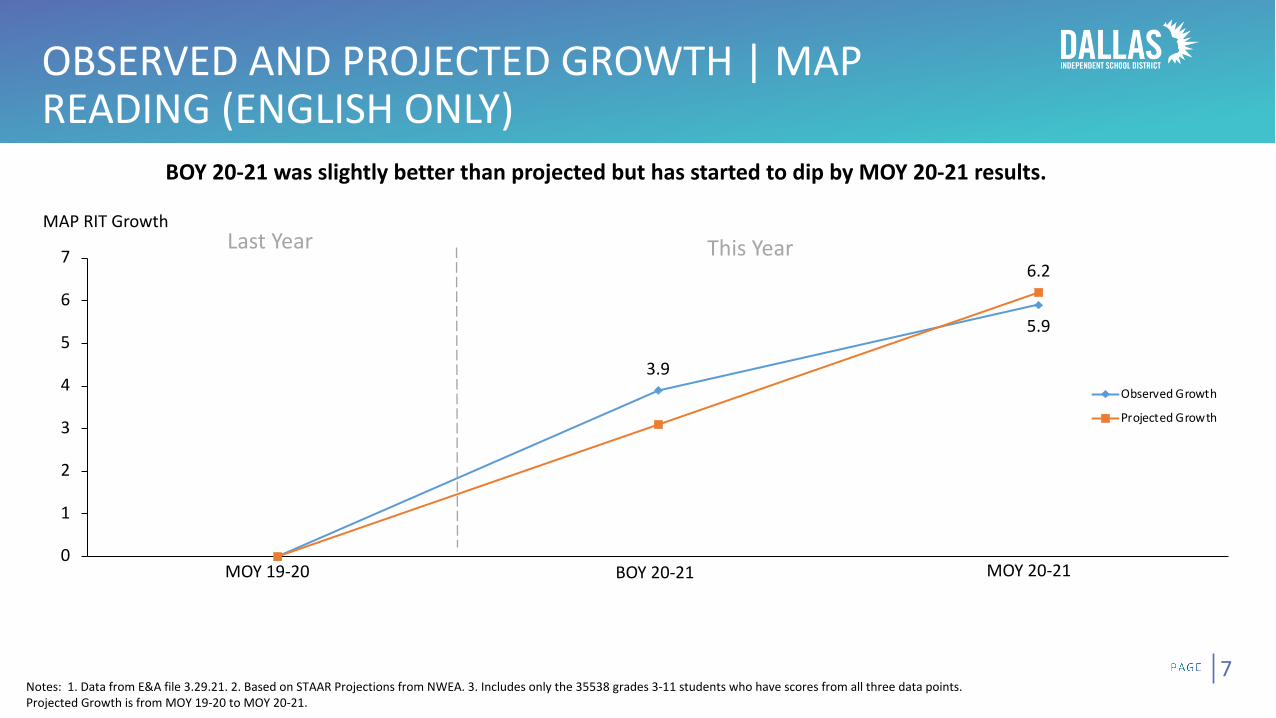
OBSERVED AND PROJECTED GROWTH | MAP READING (ENGLISH ONLY)
7
BOY 20-21 was slightly better than projected but has started to dip by MOY 20-21 results.
3.9
5.9
6.2
0
1
2
3
4
5
6
7
Observed Growth
Projected Growth
BOY 20-21
MAP RIT Growth
MOY 20-21MOY 19-20
Notes: 1. Data from E&A file 3.29.21. 2. Based on STAAR Projections from NWEA. 3. Includes only the 35538 grades 3-11 students who have scores from all three data points. Projected Growth is from MOY 19-20 to MOY 20-21.
Last Year This Year
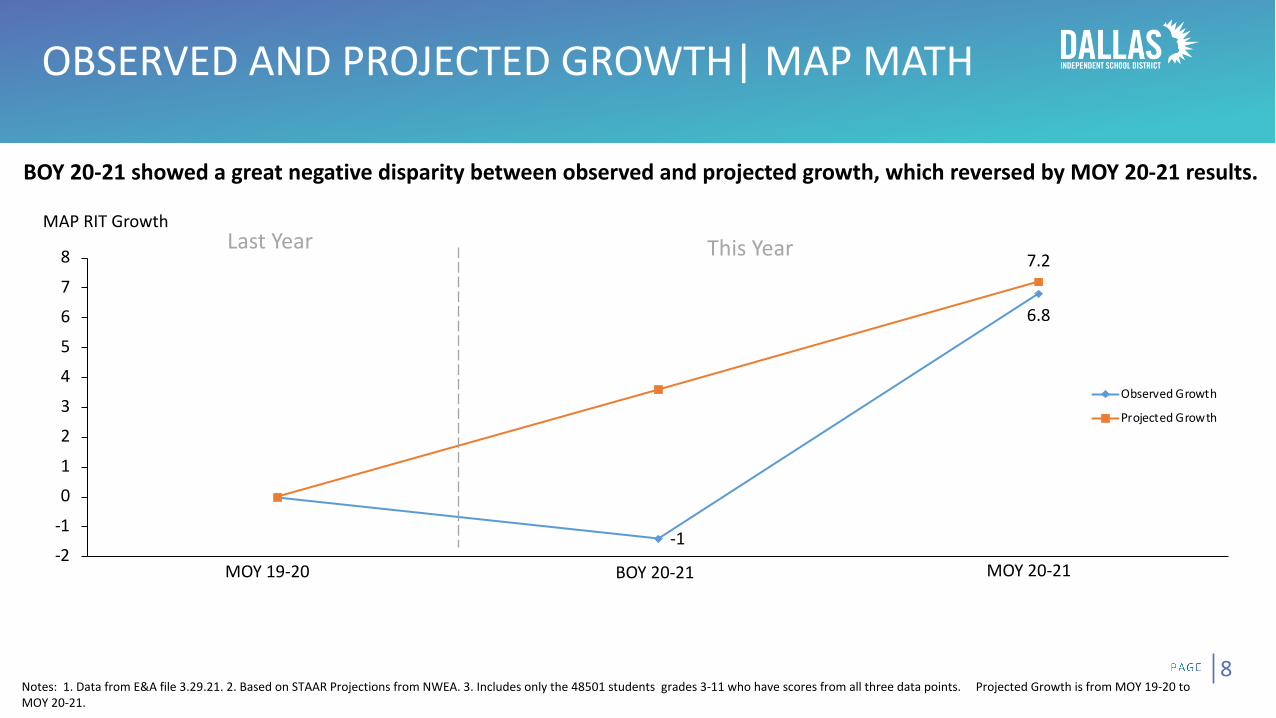
OBSERVED AND PROJECTED GROWTH| MAP MATH
8
BOY 20-21 showed a great negative disparity between observed and projected growth, which reversed by MOY 20-21 results.
-1
6.8
7.2
-2
-1
0
1
2
3
4
5
6
7
8
Observed Growth
Projected Growth
BOY 20-21
MAP RIT Growth
MOY 20-21MOY 19-20
Notes: 1. Data from E&A file 3.29.21. 2. Based on STAAR Projections from NWEA. 3. Includes only the 48501 students grades 3-11 who have scores from all three data points. Projected Growth is from MOY 19-20 to MOY 20-21.
Last Year This Year
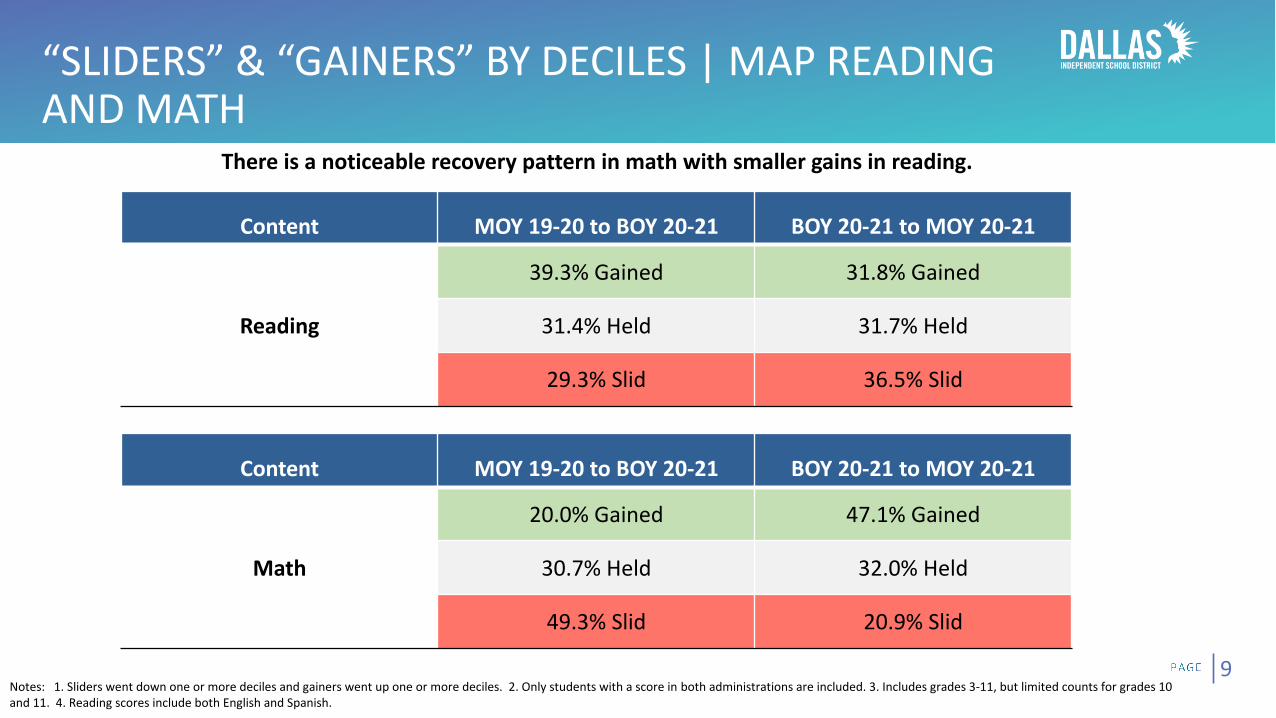
“SLIDERS” & “GAINERS” BY DECILES | MAP READING AND MATH
9
Content MOY 19-20 to BOY 20-21 BOY 20-21 to MOY 20-21
Reading
39.3% Gained 31.8% Gained
31.4% Held 31.7% Held
29.3% Slid 36.5% Slid
Content MOY 19-20 to BOY 20-21 BOY 20-21 to MOY 20-21
Math
20.0% Gained 47.1% Gained
30.7% Held 32.0% Held
49.3% Slid 20.9% Slid
Notes: 1. Sliders went down one or more deciles and gainers went up one or more deciles. 2. Only students with a score in both administrations are included. 3. Includes grades 3-11, but limited counts for grades 10 and 11. 4. Reading scores include both English and Spanish.
There is a noticeable recovery pattern in math with smaller gains in reading.

HOW WE ARE RESPONDING THIS SCHOOL YEAR
10
• Increasing PD offerings on content & digital tools
• Embedding lesson exemplars into digital tools
• Increasing connections between MAP & the curriculum
• Expanding “good first instruction” supports & dress rehearsals
• Hosting MAP data dive sessions
• Improving data reports & “insight” templates
• Targeting supports to AIM middle schools
• Operation Comeback• Reengaging High School
Students• Launching 4th Quarter
interventions
Instructional Supports Leadership Supports
Weekly joint school walks provide campus feedback and inform strategic improvements
Notes: Other mitigating learning loss strategies will begin this summer and in 2021-22.

Questions?

12
APPENDIX
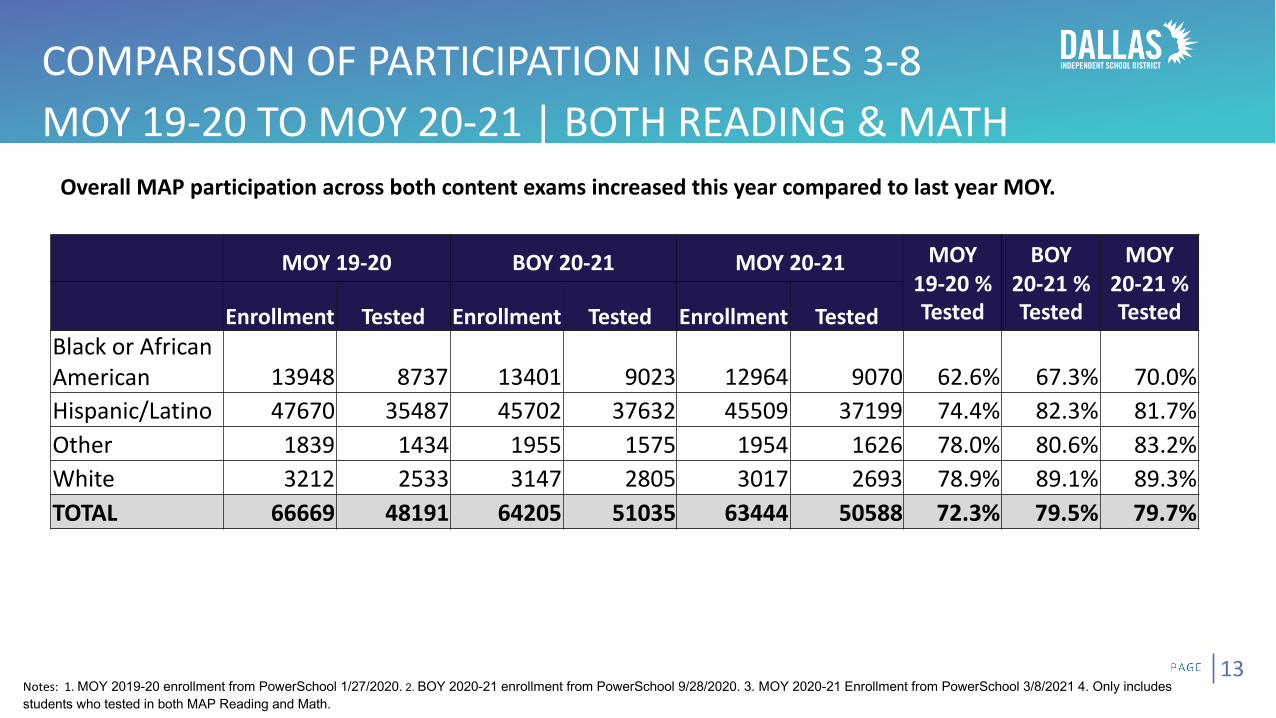
COMPARISON OF PARTICIPATION IN GRADES 3-8MOY 19-20 TO MOY 20-21 | BOTH READING & MATH
13
Overall MAP participation across both content exams increased this year compared to last year MOY.
MOY 19-20 BOY 20-21 MOY 20-21 MOY 19-20 % Tested
BOY 20-21 %Tested
MOY 20-21 %TestedEnrollment Tested Enrollment Tested Enrollment Tested
Black or African American 13948 8737 13401 9023 12964 9070 62.6% 67.3% 70.0%Hispanic/Latino 47670 35487 45702 37632 45509 37199 74.4% 82.3% 81.7%Other 1839 1434 1955 1575 1954 1626 78.0% 80.6% 83.2%White 3212 2533 3147 2805 3017 2693 78.9% 89.1% 89.3%TOTAL 66669 48191 64205 51035 63444 50588 72.3% 79.5% 79.7%
Notes: 1. MOY 2019-20 enrollment from PowerSchool 1/27/2020. 2. BOY 2020-21 enrollment from PowerSchool 9/28/2020. 3. MOY 2020-21 Enrollment from PowerSchool 3/8/2021 4. Only includes students who tested in both MAP Reading and Math.
Notes: 1. Data from E&A file 10.07.20. 2. Based on STAAR Projections from NWEA. 3. 12,864 Students at Meets+ at MOY in 19-20 and 14,687 at Meets+ at BOY in 20-21 and 16,636 at Meets+ at MOY in 20-21.
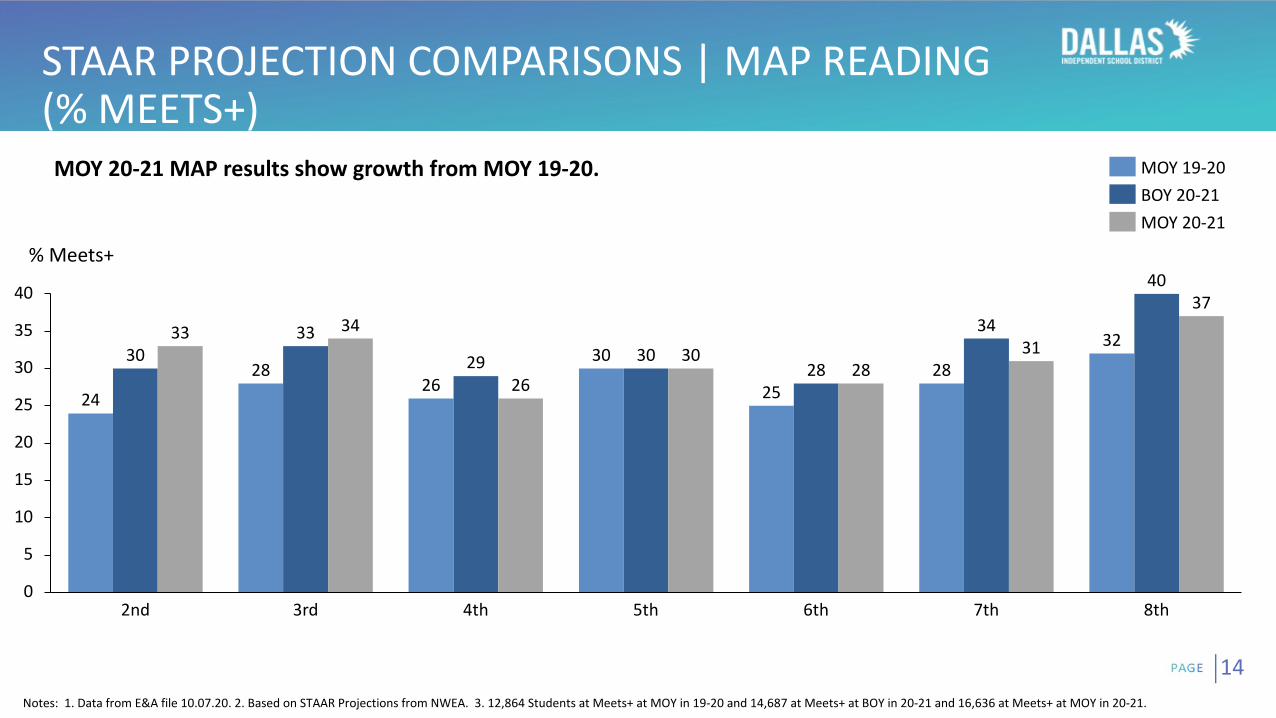
MOY 20-21 MAP results show growth from MOY 19-20.
14
STAAR PROJECTION COMPARISONS | MAP READING (% MEETS+)
14
24
2826
30
2528
3230
33
29 3028
34
40
33 34
26
3028
31
37
0
5
10
15
20
25
30
35
40
2nd 8th6th3rd 4th 5th 7th
MOY 19-20BOY 20-21MOY 20-21
% Meets+
Notes: 1. Data from E&A file 10.07.20. 2. Based on STAAR Projections from NWEA. 3. 16,967 students at Meets+ at MOY in 19-20 and 11,474 at Meets+ at BOY in 20-21 and 14,388 at Meets+ at MOY in 20-21.
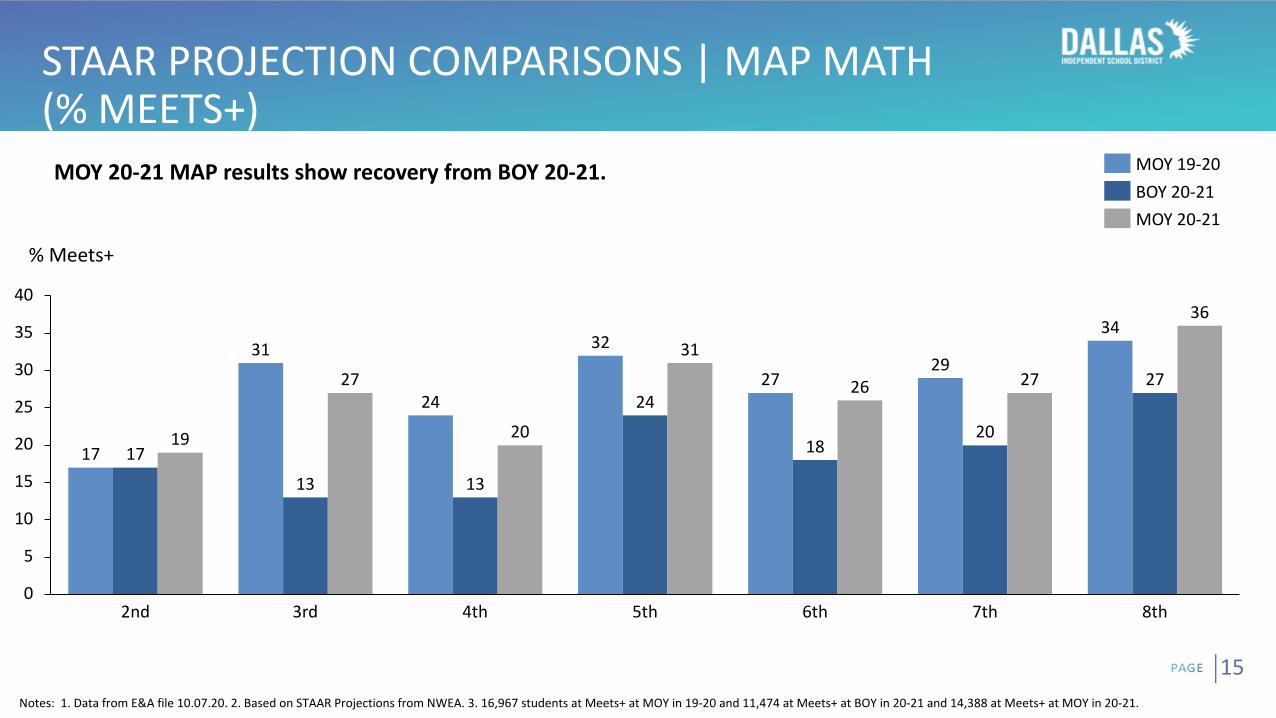
MOY 20-21 MAP results show recovery from BOY 20-21.
15
STAAR PROJECTION COMPARISONS | MAP MATH (% MEETS+)
15
17
31
24
32
2729
34
17
13 13
24
1820
27
19
27
20
31
26 27
36
0
5
10
15
20
25
30
35
40
6th2nd 3rd 4th 8th5th 7th
BOY 20-21MOY 19-20
MOY 20-21
% Meets+
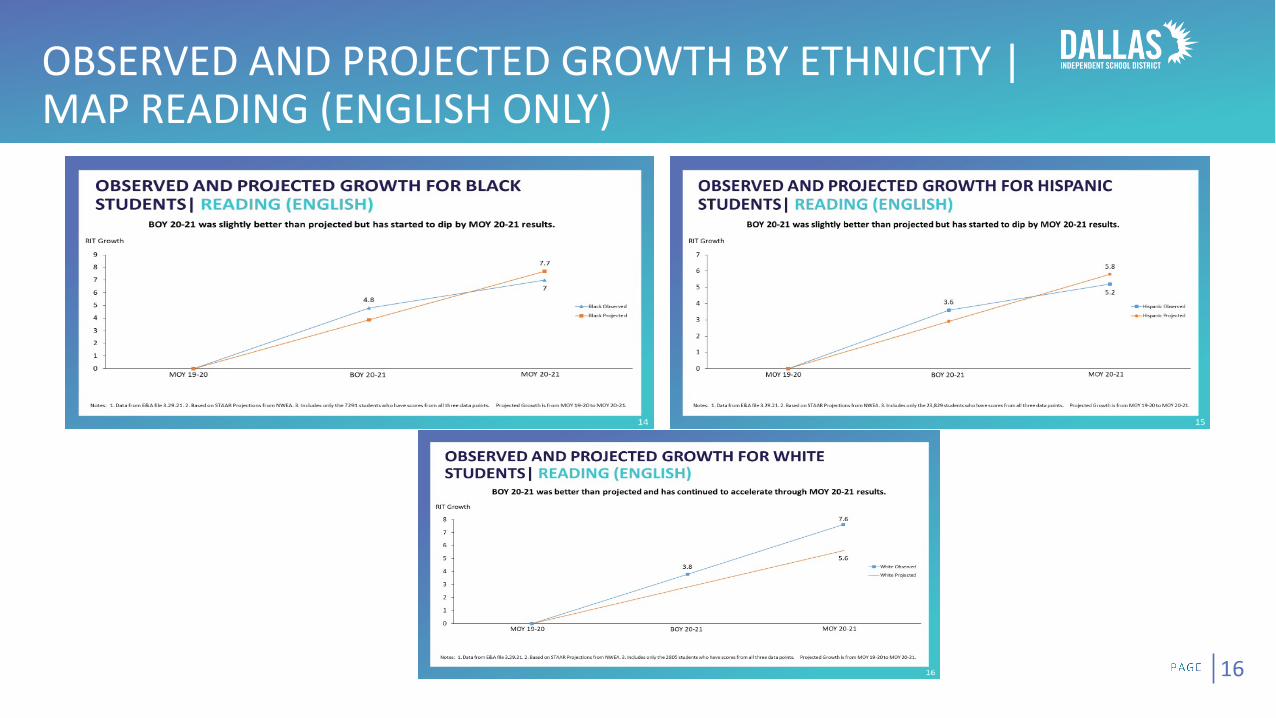
OBSERVED AND PROJECTED GROWTH BY ETHNICITY | MAP READING (ENGLISH ONLY)
16
0123456
Category 1 Category 2 Category 3 Category 4
Chart Title
Series 1 Series 2 Series 3
0123456
Category 1 Category 2 Category 3 Category 4
Chart Title
Series 1 Series 2 Series 3
0
2
4
6
Category 1 Category 2 Category 3 Category 4
Chart Title
Series 1 Series 2 Series 3
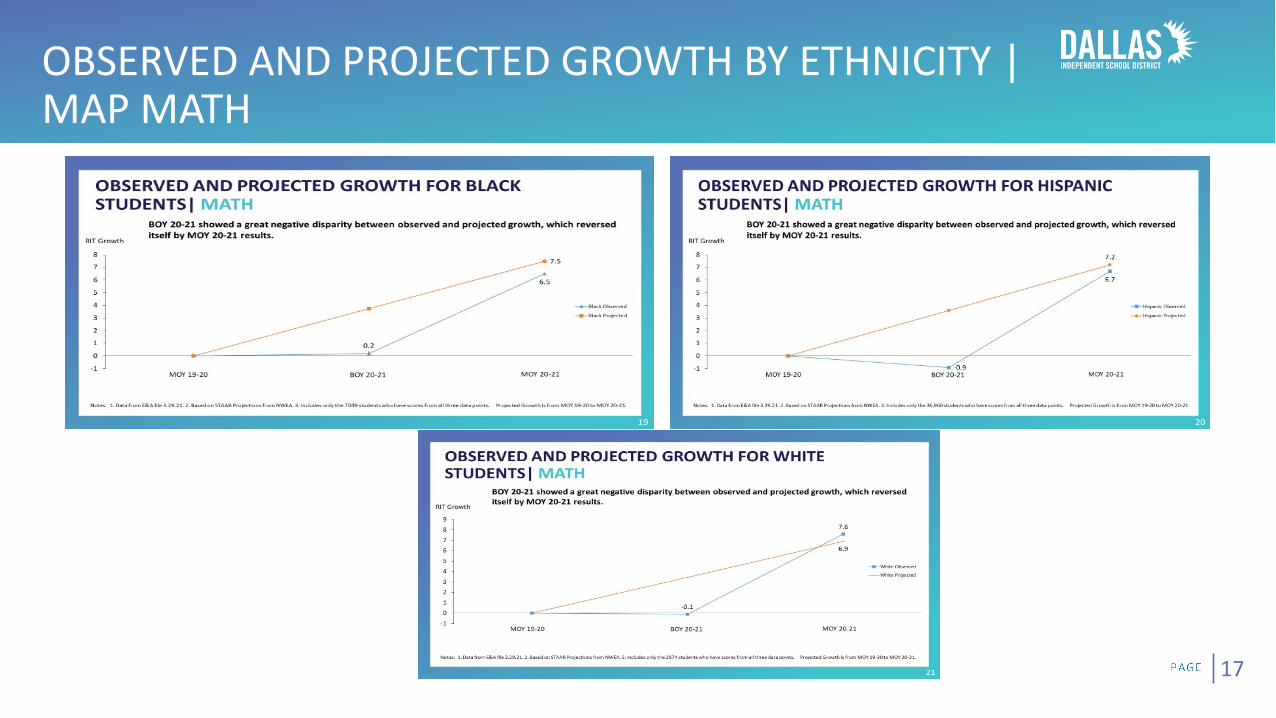
OBSERVED AND PROJECTED GROWTH BY ETHNICITY | MAP MATH
17
0123456
Category 1 Category 2 Category 3 Category 4
Chart Title
Series 1 Series 2 Series 3
0123456
Category 1 Category 2 Category 3 Category 4
Chart Title
Series 1 Series 2 Series 3
0
2
4
6
Category 1 Category 2 Category 3 Category 4
Chart Title
Series 1 Series 2 Series 3
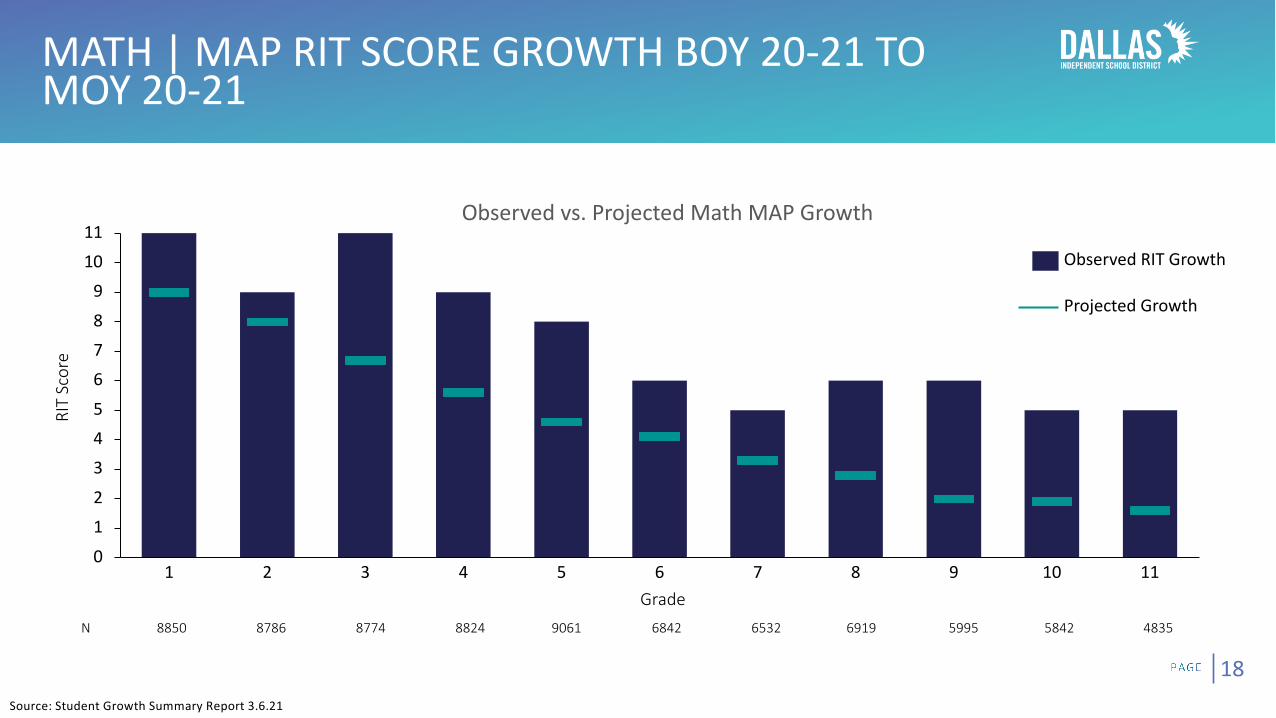
MATH | MAP RIT SCORE GROWTH BOY 20-21 TO MOY 20-21
18
0
12
345
678
91011
1 2 5 93 4 876 10 11
Observed RIT Growth
Projected Growth
N 8850 8786 8774 8824 9061 6842 6532 6919 5995 5842 4835
Grade
RIT
Scor
e
Observed vs. Projected Math MAP Growth
Source: Student Growth Summary Report 3.6.21
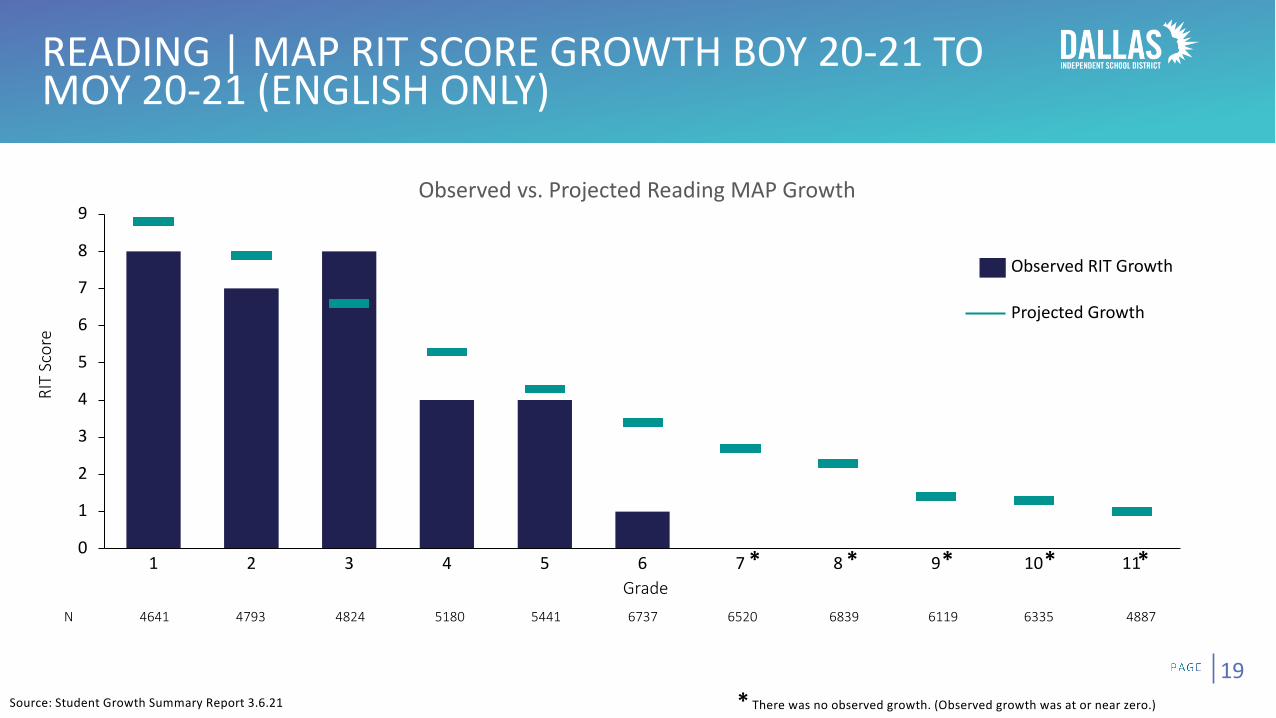
READING | MAP RIT SCORE GROWTH BOY 20-21 TO MOY 20-21 (ENGLISH ONLY)
19
N 4641 4793 4824 5180 5441 6737 6520 6839 6119 6335 4887
Source: Student Growth Summary Report 3.6.21
0
1
2
3
4
5
6
7
8
9
32 111 4 85 6 7 9 10
Observed RIT Growth
Projected Growth
Grade
RIT
Scor
e
Observed vs. Projected Reading MAP Growth
* * * * *
* There was no observed growth. (Observed growth was at or near zero.)

“ SLIDERS” & “GAINERS”| MAP READING
<10 10-19 20-29 30-39 40-49 50-59 60-69 70-79 80-89 90-99 Total
<10 5183 1061 474 312 157 90 44 43 34 30 7428
10-19 1812 1191 788 535 313 157 91 60 26 30 5003
20-29 1134 1141 1080 938 590 391 227 112 52 31 5696
30-39 737 811 1000 1153 1008 643 428 210 54 23 6067
40-49 456 508 799 1127 1250 1089 845 472 158 44 6748
50-59 259 277 443 824 1100 1294 1253 887 343 54 6734
60-69 106 157 262 471 872 1324 1685 1584 850 139 7450
70-79 49 77 104 197 410 761 1361 1946 1610 303 6818
80-89 26 13 28 75 131 276 651 1461 2607 1128 6396
90-99 22 15 18 17 22 32 79 245 951 2239 3640
Total 9784 5251 4996 5649 5853 6057 6664 7020 6685 4021 61980
BOY
20-2
1 De
cile
31.8% Gained
31.7% Held
36.5% Slid
MOY 20-21 Decile
Notes: 1. Sliders gained decile(s) and gainers went down decile(s). 2. Only students with a score in both MAP administrations are included. 3. Includes grades 3-11, but limited counts for grades 10 and 11.
20
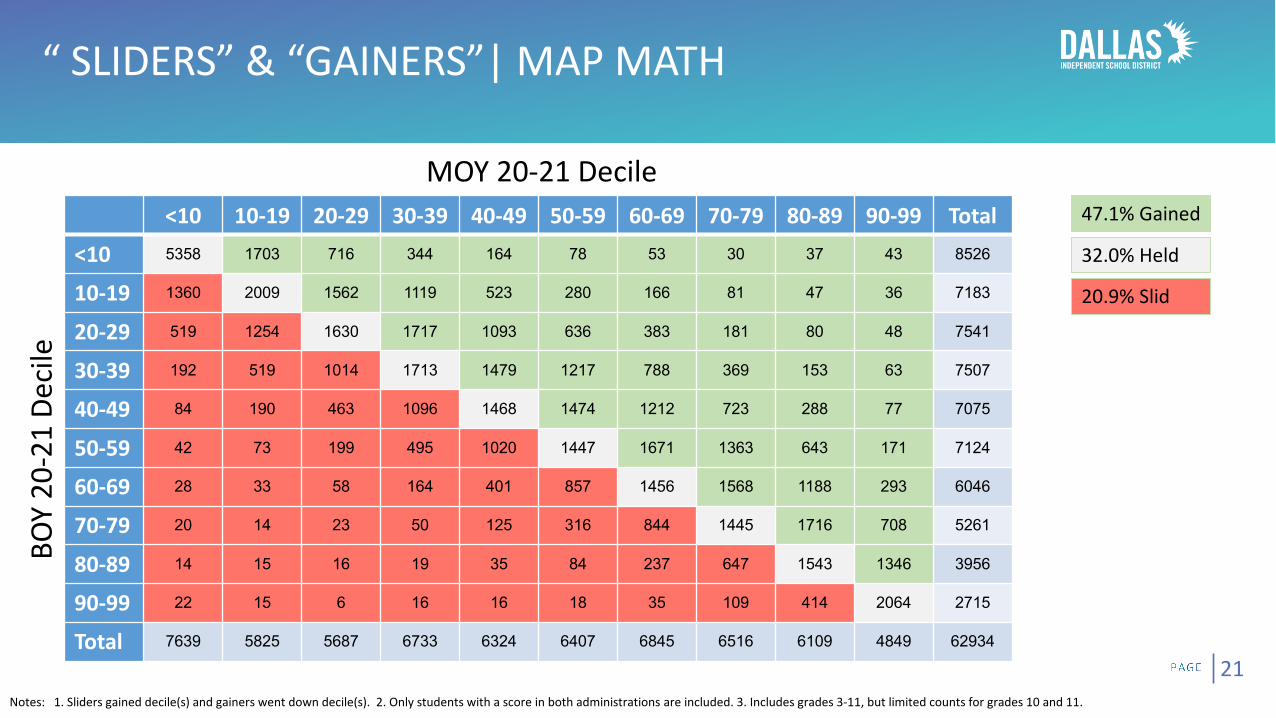
“ SLIDERS” & “GAINERS”| MAP MATH
21
<10 10-19 20-29 30-39 40-49 50-59 60-69 70-79 80-89 90-99 Total
<10 5358 1703 716 344 164 78 53 30 37 43 8526
10-19 1360 2009 1562 1119 523 280 166 81 47 36 7183
20-29 519 1254 1630 1717 1093 636 383 181 80 48 7541
30-39 192 519 1014 1713 1479 1217 788 369 153 63 7507
40-49 84 190 463 1096 1468 1474 1212 723 288 77 7075
50-59 42 73 199 495 1020 1447 1671 1363 643 171 7124
60-69 28 33 58 164 401 857 1456 1568 1188 293 6046
70-79 20 14 23 50 125 316 844 1445 1716 708 5261
80-89 14 15 16 19 35 84 237 647 1543 1346 3956
90-99 22 15 6 16 16 18 35 109 414 2064 2715
Total 7639 5825 5687 6733 6324 6407 6845 6516 6109 4849 62934
47.1% Gained
32.0% Held
20.9% Slid
MOY 20-21 Decile
BOY
20-2
1 De
cile
Notes: 1. Sliders gained decile(s) and gainers went down decile(s). 2. Only students with a score in both administrations are included. 3. Includes grades 3-11, but limited counts for grades 10 and 11.

“ SLIDERS” & “GAINERS”| MAP ENGLISH READING 3-5
22
<10 10-19 20-29 30-39 40-49 50-59 60-69 70-79 80-89 90-99 Total
<10 1423 325 148 90 50 26 19 16 12 18 2127
10-19 396 318 218 152 90 39 26 19 10 8 1276
20-29 204 293 273 250 184 113 69 22 16 8 1432
30-39 102 155 207 238 204 138 83 60 9 6 1202
40-49 62 105 174 246 246 223 151 81 29 14 1331
50-59 51 64 82 234 243 312 287 201 74 15 1563
60-69 28 33 66 98 148 269 322 280 153 38 1435
70-79 11 20 26 39 88 173 312 404 363 83 1519
80-89 13 3 10 20 30 57 125 267 520 243 1288
90-99 11 9 8 8 8 10 19 60 230 592 955
Total 2301 1325 1212 1375 1291 1360 1413 1410 1416 1025 14128
MOY 20-21 Decile33.0% Gained
32.9% Held
34.1% Slid
Notes: 1. Sliders gained decile(s) and gainers went down decile(s). 2. Only students with a score in both administrations are included. 3. Includes grades 3-11, but limited counts for grades 10 and 11.
BOY
20-2
1 De
cile
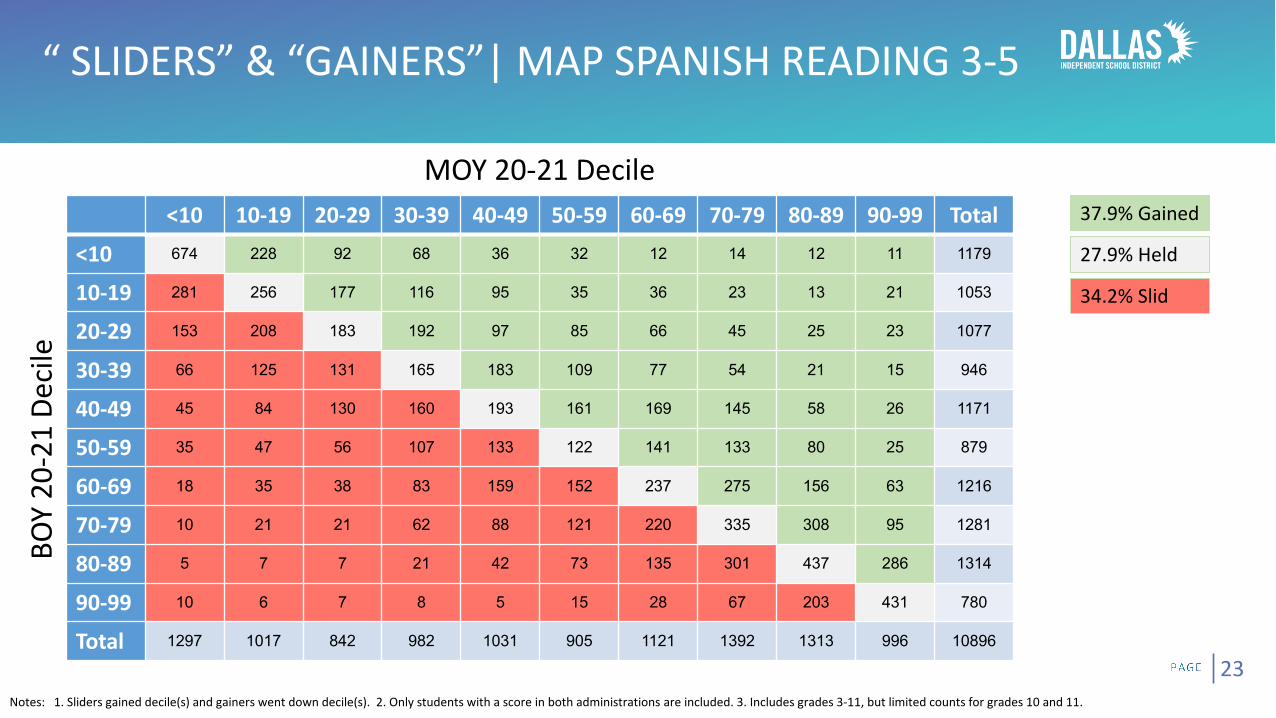
“ SLIDERS” & “GAINERS”| MAP SPANISH READING 3-5
<10 10-19 20-29 30-39 40-49 50-59 60-69 70-79 80-89 90-99 Total
<10 674 228 92 68 36 32 12 14 12 11 1179
10-19 281 256 177 116 95 35 36 23 13 21 1053
20-29 153 208 183 192 97 85 66 45 25 23 1077
30-39 66 125 131 165 183 109 77 54 21 15 946
40-49 45 84 130 160 193 161 169 145 58 26 1171
50-59 35 47 56 107 133 122 141 133 80 25 879
60-69 18 35 38 83 159 152 237 275 156 63 1216
70-79 10 21 21 62 88 121 220 335 308 95 1281
80-89 5 7 7 21 42 73 135 301 437 286 1314
90-99 10 6 7 8 5 15 28 67 203 431 780
Total 1297 1017 842 982 1031 905 1121 1392 1313 996 10896
37.9% Gained
27.9% Held
34.2% Slid
MOY 20-21 Decile
Notes: 1. Sliders gained decile(s) and gainers went down decile(s). 2. Only students with a score in both administrations are included. 3. Includes grades 3-11, but limited counts for grades 10 and 11.
BOY
20-2
1 De
cile
23