Embed Size (px)
Citation preview

1
VISION
A participatory municipality that turns
prevailing challenges into opportunities for
growth and development through optimal
utilization of available resources
MISSION
To ensure delivery of quality services
through community participation and
creation of an enabling environment for
economic growth and job creation

2
TABLE OF CONTENTS
CONTENTS PAGE NO
COVER PAGE
01
TABLE OF CONTENT
02-03
LIST OF ACCRONYMS AND ABBREVIATIONS
04-05
FOREWORD BY THE MAYOR
06-07
EXECUTIVE SUMMARY
08-10
CHAPTER 1: THE PLANNING PROCESS
11
1.1. INTRODUCTION
11-12
1.2. POLICY AND LEGISLATIVE FRAMEWORK
12-16
1.3. NATIONAL AND PROVINCIAL ALIGNMENT
16-21
1.4. MUNICIPAL POWERS AND FUNCTIONS
22
1.5. MUNICIPAL PRIORITIES
22-23
1.6. GOVERNMENT STRATEGIC PRIORITIES
23-24
1.7. THE 2019/2020 IDP/BUDGET PROCESS PLAN AND THE 2019/2020 MEC IDP ASSESSMENT REPORT
24-27
CHAPTER 2: SITUATIONAL ANALYSIS
28
2.1. INTRODUCTION
28-29
2.2. DISCRIPTION OF THE MUNICIPAL AREA
29-30
2.3. REGIONAL CONTEXT
30-31
2.4. POPULATION TRENDS
32-39
2.5. EMPLOYEMENT PROFILE
39-40
2.6. AGRICULTURAL DEVELOPMENT
41-48
2.7. POVERTY LEVELS
48-49
2.8. EDUCATIONAL LEVELS
49-50
2.9. PEOPLE WITH DISABILITIES
50
CHAPTER 3: ANALYSIS PHASE
51
3.1. INTRODUCTION
51
3.2. SPATIAL ANALYSIS
51-63
3.3. ENVIRONMENTAL ANALYSIS
63-67
3.4. SOCIAL ANALYSIS
68-71
3.5. HOUSING ANALYSIS 71-72

3
3.6. EDUCATIONAL ANALYSIS
72-75
3.7. SAFETY AND SECURITY ANALYSIS
75-77
3.8. PUBLIC AMENITIES ANALYSIS
77-78
3.9. BASIC SERVICE DELIVERY AND INFRASTRUCTURE ANALYSIS
78-93
3.10. FINANCIAL VIABILITY AND MANAGEMENT
93-96
3.11. GOOD GOVERNANCE AND PUBLIC PARTICIPATION
96-110
CHAPTER 4: STRATEGIES PHASE
111
4.1. INTRODUCTION
111
4.2. VISION
111
4.3. MISSION
111
4.4. MOTTO
111
4.5. BROAD OBJECTIVES
111
4.6. MUNICIPAL OBJECTIVES AND STRATEGIES
111-120
CHAPTER 5: PROJECT PHASE
121
5.1. KPA 01.BASIC SERVICES DELIUVERY 121-127
5.2. KPA.02. LOCAL ECONOMIC DEVELOPMENT 128-129
5.3. KPA.03. SPATIAL RATIONALE
130-131
5.4. KPA.04. GOOD GOVERNANCE AND PUBLIC PARTICIPATION
132-134
5.5. KPA.05. MUNICIPAL TRANSFORMATION AND ORGANIZATIONAL DEVELOPMENT
135-142
5.6. KPA.06. FINANCIAL VIABILITY AND MANAGEMENT
142-145
5.7. CAPRICORN DISTRICT MUNICIPALITY PROJECTS
146-190
5.8. VENETIA MINE PROJECTS
191-192
5.9. HOUSING PROJECTS
192-193
5.10. ROAD AGENCY LIMPOPO AND TRANSPORT DEPARTMENT PROJECTS 193
5.11. SUMMARY BUDGET 2020/2021 194-241
CHAPTER 6: INTEGRATION PHASE
242-248
CHAPTER 7: APPROVAL PHASE
248
STAKEHOLDERS’S REPORT
249-256

4
ABBREVIATIONS INTERPRETATION
AFS
Annual Financial Statements
ARV Anti-Retroviral
ASGISA Accelerated and Shared Growth Initiative
BLM Blouberg Local Municipality
BRICS Brazil, Russia, China and South Africa
CBOs Community Based Organizations
CDM Capricorn District Municipality
CoGTA Department of Cooperative Governance and Traditional Affairs
CWP Community Works Program me
DFA Development Facilitation Act
DLGH Department of Local Government & Housing
DoE Department of Energy
DoHS Department of Human Settlement
ECD Early Childhood Development
EPWP Expanded Public Works Program me
FBE Free Basic Electricity
FBW Free Basic Water
IDP Integrated Development Plan
LDOs Land Development Objectives
LED Local Economic Development
LDP Limpopo Development Plan
LUMS Land Use Management Scheme
mSCOA Municipal Standard Chart of Accounts
MEC Member of Executive Council
MFMA Municipal Finance Management Act
MPCC Multi-Purpose Community Centre
MTAS Municipal Turn Around Strategy
NGOs Non-Governmental Organizations
NEMA National Environmental Management Act,107 of 1998
NSDP National Spatial Development Perspective
PIA Project Implementing Agent
POA Per Owner’s Approval
RRR Re-use, Reduce and Recycle
SDF Spatial Development Framework
SETAs Sector Education and Training Authority

5
SMMEs Small, Micro and Medium Enterprises
OTP Office of the Premier
COGHSTA
Cooperative Governance Human Settlements and Traditional Affairs
SASSA South African Social Security Agency
DECOG Department of Cooperative Governance
BNG Breaking New Ground
DORA Division of Revenue Act
NDP National Development Plan
FET Further Education and Training
CDM Capricorn District Municipality
SPLUMA Spatial Planning and Land Use Management Act
WWTW WASTE WATER TREATMENT WORKS
OPEX OPERATIONAL EXPENDITURE
WSP WORKPLACE SKILLS PLAN
PMS PERFORMANCE MANAGEMENT SYSTEM

6
FOREWORD BY THE HONORABLE MAYOR OF BLOUBERG MUNICIPALITY
The 2019/20 IDP review marks the significance of the development of local government which reflects the key
strategic objectives that needed to be implemented within the five year cycle of the IDP. This process also assists
the municipality to assess and evaluate its performance based on the milestones that are depicted in the IDP as a
roadmap towards the realization of those key strategic objectives. The constitution of the Republic of South Africa
mandates all local spheres of government to ensure the provision of services to communities in a sustainable
manner, promote social and economic development, and promote a safe and healthy environment and to
encourage the involvement of communities and community organizations in the matters of local government. As a
municipality we are committed to abide by this constitutional mandate guided by the resources at our disposal and
this mandate further hinges with the vision and mission of the municipality.
Having said that the country and the whole universe is perturbed and devastated by coronavirus or covid19. The
pandemic disrupted the functioning of the universe in terms of discharging the administrative and political
responsibilities in the world states wherein many countries including South Africa had to resort to a lockdown for a
period of 21 days and extended it to two weeks ending in April 2020 to combat this deadly virus. The country of
which our Blouberg Local Municipality is not immune to this arrangements had to come up with measures to deliver
services to the communities at a lower rate due to skeletal staff. Only essential services such as waste collection
and traffic were permitted to be rendered. We hope and believe that we shall overcome this pandemic through the
world‘s concerted efforts to curb the rapid spread of the virus. We therefore review the IDP/Budget under strenuous
circumstances.
One of key priorities of the municipality is local economic development, job creation and partnerships. Based on
this priority the municipality hosted the first local economic development summit purported to bring key
stakeholders together and guide the municipality on how to attract investors and grow the local economy. We
therefore need to change focus on how to retain jobs and support small businesses and the informal sector.
The summit also came as a consequence of the development of the Blouberg Growth and Development Strategy
vision 2040 which seeks to attract more investments and therefore the IDP must be guided by the programs
outlined in the growth strategy. During the state of the nation address the President Cyril Matamela Ramaphosa

7
said that without growth there would be no jobs and without jobs there would be no meaningful improvement in the
lives of our people. The hosting of the summit was about inclusive growth where various stakeholders sat under
one roof to address local economic development deficiencies and come up with possible solution towards that.
The President further recommitted the country to economic growth, job creation, clean government and
infrastructure development.
As Blouberg municipality, we are committed to embrace the spirit of back to basics, good governance and the
provision of sustainable and cost effective services to the communities. We further commit to the principle of
participatory democracy in which our communities contribute to the development of the municipality as mandated
by the constitution.
The Council has however noted issues raised by the communities during the 2019/2020 IDP/Budget public
consultation meetings Based on the inputs brought forward during those public consultation process the
municipality would strive to work with communities to find possible solutions towards those matters raised. Our
strength as the municipality lies in the constant interaction with communities and the covenant we have in building
a safe and peaceful society. Therefore, Blouberg municipality has compiled the 2020/2021 draft IDP/Budget in line
with chapter 4 of Municipal Systems Act no 32 of 2000. The Act makes it an obligation for the communities to
participate in the affairs, programs and decision making of their municipality. Through the IDP and budget the
Council had to express itself towards the interests and aspirations of the communities they serve. Therefore, the
IDP is a product of intense deliberations from all societal groups in the Blouberg area.
For the year under view, the municipality had challenges with regard to the protest marches on service delivery
issues such as the conditions of the roads and illegal land invasions. In the main, the roads referred to are provincial
and district roads. The focus for the 2020/2021 financial year would be the purchase of plant and machinery to
improve road maintenance. The installation of culverts in some of our roads becomes critical and therefore
resources have to be channeled into those critical areas.
On the spatial planning part, we reiterate our commitment to dispose of the available prime land in Senwabarwana
and Alldays towns as there is a potential of being invaded by the public the focus would be the finalization of the
township establishments. We anticipate to collect revenue from the sale of sites to augment service delivery
initiatives and have revenue base. It is important to mention that the municipality leased erf 300 of Bochum
extension 3 (old Senwabarwana show grounds) to Rheiland Investment Developers for the construction of a
shopping mall to reduce congestions during month end and festive seasons.
Unemployment and poverty remain the major challenge in the municipality as indicated in the status quo analysis
of the Blouberg Growth and Development Strategy and the current SDF (2019). The scourge mostly affects the
young people and women due to the slower pace at which our economy is growing. We need to unlock the
economic potential to enhance the economic growth and development that would create jobs and alleviate poverty.
Blouberg municipality was at some stage given an opportunity to participate in the Musina/Makhado SEZ and
therefore we need to reposition ourselves to fully participate in this huge economic initiative. The review of the IDP
should be also in line with the SEZ programs. The SEZ would of course create more job opportunities for the
unemployed people with relevant skills. As the municipality we need to find a way of benefiting in the SEZ programs.
The draft IDP document holds the aspirations of a better life for the citizens of the municipality. We have reviewed
the document taking into account the community needs, current realities, issues raised in the 2019/2020 IDP public
consultations and guided by the municipal strategic documents.
HONORABLE MAYOR CLR MASEKA SOLOMON PHEEDI

8
OVERVIEW AND EXECUTIVE SUMMARY
INTRODUCTION
In respect of the Municipal Systems Act 32 of 2000 as amended requires local spheres of government to develop
the Integrated Development Plan which with a lifespan of five years. The plan has to be reviewed annually to
conform to the current trends of socio-economic conditions of the communities. As a constitutional mandate the
Blouberg Local Municipality is obliged to encourage communities to participate in the affairs of the local
government. With that effect communities and key stakeholders have to fully participate in the review and
development of the IDP so that their needs can find expression in the planning process of the municipality.
The outbreak of coronavirus impacted hugely on the service delivery and other municipal processes like the review
of the IDP. Most of the services have been disrupted due to covid19 and therefore municipal clients could not pay
for their services resulting in decreased income generation by the municipality. When we received the audit opinion
for the 2019/20 financial year, the Auditor General raised matters that the management had to rectify. The action
plan has been developed to deal with matters raised by the AG. Our plan is to navigate the municipality into a
sound financial management that would pave for a clean audit.
The Minister of CoGTA issued a gazette to the effect that the review of the municipal budgets should be reflective
of the support to minimize the spread of virus to the members of the public. It means we have an obligation to
channel more funds towards the disaster management.
MUNICIPAL FINANCE MANAGEMENT ACT CIURCULAR NO 99 EXEMPTION NOTICE
The minister of Finance had issued a conditional exemption notice in terms of section177 (1)(b) of MFMA
2003(ACT No 56 of 2003) in March 2020 to facilitate and enable the performance of the legislative responsibilities
of the municipalities during the national state of the disaster. The notice exempt the municipalities and municipal
entities from timelines provisions in the MFMA until such time that the minister of CoGTA lifts the national state of
the disaster declaration.
The exemption is conditional in that any activity that was required to be taken in terms of the MFMA must be
undertaken within 30 days after the state of the national disaster lapses is lifted. Therefore, the municipality is

9
tabling the draft IDP/Budget 2020/2021 affected by the exemption notice. The submissions to the relevant
authorities is done later than required.
KPA 1: SPATIAL RATIONALE
The objective is to promote orderly development and sustainable livelihood by implementing sound spatial
principles and land use management. Furthermore, to achieve optimum organization and use of land
resources in order to meet the social, environmental and economic needs of the present and future
generations. We have since reviewed the SDF and the following spatial vision was adopted to drive the
municipality’s spatial development imperative:
Vision: “Spatial transformation for inclusive sustainable development”. This vision covers the following
elements, which also bear consistency with the IDP vision:
1. Sustainable development (development must be undertaken in cognizance of all the elements of
sustainability),
2. Inclusive/ inclusivity (spatial development must be undertaken in partnership with local communities
and key stakeholders and partners), and
3. Transformation of the current fragmented spatial arrangements (requires a radical shift from the
planning interventions which maintains the status quo).
The land use scheme shall be budgeted for in the 2020/2021 financial year for the municipality to
implement wall-to-wall land use management scheme.
The financial year shall also see the Council embarking on the finalization of the Township registration
project for security of tenure and Township Establishment in Senwabarwana and Alldays for creation of
sustainable and livable environment
An application for the transfer of all the government land parcels in the municipality where there is a
potential for both residential and business development shall be finalized and forwarded to the department
of Rural Development Land Reform together with Department of Public Works.
KPA 2: BASIC SERVICES DELIVERY
To provide basic services in an efficient, affordable and sustainable manner.
To ensure access to housing provision
To ensure the provision of water at an RDP standard.
To ensure access to sanitation services
To ensure access to health services
To ensure access to educational facilities
To ensure environmental protection and conservation
To ensure the safety and security of the citizens.
KPA 3: LOCAL ECONOMIC DEVELOPMENT
In terms of the constitution of the Republic of South Africa Act 108 of 1996 one of the objectives of the
local government is to promote social and economic development. The Blouberg Municipality is not
immune to this constitutional mandate and therefore the municipality must ensure there are economic
spinoffs to uplift the standard of living of the residents. As an approach towards economic development
which allows and encourages the communities to work together to achieve sustainable economic growth
and development it therefore brings economic benefits and improves quality of life for all residents in a
municipal area. The Municipality developed the Blouberg Growth and Development which seeks to attract
investors to grow the economy that could create more job opportunities and alleviate poverty in all forms.

10
The municipality forged partnerships with various stakeholders such as Venetia mine United Nations
Women through the Accelerated Women Micro Enterprises to capacitate women who are in business.
The program capacitated 257 women entrepreneurs since its inception from 2018/19 financial year.
Notwithstanding that there are a number of programs that the municipality embarks on to support SMME’s.
KPA 4: FINANCIAL VIABILITY AND MANAGEMENT
The financial viability and management is a critical key area whereby the local spheres of government
needs to focus its attention to. The financial viability and management is the backbone of each
municipality in terms of determining the sustainability of the local government. The municipality must strive
for transparency, accountability, sound financial management and be able to sustain itself as per the
MFMA Act 56 of 2003. The Blouberg local municipality is predominantly rural in nature and it is difficult to
generate adequate revenue as the culture of non-payment becomes the order of the day. To this end the
municipality had to develop the financial recovery plan to improve on debts collection. The municipality
has thus far established the revenue management committee to help the institution in coming up with
mechanisms on how to recover debts and further helps to improve revenue collection.
KPA 5: GOOD GEVERNANCE AND PUBLIC PARTICIPATION
To sustain public participation and promote good governance.
To improve the audit outcomes in the municipality.
The municipality has not performed well in terms of the audit reports (QUALIFIED).
On the front, we continue to perform well as indicated in the recently convened Limpopo Municipal Awards
in Mopani.
We shall also strive to improve our audit performance by addressing the issues on the action plan.
There was only one matter of emphasis raised in the audit report.
KPA 6: MUNICIPAL TRANSFORMATION AND ORGANISATIONAL DEVELOPMENT
To ensure the institutional structures are functional and properly supported to respond to the transformational
objectives. The municipality has a challenge on information and communication technology and it has to be
improved to facilitate municipal services effectively and efficiently. The municipality has enumerated some of
the key programs to be implemented in the 2020/21 financial year and programs are as follows:
1. Implementation of the Blouberg Growth AND Development Strategy ( VISION 2040)
2. Implementation of the Spatial Development Framework
3. Internal streets and Storm water upgrading
4. Upgrading of the sports facilities
5. Upgrading of the land fill sites
6. Extension of the traffic services
7. Electricity supply to extensions and new developed areas
8. Construction of the electricity substation.
9. ITC reconfiguration.
It is therefore imperative for the municipality to align the budget with the national, provincial and the district
objectives.
MACHABA JUNIAS
MUNICIPAL MANAGER

11
CHAPTER 1: THE PLANNING PROCESS
1.1 INTRODUCTION
The notion of Integrated Development Planning was introduced in the Local Government Transition Act, 1996,
through the requirement for municipalities to develop Integrated Development Plans (IDPs). The content and
purpose of IDPs were then further described in the White Paper on Local Government and formally introduced
through the Municipal Systems Act, No 32 of 2000 (Act 32 of 2000). The Act requires that municipalities develop
and review their IDP on an annual basis in order to assess their performance and reflect on changes in the
communities.
The IDP, in short, is a comprehensive, integrated and multi-faceted plan that:
• Links, integrates and co-ordinates the functions and strategies of a municipality;
• Aligns the resources of a municipality with the agreed-upon objectives and outcomes.
• Forms the overall strategic plan for the municipality; and
• Serves as a mechanism for participation and democratization of local government
The driving force behind the development of an IDP is summarized by the following five main reasons:
Firstly, the IDP is part of a suite of strategic planning instruments that guide development and service delivery in
the municipality. The IDP sets out the strategic plan for the medium term that coincides with the electoral term of
2016 to 2021. Each department within the Municipality is required to complete a detailed annual business plan that
gives operational expression to the IDP.
Secondly, Act 32 of 2000 prescribes the formulation and approval of the IDP by the full Municipal Council, meaning
that the IDP may not be delegated. This is important because the legislation lends the weight of the law on the IDP
and the approved IDP itself has the force of law
Thirdly, the IDP is the key mechanism for vertical and horizontal alignment. It strives to achieve vertical integration
between the municipality and other spheres of government; and works towards horizontal integration between
adjacent municipalities;
Fourthly, the IDP weaves together the discrete activities within the municipality by providing a strategic overview,
detailing the processes of intergovernmental alignment, showing the outreach and consultation process, setting
out a summary of the Spatial Development Framework and Capital Investment Framework and framing the
Performance Management System. The essence of the IDP is the Sector Plans, which defines the delivery agenda.
The Financial Plan component of the IDP shows the linkages between the IDP and the budget as a whole.
Lastly, once the IDP is approved by the Council it becomes a public document governed by Promotion of Access
to Information Act, 2 of 2000 (PAIA Act 2 of 2000) which gives effect to the constitutional right of access to any
information held by the state and any information that is held by another person and which is required for the
exercise or protection of any right; and to provide for matter connected therewith. It is for this reason that the IDP
must be made available to all municipal stakeholders.
The Municipality has developed a set of long-term goals and five-year objectives that will form the basis of the
annual business planning and budgeting carried out by the municipality on an ongoing basis and should therefore
be understood as an interpretation of strategy and political priorities that is to become the actual outcomes for
residents.

12
IDP is a management tool for assisting municipalities in achieving their developmental mandates. The five-year
IDP will also be further moulded by inputs from communities and civil society, as well as direction from the political
leadership.
1.2 POLICY AND LEGISLATIVE FRAMEWORK
Every municipality is required by law to develop and adopt its IDP through the legal framework provided. The
following pieces of legislations outline the development and implementation of the IDP:
1.2.1 CONSTITUTION OF THE REPUBLIC OF SOUTH AFRICA, 108 OF 1996
Blouberg Municipality’s mandate is derived from the Constitution of the Republic of South Africa (1996). The
Constitution enjoins Local Government to:
Provide democratic and accountable local government
Ensure provision of services to communities in a sustainable manner
Promote social and economic development
Promote safe and healthy environment
Encourage the involvement of communities and community organisations in the matters of local
government.
In terms of the Constitution, the White Paper and the legislation flowing from it, municipalities are required to
structure and manage their administration, budgeting and planning processes to give priority to the basic needs of
the community, to promote the social and economic development of the community and to participate in national
and provincial development programmes.
In order to respond to community needs, the planning outcomes of the IDP need to be aligned with the legal
responsibilities of the municipalities as defined by the powers and functions. Municipalities must develop the
alternative planning approaches to address the challenges of providing equitable municipal services that are
integrated with service delivery by other spheres of government.
1.2.2 WHITE PAPER ON TRANSFORMING PUBLIC SERVICE DELIVERY (BATHO PELE WHITE PAPER OF
1997)
The Batho Pele White Paper flows from the White Paper on the Transformation on Public Service (1995). In terms
of the White Paper, transforming service delivery is identified as one of government’s priority areas. The White
Paper is primarily about how public services are provided, and specifically about the efficiency and effectiveness
of the way in which services are delivered. It “seeks to introduce a fresh approach to service delivery, an approach
which puts pressure on systems, procedures, attitudes and behavior within the Public Service and reorients them
in the customer’s favor, an approach which puts the people first.”
The introduction of the concept of Batho Pele, which means, “putting people first”, provides the following eight
service delivery principles in an attempt to ensure that the people, as customers to public institutions, come first:
Consultation: Citizens should be consulted about the level and quality of the public service they receive and
wherever possible, should be given a choice about the services that are offered.
Service Standards: Citizens should be informed on what level and quality of public services they would receive so
that they are aware of what to expect.
Access: All citizens should have equal access to the services to which they are entitled.
Courtesy: Citizens should be treated with courtesy and consideration.
Information: Citizens should be given full, accurate information about the public services they are entitled to receive.

13
Openness and transparency: Citizens should be informed on how the national and provincial departments are run,
how much they cost, and who is in charge.
Redress: If the promised standard of service is not delivered, citizens should be offered an apology, a full
explanation and a speedy and effective remedy; and when complaints are made, citizens should receive a
sympathetic and positive response.
Value for money: Public services should be provided economically and efficiently in order to give citizens the best
possible value for money.
In giving effect to the notion of treating the recipients of government services as customers, the White Paper
articulates that public sector, including the local government sphere, should be governed by the above ethos
(principles).
1.2.3 WHITE PAPER ON LOCAL GOVERNMENT (1998)
The White Paper on Local Government (1998) views integrated development planning as a way of achieving
developmental goals of local government.
The paper establishes a basis for developmental local government, in which, “local government is committed to
working with citizens and groups within the community to find sustainable ways to meet their social, economic and
material needs and improve the quality of their lives”. It also encourages public consultation in policy formulation
and in the monitoring and evaluation of decision-making and implementation.
1.2.4 MUNICIPAL SYSTEMS ACT (ACT 32 OF 2000)
The Act requires the municipality to undertake developmentally oriented planning to ensure that it strives to achieve
the objects of local government set out in Sections 152 and 153 of the Constitution. Section 25 (1) requires the
Municipal Council, within a prescribed period after the start of its elected term, to adopt a single, inclusive and
strategic plan for the development of the municipality which:
Links integrates co-ordinates and takes into account proposals for the development of the municipality;
Aligns the resources and capacity of the municipality with the implementation of the plan;
Forms the policy framework and general basis on which annual budgets must be based.
Complies with the provisions of Chapter 5, and is compatible with national and provincial department plans and
planning requirements binding on the municipality in terms of legislation.
Section 26 of the Act further outlines the core components of the integrated development plan of a municipality. It
requires the integrated development plan of the municipality to reflect:
The municipal council’s vision for the long-term development of the municipality with special emphasis on
the municipality’s most critical development and internal transformation needs;
An assessment of the existing level of development in the municipality, which must include an
identification of communities, which do not have access to basic municipal services;
The council’s development priorities and objectives for its elected term;
The council’s development strategies, which must be aligned with any national, or provincial sector plans
and planning requirements binding on the municipality in terms of the legislations;
A spatial development framework, which must include the provision of basic guidelines for a land, use
management system of the municipality;
The council’s operational strategies;
Applicable disaster management plan;
A financial plan, which must include budget projection for at least the next three years, and
The key performance indicators and performance targets determined in terms of section 41.

14
1.2.5 PERFORMANCE MANAGEMENT SYSTEM (MUNICIPAL SYSTEM ACT)
A municipality’s Performance Management System entails a framework that describes and represents how the
municipality’s cycle and processes of performance, planning, monitoring, measurement, review, reporting and
improvement will be conducted, organized and managed, including determining the roles of the different role-
players. It is critical that political leadership, managers and staff be involved to ensure that the municipality
embraces the IDP and its implementation. Implementing the processes and systems needed to operationalize the
IDP will determine the ultimate success of the municipality. The following need to be taken into consideration when
starting to implement the IDP:
Plan for performance by clarifying objectives and outputs to be achieved
Clarify performance expectations by setting standards and targets for each indicator to assess and
evaluate performance in practice;
Monitor, measure, assess and evaluate performance, and
Link strategic priorities, goals and objectives agreed to in the IDP by:
Enabling staff to understand how their job contributes to the aforementioned.
Ensuring that the resources are directed and used in an efficient, effective and economic way by each
person in the municipality;
Including communities and other stakeholders in decision-making, monitoring and evaluation;
Learning from experience and using it to continuously improve what’s achieved, and
Maintaining transparency and accountability and promoting good governance articulated in the Batho
Pele principles.
1.2.6 MUNICIPAL FINANCE MANAGEMENT ACT (ACT 56 OF 2003)
The Municipal Finance Management Act (56 of 2003) was promulgated to secure sound and sustainable
management of the financial affairs of municipalities and other institutions in the local sphere of government. The
Act provides a mandatory provision that relate to financial and performance management. Section 2 of the Act
stipulates that the object is to secure sound and sustainable management of the financial affairs of the local
government institutions to which this Act applies by establishing norms and standards for:
Ensuring transparency, accountability and appropriate lines of responsibility in the fiscal and financial affairs of
municipalities and municipal entities, The management of revenues, expenditures, assets and liabilities and the
handling of financial dealings, budgetary and financial planning processes, The coordination of those processes
with those of the other spheres of government, Borrowing, Supply chain management, and Other financial matters
Blouberg Municipality’s involvement in the budget process is to ensure compliance with the provision of the
Municipal Finance Management Act. It is crucial that the IDP review and the budget processes are aligned and
integrated. It is considered that a single well-run budget and IDP review process facilitates community participation,
provides ward level information, encourages discussion on priorities and provides an opportunity for feedback.
The main strategic outputs of the budget reform are to ensure:
That there is modernized financial management and improved accountability.
Multi- year budgeting.
Achievement of deepened and improved budget preparation process, by involving the political leadership
and community members
That the IDP and budgets are linked, and that the IDP takes account of budgetary resources, and contain
proper capital and maintenance plans.
An improved in-year implementation of the budget, and
Improved auditing and performance reporting after the financial year has ended.

15
1.2.7 TRADITIONAL LEADERSHIP AND GOVERNANCE FRAMEWORK AMENDMENT ACT (ACT 41 OF 2003)
This Act makes it clear the role of the traditional leadership in the democratic and co-operative governance. The
Act envisages an active involvement of the traditional leadership in the formulation and the implementation of the
integrated development plans. Section 4 of the Act provides for the establishment of traditional councils that should:
Support municipalities in the identification of community needs;
Facilitate the involvement of the traditional community in the development or amendment of the integrated
development plan of a municipality in whose area that community resides;
Participate in the development of policy and legislation at the local level, and
Promote the ideals of co-operative governance, integrated development planning, sustainable
development and service delivery to promote indigenous knowledge systems for sustainable development
and disaster management.
Section 5 (2) of the Act affirms that any partnership between a municipality and a traditional council must:
Be based on the principles of mutual respect and recognition of the status and roles of the respective
parties, and
Be guided by and based on the principles of co-operative governance.
A greater percentage of the population in the municipality resides in traditional authority governed areas. To this
effect, Blouberg Municipality has a standing commitment and tradition of involving the traditional leaders in both
the IDP review process and any other developmental matter involving their areas of governance.
1.2.8 INTER-GOVERNMENTAL RELATIONS FRAMEWORK ACT (ACT 13 OF 2005)
The Act is a response to the limited successes in the alignment efforts among the three spheres of government.
The Act creates a framework to support intergovernmental cooperation and coordination as required by the
Constitution in its definition of “cooperative governance”. It provides for the obligation of all spheres to participate
in the planning processes of the municipality and in turn allow their own planning processes to be influenced by
the municipal IDPs. Municipal IDPs are regarded as important planning frameworks to integrate both the national
and provincial program me in specific local area. The Municipality is participating in the district-planning forum as
well as in the Premier’s Intergovernmental Forum. The participation is aimed at ensuring proper alignment and
coordination of local, district and provincial plans. The Act establishes structures and processes that enhance inter-
governmental planning and monitoring processes for local, provincial and national spheres of governance.
1.2.9 NATIONAL ENVIRONMENTAL MANAGEMENT ACT (ACT 107 OF 1998)
Section 2 of National Environmental Management Act (NEMA) contains important and extensive National
Environmental Management Principles, which apply to the ‘actions of all organs of state that may significantly affect
the environment'. These principles must guide decisions under NEMA or any statutory provision concerning the
protection of the environment. NEMA is known as framework legislation, as it provides overarching principles for
integrating environmental management into development activities. NEMA commits all state departments and local
authorities to employ certain sustainable development principles to guide decision-making. These principles
include:
Sustainable and equitable use of natural and cultural resources,
Development must be socially, economically and environmentally sustainable.
Promote and facilitate public participation.
Adopt a long-term timeframe for equity between generations.
People and their needs are at the forefront of environmental management.
A risk averse and cautious approach, and
Environmental justice,

16
1.2.10 NATIONAL ENVIRONMENTAL MANAGEMENT ACT: AIR QUALITY ACT (ACT 39 OF 2004)
According to the Act, the national, provincial environmental departments and local authorities are separately and
jointly responsible for the implementation and enforcement of various aspects of the Air Quality Act. Each of these
spheres of government is obliged to appoint an air quality manager and to co-operate with each other and co-
ordinate their activities through mechanisms provided for in the NEMA.
1.2.11 NATIONAL ENVIRONMENTAL MANAGEMENT ACT: WASTE ACT (ACT 59 OF 2008)
In fulfilling the rights contained in section 24 of the Constitution, the State, through the organs of state responsible
for implementing this Act, must put in place uniform measures that seek to reduce the amount of waste that is
generated and, where waste is generated, to ensure that waste is re-used, recycled and recovered in an
environmentally sound manner before being safely treated and disposed of.
1.2.12 SPATIAL PLANNING AND LAND USE MANAGEMENT ACT (ACT 16 OF 2013)
The Spatial Planning and Land Use Management Act 16 of 2013 (SPLUMA) is a national law that was passed by
Parliament in 2013. The law gives the Council the power to pass By-Laws in terms of SPLUMA to provide additional
detail on how the law should be implemented. The final version of these Regulations (Regulations in terms of
SPLUMA GG 38594 GN R239) was published on 23 March 2015. The law came into effect on 1 July 2015.
SPLUMA aims to develop a new framework to govern planning permissions and approvals, sets parameters for
new developments and provides for different lawful land uses in municipal land. SPLUMA is a framework law,
which means that the law provides broad principles that will regulate planning. The principles include Spatial
Justice, Spatial Resilience, Spatial Efficiency, Spatial Sustainability and good administration. The principles are
also backed by norms and standards to be practiced when implementing the Act.
The law is important because the repeal of many apartheid era laws has left our planning laws fragmented,
complicated and inconsistent. For this reason, section 3 of SPLUMA says that the law tries to develop a ‘uniform,
effective and comprehensive system’ of planning that ‘promotes social and economic inclusion’.
Although SPLUMA has progressive elements, the coming into effect of the law has been subject to a lot of
controversy and debate. This is largely as a result of the powers that SPLUMA and its Regulations grant to
traditional councils. While CLS (and others) have argued that SPLUMA and its Regulations grant too much power
to traditional councils, the traditional leadership lobby has resisted the Act and has called for government to
suspend its implementation on the basis that they were not consulted properly during the legislative process.
1.2.13 LOCAL AGENDA 21 (LA 21)
Local Agenda 21 also provides a framework for implementing these constitutional duties of local government. One
of the key principles of Local Agenda 21 is integration of ecological thinking into all social and economic planning.
The Reconstruction also recognized this and Development Program me (RDP), which stated that, “Development
strategies must incorporate environmental consequences in the course of planning”. It is clear that South Africa’s
policies and laws require integration of environmental concerns into strategic planning and decision-making.
1.3 NATIONAL AND PROVINCIAL ALIGNMENT
South Africa has a representative form of democratic government. The management and governance of South
Africa is based on a three-sphere system of government, namely national, provincial and local spheres of
government. These spheres are distinctive, interdependent and interrelated. The Constitution states which matters
each sphere of government deals with. This division of powers helps to make sure that the country is properly run
and that government is close to the people it serves.

17
Section 25 of Municipal Systems Act 32 of 2000 determines that the IDP must be compatible with national and
provincial development plans and planning requirements. To ensure that this legislative requirement is adhered to,
the Municipality needs to align itself with National and Provincial directives and draw these down into the spectrum
of service delivery.
The national and provincial policy imperatives have been taken into consideration in the implementation of the
municipality core business. Blouberg Municipality has therefore focused its efforts to complement National and
Provincial Government to accomplish developmental goals, with emphasis on matters that are the competency of
Local Government.
1.3.1 NATIONAL 2014 VISION
As part of South Africa’s celebration of 10 years of democracy, National Government formulated Vision 2014 to
guide itself for the next ten years. The vision is to build a society that is truly united, non-racial, non-sexist and
democratic. Central to this is a single and integrated economy that benefits all. The combination of some of the
most important targets and objectives making up Vision 2014 are as follows:
Reduce unemployment by half through new jobs, skills development, assistance to small businesses,
Opportunities for self-employment and sustainable community livelihoods;
Reduce poverty by half through economic development, comprehensive social security, land reform and improved
household and community assets;
Provide the skills required by the economy, build capacity and provide resources across society to encourage self-
employment with an education system that is geared for productive work, good citizenship and a caring society;
Ensure that all South Africans, including especially the poor and those at risk – children youth, women, the aged
and people with disabilities – are fully able to exercise their constitutional rights and enjoy the full dignity of freedom;
Compassionate government service to the people: national, provincial and local public representatives who are
accessible; and citizens who know their rights and insist on fair treatment and efficient service;
Massively reduce health risks such as tuberculosis, diabetes, malnutrition and maternal deaths and turn the tide
against HIV and AIDS, and, working with the rest of Southern Africa, strive to eliminate malaria, and improve
services to achieve a better national health profile and reduction of preventable causes of death, including violent
crime and road accidents;
Significantly reduce the number of serious and priority crimes as well as cases awaiting trial, with a society that
actively challenges crime and corruption, and with programs that also address the social roots of criminality; and
Position South Africa strategically as an effective force in global relations, with vibrant and balanced trade and
other relations with countries of the South and the North, and in an Africa that is growing, prospering and benefiting
all Africans, especially the poor.
Vision 2014 translates into practical steps, with the following specific implications for the municipality:
A growing economy;
Sustainable livelihoods – inter alia creating job opportunities through the Expanded Public Works Program
me (EPWP);
Access to services: Speed up programs to provide basic services like water and sanitation, electricity
roads and transport services
Realize Batho Pele principles and improve services in government offices;
Safety and security;
Constitutional rights and governance – improve interaction between government and the people.

18
1.3.2 ACCELERATED AND SHARED GROWTH INITIATIVE - SOUTH AFRICA (ASGISA)
After research and discussion with stakeholders, government identified six “binding constraints on growth” that
needed to be addressed to progress in its desire for shared growth and to achieve its target of halving
unemployment and poverty between 2004 and 2014. This could be achieved if the economy grew at an average
rate of at least 4.5% in the period to 2009, and by an average of 6% in the period 2010 to 2014.
Targets set by ASGISA include:
Halving poverty by 2014 to all households;
Halving unemployment by 2014 from 30%;
Achieving growth of approximately 6% per annum; and
The three spheres of government should spend 50% of the total on infrastructure.
Six key levers for economic growth have been identified, namely:
Macro-economic intervention;
Infrastructure development;
Skills development;
Strengthening public institutions;
Sectoral investments; and
Interventions in second economy
In the light of the above, ASGISA has identified a set of initiatives that will serve as a catalyst for faster growth.
This is complemented with on-going enabling management of fiscal and monetary policy, more focused industrial
policy framework, supporting sector policies and legislation and a range of projects and initiatives in the economic
cluster of government. Strategies for growth and development include investment in transport infrastructure,
support to SMME is and lab our intensive projects, prioritizing social and economic infrastructure and building
partnerships.
Municipalities in particular, as the closest sphere of government to communities have an important role to play in
implementing the goals set by ASGISA. They operate under the framework of developmental local government
and a constitutional mandate to look after the socio-economic needs of communities and development of their
areas of jurisdiction. They have to actively create conducive environment for job creation.
The National Framework for Local Economic Development addresses this issue directly. The framework argues
that the municipal areas are the spaces in which an integrated impact of government needs to be optimized in
order to accelerate shared growth. This integrated impact has to be synergized with the requirements of the local
economy, the needs of its stakeholders and the opportunities and potentials that drive economic growth and
sustainable livelihoods. The Framework also argues that municipalities have to play a strategic facilitation role
managing the forces and dynamics affecting the area. This is more effective than a direct role in job creation where
municipalities attempt to set-up and run enterprises in the form of small ad-hoc projects that require ongoing public
support.
Municipalities can further play an important role through provision of infrastructure and services, by-laws, land use
planning and procurement policies in stimulating the local economy. Effective infrastructure planning and provision
can involve local suppliers and assist in building local competencies. Firstly, certain of the binding constraints on
growth that ASGISA identifies have direct relevance to the role and functioning of municipalities. Municipal Local
Economic Development strategies need to address how these constraints in their own areas can be overcome.
ASGISA has identified key sectors for growth and development. Again, municipal strategies should identify if and
how these sectors are relevant for their areas and what would be done to grow them.

19
1.3.3 NEW MANDATE: KEY CONSIDERATIONS
In order to give effect to the strategic objectives as spelled out in the electoral mandate of the ruling party, Blouberg
Municipality also aligns its programs to the ten priority areas as contained in the Medium Term Strategic
Framework, for the review of the IDP.
The key priority areas include:
Ensuring more inclusive economic growth, decent work and sustainable livelihoods
Economic and social infrastructure
Rural development, food, security and land reform
Access to quality education
Improved health care
Fighting crime and corruption
Cohesive and sustainable communities
Creation of a better Africa and a better world
Sustainable resource management and use
A developmental state including improvement of public services
Blouberg Municipality has to date implemented a balanced and integrated suite of programs that cover all key
priority areas identified in the manifestos.
1.3.4 NATIONAL SPATIAL DEVELOPMENT PERSPECTIVE
Government’s key priority in the second decade freedom is to increase economic growth and promote social
inclusion. A clearly articulated set of spatial priorities and criteria is one of the mechanisms through which
government provides a strategic basis for focusing government action, weighing up trade-offs and linking the
strategies and plans of the three spheres and agencies of government. In this sense, the National Spatial
Development Perspective (NSDP) is a critical instrument for policy coordination, with regard to the spatial
implications of infrastructure programs in national, provincial and local spheres of government. It is in this context
that the January 2003 Cabinet Lekgotla approved the NSDP as an indicative tool for development planning in
government.
Since its adoption, three factors have necessitated a review and update of the NSDP:
New data on socio-economic trends;
The development of IDPs and Provincial Growth and Development Strategies (PGDS) and the continuing
engagement in aligning them with the NSDP; and
Renewed focus on decisive interventions to ensure accelerated and shared economic growth.
The NSDP provides:
a set of principles and mechanisms for guiding infrastructure investment and development decisions;
Description of the spatial manifestations of the main social, economic and environmental trends which
should form the basis for a shared understanding of the national space economy; and
An interpretation of the spatial realities and the implications for government intervention
Government is committed to economic growth, employment creation, sustainable service delivery, poverty
alleviation programs and the eradication of historic inequalities. In order to ensure that infrastructure investment
and development programs are channeled towards these objectives, the NSDP was formulated. The principles
enshrined in the NSDP are thus of great importance to local government investment, through the IDP and capital
expenditure.

20
The NSDP Vision is as follows:
South Africa will become a nation in which investment in infrastructure and development programs support
government’s growth and development objectives:
By focusing economic growth and employment creation in areas where this is most effective and
sustainable;
By supporting restructuring where feasible to ensure greater competitiveness;
By fostering development on the basis of local potential; and
By ensuring that development, institutions are able to provide basic needs throughout the country.
The following normative principles are put forward as guide for all spheres of government when making decisions
on infrastructure investment and development spending:
Economic growth is a prerequisite for the achievement of other policy objectives, key among which would
be poverty alleviation;
Government spending on fixed investment, beyond the constitutional obligation to provide basic services
to all citizens, should therefore be focused on localities of economic growth and/or economic potential in
order to attract private sector investment, stimulate sustainable economic activities and/or create long-
term employment opportunities;
Efforts to address past and current social inequalities should focus on people not places; and
In order to overcome the spatial distortions of apartheid, future settlement and economic development:
Opportunities should be channeled into activity corridors and nodes that are adjacent to or link the main
growth centers.
Infrastructure investment and development spending should primarily support localities that will become
major growth nodes in South Africa and the Southern African Development Community region to create
regional gateways to the global economy.
The NSDP thus seeks to focus the bulk of fixed investment of government on those areas with the potential for
sustainable economic development, as it is in these areas where government’s objectives of promoting economic
growth and alleviating poverty will best be achieved. It places emphasis on the quality of interventions and
investment choices by calling for a rigorous analysis of the economic opportunities and potentials in each of the
Local, District and Metropolitan Municipal Areas. The Local, District, Metropolitan IDP has, and LED programs,
crafted through joint work across the three spheres of government and with State Owned Enterprises and social
partners would have to internalize the logic of the NSDP.
1.3.5 NATIONAL DEVELOPMENT PLAN
The development of the National Development Plan by the National Planning Commission will transform the way South Africans at all spheres of government as well as the private sector and the community at large plan and implement development programs. The plan is developed to ensure that the country becomes developed state to play a key role in mainstream global economy.
The National Planning Commission‘s vision and plan for 2030 charts a 20 year path towards achieving the overarching vision embedded in the Constitution that South Africa belongs to all who live in it. It breaks the five-year electoral cycle to allow for the long term planning. The plan opens way for the following goals:
The mobilization of society around a commonly agreed set of long-term goals
Greater coherence in government’s work between departments, which can only be achieved if there is a common understanding of long-term objectives.
The development of a broad consensus to encourage business and society to think about the long term. This will provide a basis for making trade-offs and prioritizing major decisions.

21
A key aspect of South Africa's new National Development Plan, a blueprint for creating sustainable growth and
development in the country over the next two decades, is its emphasis on active citizenry. The National
Development Plan finds expression in this IDP on its emphasis on long term planning, the development of master
plans for growth points as well as the IDP’s emphasis on universal access to basic services by Blouberg
communities.
1.3.6 LIMPOPO EMPLOYMENT, GROWTH AND DEVELOPMENT PLAN (LEGDP)
The Limpopo Employment, Growth and Development Plan (LEGDP) is a provincial (three tiers of government,
private sectors, lab our federations, NGOs, etc.) tactical initiative. The LEGDP assists the Province to be able to
make strategic choices in terms of prioritizing catalytic and high impact initiatives as a way of responding to the
medium term strategic framework strategic thrust.
1.3.7 PARTNERSHIP WITH PROVINCIAL AND NATIONAL GOVERNMENT
The basic constitutional principle of governance in South Africa is “co-operative governance”. All spheres of
government are obliged to observe the principles of co-operative government put forward in the Constitution.
Chapter 3 of the Constitution provides the cornerstones for cooperation between the different spheres of
government and organs of state in South Africa. Co-operative government assumes the integrity of each sphere
of government. However, it also recognizes the complex nature of government in modern society. No country today
can effectively meet its challenges unless the components of government function as a cohesive whole.
In South Africa, a system of inter-governmental relations is emerging to give expression to the concept of
cooperative government. The Inter-Governmental Relations Framework Act (Act 13 of 2005) is a response to the
limited successes in the alignment efforts among the three spheres of government. The Act creates a framework
to support intergovernmental cooperation and coordination as required by the Constitution in its definition of
“cooperative governance”. It provides for the obligation of all spheres to participate in the planning processes of
the municipality and in turn allow their own planning processes to be influenced by the municipal IDPs. Municipal
IDPs are regarded as important planning frameworks to integrate both the national and provincial program me in
specific local area. The Municipality is participating in the district-planning forum as well as in the Premier’s
Intergovernmental Forum. The participation is aimed at ensuring proper alignment and coordination of local, district
and provincial departments. The Act establishes structures and processes that enhance inter-governmental
planning and monitoring processes for local, provincial and national spheres of governance.
A system of inter-governmental relations has the following strategic purposes:
To promote and facilitate cooperative decision-making
To coordinate and align priorities, budgets, policies and activities across interrelated functions and sectors
To ensure a smooth flow of information within government, and between government and communities,
with a view to enhancing the implementation of policy and programs, and
The prevention and resolution of conflicts and disputes.
The Constitution obliges all spheres of government to co-operate with one another in mutual trust and good faith
through fostering friendly relations; assisting and supporting one another; informing one another of, and consulting
one another on matters of common interest; and coordinating their actions and legislation with one another. Local
government should maintain open, co-operative and constructive relations with both provincial and national
government, seeing its operation as a component of the broader state structure.
Local government alone does not influence a matter in its area. Other spheres of government, either by
independently conducting their own programs in the same area as a municipality, or by regulating the operation of
municipalities in line with their own sectoral objectives, also affect matters in a municipal area.
Strong and capacitated local government can play a critical role in enhancing the success of national and provincial
policies and programs, and building sustainable human settlements for the nation. In a spirit of cooperative

22
governance, national and provincial government should seek to support and enhance the developmental role of
local government. Local government is the structure that serves the people most directly. It is therefore vital that
this sphere of government applies the principles of co-operative governance.
1.4 MUNICIPAL POWERS AND FUNCTIONS
Specific powers and functions were assigned to the Blouberg local municipality in terms of Notice of Establishment
(Notice No 307) published in the Provincial Government Notice of 2000 and in terms of section 84(2) of the
Municipal Systems Act of 2000.
i. Child care facilities ii. Electricity and energy iii. Local tourism iv. Municipal planning v. Municipal public works vi. Stormwater management systems in built-up areas vii. Trading regulations viii. Billboards and the display of advertisements in public places ix. Cemeteries x. Control of public nuisances xi. Control of undertakings that sell liquor to the public xii. Fencing and fences xiii. Local amenities xiv. Local sport facilities xv. Markets xvi. Municipal parks and recreation xvii. Municipal roads xviii. Noise pollution xix. Pounds xx. Public places xxi. Refuse removal, refuse dumps and solid waste disposal xxii. Street trading xxiii. Street lighting xxiv. Traffic and parking
1.5 MUNICIPAL PRIORITIES
NO MUNICIPAL PRIORITIES
01. Economic Development, Job Creation and Partnerships
02. Land Use Management
03. Roads and Public Transport infrastructure
04. Human Resource Development
05. Institutional Development and Financial Sustainability/Sound financial Management and Financial Viability
06. Sports and Recreational
07 Sustainable, Alternative and Green Energy
08. Rural Development and Urban Renewal
09. Healthy and Safer Environment and Waste Management
10. Health and Welfare Services
11. Access to Water and Sanitation
12. Emergency Services and Communication

23
1.6 GOVERNMENT STRATEGIC PRIORITIES
1.6.1 NATIONAL DEVELOPMENT PLAN
The National Development Plan was developed as a national government long-term plan and roadmap for the
development of the country for the period until 2030.
1.6.2 THE PILLARS OF THE NATIONAL DEVELOPMENT PLAN
Mobilization of all south Africans
Active engagement of citizens in their own development.
Expansion of the economy and making growth inclusive.
Building of key capabilities.( human, physical and institutional)
Building a capable and developmental state.
Fostering the strong leadership throughout the society.
1.6.3 FIVE KEY NATIONAL PRIORITIES
Creation of decent work and sustainable livelihood.
Education
Health
Rural development and food security
Fight against crime and corruption
1.6.4 FOURTEEN MTSF NATIONAL PRIORITY OUTCOMES (2014-2019)
Quality basic education
Long and healthy life for south Africans
Protection and safety for all the people
Decent employment through inclusive economic growth
A skilled and capable workforce to support the inclusive economic growth
An efficient, competitive and responsive economic infrastructure network
A vibrant, equitable and sustainable rural communities and food security
Sustainable hu8man settlements and improved quality household life
A comprehensive, responsive and sustainable social protection system
A responsive, and accountable, effective and efficient local government systems
Protection and enhancement of environmental assets and natural resources
An efficient, effective and development oriented public service.
A diverse, socially cohesive society with common national identity.
A better South Africa, a better and safer Africa and the world.
1.6.5 LIMPOPO DEVELOPMENT PLAN (2014-2019)
The Limpopo development plan is a comprehensive development plan that is intended to take advantage of
Limpopo’s comparative position, to uplift and improve the general condition of all facets of development in the
province. To fulfil potential for prosperity of the province in a socially, cohesive, sustainable prosperous and
peaceful manner.
LIMPOPO DEVELOPMENT PLAN OBJECTIVES
To create decent employment through inclusive economic growth and sustainable livelihoods.
To improve the quality of life of citizens.
To prioritize social protection & investment

24
To promote vibrant and equitable sustainable rural communities.
To raise the effective and efficiency of a developmental public service.
To ensure sustainable development.
1.7 INSTITUTIONAL ARRANGEMENT TO DRIVE THE IDP PROCESS
1.7.1 IDP/BUDGET REVIEW STEERING COMMITTEE
The IDP/Budget Steering Committee acts as a support to the IDP Representative Forum, making technical
decisions and inputs, to the Municipal Manager and the IDP Manager. This committee will be reconstituted for the
IDP preparation process.
1.7.2 INSTITUTIONAL ARRANGEMENTS:
The IDP Manager shall chair the IDP/Budget steering committee and in his /her absence by Municipal Manager. Members of the IDP/Budget Steering Committee will comprise the Senior Management of the Municipality, the staff responsible for the preparation of the IDP, PMS and Budget, all unit managers and any other member as the Municipal Manager/ IDP Manager may deem fit. 1.7.3. IDP/BUDGET REVIEW PROCESS PLAN 2019/2020
KEY PROGRAMMES ACTIVITY RESPONSIBLE
COMMITTEE/PERSON
TIMELINES
Process Plan Submission Of Draft Process Plan To Council For Approval
Mayor 29 July 2019
Annual Financial Statements
Submission Of Annual Financial Statements To AG And Treasury
Municipal Manager 29 August 2019
Annual Performance Report
Tabling Of Annual Performance Report To Council
Mayor 29 August 2019
Annual Performance Report
Submission Of Annual Performance Report To AG And CoGHSTA
Municipal Manager 13 September 2019
IDP Representatives Forum
First IDP/Budget Representatives Forum Meeting
IDP Manager 08 October 2019
Traditional Leaders Meeting With Traditional Leaders IDP Manager 10 October 2019
IDP/Budget Steering Committee Meeting
First Quarter Steering Committee Meeting
IDP Manager 16 October 2019
Institutional Performance Review Sessions
First Quarter IDP Performance Review Session
Municipal Manager 24-25 October 2019
Second Quarter IDP Steering Committee Meeting
IDP Manager 15 January 2020
Second Quarter IDP Performance Review Session
Municipal Manager 23-24 January 2020
25
Third Quarter IDP Steering Committee Meeting
IDP Manager 14 April 2020
Third Quarter IDP Performance Review Session
Municipal Manager 23-24 April 2020
Fourth Quarter IDP Steering Committee Meeting
IDP Manager 15 July 2020
Fourth Quarter IDP Performance Review Session
Municipal Manager 23-24 July 2020
Draft Annual Report Tabling Of Draft Annual Report To Council 2018/2019
Mayor 30 January 2020
Section 72 Report Tabling Of The Section 72 Report To Council
Mayor 30 January 2020
Adjustment Budget Tabling Of The Adjustment Budget 2019/2020
Mayor 27 February 2020
IDP/Budget Public Consultation
Meeting With Traditional Authorities Mayor 08 April 2020
Meeting With Alldays Rate Payers Association
Mayor/Exco 14 April 2020
Meeting With Farmers Unions ( Bobrak Rivier Landbou Unie)
Mayor/Exco 22 April 2020
Meeting With Farmers Unions ( Koedoesrand Landbou Unie)
Mayor/Exco 05 May 2020
IDP/Budget 2020/2021 Representatives Forum Meeting
IDP Manager 06 May 2020
Cluster A Consultative Meeting Mayor/Exco 07 May 2020
Cluster B Consultative Meeting Mayor/Exco 11 May 2020
Cluster C Consultative Meeting Mayor/Exco 13 May 2020
Cluster D Consultative Meeting Mayor/Exco 18 May 2020

26
Cluster E Consultative Meeting Mayor/Exco 20 May 2020
Annual Report Public Consultations
Cluster A Consultative Meeting MPAC 13 February 2020
Cluster B Consultative Meeting MPAC 19 February 2020
Cluster C Consultative Meeting MPAC 10 March 2020
Public Hearing Session Holding Of Public Hearing Meeting MPAC 17 March 2020
Approval Of Annual Report 2018/2019
Tabling Of Annual Report To Council MPAC 26 March 2020
Approval Of Draft IDP/Budget 2020/2021
Tabling Of The Draft IDP/Budget 2020/2021 Council
Mayor 26 March 2020
Approval Of Final Draft IDP/Budget 2020/2021
Tabling Of The Final Draft IDP/Budget 2020/2021 To Council
Mayor 28 May 2020
Submission Of Oversight Report To MEC
Submission Of Oversight Report To MEC (CoGHSTA)
Municipal Manager 14 April 2020
Submission Of Draft IDP/Budget 2020/2021 To MEC And Treasury
Submission Of Draft IDP/Budget To MEC And Treasury
Municipal Manager 14 April 2020
Approval Of The SDBIP Sdbip Is Submitted To The Mayor For Approval
Municipal Manager 26 June 2020
Submission Of SDBIP 2020/2021
SDBIP Is Submitted To MEC (CoGHSTA)
Municipal Manager 26 June 2020
Performance Agreements And Plans
Municipal Manager Signs With Mayor, Section 56 Managers Sign With Municipal Manager
Mayor
Municipal Manager
02 July 2020
03 July 2020
Submission Of Performance Agreements
Performance Agreeements Of The Municipal Manager And Section 56 Managers Are Submitted To MECc (CoGHSTA)
Municipal Manager 14 July 2020
Due to the Covid19 pandemic, the municipality could not, as per the normal processes hold public participation consultation meetings on the Draft 2020/2021 IDP. However, the draft 2020/2021 IDP and budget was published on the following;
Municipal website on the 19th May 2020
Local Newspaper ( Observer on the 21st May 2020)
Published on the Municipal website on the 18th of May 2020.
The Traditional leaders were consulted in a contact meeting held ont the 11th June 2020 and the Farmers’ Union through a Virtual meeting held on the 10th June 2020.
The Councillors were given copies each of the IDP documents and comment forms to distribute in their wards

27
Other copies were placed in the satellite offices for easy access and some were distributed to the Traditional Councils with suggestion boxes
Our Honorable Mayor presented the Draft 2020/2021 IDP/Budget on media live, this was done Through a local radio station Mohodi FM on the 9th June 2020 and the National radio station Thobela FM on the 11th June 2020)
1.7.4 ISSUES RAISED IN THE MEC OF COOPERATIVE GOVERNANCE, HUMAN SETTLEMENTS AND
TRADITIONAL AFFAIRS IDP ASSESSMENT REPORT 2019/2020
KEY PERFORMANCE AREA ACTUAL PERFORMANCE CORRECTIVE ACTION
Energy master plan No indication To be addressed in the 2020/2021 revised IDP
Disaster management plan No indication To be addressed in the 2020/2021 revised IDP
Objectives and strategies for sustainable human settlements
No indication To be addressed in the 2020/2021 revised IDP
Projects from DOE No indication To be addressed in the 2020/2021 revised IDP
Objectives and strategies to address safety and security challenges
No indication To be addressed in the 2020/2021 revised IDP
Targets, indicators, timing, costs and budget for safety and security projects
No indication To be addressed in the 2020/2021 revised IDP
Network and telecommunication challenges
No indication To be addressed in the 2020/2021 revised IDP
Network and telecommunication projects with costs, budget, timing and
No indication To be addressed in the 2020/2021 revised ID1P
Roads Master Plan No indication To be addressed in the 2020/2021 revised IDP
Human Settlements Plan No indication To be addressed in the 2020/2021 revised IDP
Educational Plan No indication To be addressed in the 2020/2021 revised IDP
Health Plan No indication To be addressed in the 2020/2021 revised IDP
Telecommunication Plan No indication To be addressed in the 2020/2021 revised IDP
Storm water Drainage Strategies No indication To be addressed in the 2020/2021 revised IDP
Public transport Strategies No indication To be addressed in the 2020/2021 revised IDP
HIV/AIDS Plan No indication To be addressed in the 2020/2021 revised IDP
Local Skills Base No indication To be addressed in the 2020/2021 revised IDP
Public Private Partnership Strategies
No indication To be addressed in the 2020/2021 revised IDP

28
CHAPTER 2: SITUATIONAL ANALYSIS
2.1 INTRODUCTION
The section provides the following information:
1. An overview of the demographic indicators of the Blouberg local municipality, overall perspective of the
area, trends and tendencies.
2. Highlights the key areas of significant
3. Identification of the strength and capabilities.
2.2 DISCRIPTION OF THE MUNICIPAL AREA
The name of the municipality is Blouberg named after the Blouberg Mountains range. Blouberg Local Municipality
was originally Established in the year 2000 after the amalgamation of the then Bochum- My-Darling TLC, Alldays
–Buysdorp TLC and other portions Of Moletji- Matlala TLC. This municipality is one of the four municipalities
constituting Capricorn District municipality. Other municipalities Constituting the Capricorn District municipality are
Lepelle- Nkumpi, Mole mole and Polokwane. The municipality covers an area of About 9,248.44km2 (this includes
the newly incorporated areasfrom former Aganang). The total population is estimated at 172 601 with the total
number of Households at 43 747. Average household size is 5.72 (Source: Community Survey, 2016).
Blouberg Local Municipality is situated approximately 95 kilometers from Polokwane towards the far northern part
of the Capricorn District Municipality. It is bordered by Polokwane on the south, Mole mole on the southwest,
Makhado on the northeast, Lephalale on the Northwest, Mogalakwena on the southwest and Musina on the north.

29
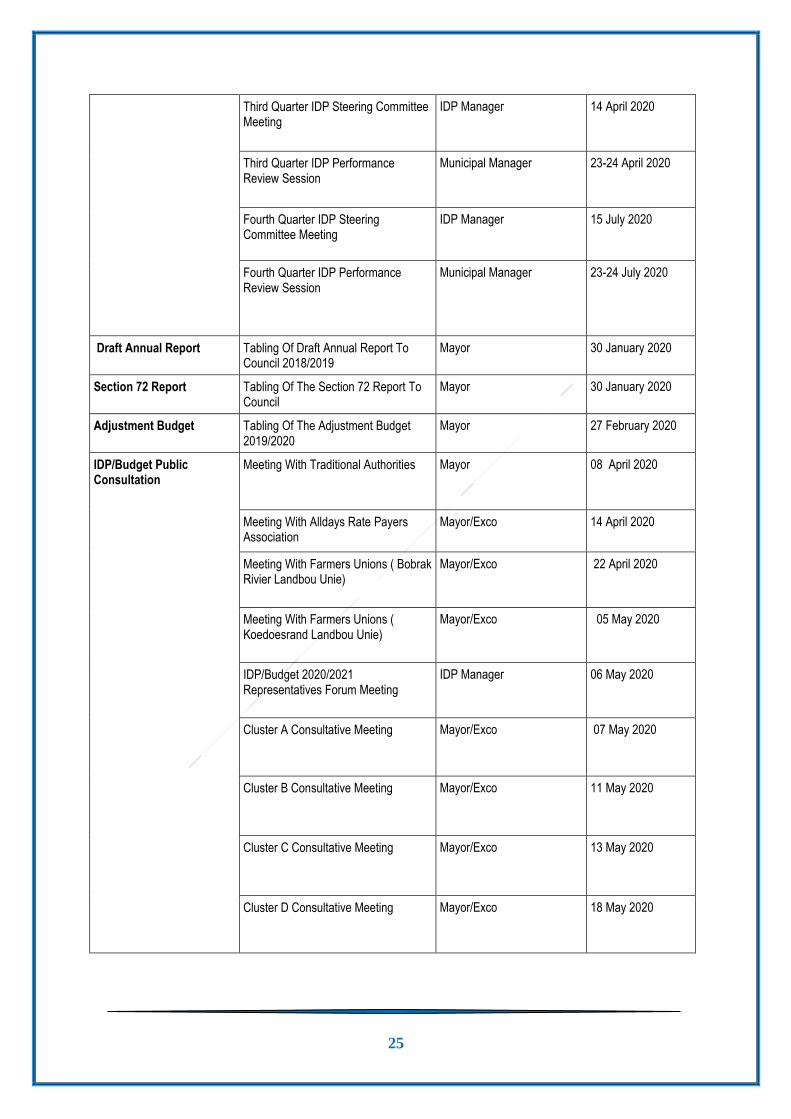
Below is the map of Blouberg municipality and its wards.

30
2.3 BLOUBERG MUNICIPALITY WITHIN THE REGIONAL CONTEXT
Blouberg Local municipality is a predominantly rural municipality situated to the northwestern boundary of the
Republic of South Africa, with Botswana and Zimbabwe. Roads R521 (P94/1 and P94/2) provides a north-south
link between Blouberg and Mole mole, Polokwane and Makhado municipality. To the east, the municipality is
served by road R523 (D1200) that provides access to the towns such as Mogwadi, Morebeng, Duiwelskloof,
Tzaneen and Lephalale. There is another important road (N11) from Mokopane town to Botswana that passes
through the municipality, which has the potential to stimulate economy.
This roads network serves as key important linkages, which serve as corridors and gateways to major economic
destinations (Venetia Mine, Coal of Africa and Lephalale such as Coalmines and Medupi power station).
It is therefore imperative for the municipality to optimize the potential these important routes pose not only for
access and mobility but also for economic development, especially for stimulating tourism development.
There are big rivers and tributaries that traverse the municipality with Mogalakwena being the biggest one. The
Limpopo River serves as the border between the municipality and the neighboring country of Botswana.
As a result, the municipality is a gateway to the neighboring countries. Farmers use the rivers in the main for
agricultural purposes, but again for domestic use by communities that experience water shortages. There are
various mountain ranges found within the municipality with the Blouberg Mountain being the biggest mountain. The
other mountains are the Makgabeng that was declared the national heritage site because of its historical significant.
The municipality is divided into three visible categories of land ownership. There is a portion of land owned by
private individuals that consists mainly of farms that are used for agricultural purposes, land owned by traditional
leaders where large communities reside, live, and state land. Large parts of the municipality consist of private
farms used for agricultural purpose.

31
Above is the map showing the Blouberg municipality and its sister municipalities in the Limpopo province.

32
2.4 DEMOGRAPHIC PROFILE
The section deals with the population trends, gender distribution, unemployment, education, income levels and age in the municipality. Below is the illustration of population
distribution in the Capricorn District municipality as per local municipality.

33
Blouberg as one of the municipalities in the Capricorn district has the second lowest population after Mole mole municipality. It contributes only 13% of the district population.
Polokwane municipality has the biggest population of 60% followed by Lepelle –Nkumpi municipality.
2.4.1 POPULATION TRENDS

34

35
2.4.2 POPULATION GROWTH FOR BLOUBERG (2000-2016)
According to Figure 1 and 2, the population of Blouberg declined from 182 003 in 2000 to 176 135, before declining further to 175 753 in 2016. Of the four constituent municipalities
of Capricorn District, Blouberg is the only municipality that saw a decline in its population. The amalgamation with Aganang led to an increase in the population starting from
2015 onwards (by 1.2%), but still far lesser than the population of Blouberg alone in 2000. This decline can be attributed to among other things, the low fertility rate, high mortality
rate compared to birth rate or the out migration by the economically active population to the industrial centers such as Polokwane and Gauteng to seek better economic prospects
Population Distribution
Urban area
Tribal or Tradional area
Farm
Urban Area
Tribal or Traditional area
Farm

36
According to Stats SA, the municipality has five national groupings that residing within its area of jurisdiction and they are Black Africans, Colored, Indians and Whites. The
majority is Black Africans who constitute 98% of the total population and live in the tribal areas. The female folk are dominant and the majority is youths.
The graph below clearly indicates the population distributions of the municipal population.
2.4.3 STATISTICAL INFORMATION AND PROFILING
STATISTICS SOUTH AFRICA (Census 2011 & Community Survey 2016)
ITEM (CENSUS 2001 STATS)
2007(COMMUNITY SURVEY)
CENSUS 2011 STATS SA
COMMUNITY SURVEY 2016
Population 171 721 194 119
162 629 172 601
Households 33 468 35 595
41 192 43 747
Average Households 1.7 1.6
1.6 1.6
Wards 16 18 21 22
Villages 116 118 125 135
The table above indicates the growth patterns in terms of the population and households in the municipality between 2001 to 2016.
The indication is that the population of the municipality has not been consistent in terms of growth. The table shows a huge increase in the population by the year 2007 according
to the survey. The households number has been increasing in every census and surveys conducted. The fluctuation may be caused by a variety of factors that includes migration
and mortality. The increase in the number of wards is consistent with the decrease in the number of population.

37
0
20000
40000
60000
80000
100000
120000
140000
160000
180000
200000
Census 2001 Stats 2007 Community Survey Census 2001 Stats SA Community Survey 2016
STATISTICS SOUTH AFRICA (CENSUS 2011 & COMMUNITY SURVEY 2016)
Populations Households

38
99%
0%0%1%0%
Population Group by Gender Male
Black African Coloured Indean White Other

39
2.4.4 RACIAL POPULATION DISTRIBUTION IN THE MUNICIPALITY
The section illustrates the population distribution by gender male by racial group. There are different racial groups
of people living in the municipality as indicated in the chart. There are Black Africans, Colored’s, Indians, Whites
and other racial groups. The section indicates that the black Africans constitute 99% of the male population.
2.5 EMPLOYMENT PROFILE
The section analyses the employment trends within the provincial, the Capricorn district and its constituent
municipalities from a total employment and at the sectoral level on the dominant sectors of the Blouberg economy,
which is the agriculture, mining, manufacturing and retail sectors.
Limpopo employment levels, which stood at 941000 in 2016, contributes 7% to the total national employment of
15.78 million employed people. The Capricorn district with its employment levels of 267 000 employed people in
2016 constitutes 28.4% to the provincial employment whereas Blouberg employment which comprised 13 655 of
employed people in 2016 constituted 5% of the district employment.
The economy of the municipality is growing by 1% annually. The municipality contributes 20% of the district GDP.
The unemployment statistics stands at 24% with the youths and women mostly affected. The level of poverty is
high and people living under poverty line is 65000. About 13700 people are employed in the formal sector while
about 6000 are in the informal sector.
According to the graph below, employment rate of Blouberg declined by 1% from 9178 to 9130 between 2000 and
2010 before recovering by 6.7% to 13 655 in 2016. The year on year decline is in line with that of the economic
activities.
The total employment in the informal sector increased by 8.3% from 3511 people to 4233 between 2000 and 2010
and grew further by 7% to 5946 in 2016. The year on year growth in the informal sector reflects a growing economy
that is however not able to accommodate all the economically active population.
The agricultural sector employment trends in Limpopo and the Capricorn district reflects its performance at national
level. The sector has been stagnant in the last 16 years and has only absorbed a few people. In the Blouberg the
sector absorbed only 2 823 in 2016 noting that it had absorbed only 2 528 in 2000.

40
The agricultural sector employment trends in Limpopo and the Capricorn district reflects its performance at national level. The sector has been stagnant in the last 16 years and
has only absorbed a few people. In the Blouberg the sector absorbed only 2 823 in 2016 noting that it had absorbed only 2 528 in 2000.

41
2.6 AGRICULTURAL DEVELOPMENT
a) Crop/Vegetable Farming
According to the Limpopo Agro-Processing Strategy (2012) Blouberg Municipality is one of the biggest producers and exporters of tomatoes, onions and potatoes in the Limpopo
Province alongside Molemole, and Makhado Municipalities and furthermore the strategy proposes that such production should be expanded. What is lacking is that the processing
of these produce is not done in the respective municipalities but mainly in the province of Gauteng where finished products are sold at higher prices to these exporting
municipalities. Furthermore, the strategy also identifies tobacco farming as one of the strong pillars of agricultural development in the Blouberg area.
Map 7 above reflects the performance of onion production in the Limpopo Province per municipality. (b) Livestock and Game Farming
Blouberg Municipality has comparative and competitive advantages about the production of red meat in the form of beef and goat’s production.

42
Map 8 above shows the performance of BLM on beef production in the Limpopo Province

43
Blouberg municipality has also benefited from the Limpopo IDC Nguni Cattle Development Programme. The
programme is a partnership between the Limpopo Department of Agriculture, IDC and University of Limpopo and
to date the community of Juniors loop in ward 17 has benefited from the program me. However, institutional
weaknesses on the program me for the benefitting community of Junior sloop have resulted in the collapse of the
program me in 2017.
Other opportunities in farming involve game farming, which is also used for ecotourism in the southwestern part of
the municipality in areas such as Baltimore, Tolwe. Swartwater, and Maastroom, as well as in the regions northern
and western parts of Alldays.
Some challenges encountered in the sector relate to poor skills, group approaches to the sector, which resulted in
cooperatives running down established operations. This sector is also racially divided in the municipality. In terms
of agricultural development, most white farmers farm on a commercial basis while most black farmers practice
subsistence farming. Membership of organized commercial farmers is also done along racial lines. In the Blouberg
area, white commercial farmers are affiliated to various organized farmers’ unions such as Koedoesrand Landbou
Unie (KDLU), Bo-Brakrivier Boerevereneging, Transvaal Agricultural Union, while black commercial farmers are
affiliated to National African Farmers Union.
The total employment in the informal sector increased by 8.3% from 3511 people to 4233 between 2000 and 2010
and grew further by 7% to 5946 in 2016. The year on year growth in the informal sector reflects a growing economy
that is however not able to accommodate all the economically active population.

44

45
Figure 7: Employment in Mining Sector, 2000-2016 (Source: Global Insight, ReX)
Blouberg has the lowest mining activities of the four constituent’s municipalities in the Capricorn district.
The biggest mining activities takes place in Polokwane, followed by Lepelle- Nkumpi and Molemole municipalities.
Blouberg mining activities are still at exploration stage, which upon maturity will certainly increase the mining GVA and employment from the current 399 as illustrated in the
graph above.

46
Figure 8: Employment in Manufacturing Sector, 2000-2016 (Source: Global Insight ReX.
The graph illustrates the employment levels in the district and the constituent’s municipalities.
The municipality has the lowest number of manufacturing activities in the district as compared to the other constituent municipalities.
The number of the people in the manufacturing sector declined by 309 in the year 2000 to 282 in 2010 before recovering by 445 people in 2016.
Figure 9: Employment in the Trade Sector, 2000-2016 (Source: Global Insight, ReX).
The trade sector, which is part of the service sector, represent the economic activities in the wholesale, retail in the general trading environment.
The employment of 38 839 which has doubled from 21000 in 2000 constitutes 79.9% of the district employment in the sector.

47
Blouberg has the lowest activities in the sector as compared to the other constituent municipalities in the district.
Lepelle- Nkumpi has 4112 people in the sector followed by Mole mole with 4106 people employed by the sector.
Polokwane has the highest number of people employed in the sector as the economic hub.
The employment rate grew slightly from 823 in 2000 to 2012 before considerate expansion to 1663 in 2016.
Figure 10: Unemployment Trends, 2000-2106 (Source: Global Insight, ReX)

48
Blouberg experienced high unemployment rate in the sector in the early 2000, which averaged 40%. Lepelle- Nkumpi was at 36% while Polokwane and Mole mole were at 27%
rate compared to the two.
However, in 2010 there was a significant decline in unemployment level to an average of 26%.
In the municipality, the unemployment level had declined from 37% in 2000 to 22, 6% in 2016. The decline occurred at the same time with the decline in population
2.7 POVERTY LEVELS
Figure 11: Poverty levels
The report conducted by Statistics South Africa of 2017 has revealed that despite the increase in the social wage sector covering almost 17 million of the population of South
Africa poverty has worsened. Almost half of the population lives below the food poverty line.

49
The report went further to mention that there is a gap between the social wage and the amount required to address the food poverty line challenge. The graph illustrates that the
Capricorn district and its constituent’s municipalities have seen a decline in the number of people living below the food poverty line between the years 2000 and 2016. The
number has declined from 92 329 in the year 2000 to 62 913 in the tear 2010 before rising to 63 913 in the year 2016.
The Blouberg local municipality has the highest proportion of people living below the food poverty line as compared to the other constituent municipalities.
2.8 EDUCATIONAL LEVELS
Figure 12: Education levels
The graph above illustrates the number of years spent in schooling at the national, provincial. District and local level.

50
Blouberg municipality has the second lowest number of people with matric and postgraduates degrees followed
by Mole mole as compared to Polokwane and Lepelle- Nkumpi municipalities. This level represents the highest
level of skilled people in the population.
Blouberg municipality has only 881 people in this segment compared to 13 325 people in the district.
The Blouberg municipality’s figure represents only 0.07% of the district percentage.
2.9 PEOPLE WITH DISABILITY
The report from Stats S.A indicates that the majority of the people with disabilities have a challenge of concentration
and memory. 21 297 persons have such a challenge and followed by those with a challenge of communication
totaling 19 992 persons. Those with hearing challenges are totaling 21 182 people while those with the challenge
of sight are totaling 33 636 people and those with walking challenges total about 23 585 people.
The table below illustrates the categories of the various disabilities.
VARIABLE COMMUNICATION CONCENTRATION HEARING SIGHT WALKING
Some Difficulty 2120 3702 3940 7772 3440
A lot of difficulty 1926 2007 1999 5628 2998
Cannot do at all 1845 1677 1260 4449 2162
Do not know 526 559 726 3339 1729
Cannot yet be determined
6893 6942 6559 5636 6420
Unspecified 3771 3570 3858 3972 3996
Not Applicable 2840 2840 2840 2840 2840
TOTAL 19921 21297 21182 33636 23585
Figure 9: Employment in the Trade Sector, 2000-2016 (Source: Global Insight, ReX).
The trade sector, which is part of the service sector, represent the economic activities in the wholesale, retail in
the general trading environment. The employment of 38 839 which has doubled from 21000 in 2000 constitutes
79.9% of the district employment in the sector. Blouberg has the lowest activities in the sector as compared to the
other constituent municipalities in the district. Lepelle- Nkumpi has 4112 people in the sector followed by Mole
mole with 4106 people employed by the sector. Polokwane has the highest number of people employed in the
sector as the economic hub. The employment rate grew slightly from 823 in 2000 to 2012 before considerate
expansion to 1663 in 2016.

51
CHAPTER 3: ANALYSIS PHASE
3.1 INTRODUCTION
The chapter deals with the status quo analysis, challenges, opportunities as well as the possible interventions to
the challenges. The analysis covers all the six key performance areas, which are Spatial Rationale, Basic Services
Delivery, Financial Viability and Management, Local Economic Development, Good Governance and Public
Participation and Municipal Transformation and Organizational Development.
3.2 SPATIAL ANALYSIS
The map depicts the spatial structure of the Blouberg local municipality.
BACKGROUND INFORMATION
The analysis covers the following areas: (a) Settlements Patterns, Spatial challenges and opportunities, settlement
hierarchy, land use management, Growth and service points, land ownership, land claims and illegal land
invasions.
The spatial analysis section of the IDP provides the existing spatial pattern (that is nodes, networks and areas)
that has emerged in the municipal area. It looks at settlement patterns and growth points (nodes), population
concentration areas, land claims and their socio-economic implications. This analysis serves to describe the
municipal area in spatial terms and understands how space is utilized in the district. All these aspects have a
bearing on future land usage, infrastructure investment, establishment of sustainable human settlements, public
transport and local economic development.
17 a
Baltimo
Tol
Swartw
Viv
Malebo
Malebo

52
The national government and gazette approved the White Paper on Spatial Planning and Land-use Management
on 27 June 2001. The most dramatic effect of the White Paper is that it proposes the rationalization of planning
laws into one national system that will be applicable in each province, in order to achieve the national objective of
wise land-use. The White Paper also builds on the concept of the Municipal Systems Act, 2000 and required spatial
development frameworks that should guide and inform all decisions of municipalities relating to the use,
development and planning of land. Concurrently with the White Paper on spatial planning and land-use
management, a Land-use Management Bill was published in 2007 for comments. The bill was later promulgated
into a law, namely the Spatial Planning and Land Use Management Act 16 of 2013 (abbreviated SPLUMA).
Although SPLUMA is currently an approved national legislation its implementation experiences challenges in the
sense that it does not enjoy buy-in from traditional leaders across many parts of the country. In the Capricorn
District Municipality, the introduction of SPLUMA has met with serious resistance from all traditional leaders in their
individual capacity and as members of the local house of traditional leaders.
According to the Provincial SDF, 2007, the two most important development determinants for spatial development
in the Limpopo Province are economic and political processes and forces. These processes and forces, which
shaped the existing spatial pattern, will most likely become the influencing factors to guide spatial development in
the future. There are also other secondary factors, which will influence the spatial pattern in the future such as
HIV/AIDS, illegal immigration, and migration between provinces (which is mainly because of economic and
employment opportunities).
Blouberg Local Municipality was established in terms of the demarcation notice as NP351 in the Extraordinary
Gazette 100 of October 2000. The municipality is a category B as determined in terms of section 4 of the Local
Government: Municipal Structures Act No117 0f 1998.
It is a municipality with a collective executive system contemplated in section 2(a) of the Northern Province
Determination of Types of Municipalities Act (4) of 2000.The boundaries are indicated in map 13 of the demarcation
notice.
Blouberg Local municipality is a predominantly rural municipality situated to the northwestern boundary of the
Republic of South Africa, with Botswana and Zimbabwe. Roads R521 (P94/1 and P94/2) provides a north-south
link between Blouberg and Molemole, Polokwane and Makhado municipality. To the east, the municipality is served
by road R523 (D1200) that provides access to the towns such as Mogwadi, Morebeng, Duiwelskloof, Tzaneen and
Lephalale. There is another important road (N11) from Mokopane town to Botswana that passes through the
municipality that has the potential to stimulate economy.
This roads network serves as key important linkages that serve as corridors and gateways to major economic
destinations (Venetia Mine, Coal of Africa and Lephalale such as Coalmines and Medupi power station).
WARDS AND HIERACHY OF SETTLEMENTS
The municipality currently constitute of 22 wards which differ in size and population. The biggest ward in the
municipality is ward 20, which is predominantly a farming area and few villages. Ward 19 and 18 host both
Senwabarwana and Alldays respectively, which are the 2 towns with the biggest population. Senwabarwana and
Alldays have general plans and layouts for other settlements while Senwabarwana is dominated by unregistered
townships.

53
BLOUBERG MUNICIPALITY IN WARD NUMBERS CONTEXT
LAND OWNERSHIP IN THE MUNICIPALITY
The land ownership in the municipality can be categorized as the land owned by traditional leaders (communal
land), land owned by private individuals, the provincial or national government, and municipal land. According to
the Blouberg Spatial Development Framework large, vast of land is in the hands of government, private individuals
and traditional leaders. There are seven traditional leaders in the municipality with king Maleboho as one of the six
kings in the province.
King Maleboho owns the biggest chunk of the land in the municipality. Land ownership plays a critical role in the
development as it influences access

54
The map below illustrates the land ownership in the municipality.
HIERACHY OF SETTLEMENTS
Senwabarwana is the administrative and economic capital of the municipality while Alldays is the mining town of
the municipality. The Blouberg Spatial development framework has identified Senwabarwana and Alldays as the
first order settlements, while Eldorado, Indermark, Avon- Innes, Puraspan, Witten, Kromhoek, Taaibosch and
Inveraan are the second order settlements.
The third order of settlement is areas such as Letswatla, My- Darling, Buffelshoek, Devrede and Borkum.
Third and fourth order centers are well dispersed throughout the remainder of Municipality
There are only three municipal growth points, which are Senwabarwana, Alldays and Eldorado. Senwabarwana is
also the district growth point while Eldorado has been identified as the provincial rural node. The municipality has
four service points in Tolwe, Langlaagte, Inveraan and Harriswich.
The map below depicts the hierarchy of settlements as per order in the SDF.

55

56
SPATIAL CHALLENGES
The municipality’s spatial aspirations is to see Blouberg people living within close proximity to their services points
and being able to access those services with ease. It has been a long term challenge where the settlements are
characterized by dispersed, fragmented and low-density development patterns that affect the sustainable services
delivery and economic development. Poor roads conditions and transportation linkages that affect accessibility of
settlements and basic services. Making it very difficult for some residents to access schools, clinics, municipal
services, tourism developments etc.
Land availability is also a challenge to the municipality as it is land logged. There is inadequate land for both
residential and business development. The little land available is burdened by illegal demarcation of sites by both
civic organizations and traditional leaders is a problem and land invasions in the two towns of Senwabarwana and
Alldays.
Land claims constitute a major challenge in the development of the municipality as stipulated in the SDF of the
municipality. Most of the land is privately owned and under claim, making it difficult for the municipality to acquire
private land and rely on donations by other government departments which have farms under the municipality’s
jurisdiction.
Implementation or enforcement of the land use management scheme poses as a major challenge as it fails to
control any land use activities within the municipality. There is a need to put more effort on By- law enforcement to
ensure that all illegal activities are curbed to reduce land developments without municipal consent.
LAND CLAIMS INFORMATION The Regional Land Claims Commission has registered land claims totaling 224,664 hectares for the Blouberg municipal are and that constitutes 30% of the Capricorn District claims.
FARM NAME CLAIMANT
STATUS
Blink water 100 LS Molele Community Investigation
Derry 442 MS and Devon 443 MS
Sepolopote Manoko CPA Gazetted (section 42D)
Greenfields 333 MS Mabelebele Community Negotiations
Devonia 146 LS Mamasonya Tribe Investigation
Witten 91 LS and Solingen 86 LS
Serakalala Stem Drafting dismissal letter
Schoolheid 262 LS Jansen Family Investigation
Derry 442 MS and Devon 443 MS
Manoko Section 42D
Solingen 86 LS Ga-Maphukuhlwana Community
Negotiations
Witten 91 LS Dutja Valuation
Dusseldorf Mokudung Community Investigation
Innes 6 LS Van Amstel Investigation

57
The Bulbul 5 LS, Wagendrift 244 LR, Kafferftuin 241 LR, Hebe 249 LR, Amo Amass 250 LR, Leno 252 LR, Plato 253 LR and Tuskow 255 LR
Bahananwa Tribe Dismissed
Tshivhula tribe Tshivhula tribe Tshivhula tribe Tshivhula tribe Tshivhula tribe Tshivhula tribe Tshivhula tribe Tshivhula tribe
Maid stone 371 MS Wentworth 377 MS Drinkwater 307 MS Tally-Ho 331 MS Riversdale 340 MS Alldays 295 MS Purekrantz 250 MS Rietspruit 385 MS
Validation Validation Validation Validation Validation Validation Validation Validation
Ames fort , Witfontein Kibi tribe Investigation
Source, Regional Land Claims Commission (Limpopo)

58
The map above depicts the land claims in the municipality and the progress made.
MAP 6: LAND CLAIMS

59
OPPORTUNITIES FOR DEVELOPMENT EXIST IN NODES AS FOLLOWS: SPACE ECONOMY
a) SENWABARWANA GROWTH POINT
This serves as the administrative head offices of the Municipality. A number of government services are offered in
the center. Examples of such services include Home Affairs, Health and Social Development, South African Social
Security Agency (SASSA), Magistrate Offices, Helen Franz Hospital, Municipal offices; Police Station (SAPS)
traffic station, FET College; etc. The node further has three modern shopping centers, which have been fully let
from the date of opening (Bochum Plaza, Blouberg Mall). There are a large number of people who flock to
Senwabarwana in need of both public sector and private sector services. It can safely be said that this primary
node of the Municipality is one of the fastest growing small towns in the Province. The accessibility of the node
makes it the most sought after node for retail development. The node has a huge influence on the growth of the
neighboring settlements of Witten, Borkum and Solingen. A number of formations and structures are mushrooming
and operating in the two settlements and they claim authority over them. Lots of illegal demarcation of sites and
land invasion activities are taking place in the area.
Below is the map depicting Senwabarwana nodal point as an area of economic potential.

60
Source: Blouberg Spatial Development Framework.
b) ELDORADO GROWTH POINT
This node has been identified as one of the rural nodes in the Province with the highest potential for development.
The node is centrally located to settlements north of the Blouberg Mountains and has villages in wards
13,15,16,17,18,20, 5, and some in 21 as its sphere of influence. Like Senwabarwana node, the Eldorado node has
seen public infrastructure expenditure being invested in the node. Public services available at the node include
municipal satellite offices, Ratšhaatšhaa Health Centre, Maleboho Police Station, periodic justice offices,
Department of Education circuit offices (Bahananwa Circuit) taxi rank and holding area and sporting facility.
These services attract private sector investment. The Municipality should put funds aside for infrastructure
development and the development of master plans for the node. The mini shopping complex in the node has a
potential of becoming a mega shopping center in the future.
c) ALLDAYS GROWTH POINT
The node developed some years back as a small farming center to serve the surrounding farms. Its location
connects it to Polokwane via Vivo, Botswana via the Pont drift border and Zimbabwe via Musina and Beit Bridge
Border. As a stop over to key destinations, opportunities for retail services and tourism development, coupled with
a market for the arts and craft entrepreneurs, exist. The center’s proximity to the growing De Beers Venetia Mine,
the Mapungubwe World Heritage site and the Vele Colliery Mine makes the node one of the strategic centers of
development

61
Most of the big construction companies like Murray and Roberts and Basil Reed have brought with them
employment and other opportunities. Because of the mine, operating underground the small town has huge
demand of residential and business development. Gilfillan has constructed a new shopping complex. Currently the
town is being given a facelift, as solar streetlights project is complete. The auction kraal in the area attracts more
farmers to the town. The co9mmunity hall houses the taxi rank in the town. There is a big landing strip at the farm
Evergreen that can be upgraded and used as a transport modal point for visitors to areas of interest around the
center.
d) TOLWE SERVICE POINT
This node has been included in the SDF after the incorporation of portions from the Lephalale and Makhado areas
into the Blouberg municipal area. Like Alldays, the area was used as a center for providing essential services and
goods to the surrounding farming community. It boasts a municipal satellite office, mobile services clinic, a school,
road camp for the Department of Roads and Transport, police station, a post office and a hotel, NTK and Telkom
offices in area to service the neibouring farms and villages in the vicinity. Some small retail facilities are found in
the center A residential development of about 290 sites is underway at the node. The area is also a stopover for
people flocking to Botswana and surrounding hunter safari lodges in the area. Many travelers from the surrounding
settlements pass through the center when travelling back and forth the Gauteng province and as such, there is a
potential niche for small-scale retail development in the short term and large scale in the long term. The area serves
as the gateway to both Lephalale and Botswana. Feasibility studies will be undertaken to unlock the potential of
the node. The Municipality has put aside funds for infrastructure development. To date the low cost housing project
is completed for the eighty houses and fully occupied.

62
e) PURASPAN-AVON-INDERMARK-VIVO CORRIDOR
This corridor connects the Municipality to areas such as Makhado to the rest of the settlements within the municipal
area. The upgrading of the road D1468 from gravel to tar has contributed to massive mobility of transport along
this corridor. The remaining 10 kilometers of unpaved road is being upgraded and will see a huge influx of people
from all corners mainly in the northern and western part of the corridor travelling through that corridor. The corridor
will serve as a conveyor belt to link Vhembe, Capricorn and Waterberg areas. Huge spinoffs are created because
of the mass movement of people along the corridor. An informal taxi rank at Avon crossroad exist as an indication
of the growth of the area.
The map below depicts the Puraspan- Avon – Indermark-Vivo corridor as a potential area for economic growth
f) HARRISWHICH SERVICE POINT
This growth point is located in the South Western part of Blouberg and it links well with the rest of Blouberg
settlements through road D3325. Its sphere of influence includes settlements in ward 1, 4, 2, 21, 22 and those in
Polokwane and Mogalakwena municipality. Prospects of platinum along the Mokopane platinum belt can stimulate
the economy of the area and its surroundings. The full operationalization of the Blouberg Multi-Purpose Community
Centre will go a long way in triggering development at the growth point. There is a huge potential in the area as
there are mining companies who legally were granted prospecting rights. The one company (PGM) is at an advance
stage as they only await EIA approval to get the mining license. The discovery of platinum and iron ore comes with
it jobs and other opportunities for the residents of the municipality. The negotiations with the local communities and
owners of the land in the area are ongoing to unlock the bottlenecks regarding the mining beneficiation. The
prospect of economic boom in the area is looming with the mining activities.
g) LANGLAAGTE (MANKGODI) SERVICE POINT
The municipality’s current Spatial Development Framework does not identify this area as a nodal point but recent
developments and patterns of development necessitate the municipality to review its SDF and include Laanglagte
\Mankgodi as a strategic growth point for the municipal area. Its location along the D1200 as well as its connectivity
with Eldorado growth points and surrounding settlements makes it a strategic area for both public and private
sector investments. The construction of a new police station and the establishment of a multi-purpose Centre
enable communities around wards 4, 5, and 6 access services at a closer proximity and further stimulate long-term
economic growth in the area. The area is strategically located in that it is a gateway to Senwabarwana, Lephalale
and Mokopane to the Gauteng province. Currently an informal taxi rank has attracted hawkers to do business along
the D1200 road. There is a strong need for the funds to be injected in the area for developing the infrastructure
such as taxi rank and other services.
Massive public and private sector investments in the above nodes will help in realizing the National Development
Plan of having more than 70% of the population living in urban areas. This implies that urbanization will be triggered
in such nodes and ensure that such nodes and settlement adjacent to them become developed and urbanized and
thereby creating the much-needed jobs for local inhabitants
h) INVERAAN SERVICE POINT
The municipality has further identified the area as one of the areas with potential for growth. The African Ivory route
goes through the area to Beauly camp and the Blouberg Mountains. The area is also linked to the heritage site of
the Leipzig mission church. It is also a tourism attraction area in that it is home to one of the province’s six kings
namely King Maleboho and that the statue of one of the heroes of the colonial battles King Ratšhaatšhaa is at the

63
area. Road D3322 road has been upgraded and this has the potential to stimulate tourism potential of the area.
The German missionaries camped in the area for the mission work. The area has more potential if developed
properly for tourism. The Blouberg Municipality has constructed a Multi-Purpose Community Centre in the area as
a way of bringing government functions and services closer to communities within the sphere of influence of the
area. Other government services at Inveraan include health services at Blouberg Health Centre, agricultural
extension services and various primary and secondary schools in the vicinity.
LAND USE MANAGEMENT SCHEME
Currently the municipality is required to adopt a wall to wall land use scheme which will be guided by SPLUMA.
The land use scheme which is being implemented is outdated as it was developed in 2006\7 financial year in order
to amalgamate the erstwhile Alldays town-planning scheme with the rest of Blouberg. In terms of the current land
use scheme most of the areas in Blouberg have a predominant zoning of agriculture, followed by residential 1.
However, the municipality’s small towns have evolved over the past 10 years and some of the land uses have
drastically changed. The Development of the new Land Use Scheme will assist the municipality in complying with
SPLUMA and dealing with spatial challenges.
SPATIAL INTERVENTIONS
The Municipality has developed a spatial development framework, which has prioritized a hierarchy of settlements
as well as identified nodal points and population concentration points. The SDF has ensured that massive public
and private sector spending is geared towards such nodes while areas outside the nodes are just provided with a
basic level of services. Furthermore, the Municipality has purchased privately owned land in Tolwe and Eldorado
for both public and private sector investment. Continuous negotiations with potential land sellers in areas of
strategic importance are one of the strategies that the Municipality uses.
The municipality has also ensured that all growth points have precinct plans/ master plans to guide development
and improve the existing settlement patterns to inclusionary development patterns. The master plans have
implementation plans that guide the spatial planning of the municipality on a short and long term basis.
To deal with the challenge of fragmented settlement pattern and sprawl the Municipality and the Department of
Cooperative Governance, Human Settlements and Traditional Affairs currently implement Township establishment
projects following the principles of SPLUMA. Densification and inclusionary settlement planning and designs are
being implemented. The district Municipality was requested to provide GIS support to the municipality and to train
the municipal staff on GIS related matter.
3.3 ENVIRONMENTAL ANALYSIS
STATUS QUO
The municipality has a rich availability of flora and fauna, which needs to be preserved for current and future
generations. Further, the municipality has a rich cultural and historical background linked to its natural resources.
The Blouberg Mountains and the Makgabeng mountains, as well as the Mogalakwena River contain such
abundance. There are wetlands in Senwabarwana, Gemarke and Tlhonasedimong that need to be preserved and
protected.

64
PROTECTED AND CONSERVATION AREAS
Blouberg municipality comprises of certain areas which are sensitive and on which development is limited.
a) WATER BODIES
Water bodies refers to resources such as drainage channels, wetlands, rivers and other non-perennial channels
like the Glen Alpine dam, wetlands south of Kromhoek and the pounds near Taaiboschgroet. There are two major
wetlands at Gemarke and Tlhonasedimong that require be protecting and preserving. The white farming community
uses several dam walls along Mogalakwena River for agricultural purposes.
b) CONSERVATION AREA
The areas include the Wonderkop, Maleboho, Blouberg and Lang Jan nature reserves which accommodate a
variety of the fauna and flora. There are also private game farms around Alldays, Swartwater and Maastroom
areas. These are the areas located around the Buffelshoek area
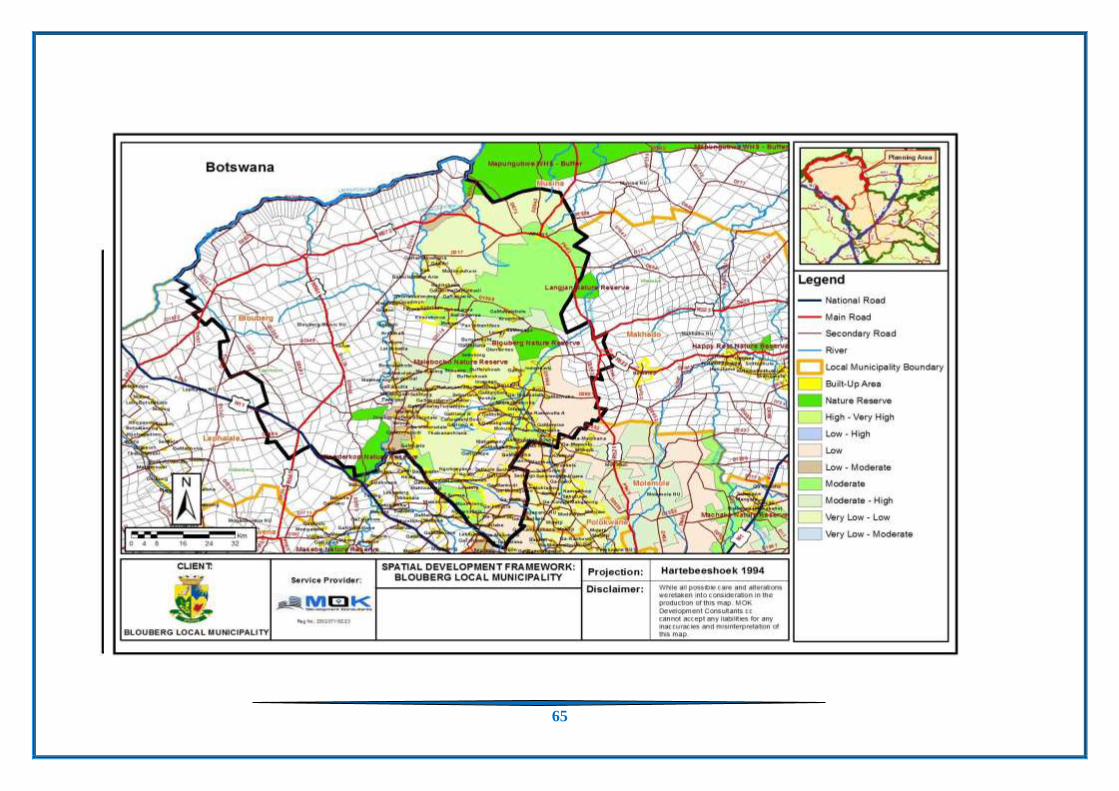
65
GRASSLANDS AND INDIGENOUS FORESTS
MAP 8: TYPES OF VEGETATION

66
AIR QUALITY STATUS
Both the Capricorn district municipality and Polokwane municipality respectively render the function.
The Capricorn district municipality had to date developed the air quality management plan for all the local
municipalities.
The municipality have since appointed the officials to implement the plan. The by-law has been
promulgated to that effect.
The plan covers the following areas:
The health impact of the key atmospheric pollutants.
The meteorological review
The ambient air quality control
The source identification and emissions quantification.
The air quality management.
The emission reduction strategies and implementation
Capacity building and training
The awareness raising.
STEEPLY SLOPPING AND ROCKY AREAS
The areas are located in the Blouberg Mountains and the isolated rock outcrops around the Makgabeng
plateau.
CULTURAL AND HISTORICAL AREAS
These refers to the areas with rich cultural and historical potential are mainly located in the Buffelshoek
in the form of traditional and cultures such as the Vha- Venda, the Khoisan and the Bushmen and the
housing and ancient archeological phenomenon of the Makgabeng plateau. The statue of King
Ratshaatsha and the historical battlefield during the war against the Boers. The Helen Franz hospital
created for the leprosy people and the early churches by the missionaries in the municipality.
THICKET, BUSHLAND AND NATURAL WOODLANDS
Large parts of the Blouberg municipality towards the central and western parts comprise of mixed
grassland suitable for cattle grazing.
SOIL TYPES AND POTENTIAL
The Environmental Potential Atlas of Southern Africa (ENPAT) classifies soil types in terms of their agricultural
potential. In the municipality, there are three types of soils and they differ with regard to their agricultural
potential.
High Potential Soils- These types of soil is suitable for agricultural development and it is found in the areas
along Blouberg Mountains and Mogalakwena River. It is good for crop farming and livestock grazing.
Moderate Potential Soils-The soils are moderate and often used for subsistence farming and are found in the
southern and eastern part of the municipality

67
Low Potential Soils-The soil is not suitable for agricultural development because they have very low clay
content and they are widespread in the north- eastern and southern parts of the municipality
CHALLENGES
However, poverty levels, as well as lack of knowledge on environmental preservation have rendered the area prone
to many environmental challenges. This is because most people rely on natural resources such as wood, soil, plant
and animal life for their survival.
Alien Plant and Animals
There is a prevalence of alien plant in most of the areas of the municipality. The most affected areas are found in
the ward 20, 05, 06, 16, and 13.
The prevalence is coupled with the increase in the alien animals in the form of donkeys. These animals destroy
the vegetation wherever they exist.
Deforestation-
The problem is prevalent to the rest of rural areas of Blouberg and has done extensive damage at areas such as
Taaibosch, Makgabeng, My-Darling.
Land degradation
Storm water flowing from the mountain ranges cause a lot of severe soil degradation in areas such as Ga-Kgatla,
Leipzig, Inveraan, Buffelshoek, Stoking, Mokwena, Burgerugh, etc. this is further compounded by illegal sand
mining which accelerate soil erosion.
Overgrazing and drought
The area is reliant on stock farming and most of the grazing areas are overstocked leading to overgrazing and the
resultant drought, which comes every two years. One can safely say given poor rainfall patterns and excessive
heat the all the Blouberg area can be classified as a dry area. Insufficient grazing camps and lack of adequate
control over livestock also cause overgrazing.
Illegal poaching of wild animals
The problem is prevalent to the three nature reserves such as Lang Jan, Maleboho and Blouberg nature reserve
and this has a devastating effect on the fauna of such ecosystems. Other areas affected by illegal poaching are
private game reserves and farms especially along the Mogalakwena River.
INTERVENTIONS
The municipality embarks on environmental campaigns to educate communities about issues of climate change,
its adaptation and mitigation programs. A program on tree planting is done with stakeholders such as Venetia mine,
DWA and private donors. Another intervention practice is the availability of a by-law to deal with sand mining.
LEDET, through its environment wing enforces arrests to people found engaging in illegal poaching

68
3.4 SOCIAL ANALYSIS
STATUS QUO: HEALTH SERVICES
There are 25 clinics, with inclusion of Rosencrantz and Ngwanallela/Ambergate clinics from former Aganang Local
Municipality, two health centres and one hospital. Of the 25 clinics 22, only three clinics operates for 24 hours.
There is high number of people with chronic diseases in the municipality and the HIV/AIDS infection rate is average.
For the reports ending March 2018 all the clinics including Helen Franz hospital, the highest prevalence is at Alldays
at 7.6% and the lowest prevalence is at Rosencrantz at 0,50 %.
The administration of the ARV drugs is now done in all the health facilities. Helen Franz is the only hospital in the
municipality while Ratšhaatšhaa and Blouberg are health centres. There is a backlog of about seven clinics and
one hospital in the municipality as there are some wards with no clinic.
There is shortage of six clinics in the municipality at Tolwe, Milbank, Senwabarwana, Puraspan, Mamoleka and
Dilaeneng village.

69

70
5.1.3 NORMS AND STANDARD
The walking distance for one person to walk to the nearest health facility should be five kilometers.
In case the radius is outside the area mobile clinic services is provided. All the clinics in the municipality provide the ARVs to the patients.
5.2.4 CHALLENGES
There is a shortage of medical doctors and assistant nurses and nurses in most clinics and Helen Franz Hospital. People still have to travel long distances looking for the ARV
drugs. The clinics operate only for five days in a week. The clinics do not operate on weekends and not 24 hours.
The ambulances response time to calls leaves much to be desired. There is shortage of ambulance vehicles.
There is also shortage of standard clinics in the farming areas of Tolwe, Baltimore, Maastroom and Swaartwater.
The roads infrastructure leading to most of the clinics are very bad.
Patients have to wait for a long time to be attended by the doctors.
There is shortage of transport in the afternoons travelling to the hospital.
People still pay lot of money for the transport to Helen Franz hospital.
HCT SERVICE UTILISATION PER FACILITY
OCTOBER- DECEMBER 2018

71
There is shortage of six clinics in the municipality at Tolwe, Milbank, Senwabarwana, Mamoleka and Dilaeneng
village.
INTERVENTIONS
The submissions for the construction of the clinics at Tolwe, Milbank, Puraspan, Senwabarwana and Mamoleka
have been submitted to the MEC’s office (Health Department).
Burgerugh and Schoongezight clinics have been upgraded by the Department of Health while a new clinic is
planned for construction at Puraspan.
The local HIV-AIDS Council has been established and will go a long way in preventing and managing the scourge
of the AIDS epidemic.
3.5 HOUSING ANALYSIS
STATUS QUO
Since 2000, there has been an allocation of over 6000 low cost housing units to communities of Blouberg with
Alldays and Senwabarwana being the biggest beneficiaries of such housing development programmes. The
municipality, together with CoGHSTA, implemented the first inclusionary housing project in Senwabarwana in
2009\10. There is still a backlog of over 2000 housing units and the provision of social housing units, as well as
community rental units in areas such as Senwabarwana and Alldays. Blouberg has a housing chapter in place.
The department allocated 480 housing units for the 2018/2019 financial year and 106 for the blocked projects. For
the 2019/2020 financial year, the municipality was only allocated 237 units which will be implemented in the
financial year 2020/2021 due to the disturbance by the lockdown caused by COVID 19 pandemic.
For a semi-rural municipality like Blouberg, the number of people living in formal houses is not a representation of
the municipal housing provision as residents built their own houses, except for RDP houses. It however, represents
development and formalization of dwellings and an improvement in the living conditions.
Within the Capricorn District Municipality, Blouberg had the highest number of formal housing in 2016 at 94, 5%.
Figure 19 reflects those comparisons. Blouberg has improved significantly, having risen from 72, 8% in 2000 to
90, and 9% in 2010 and to a further 94, and 5% in 2016.
Key service delivery statistics 2001 2011
Formal dwellings 72,5% 92,8%
Housing owned/paying off 62,1% 58,8%
Flush toilet connected to sewerage 4,3% 6,1%
Weekly refuse removal 1,5% 20,7%
Piped water inside dwelling 3,4% 7,7%
Electricity for lighting 41,6% 88%
.
CHALLENGES
Slow progress by incompetent contractors, Poor workmanship, the non-completion of low cost housing units and
the non-payment of local suppliers and labourers are some of the challenges that are associated with the provision

72
of low cost houses to Blouberg communities. Some incomplete houses date as far as the financial year 2000 and
very few of such have been completed through the rectification programme. Affected wards include wards 1, 2, 8
and 17.
Another challenge for the provision of housing units is the lack of strategically located land in areas such as Alldays,
plus delays in the finalisation of environmental authorization processes. There are still pockets of incomplete
housing units in some wards.
INTERVENTIONS
The provincial Department of Co-Operative Governance, Human Settlements and Traditional Affairs annually
provide an allocation of housing units to cater for needy qualifying citizens, they also manage the contracts and
ensure that incompetent contractors are terminated. A smaller fraction is allocated for emergency housing.
Consumer education programmes are being conducted to ensure that beneficiaries of low cost housing get value
for the houses built for them. The CDM also provides tents as temporary relief for disaster stricken families whose
houses have been demolished by disasters. The municipality, in partnership with the private sector and NGOs
such as AMAHA, does provide emergency housing units to the destitute as was done recently at Avon, Buffelshoek
and Werden.
Acquisition of strategically located land is a pre-requisite for the provision of different typologies of housing and the
Department of Agriculture, Land Reform and Rural Development and the National Housing Development Agency
have been requested to assist in this regard.
3.6 EDUCATIONAL ANALYSIS
PROVINCIAL PERSPECTIVE
The Department of Basic Education matric class of 2019 achieved a pass rate of 81.3%, up from 78.2% in 2018
on a National perspective. Limpopo Province achieved 73.2% which made it to be number 9 compared to all other
provinces. But the number should be seen in context. In 2017, a total of 1 052 080 learners were enrolled in grade
10, yet only 409 906 learners eventually passed matric last year. Furthermore 44.55% of matrics passed with a
grade high enough for admission to Bachelors degrees. Capricorn District obtained 68.9% passrate for 2019 matric.

73
STATUS QUO
There are 186 primaries and 84 secondary schools in the Blouberg area. The circuit offices are six and currently
the contractor has abandoned the district office, which is under construction in Senwabarwana, and the department
is doing nothing about the matter. There is one institution of higher learning, which is the Senwabarwana campus
of the Capricorn FET College. The detailed condition of the schools is in ward analysis. There is shortage of Maths
and Science educators in the schools within the municipality. Some learners are walking more than five kilometres
to schools while in some cases learners have been granted scholar transport and bicycles. The department is inj
the process of merging schools that have low enrolment and most of them are found in the rural areas.
There are only six makeshift pre-schools structures. There are 131 registered ECD centers of which 45 are
standard structures and there is a backlog of 83 centers.
LEARNERS ENROLMENT
EDUCATION LEVEL
EDUCATION
MALE FEMALE TOTAL
NO SCHOOLING 836 1200 2036
SOME PRIMARY 1214 1028 2241
COMPLETED PRIMARY 692 751 1443
SOME SECONDARY 7636 9077 16713
GRADE 12 3286 4793 8079
HIGHER EDUCATION 618 960 1578
NORMS AND STANDARDS
The teacher learner ratio according to the departmental norms and standards is 1: 40 for the primary schools and
1: 35 for the secondary schools.
The total walking distance to and from the school is 10 kilometers.
The learners who reside outside the determined radius are provided with scholar transport and bicycles.
Every learner has access to minimum set of textbooks.
PRESCHOOLS
WARD AVAILABLE BACKLOG
1 2 9
2 2 5
3 2 4
4 4 4
5 4 4
6 4 2
7 1 5
8 1 6

74
CHALLENGES
The major challenge is the distance travelled by the learners back and forth the schools in the area, as well as the
conditions of school infrastructure as most of the schools were constructed by communities during the apartheid
era. There is also a shortage of Maths and Science educators. There are storm-damaged schools in the
municipality and some have been fixed while others are not.
There is shortage of classrooms, learning material and furniture in some schools. There is also a challenge of
overcrowding in some schools. There are few registered ECD centers in the municipality and lots of them are
operating in the substandard structures. The funding for the ECD centers is a challenge as the communities are
responsible for the funding and remuneration of careers.
Some areas require the building of schools. The old dilapidated structures like Matsuokwane, Mphela secondary,
Rasekhuta Sekhung combined, Boithuto combined, and Kgalushi and Makangwane schools require new
structures. Some schools have been blown by the storms.
The scholar transport remains a challenge for some learners resulting in them walking for long distances to schools.
There is a challenge of high drop out of school in some areas. There is also higher failure rate in some schools.
There is a challenge of teenage pregnancy in schools. The migration of learners from the rural schools has become
a threat in that the schools experience low enrolment. Such schools are merged and it causes them to walk long
distances.
High poverty levels contributes to the high number of no fees schools. Disruption of the schools nutrition deliveries
occurs frequently. Safety has become the new threat at schools as more learners and educators are exposed to
danger. Schools vandalism and torching has also become a norm. Community protests affect the schooling as
they close down. Unreliable and condition of scholar transport which is disrupted frequently.
9 1 5
10 1 1
11 0 6
12 0 2
13 3 4
14 2 5
15 2 0
16 2 3
17 3 6
18 2 0
19 3 0
20 5 4
21 3 5
22 2 3
TOTAL 43
75

75
INTERVENTIONS
There is provision of scholar transport and provision of bicycles to transport learners who travel long distances to
schools. Further, the provincial government provides school nutrition to all schools. The Department of Education
construct schools annually through the backlog still remains. New schools must be prioritized for Taaibosch primary
school while renovation of schools should prioritize Seiphi, Mphela, Sekhung, Rasekhuta, Makangwane,
Matsuokwane Mochemi, Boithuto and Mokumuru. The municipality will engage the Department of Education to
affect the desired intervention.
The following are interventions for bettering provision of education:
Building of additional classrooms and new schools
Training of educators in content and methodology.
Conducting of winter enrichment classes
Registration of the unregistered ECDs
Provision of scholar transport and nutrition program me
Provision of mobile classrooms
3.7 SAFETY AND SECURITY ANALYSIS
STATUS QUO
The municipality, with its 123 settlements, has five police stations within the boundaries of Blouberg and three
stations outside the boundaries but serving settlements of Blouberg. The ones within Blouberg are in
Senwabarwana, Alldays, Tolwe, Plat Jan, Eldorado and Saamboubrug while those outside the Blouberg borders
but serving Blouberg are found in Mara, Mogwadi and Gilead (Matlala). The most prevalent crimes occurring in
Blouberg are housebreaking, common assault, and theft of diesel water engines. There is a backlog of four police
stations in the municipality as people still travel long distances to access services from the stations.
CHALLENGES
The main challenge with regard to the provision of the service is the poor road conditions, which make it difficult
for most residents to access the service. The functionality of Community Policing Forums is also a challenge.
Prevalent crimes include theft and assault. The inefficiency of the police officers to deal with cases reported leaves
much to be desired. The turnaround time in attending to cases reported also leaves much to be desired. Some
police stations Maleboho always complain about staffing and lack of resources.
INTERVENTIONS
Currently the National Department of Safety and Security has approved the construction of a new police station at
Laanglagte and to upgrade the Tolwe police station. New park homes for victims of crime are planned for at
Eldorado (Maleboho Police Station). Local police stations are conducting regular crime awareness campaigns.
There is a need for the establishment of a satellite police station at
Kromhoek and the municipality will approach the Department of Safety, Security and Liaison to effect such. The
development of the municipal Community Safety Strategy will help identify other areas that need crime prevention
interventions. Plans of a mobile police station in Kromhoek are under way and it will assist in the crime prevention
in the area.
Another form of intervention is the provision of high mast lights to increase visibility at night and currently areas
such as Senwabarwana, Letswatla, Inveraan and Taaibosch are going to have implementation of such projects.
76
3.8 PUBLIC AMENITIES
Social Services infrastructure
The table below provides a summary of facilities that provide social services:
FACILITY NUMBER STRATEGIC
PRIORITY
COMPETENCY
Early Childcare center 45
Education/skills
development
Municipality (infrastructure provision)
Primary schools 186
Department of Basic Education
Secondary schools 84
Department of Basic Education
TVET college 1
Department of Higher Education
Clinics 25
Health Department of Health
Health centers 2
Hospital 1
Police stations 5 +3 outside but
serving Blouberg
communities
Safety and
security
Department of safety and security
Sports Facilities 4 Recreation Department of Sports ,Arts and
Culture
Libraries 3 Educational/
Skills and
Learning
Department of Sports, Arts and
Culture
POST OFFICE AND TELECOMMUNICATION
Blouberg municipality is very rural with dispersed and scattered settlements, which makes it difficult to access.
There are numerous post office structures across the municipality with Tolwe, Ga- Kibi, Taaibosch, Kromhoek,
Maleboho Swartwater, Maastroom, and Bochum, Vivo, and Alldays to mention but few. Mail collection points are
dispersed across the municipal villages. Few people make use of the post offices, as they prefer banking
institutions that are accessible any time.
The post office is used mostly by stokvels and societies to invest the monies. Most pensioners also use the post
offices as pay points and mail and parcels are delivered through the post office.
Telecommunication and information technology infrastructure comprises of electronics, business process
outsourcing, internet services and websites, while telecommunication assets include cellular phones, fixed

77
telephones and computer services. These are the main communication tools used to perform and convey
information in a modern world. The most popular network providers in the municipality are Vodacom, MTN, Cell C
and Telkom.
HOUSEHOLD ACCESS TO CELL PHONE, COMPUTER AND TELEVISION PER MUNICIPALITY.
MUNICIPALITY CELL PHONE COMPUTER TELEVISION
YES NO YES NO YES NO
Blouberg 82 18 6 94 67 33
Molemole 87 8 10 90 78 22
Polokwane 92 13 21 79 70 30
Lepelle Nkumpi 86 14 11 89 74 26
The other important aspects is the broadband which for transmission of higher volumes of communications. It
refers to the telecommunication signal with greater band than the standard capacity.
STATUS QUO
All settlements have access to cemeteries though such are not formalized. There are three standard sports facility
at Eldorado, Alldays and Sekiding (Mampote). All other areas have informal sports grounds. The Blouberg area
has nine community halls. There is one Thusong service centre at Eldorado and it hosts the municipal offices,
Department of Education, Department of Agriculture, Department of Labour, SAPS and Department of Health
THE TABLE BELOW REFLECTS AVAILABILITY AND BACKLOG OF STANDARD SPORTS FACILITIES
WITHIN WARDS
WARD AVAILABLE BACKLOG
1 0 1
2 0 1
3 1 0
4 0 1
5 0 1
6 0 1
7 0 1
8 0 1
9 0 1

78
CHALLENGES
The challenge is that sports and recreation facilities available do not have enough facilities such as high mast lights
for night games; athletic rubber tracks etc. Another challenge with the amenities is on the available halls, which
are not used as multi-purpose community centres but are only used scarcely as normal halls.
INTERVENTIONS
The municipality, together with SAFA and private partners, construct and upgrades sports and recreational facilities
annually. SAFA has to construct an artificial soccer facility as part of its 2010 legacy projects. With regard to
community halls, the municipality has moved way from normal standard halls and build multi-purpose centres.
There are plans to construct the state of the art sports facility in Senwabarwana to move along with the growth of
the town. The municipal plant and equipment shall always grade sports ground when they maintain and grade
roads.
3.9 BASIC SERVICES DELIVERY AND INFRASTRUCTURE ANALYSIS
This analysis will focus on the provision of basic and social infrastructure needs for Blouberg communities. More
emphasis will be on the provision of services such as water, sanitation, energy, and roads.
ENERGY AND ELECTRICITY SUPPLY
In terms of electricity connection, the whole Capricorn District Municipality has seen an increase in electricity
connection from an average 50% of total number of dwellings to 83% in 2010 and 92% by 2016. This represents
a vast improvement. Blouberg Municipality saw an exponential increase in the connection from a lowly 31% in
2000 to 81% in 2010 and a further 94, 4% in 2016.
10 0 1
11 0 1
12 0 1
13 0 1
14 1. 0
15 0 1
16 1 0
17 0 1
18 1. 0
19 1 0
20 0 1
21 0 1
22 0 1
TOTAL 3 18
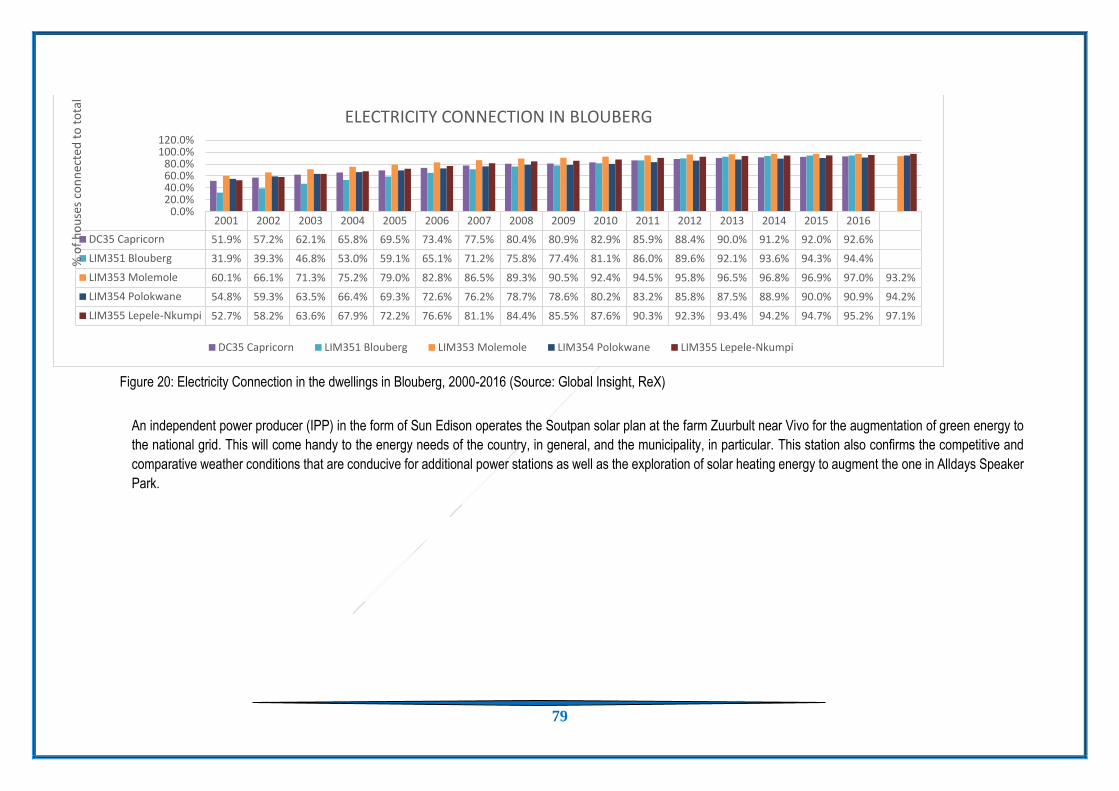
79
Figure 20: Electricity Connection in the dwellings in Blouberg, 2000-2016 (Source: Global Insight, ReX)
An independent power producer (IPP) in the form of Sun Edison operates the Soutpan solar plan at the farm Zuurbult near Vivo for the augmentation of green energy to
the national grid. This will come handy to the energy needs of the country, in general, and the municipality, in particular. This station also confirms the competitive and
comparative weather conditions that are conducive for additional power stations as well as the exploration of solar heating energy to augment the one in Alldays Speaker
Park.
2001 2002 2003 2004 2005 2006 2007 2008 2009 2010 2011 2012 2013 2014 2015 2016
DC35 Capricorn 51.9% 57.2% 62.1% 65.8% 69.5% 73.4% 77.5% 80.4% 80.9% 82.9% 85.9% 88.4% 90.0% 91.2% 92.0% 92.6%
LIM351 Blouberg 31.9% 39.3% 46.8% 53.0% 59.1% 65.1% 71.2% 75.8% 77.4% 81.1% 86.0% 89.6% 92.1% 93.6% 94.3% 94.4%
LIM353 Molemole 60.1% 66.1% 71.3% 75.2% 79.0% 82.8% 86.5% 89.3% 90.5% 92.4% 94.5% 95.8% 96.5% 96.8% 96.9% 97.0% 93.2%
LIM354 Polokwane 54.8% 59.3% 63.5% 66.4% 69.3% 72.6% 76.2% 78.7% 78.6% 80.2% 83.2% 85.8% 87.5% 88.9% 90.0% 90.9% 94.2%
LIM355 Lepele-Nkumpi 52.7% 58.2% 63.6% 67.9% 72.2% 76.6% 81.1% 84.4% 85.5% 87.6% 90.3% 92.3% 93.4% 94.2% 94.7% 95.2% 97.1%
0.0%20.0%40.0%60.0%80.0%
100.0%120.0%
% o
f h
ou
ses
con
nec
ted
to
to
tal
ELECTRICITY CONNECTION IN BLOUBERG
DC35 Capricorn LIM351 Blouberg LIM353 Molemole LIM354 Polokwane LIM355 Lepele-Nkumpi

80
This will boost the local economy and create more jobs in that sector as locals can be skilled to operate, maintain
and manage such projects Electricity is part of life and economic development. This relates to improved living
conditions. Electricity is a basic need for communities. The municipality has a license to electrify the area that
does not fall under Eskom supply area. The other sources of energy supply are solar energy, paraffin and
firewood. The communities in the municipality use firewood and paraffin for cooking, lighting and other domestic
chores. The main objective of Blouberg Local Municipality was to provide electricity to all households by 2014.
The Municipality is a licensed electricity distributor and by 2013 all settlements were electrified.
The Municipality has thus reached the universal access by providing electricity to all established settlements,
save for the extensions. The Hananwa settlement at the top of Blouberg Mountains has also been granted solar
energy. Currently the municipality is busy with the electrification of extensions and about 500 houses have been
provided with solar geysers in Alldays Speaker Park. The mega solar energy plant has been construction at
Zuurbult farm and it supplies solar energy to the nearby power station. The project has diversified energy
sources within the Municipality and this will assist in alleviating power outages in the municipal area and the
neighboring municipality of Molemole. The municipality has implemented the first solar street lights project in
the province in Alldays in partnership with Venetia mine.
ENERGY EFFICIENCY AND DEMAND SIDE MANAGEMENT (EEDSM) PROGRAMME
The municipality was part of the energy efficiency and demand side management programme from
Department of Mineral Resource and Energy (DME). The programme seeks to make sure that municipal
owned infrastructure is as energy efficient as possible. We have been fortunate enough to be part of the
programme for the 18/19FY, 19/20FY receiving R4.86 mil and R2 mil respectively. In the 18/19 FY we
retrofitted street lights, high masts, stadium lights and office lights to more efficient LED lighting technology.
In the 19/20 FY funds will be used to install smart meters on 15 selected sites and a grid tie rooftop PV plant
at Senwabarwana head office .The projects implemented resulted in energy savings. For the 18/19FY these
amounted to 780 MWh and the 19/20FY savings are still to be finalized. We are proud to have done our part
in reducing energy usage and somehow decreasing the strain on eskom. The small savings add up into (Mega
Watts ) MW and the MW into (Giga Watts) GW.
STATUS QUO
SOURCES OF ENERGY SUPPLY IN THE MUNICIPALITY
There are different sources of energy used in the municipality. The most popular energy source is the electricity
connection, which is supplied by both Eskom and the municipality. Paraffin and wood are also used as the
other energy sources mainly for cooking and lighting. The other energy sources used are gas and candle
which are also used for both cooking and lighting. The use of wood to for cooking and keeping the families
warm is the most popular among the black Africans, which has its culture rooted in the African communities.
Electricity and gas are the most costly energy sources used while wood is the affordable energy source.
ELECTRICITY SUPPLY TO HOUSEHOLDS
All the settlements in the municipality are supplied with electricity while Hananwa has been supplied with solar
energy as it is at the top of the Blouberg Mountains. Currently the municipality is busy electrifying the
extensions. The municipality has started with the installation of high mast lights in areas of Senwabarwana,
Letswatla, Taaibosch, and Inveraan. In Alldays the solar powered streetlights project is complete and functions
efficiently. The solar streetlights project was completed in the Alldays town. The municipality had to date
connected about 16 458 units.

81
The project is one of its kind in the province and it serves as a flagship project in the municipality.
MUNICIPALITY POPULATION % of
Households
% of Households with
access to Electricity
% of households with no
Electricity
Municipality Population
2016/2017
2017/2018 2018/2019 2016/2017 2017/2018 2018/19
Blouberg 162 625 97% 96% 97 % 3%
4% 3 %
The table above is the combination of Eskom and Municipality Villages.
ELECTRICITY SUPPLY TO SCHOOLS
The report from the department of education indicates that all the schools in the municipality are supplied with
electricity as almost all the schools are the voting stations.
PROVISION OF FREE BASIC ELECTRICITY
The municipality as well as ESKOM provides free basic electricity of 50 KWA to its indigent residents per month.
Such indigents are captured in the municipal indigent register, which is updated from time to time. Field cashiers
have been appointed in all the 22 wards to register and update the indigent register as well as a register of all
municipal customers. The municipality has not succeeded in the provision of free basic electricity to all our
beneficiaries. There is a challenge with the indigent register.
CHALLENGES
The Municipality currently has a backlog of 3 %, which translates to 1334 households, in ESKOM supply extension
areas. The main challenge is lack of funding and delays in the approval of designs, and in some instances also
energizing due to misunderstandings between the Municipality and ESKOM. There is also a challenge of
distribution loss in that the funds used in the bulk purchase of electricity are so huge with low return. The challenge
of illegal connection exists. There is also shortage of personnel to do meter auditing to determine exactly the cause
of distribution loss.
INTERVENTIONS
The municipality has engaged ESKOM and the Department of Energy to transfer electricity infrastructure in the
town of Senwabarwana to the municipality so that Council can take full control of such infrastructure to
accommodate the growth of the town and also assist in aligning such with the municipal billing system. The
Municipality has further engaged ESKOM, CDM and the Department of Energy to assist in the development of the
energy master plan. One other intervention has been to engage ESKOM with a priority list of settlements, which
should be provided with connections because of the growth of such settlements, and in the 2016/2017, financial
year settlements such as Sesalong, Bognafarm, Schoongezight, Grootdraai, Papegaai and Towerfontein have
been connected. In the 2014\15, FY there was a delay in the implementation of ESKOM projects but at these stage
contractors have been appointed. The Blouberg Municipality has recently electrified and energized settlements

82
such as Silvermyn, Motadi, Gideon, Diepsloot, and Mongalo. The municipality has enlisted the services of field
cashiers to conduct meter-auditing exercise to assist in the curbing of illegal connections and distribution loss.
The municipality has engaged ESKOM and the Department of Energy to transfer electricity infrastructure in the
town of Senwabarwana to the municipality so that Council can take full control of such infrastructure to
accommodate the growth of the town and also assist in aligning such with the municipal billing system. The
Municipality has further engaged ESKOM, CDM and the Department of Energy to assist in the development of the
energy master plan. One other intervention has been to engage ESKOM with a priority list of settlements, which
should be provided with connections because of the growth of such settlements, and in the 2019/2020, financial
year Eskom are busy electrifying settlements such as My Darling ext.2, Indermark ext, De Vrede ext, Springfield
ext, Letswatla ext, Mmakwara ext, Lethaleng ext, Burgerecht ext, Kwarung ext, Gemarke ext, Pickum A & B,
Longden ext and Pinkie Sebotse ext.
ROADS AND STORM WATER
The Municipality takes the responsibility of ensuring that all municipal roads are in a good condition for use by
vehicles and other land modes of transport. The municipality also takes care of storm water control, which poses
a serious threat to the access roads and internal streets. Annually the municipality budget for the upgrading of
internal streets and storm water projects.
The Municipality takes the responsibility of ensuring that all municipal roads are in a good condition for use by
vehicles and other land modes of transport. The municipality also takes care of storm water control, which poses
a serious threat to the access roads and internal streets. Annually the municipality is unable to fund for the
upgrading of internal streets and storm water projects due to less collection of revenue.
CLASSIFICATION OF MUNICIPAL MAJOR ROADS
The roads in the municipality are classified into four categories, which are:
National roads- These refers to the roads that belong to the national government under SANRAL.
Provincial roads- These refers to the roads that belong to the provincial government under RAL
District roads- These refer to the roads that belong to the district municipality and are under the care of the
district.
Municipal roads- These refer to the access roads and internal streets that belong to the local municipality and
are under the care of the municipality
PROVINCIAL ROAD NETWORK PER DISTRICT
DISTRICT KILOMETRES PAVED GRAVEL KILOMETRES TOTAL KILOMETRES
CAPRICORN 1223 3283 4506
MOPANI 1165 1704 2869
SEKHUKHUNE 1173 1481 2654
VHEMBE 1323
2367 3690
WATERBERG 1295 4983 6278

83
Road Number Route Category
N11 Mokopane via Blouberg and Lephalale to Botswana National
R 521 Vivo to Alldays Provincial
R 572 Alldays to Maastroom Provincial
Road Number Route Category
R 561 N11 to Maastroom Provincial
D 3325 Ga-Moleele to Harris which via Gemarke Provincial
D 3270 Springfield to Vergelegen Provincial
D 3278 Buffelshoek Clinic via Bahananwa Tribal Office to Inveraan Provincial
D 3327 Masha lane to Bull-Bull Provincial
D 3278 Dalmyne to Bull-Bull Provincial
D1589, D3297, D3292 DeVrede via Ratshatsha to Kibi Provincial
D1200, D688, D2657 Dendron via Makgato to N1 (Botlokwa) Provincial
D 3330, D3474, D3440 Ga Moleele, GaDikgale, GaLetswalo, Raweshi, Pollen, Mons,
Swartz to Driekoppies
Provincial
D3275-D3287 Windhoek to Eldorado Provincial
D3322 Blouberg health center via Bahananwa Tribal Office to
Buffelshoek
Provincial
The Limpopo Department of Roads and Transport takes responsibility of the provincial road network and some of
the District Roads (although not clearly defined) within the Municipality’s area of jurisdiction. The total length for
the Provincial road network is approximately 960km, from which 272km is surfaced and 688km is gravel, leaving
a backlog of 71.7%.
The condition of most of the Provincial gravel roads is not so good, but the Limpopo Department of Roads and
Transport performs maintenance on these roads. They re-gravel and construct culverts for some of these roads.
They are also currently running an EPWP program me whereby over 600 people have been employed from within
the Municipality’s communities, specifically for the cleaning of road reserves alongside the main roads, and other
routine maintenance of the surfaced roads.
Blouberg Municipality takes responsibility for the municipal roads network. The total length of Blouberg road
network is approximately 640km, from which 215km is access roads and 425km is internal Streets. The conditions
of municipal roads and storm water facilities are very poor. Most of the roads are not accessible during rainy days,
as they become water logged. Roads in settlements next to mountains have been damaged by uncontrolled surface
run-off water from the mountains with villages such as Mokwena, Burgerecht, Kgatla, Leipzig and Inveraan been

84
badly affected. Ward one settlement also encounter serious challenges of roads and storm water. The Municipality
has only managed to surface 56.1 kilometers of the internal streets from the Municipal Infrastructure Grant that is
allocated to the Municipality annually (also utilized for other Infrastructure Projects). There is still a total backlog of
approximately 584 km, which also includes access roads, translating to 91.25% of backlog. The Municipality’s
Technical Services Department has a Roads and Storm Water Unit that deals mainly with the maintenance of
municipal roads. The Unit is divided into two (2) clusters that operate from Eldorado and Senwabarwana main
office. Each of these clusters has a group of villages that it is responsible for, and with the minimal resources that
the Municipality has, it has also distributed them amongst these clusters and in some instances, the resources are
shared. A list of priority Roads, also serving as a Roads maintenance plan has been compiled for each of the
clusters.
CHALLENGES
The main challenge is the huge percentage of backlog for municipal roads. The Municipality depends fully on the
Municipal Infrastructure Grant (MIG) for the implementation of roads projects and the grant is never sufficient to
make an impact on backlogs as it is also utilized on other infrastructure projects other than roads.
Due to lack of funds, currently there is no Master Plan that is in place, causing poor planning for municipal roads
and storm water drainage. Most of the access roads and internal streets are not paved or tarred as the municipality
lacks enough funds to implement the project.
Most of the Municipality’s gravel roads are in a bad condition and currently there are insufficient resources. Some
of municipal resources are evenly shared amongst the two (2) roads maintenance clusters. There is a shortage of
skilled personnel in the municipal roads maintenance unit. The provincial Roads and Transport Department which
is also responsible for the operation, maintenance and management of provincial networks of roads has huge
capacity constraints thereby causing the municipality with its limited resources to take over the operation and
maintenance of most provincial roads.
INTERVENTIONS
A funding model for the MIG must be reviewed in order to ensure that allocations are distributed in a manner that
will create an impact to municipal backlogs over a certain period. Roads Master Plans must be developed in order
to ensure proper planning for Roads and Storm water drainage, also focusing on access roads. There must be an
increase in the number of resources and recruitment of skilled personnel for municipal roads maintenance clusters.
The Department of Public Works and Roads must also allocate sufficient funds to create an impact on the backlog
for the provincial roads. The re-gravelling and maintenance of some internal streets service was outsourced to
external service providers as a pilot.
To date areas such as Mokhurumela, which had large sand; streets are accessible because of the project. The
other areas where there was bad access streets and roads such as Inveraan are accessible. The municipality has
also purchased the low bed truck to transport its plant and machinery to improve on the turnaround time to respond
to challenges.

85
Blouberg Municipality Upgrading:Gravel To Tar
Route Particulars Growth Areas
Priority Road No. Roads
Particulars
Approxim
ate
Length
(Km)
Local
Municip
ality
Growth
Point
Level Of
Growth
Point
Other
Development
Strategy
Supported
1 D1589,
D3297,
D3292
De Vrede via
Raditshaba
to Eldorado
25 Blouber
g
Eldorado Local Farming, retail
development
and
administrative
2 D1200,
D688,
D2657
Dendron via
Makgato to N1
(Botlokwa)
35 Molemo
le,
Blouber
g
Dendron
(Mogwadi
)
District SDR, Agriculture,
Tourism
4 D 3330,
D3474,
D3440
Ga Moleele,
GaDikgale,
GaLetswalo,
Raweshi,
Pollen, Mons,
Swartz to
Driekoppies
30 Blouber
g
Senwabar
wana
Local Major Link
5 D3275-
D3287
Windhoek to
Eldorado
38 Blouber
g
Eldorado Local Farming,
administrative
and major access
6 D3322 Blouberg
health centre
via Bahananwa
Tribal Office to
Buffelshoek
12 Blouber
g
Senwabar
wana
Local Major Access
PUBLIC TRANSPORT
There is one mode of public transport in the municipal area viz road transport. The dominant public transport mode
is the minibus taxi while another form of public transport, which was Great North and MMabi bus services,
suspended their operations. The other transport mode is donkey carts and bicycle mostly used by the communities.
The challenge with the municipal public transport is that it is only available between 6H00 in the morning and
18H00 leaving most commuters stranded outside these stipulated times. The movements of these modes of public

86
transport is towards all the nodal points of Blouberg, viz, Alldays, Senwabarwana, Tolwe and Eldorado while
outside Blouberg the major destinations are Musina, Louis Trichardt, Lephalale, Steilloop and Polokwane.
STATUS OF TAXI RANK FACILITIES
LOCATION STATUS DESTINATIONS
Senwabarwana The rank is formal with the following facilities: shelter, loading bays, ablution blocks and hawkers’ facilities
The rank covers the rest of Blouberg and destinations such as Polokwane, Johannesburg,
Eldorado The rank is formal with the following facilities: shelter, loading bays, ablution blocks
The rank covers the rest of Blouberg and areas such as Senwabarwana and it connects to Polokwane via Kromhoek taxi rank
Kromhoek The rank is formal with the following facilities: shelter, loading bays, ablution blocks and hawkers’ facilities
The rank covers the rest of Blouberg and destinations such as Polokwane, Johannesburg and Louis Trichardt
Alldays The rank is formal with the following facilities: shelter, loading bays, ablution blocks
The rank covers the rest of Blouberg and destinations such as Musina and Louis Trichardt
Windhoek The rank is informal It covers Senwabarwana, Steilloop and Lephalale municipality
Avon The rank is informal It covers Senwabarwana, Vivo, Indermark
Buffelshoek The rank is informal It covers Senwabarwana
Vivo The rank is informal It covers Senwabarwana, Alldays, Mogwadi and Louis Trichardt
Letswatla The rank is informal It covers Senwabarwana
Mamehlabe The rank is informal It covers surrounding villages and links with Tibane taxi rank to Polokwane
PUBLIC TRANSPORT CHALLENGES
The challenge with the municipal public transport is that it is only available between 06H00 in the morning and
20H00 leaving most commuters stranded outside these stipulated times. The other main challenge is the bad state
of roads that increases the operation and maintenance costs of public transport operators. Lack of formal taxi ranks
with all related amenities in some strategic areas such as Avon, Vivo, Buffelshoek, Windhoek and Harris wish
remains a challenge. Disputes over operating routes occasionally occur resulting in conflicts among taxi
associations.
PUBLIC TRANSPORT INTERVENTIONS
The roads and transport forum has been established and all taxi associations operating within Blouberg are
members of the forum. Recent conflicts between Letswatla and Bochum Taxi associations have been resolved

87
through the intervention of the municipality, SAPS and the District Taxi Council. The matter of accessibility of public
transport outside the 06H00 and 20H00 times has been referred to the operators for rectification. The state of poor
road conditions was highlighted to the MEC for Roads and Transport for intervention. The municipality and the
CDM in collaboration with public transport operators will develop a priority list for formalization of taxi ranks. Taxi
and bus shelters have been constructed along major routes such as D1200 (Senwabarwana-Windhoek road),
Wegdraai to Eldorado road, Letswatla to Windhoek road and D1598 (Kibi to Schiermoonikoog road)
TRAFFIC MANAGEMENT
The main offices for traffic management are in Senwabarwana. The municipality has rolled out the traffic
management services to Alldays and Eldorado, as part of the decentralization of services. The learners’ licenses
classes are conducted from both Alldays and Eldorado offices. The Alldays traffic office covers Vivo in Ward 12,
ward 17 and 18. The Eldorado office covers both areas of ward 15, 16 and 20. The Alldays traffic office controls
traffic to and from Zimbabwe, Musina, Venetia Mine, Botswana, Swaartwater and surrounding villages. The law
enforcement service was extended to Tolwe satellite office and we hope to roll out licensing service to the same
office in future. More concentration for the Tolwe office is on the N11 road that links the country with Botswana
STATUS OF TRAFFIC CENTRES
LOCATION STATUS
SERVICE
Senwabarwana: Main offices The center provides all services and serves as the main office of the municipality.
Fully operational
Eldorado: Satellite office The traffic service is amongst municipal services decentralized to the Eldorado satellite office.
Semi-operational
Alldays: Satellite office The traffic service is amongst municipal services decentralized to the Alldays satellite office.
Semi –operational
Tolwe Satellite Office The office provides only law enforcement services
Semi- operational
TRAFFIC SERVICES CHALLENGES
The main challenge remains the road conditions within the municipal area, which pose a threat to the conditions
of the vehicles. Other nodal points such as Tolwe, Harris which and Laanglagte are not covered by traffic offices,
and as a result, less service is provided to those nodal points. Another factor is the traffic congestion within
Senwabarwana town, which results in traffic delays and possible accidents. Other roads have turned into killer
roads and accidents hotspots. Road fatalities are in the main caused by speeding, vehicles that not roadworthy,
pedestrians and stray animals.
Most accidents occur on the D1200 between Senwabarwana and Langlaagte, road D1468 between
Senwabarwana and Vivo and roads D1589, 3297 and 3292 from Schiermonikoog to Eldorado and Kibi.

88
TRAFFIC SERVICES INTERVENTIONS
The challenge related to state of roads could be solved by the development of a road master plan by the
Infrastructure Development and Engineering services department in line with the Integrated Transport Plan, which
includes re-gravelling, de-bushing and tarring. Traffic congestion could be reduced by establishing a holding area
for taxis after off-loading commuters.
REGISTRATION AND LICENSING OF VEHICLES
The main offices for the registration and licensing of vehicles are in Senwabarwana. The municipality has rolled
the service out to Alldays and Eldorado, as part of the decentralization of services plan. The Alldays driver-learner
testing center (DLTC) covers Vivo in Ward 12, ward 17 and 18. The Eldorado office covers both areas of ward 15,
16 and 20.
STATUS OF DRIVER-LEARNER TESTING CENTRES
LOCATION STATUS SERVICE
Senwabarwana: main offices
The center provides all services including driver testing center and testing of vehicles, and serves as the main office of the municipality.
Fully operational
Eldorado: satellite office The center is amongst municipal services decentralized to the Eldorado satellite office, which provides for learners licensed tests, registration of vehicles and issuing of car discs.
Service to be operational without vehicle testing and driver testing.
Alldays: satellite office The center is amongst municipal services decentralized to the Eldorado Satellite office. which provides for learners license tests, registration of vehicles and issuing of car discs?
Service to be operational without vehicle testing and driver testing.
LICENSING AND VEHICLE REGISTRATION SERVICE CHALLENGES
The main challenge remains the road conditions within the municipal area, which will make it difficult to open a
driver-testing center at Eldorado (no tar road). Another challenge is the informal operations of the driving schools
within the municipality and the high charges for testing of the students. Other nodal points such as Tolwe, Harris
that, Inveraan and Laanglagte are not covered by services, and as a result, law enforcement service is provided
to those nodal points. Another factor is the traffic congestion within Senwabarwana town, which results in traffic
delays and possible accidents. At times, it makes it difficult to tests the learners on the road.
LICENSING AND VEHICLE REGISTRATION SERVICE INTERVENTIONS
The problem related to the informal driving schools could be resolved by establishing a driving schools’ forum and
training of the schools for efficient management of their schools. The challenge related to state of roads and road
markings could be solved by the development of a road master plan by the Infrastructure Development and
Engineering services department.

89
The municipality has constructed the new structure for licensing and vehicle registration to solve the challenge of
space.
WASTE MANAGEMENT
STATUS QUO
The Municipality has developed and adopted an Integrated Waste Management Plan (IWMP) in 2008. The plan
was revised in the 2013\14 financial year. The plan serves as a roadmap for the management of solid waste for
the entire Municipality with R293 towns and nodal points, and some rural villages, used as starting points since the
capacity available cannot cover the entire municipal wide area. Currently the function is rendered in fourteen
settlements on a weekly basis while the towns of Alldays and Senwabarwana receive the service on a daily basis.
Currently there are two landfill sites in Alldays and Senwabarwana. A waste transfer station at Taaibosch is
complete. A waste management team is in place and two waste removal trucks, and a tractor was purchased.
THE TABLE BELOW REFLECTS WARD WASTE REMOVAL SERVICE ROLL OUT AND BACKLOGS
WARD AVAILABLE NO. OF HOUSEHOLDS BACKLOG ITO OF VILLAGES WITHIN THE WARD
1 0 11
2 0 7
3 0 6
4 0 9
5 0 7
6 0 5
7 0 6
8 1 DILAENENG 1021 6
9 0 6
10 1 AVON UP TO DIKGOMO 2979 0
11 0 6
12 2. INDERMARK UP TO DIKGOMONG
2136 0
13 2 (BURGERUGHT AND MOTLANA)
554 5
14 0 7
15 2 (KROMHOEK AND DEVREDE)
3650 0
16 0 5
17 2 (GROOTPAN AND LONGDEN)
1200 6
18 2 (TAAIBOSCH AND ALLDAYS)
2967
0
19 SENWABARWANA TOWN, DESMOND PARK, EXTENSION 5, WITTEN.
4037 0
20 0 0
8
21 0 0
10

90
THE TABLE BELOW REFLECTS WARD WASTE REMOVAL SERVICE ROLL OUT IN THE MUNICIPALITY
CHALLENGES
Capacity constraints: this involves lack of resources (financial and human) to roll out the service to the entire
municipal area. Available plant and personnel are not enough to render the service for all areas. For the past two
financial years, the Municipality could not purchase plant and refuse bins due to budgetary constraints.
The Senwabarwana landfill site is completed and operational and waste is being dumped in the landfill site.
Lack of education on the part of members of the community on waste matters does not help the situation. Lot of
littering occurs in the town of Senwabarwana around the CBD mainly because much business activities are taking
place there. The Department of Environmental Affairs has trained officials to enforce both by-laws and
Environmental Acts around the municipal jurisdictional area, which will ease the situation of non-compliance by the
regulated community.
INTERVENTIONS
Blouberg Municipality renders the refuse removal service in 14 settlements with the, households serviced standing
at 18 544 (45%). The backlog is 22 872 (55%). Challenges are funding for roll out of the refuse service to all
settlements.
The Environmental Management Plan (EMP) is partially implemented; the Solid waste and refuse removal by laws
are not fully implemented due to capacity challenges that are currently being ironed out. Intergraded Waste
Management Plan is currently under review. The neighborhood funding from the National Treasury earmarked for
urban renewal shall come in handy to address some of the waste management challenges encountered.
22 0 0 5
TOTAL 14 18544 of 41 416 households
109 (24 679 households)
WARD AVAILABLE NO. OF HOUSEHOLDS
BACKLOG
01 1 (RAWESHI) INCLUDING MINING AREA
165 10
11 1 (MACHABA)
1670 0
16 1 (ELDORADO)
1234 7
19 2 (SENWABARWANA TOWN, DESMOND PARK, EXTENSION 5, WITTEN.
4037 0
21 1 (TOLWE)
156 9
TOTAL
5762

91
The Municipality is rolling out the function to a number of settlements with the recruitment of hundred (200) general
workers who were employed from the 2019\20 financial year. The number of municipal EPWP participants has
increased from 200 to 210 in the 2020\21 financial year and such number will either be sustained or increased in
subsequent years.
The program me is augmented by the integration of EPWP and Community Works Program me. Such general
workers are allocated duties to clean settlements, roads, cemeteries and any other work identified by members of
the community.
WATER PROVISION
Water is a basic need to communities. It is important that the water that is provided to communities is of good
quality and suitable for human consumption, and suitable for good hygiene practices, noting that without water
there is no hygiene.
STATUS QUO
Blouberg Municipality has no responsibility in the function of operations and maintenance for the water
infrastructure. There is a Water Services Authority (WSA) being the Capricorn District Municipality (CDM) which is
also the Water Services Provider. The municipality is dependent on underground water source as there are no
dams to assist with the water provisioning.
CDM has established its own Blouberg Satellite Office, which has a manager also working with local municipal
staff. The District has, further, seconded its staff to the Blouberg Satellite Office to work on the operations and
Maintenance of the water infrastructure, most of who have been transferred from the Department of Water Affairs
in the year 2007. The Satellite office has five (5) Maintenance Camps responsible for the maintenance of the five
(5) Regional Water Schemes that are in the Blouberg municipal Area. Capricorn District Municipality as the WSA
implements water projects on the local municipality’s behalf. Currently 72% of the households within the Blouberg
municipal area have access to water at the level of RDP standard, with only a backlog of 28%. Other Water projects
are to be implemented in the future financial years, as prioritized by CDM but in consultation with the Municipality.
Some of these projects will focus on the refurbishment of some of the old Infrastructure currently hindering good
supply of water to communities. The main sources of water are boreholes, which are not completely sustainable
as some even dry out over time. Most of the equipment for the boreholes has now aged and therefore break easily.
The aquifers are affected when boreholes are over-pumped and not given a chance to rest.
Where there are water challenges and breakdowns, water is supplied with water tankers. The water quality in the
municipality has not attained blue drop status. The district should strive for the attainment of the status.
PROVISION OF FREE BASIC WATER
The municipality, together with the district municipality, provides free basic water and free water to its households
in the form of supply of free diesel and payment of electricity bills to ESKOM for the supply of electricity connections
to boreholes. The challenge is in areas where there is no infrastructure or where there are service breakdowns
that the free basic service is not adequately rendered but as contingency measure water, tinkering is used.
CHALLENGES
The climate conditions and insufficient underground water sources pose a challenge to the availability and
sustainability of water supply to the municipal area.

92
There are capacity challenges with regard to shortage of staff e.g. pump operators, water tanker drivers, plant
operators, general foremen and scheme managers, etc. This is further compounded by lack of resources such as
excavators, water tankers, TLBs, crane truck, etc. Insufficient allocation of the budget for the operations and
maintenance of the water infrastructure by CDM does not do the area any good to fulfill its Constitutional mandate
of providing the basic supply of water.
Other human factors also pose a challenge to the sustainability of providing the service to the community. Such
includes theft of diesel engines, electrical cables, transformers and electric motors. Vandalism of Water
infrastructure and Illegal connections on the main water supply pipelines (rising mains) is also a challenge.
Unfinished projects (Limited scope of work due to budget constraints) are other human factors that deny
communities access to adequate potable water supply.
INTERVENTIONS
The WSA has to allocate sufficient funds to perform proper maintenance on the water infrastructure, to attend to
breakdowns within a reasonable turnaround time and thereby provide adequate water to communities. Further, on,
resources and personnel responsible for operations and maintenance must also be increased. Improved cost
recovery strategies have to be in place in order to sustain provision of water and/or water supply to communities.
There is a need to augment water supply from other sources such as the Glen-Alpine Dam. The WSA has indicated
that there are positive prospects of securing supply from the Glen-Alpine Dam as the Department of Water Affairs
(DWA) did feasibility study, also aiming at securing a license transfer from agricultural to domestic use for the
source. The bulk capacity at areas already supplied to RDP standard will be increased should the project be
successful. Another source of supply is the Glenfirness (Blouberg) Dam, which already has infrastructure that
needs to be upgraded as it has now aged. The Glenfirness (Blouberg) Dam previously supplied water to a
reasonable portion of the Blouberg municipal area. Refurbishment and/ or replacement of such old infrastructure
can augment supply to communities.
There is a need for the enforcement of service level agreements (contracts) that CDM has with its service providers
for the implementation of water projects in order to ensure successful completion of the projects. To date the
municipality has benefited as the upgrade of water infrastructure project managed to service Extension 7 in
Senwabarwana. Therefore the contract management is improving day by day.
The municipality should endeavor to comply with the green drop standard. The water catchment facilities should
be constructed in almost all areas where there are mountains as lot of water is being wasted. The resuscitation of
existing catchment areas should be prioritized taking into account that programs such as Community Works
Program me and EPWP staff be used alongside municipal officials and available equipment. This will be in line
with the municipal vision of turning prevailing challenges into opportunities for growth and development…as the
benefits will be two fold. The first benefit is that unguided and destructive surface run-off will be contained and the
second benefit is that the contained water in the catchment areas will be put into good use for both agricultural and
tourism beneficiation and the boost to the local community will be immense.
The separate drinking facilities should be constructed solely for animal drinking to curb the practice of people
sharing water with animals. The Department of Agriculture should be roped in to play a meaningful role in this
regard.

93
SANITATION
STATUS QUO
Sanitation provision is the function of the district municipality and the annual provision is made in the budget. There
is a huge backlog in the provision of the service in Blouberg Municipality mainly because of budgetary constraints.
About 65 percent of the population in Blouberg is without access to proper sanitation facilities. There are two types
of the sanitation services provided to the communities in the Municipality namely; dry sanitation (VIP toilets) and
the waterborne sewerage. The VIP toilets are provided in the rural communities and sewerage services provided
in the towns such as Senwabarwana and Alldays; and will soon be provided in the new settlement at Tolwe.
VIP Toilets projects have been previously completed in sixty-six (66) settlements within the Municipality.
CHALLENGES
The current percentage of the backlog for sanitation is high. There are budgetary constraints with regard to the
provision of the service to cover the municipal area. There is always a challenge of water borne disease outbreak
particularly in areas where the water table is high.
The other challenge is with regard to substandard VIP structures constructed that are not lined from underground
Most of the previously constructed VIP toilet units have full pits, but cannot be emptied due to lack of resources.
There is also shortage of maintenance personnel for sewer treatment works/ waterborne sewer (1 x Sewerage
maintenance camp at Helen Franz responsible for Senwabarwana and Alldays)
INTERVENTIONS
The Municipality has resolved to prioritize the service for the areas with high water table such as Ga – Mamadi
(Taaibosch), Eldorado, Innes and Slaaphoek, as well as fast developing areas such as Witten. Furthermore,
provision has been planned for new settlements such as Tolwe whose general plan is approved by the office of
the Surveyor-General. A major challenge is the growing settlements that put huge demand of the service.
Other forms of intervention in the provision of sanitation is the provision of low cost housing by CoGHSTA and
such provision is accompanied by the inclusion of VIP toilets
3.10 FINANCIAL VIABILITY & MANAGEMENT
Municipalities were designed with the objective of providing services to their communities in a sustainable manner.
To attain all objectives of local government as outlined in the Constitution there is a need for adequate resources.
Most of the resources required for local government to fulfill its developmental mandate require that a Municipality
be financially viable and sustainable. The municipality must be able to raise all potential revenue from available
sources and must at the same time manage its financial matters to ensure there is sustainability.
STATUS QUO
Blouberg Municipality has the Budget and Treasury Department with five Divisions available to manage and render
the finance service. The Divisions are Asset, Income, Expenditure, Supply Chain and Budget. Sources of revenue
for the Municipality are external (grants and subsidies from the national and district spheres of government) and
internal (own revenue sources). Key external sources include equitable share, municipal infrastructure grant,
integrated electrification grant, and financial management grant. Key internal sources of revenue include property
rates, development fund, electricity charges, traffic collections and sale of sites. A detailed reflection of the ratio of

94
external and internal allocation is reflected in the attached budget, which is an annexure to this IDP. For the
2020\2021 financial year the grant allocation amounts to R 251 353, 000, 00 while own revenue amounted to R91,
209, 000.00 and total revenue is R 343 633,476. 00. The total capital budget is R59 333, 788, 00.
The Auditor-General, in the 2018/2019 financial year issued a qualified audit opinion like in the prior year where
the municipality also obtained the Qualified audit opinion on the financial affairs of Blouberg Municipality with areas
of concern being VAT, payables and cash flow statement in 2018/19 financial year. The 2017/18 findings were
amicably dealt with hence no finding relating to them in 2018/19 financial year. The challenge of 2018/19 cash flow
statement is already resolved and agreed with the AG and it was found that in the main the matter was on incorrect
disclosures. The municipality issues out bills to its residents in Alldays and Senwabarwana on a monthly basis and
the billing system used is Solar system were Business Connexion (BCX) is the service provider.
Blouberg Municipality, being rural in nature, has challenges of a small revenue base. Because of the high level of
indigence and unemployment rate most of the municipal residents are unable to afford payments of municipal
services, rates and taxes.
There is also a culture of non-payment by municipal residents and this mostly prevalent in the town of
Senwabarwana. Because of this culture, there is a high level of indebtedness and bad debts that have a bearing
on the capacity of the Municipality to raise the much-needed revenue and sustain itself financially. It is against this
background that the Municipality is currently dependent on grants for its financial performance and if the National
Treasury was to stop funding to the Municipality the latter will close shop.
There is also a challenge of the reliability of the municipal billing system, which at times does not reconcile
information on bills issued and paid. Another challenge is the reconciliation and integration of all IT systems that
have a bearing on the financial performance of the Municipality. The Municipality currently uses cash-focus for
payment of creditors, pay-day for payment of salaries, Solar system for billing etc. Another challenge throughout
the years has been the bad audit opinion from the office of the Auditor-General on the financial affairs of the
Municipality, the main emphasis being a suspense account and asset management matters.
To give effect to the sound management of the municipality financial affairs there should be development and
adopted the policies in line with the provisions of the Local Government: Municipal Finance Management Act:
Tariffs policy
The policy was developed in terms of section 74 of the Municipal Systems Act. It prescribes procedures and
processes for calculating tariffs and their implementation
thereof.
Indigent support policy
The policy aims at bringing relief to indigent households through the provision of free basic services by both
the municipality and other service delivery agents. The policy annually sets a threshold on the combined
amount that families qualify for in order to access free basic services. Annually a determination of two old age
grants is used as a baseline. For the 2019/2020 financial year, the threshold was R3400.00 and for the
2020/2021 it will move to R4000.00
Credit control and debt collection management policy
The policy sets out processes and procedures for credit and debt collection, as well as mechanisms for
ensuring municipal customers pay for the services consumed.
Budget policy

95
This policy sets out the principles, which must be followed in preparing a medium term revenue and
expenditure framework budget. It further ensures that the budget reflects the strategic outcomes embodied in
the IDP and related strategic policies.
Investment policy
This policy was compiled in accordance with the Municipal Investment Regulations and ensures that cash
resources are managed in the most efficient and effective manner. It ensures that excess cash is invested to
generate revenue for the municipality.
Cash management policy
The policy regulates the management of cash flow
Supply chain management policy
The policy is developed to give effect to the Preferential Procurement and Policy Frameworks Act and the
MFMA by promoting fair, equitable, transparent, competitive and cost-effective procurement of goods and
services, as well as disposal thereof.
Property rates policy and by-law
This policy and by-law are developed and implemented to give effect to the Local Government: Municipal
Property Rates Act by ensuring the municipality levy rates and taxes on ratable properties and the regulation
of rebates and discounts thereof.
Payroll policy
This policy provides guidelines and restrictions with regard to the compensation of employees.
Funding and Reserves policy
This policy makes provision for ways of dealing with funding as well as allocating reserves for usage of excess
funds.
Asset Management policy
This document on the Blouberg Municipality Assets Management Policy is provided to assist Management
and Officials of Blouberg Municipality on Asset related issues and to ensure consistent, effective and efficient
asset management principles.
Cost containment policy
The purpose of the policy is to regulate spending and to implement cost containment measures starting for the
current financial year.
The objectives of this policy are to: ensure that the resources of Blouberg Local Municipality are used effectively,
efficiently and economically by implementing cost containment measures.
Infrastructure procurement and delivery policy
This policy establishes the Blouberg Local Municipality’s policy for infrastructure procurement and delivery
management in accordance with the provisions of the regulatory frameworks for procurement and supply chain
management.

96
Virement policy
The objective of the virement policy is to provide guidelines to be followed, to effect virements of approved
budgeted expenditure during the course of financial year.
INTERVENTIONS
The Municipality has developed and adopted finance management policies in line with the requirements of the
Municipal Finance Management Act as appear above.
Because of challenges alluded to earlier in the above paragraphs, a financial turnaround strategy would be
prepared which entails, amongst other things, the following:
activation of the activities of the council established committee (revenue management committee) to deals
with issues of revenue enhancement,
capacitating the senior management, finance portfolio members and staff in the Budget and Treasury
Department by enrolling them for the program in financial management;
Maximizing revenue generation and radically reducing municipal financial costs (costs-down value-up
approach);
A rigorous analysis enabling a response to key challenges;
Ensuring that the Municipality sustains a path to long-term financial health;
Being sensitive to the poor, in order to ensure affordability to all classes of households;
Producing a fiscally sustainable spending pattern;
Integrating and improving all financial IT systems. IT back-up systems must be made available to ensure the
continuous operation of the IT system and the prevention of the unnecessary loss of data.
Ensuring that service delivery and development agenda of the Municipality remain intact with the Municipality
focusing on financial stabilization, alternative funding, and long-term capital planning and competitive tariffs to
support sustainability.
To further attain a healthy financial status of the Municipality it is imperative for the Council to broaden the revenue
and tax base. This can be attained by extending the municipal billing system to bill non-indigent households in
settlements that were previously not billed. On a monthly basis, non-indigents should receive and pay for bills
issued by the Municipality and all credit control and debt management policies must be applicable to them.
There is also a need to review the 3\5 financial year plan, which will articulate and implement the sustainability of
the municipal finances.
Innovations are needed in the financial viability of the municipality with electronic payment systems that will allow
municipal clients to pay for municipal services, rates and taxes with the internet.
3.11 GOOD GOVERNANCE AND PUBLIC PARTICIPATION
STATUS QUO ANALYSIS
BACKGROUND ON COUNCIL AND ITS COMMITTEES
In terms of governance the Municipality comprises of 44 elected public representatives of which 22 are ward
Councillors while the remaining 22 are proportional representatives’ Councillors. Council, the highest decision
making body of the municipality, has established committees to help with the smooth running of Council specific
business. The primary committee of Council is the Executive Committee, which is chaired by the Mayor and
consists of all chairpersons of portfolio committees. Six portfolio committees are in place, namely, Infrastructure
Development; Economic Development and Planning; Budget and Treasury; Community Services; Special Focus;
97
Corporate Services. Over and above these committees, there are section 79 committees, which report directly to
Council and such committees include, Ethics and Disciplinary Committee; Local Geographical Names Committee;
Petitions and Public Participation Committee; and Municipal Publics Account Committee.
STAKEHOLDERS RELATIONS AND TRADITIONAL LEADERS
The municipality has and maintains a system of stakeholder relations. There are forums and structures of
maintaining stakeholder’s relations. Key among such structures is the Mayor-Magoshi forum, which meets
quarterly. There are seven traditional authorities in Blouberg, viz, Bahananwa Traditional Authority, Kibi Traditional
Authority, Babirwa Traditional Authority, Seakamela Traditional Authority and Makgato Traditional Authority,
Matlala Traditional Authority. The relationship with the five traditional authorities within Blouberg municipality is
very sound. In all key decision-making processes such as planning, approval, implementation, monitoring and
evaluation of municipal programmes the five traditional authorities play a key role. Other structures that play a key
role are the taxi associations, traditional healers associations and farmers’ unions
SPECIAL FOCUS MATTERS
The municipality has a special focus unit that looks into the interest of special focus groups within its area of
jurisdiction. The unit is located in the office of the Mayor and is staffed with three personnel, of which one is a
person with disability. Special focus structures are also in place. There is a forum for people with disability, a youth
forum and a women forum all with clear articulated programmes.
WARD COMMITTEE SYSTEM
All the 22 wards have functional ward committees. Council provides support to ward committees through a monthly
stipend provided for in its annual budget. Ward committees meet bi-monthly and ward public meetings are
conducted every quarter for general feedback to communities. There is an annual conference for ward committees
and it is held in the month of August.
COMMUNITY DEVELOPMENT WORKERS
The municipality has 18 Community Development Workers covering the 22 wards. The programme is funded by
CoGHSTA and jointly coordinated with the municipality. There is a good relationship amongst ward Councillors,
ward committees and CDWs in the execution of municipal and government wide programmes
COMMUNICATION STRATEGY
There is Communications Division in place and Communication Strategy was developed and approved by Council.
Communications Manager heads the Division. There is public participation policy championed by the Speaker’s
Office. The municipality has established a website and a Face book page to interact with the cyberspace
community.
AUDIT COMMITTEE AND RISK COMMITTEE
The Audit Committee is in place and the Manager supports the unit: Internal Audit and an officer to assist the
manager. The Audit Committee meets quarterly and submits reports to Council. The Manager serves as the
secretariat for the Audit Committee. The Audit Committee also serves as the Performance Audit Committee and it
assists with the performance audit.

98
The Risk Management committee is in place, comprises of senior managers, and is chaired by an external person.
The committee sits on a quarterly.
IDP AND PMS
The IDP Division is in place and is responsible for the compilation of the document and the facilitation of IDP
meetings. There is the PMS unit located in the office of the municipal manager and it is responsible for performance
management. The IDP document is compiled in house and it is approved annually on time. The PMS Policy and
Framework are in place and quarterly institutional performance reviews are conducted. The individual performance
assessments are conducted quarterly up to the levels of senior managers. The unit provide the technical support
during the assessments. For the 2019/2020, financial year the municipality’s IDP was rated as HIGH in terms of
the assessments conducted annually by the province. From the 2016/2017, financial years to date the Blouberg
IDP assessments have been sustained at a HIGH rating.
MUNICIPAL PUBLIC ACCOUNTS COMMITTEE
The municipal public accounts committee was established as a watchdog in the operations of the municipal affairs.
The main objective is for the council resolution and committees to account to the public on the matters of the
municipality. The committee is functional and it hold its meetings on quarterly basis and reports to council.
The committee comprises of all the political parties represented in the council.
BY-LAWS
All critical By- laws, in line with the powers and functions of the Municipality have been developed and gazetted.
These include Standing Rules and Orders; Control of Public Nuisances; Billboards and Advertising; Undertakings
that Sell Food to the Public; Solid Waste and Refuse Removal; Streets and Sidewalks; Pollution Control; Water
Provision; Sport & Recreation Facilities; Abattoirs; Supply of Electricity; Libraries; Credit Control and Debt
Collection; Cemeteries; Impoundment of Animals; Street Trading; Rates By-law and Sand Harvesting. The
Municipality will have to prioritize by-laws dealing with liquor trading in line with the appeal by the national
government to do so.
COMPLAINTS MANAGEMENT SYSTEM
The front desk personnel dealing with complaints and the Presidential and Premier Hotline queries have been
appointed. The suggestion box is also available for members of the public to put in their suggestions. The plan is
to beef up the customer care centre with additional call centre personnel.
RISK MANAGEMENT AND ANTI-CORRUPTION STRATEGY
The Strategy has been developed and approved by Council. It was developed to curb eminent and future risks that
could occur in the Municipality. The risk register has been compiled with all sorts of risks being identified. The
Internal Auditor is the custodian of the strategy. The risk officer was appointed to take care of risk in the institution.
OVERSIGHT COMMTTEE\ MUNICIPAL PUBLIC ACCOUNTS COMMITTEE (MPAC)
The committee has been established and is functional. It is comprised of all the members of the different political
parties represented in the Council. Initially the committee was responsible for annual report only but it is now
responsible for all the Council activities. The annual programme of the committee has been developed and
approved by Council.

99
CHALLENGES
The municipality has good relationship with traditional leaders, however, the challenge is the implementation of
resolutions taken during Mayor/ Magosi meetings. The meetings are supposed to build a strong relationship
between the municipality and the Traditional leaders. Therefore monitoring of the resolutions is important so that
the Traditional leaders’ concerns are attended to and resolved.
Some of the challenges is that community members take advantage of the municipality and the Traditional Council
by solely demarcating land without legal documents and land use rights from the Traditional leaders’ Council or
the municipality. This brings about frustrations as the municipality invests on land which later on gets invaded.
INTERVENTIONS
The meetings between the mayor and traditional leaders are scheduled to be held quarterly and they are
reimbursed for the kilometres travelled to the meetings. There is catering for every sitting and the meetings are
held at the neutral places to avoid conflicts. In case of the misunderstandings bilateral are done with the affected
parties.
SPECIAL FOCUS CHALLENGES
There is a challenge of budgetary constraints in the division. The inability to provide the focus groups with transport
renders the formations dysfunctional. Lack of proper support is a deterrent for the committees to operate
adequately.
INTERVENTIONS
The budget for the special focus unit has been increased and there is funding committed for the transport of the
committee members. The committees have been relaunched form the wards level.
WARD COMMITTEE SYSTEM CHALLENGES
The major challenge is with regard to the acceptability of other ward committee members by their communities.
Some ward committees are not reporting to the various meetings and the relationship with the indunas are not
sound. The other challenge is with regard to the resignation and the time to fill the position taking too long.
INTERVENTIONS
The office of the Speaker takes only 30 days to facilitate the filling of the position after having received the notice
about the resignation. The ward committees are compelled submit programmes and attendance registers for the
meetings where they have reported to the ward Councillor
COMMUNITY DEVELOPMENT WORKERS CHALLENGES
Not all the 22 wards have been covered with the dedicated community development workers. Some CDWs have
to travel long distances to carry out their duties. Other CDWs have been assigned two wards. The far areas like
farms are not serviced because they are not accessible.
INTERVENTIONS
The submission was done with CoGHSTA to appoint additional CDWs for the outstanding wards. Other racial
groups should also be considered for the appointment to reflect on the demographics of the municipality.

100
COMMUNICATION STRATEGY CHALLENGES
The area that is not fully covered is the corporate branding. Most of the good work done is not covered. There is a
challenge of budgetary constraints for the programmes. The older generation is not IT literate and there is a
challenge with the municipal website.
INTERVENTIONS
The website is constantly updated and all the documents and policies as well as the required information is placed
on it .The remaining challenge is the connectivity of the head office to the satellite offices. The issue at hand is at
an advanced stage and shall be finalised soon.
KPA 6: MUNICIPAL TRANSFORMATION AND ORGANISATIONAL DEVELOPMENT
ORGANISATIONAL STRUCTURES
The Council has five full time Councillors and six portfolio committees headed by members of the Executive
Committee. There are five departments headed by the section 56 managers. The organisational structure is in
place and it is being reviewed annually with the IDP and Budget. There is a clear alignment of the organisational
structure, municipal powers and functions referred to supra) and the IDP. The only senior management positions
filled are the positions of Municipal Manager and Director Economic Development and Planning.
The Municipality has a staff complement of 194 employees and the vacancy rate as at the adoption of the
IDP\Budget in May was sitting at 17employees.
SENIOR MANAGEMENT POSITIONS
All the senior management positions are filled except for the senior manager Technical Services and Infrastructure,
which is vacant.
Only the filled senior managers’ positions have signed the performance contracts and assessments are conducted
on quarterly basis. The position of the senior manager Community Services is vacant and the advert for the position
is online.
EMPLOYMENT EQUITY MATTERS
The municipality has an employment equity plan in place. While the status of the municipality indicates a male,
dominated administration strides have been made to address gender parity. At the top management, there is one
female director and three male directors. There is a huge challenge on the recruitment and employment of people
with disabilities and the plan is to embark on targeted recruitment of such hence a database of people with
disabilities has been compiled by the Special Focus Office. The advertisements do not attract whites and other
racial groups, as they do not apply for positions. The target for the EEP in the previous financial year was to recruit
at least six female middle managers and two whites in terms of the organizational structure.
SKILLS PROFILE AND GAPS
The municipality has skills base comprised of personnel with general administration skills, some with artisan skills,
and few with financial management, engineering, environment and town planning skills. There is generally a
shortage of people with financial, town planning and engineering skills and it is difficult to attract and retain such
skills given the category of the municipality and the revenue base. For the past years the municipality has lost
skilled personnel in the finance, town planning, engineering, auditing and town planning field.

101
HUMAN RESOURCE MANAGEMENT PLANS AND POLICIES
All the critical human resource policies have been developed and adopted by Council, inter alia, Recruitment,
Selection and Appointment; Subsistence and Travelling; Induction; Placement; Overtime; Training and
Development etc. The Employment Equity Plan and Skills Development Plan are in place.
DECENTRALIZATION OF MUNICIPAL SERVICES
The municipality has its head office in Senwabarwana, but has further decentralized its services to six satellite
offices, viz, Alldays, Eldorado, Harriswich, Inveraan, Langlaagte and Tolwe. There are also plans to establish the
seventh satellite office to cater for areas around Ward 21 & 22. The traffic services have also been decentralised
to the Alldays and Eldorado satellite offices with only learner’s services offered. Plans are afoot for the learners’
services to be offered at Tolwe satellite office pending renovations.
SWOT ANALYSIS
The strategic plan of any organization can be developed once the proper environmental analysis has been
conducted. SWOT analysis has been identified as one of the strategic tools for environmental analysis. The
analysis focuses on the internal environment by determining the Strengths and Weakness within the organization.
When analyzing the external environment, the focus should be on identifying Opportunities and Threats facing
the organization. The following SWOT analyses were identified after consultation with the role players as STRONG
and Weak points and are illustrated in the table below:
STRENGTHS (INTERNAL) WEAKNESSES (INTERNAL)
Public participation Infrastructure maintenance
Internal capacity Revenue collection
Effective Council structures Grant dependent
Electricity infrastructure By-law enforcement
Alignment of SDBIP and IDP Compliance with SCM
Credibility of the IDP Staff turnover
Improved Audit opinion
OPPORTUNITIES(EXTERNAL) THREATS (EXTERNAL)
Good relationship with traditional leaders Unavailability of land for development
Tourism Opportunities Unlicensed landfill sites
Council disruptions
Municipality hosts one of six kings in the province Land claims
100% complete electricity infrastructure Lack of surface water
Partnerships (mining houses and other NGOs) Drought
Strategic location Housing backlog

102
Mining opportunities Health facilities backlog
Glen Alpine dam as a source of potable water
High poverty level
KPA 4: LOCAL ECONOMIC DEVELOPMENT
Key Drivers of the Blouberg Economy
The economic character of the Blouberg Municipality mirrors that of the country at large. However, some features
are peculiar to the Blouberg economic strata. The key economic drivers are as follows:
Mining;
Retail and SMME Development
Agriculture;
Tourism; and
Manufacturing;
The next sub-section provides a detail report on the status quo of sectoral activities:
Mining Development
Blouberg Municipality does not have an operational mine currently. The last mine to be in active operation was the
Oaks mine which was operated by the De Beers Consolidated Mines (DBCM) but had to be closed in 2008.
However, the municipality is a labour sending area to the De Beers Consolidated Mine’s Venetia operations which
is in the Musina Municipality (Vhembe District) as well as the DMI mine neighbouring Venetia mine. Both mines
produce diamonds from kimberlite pipes that stretch to the Limpopo River. The literature reviewed does not reflect
any known adverse impact (social, environmental and economic) of mining in the Blouberg Municipality.
Consultations with stakeholders within the municipality, especially traditional leaders and municipal leadership,
reflect a gap that needs to be addressed in so far as mining regulation is concerned. In terms of legislation,
prospecting rights and mining rights are regulated by the Department of Mineral Resources (South Africa, MPRDA).
The main area of concern is that stakeholders view the granting of rights being done without their involvement
even when such rights affect their areas of jurisdiction and authority. Furthermore, there is a general concern that
the legislated Social and Labour Plans do not address priorities of communities in mining labour sending areas of
the municipality. The strategy chapter of this GDS will highlight areas of improvement in this regard.
a) Venetia Mine
The mine is in the Vhembe district in the Musina Local Municipality at about 36 kilometers north of Alldays.
According to the Social and Labour Plan for the period 2013-2017 Blouberg Municipality workforce constituted
17,6% of the total workforce for the mine with a contribution of 206 employees Venetia Mine Social and Labour
Plan 2013-2017).
The Venetia Mine Socio-Economic Report of 2016 reflected an increase of the Blouberg labour force in the mine
to 20.93% with a total of 301 employees out of a total of 1 439 employees. The report also indicates that its payroll
for the Blouberg labour sending area for the 2015 financial year amounted to R57 million out of a total payroll of
R451 million. Furthermore, the SLP has identified hard to fill skills such as mining engineers, Occupational health

103
and safety personnel, geo-tech engineers, surveyors, technicians, riggers, boilermakers, fitters, mechanics and
related skills.
The main reason for the lack of such skills, are amongst others, geographical location and general curricula that
do not address the skills requirements of the mine. According to the mine’s projections in terms of the approved
SLP the productive and useful lifespan of the mine is up to 2043 after the underground operation has commenced
with its operation while the open pit mine is projected to operate until 2022.

104
Map 3 reflects the location of Venetia mine
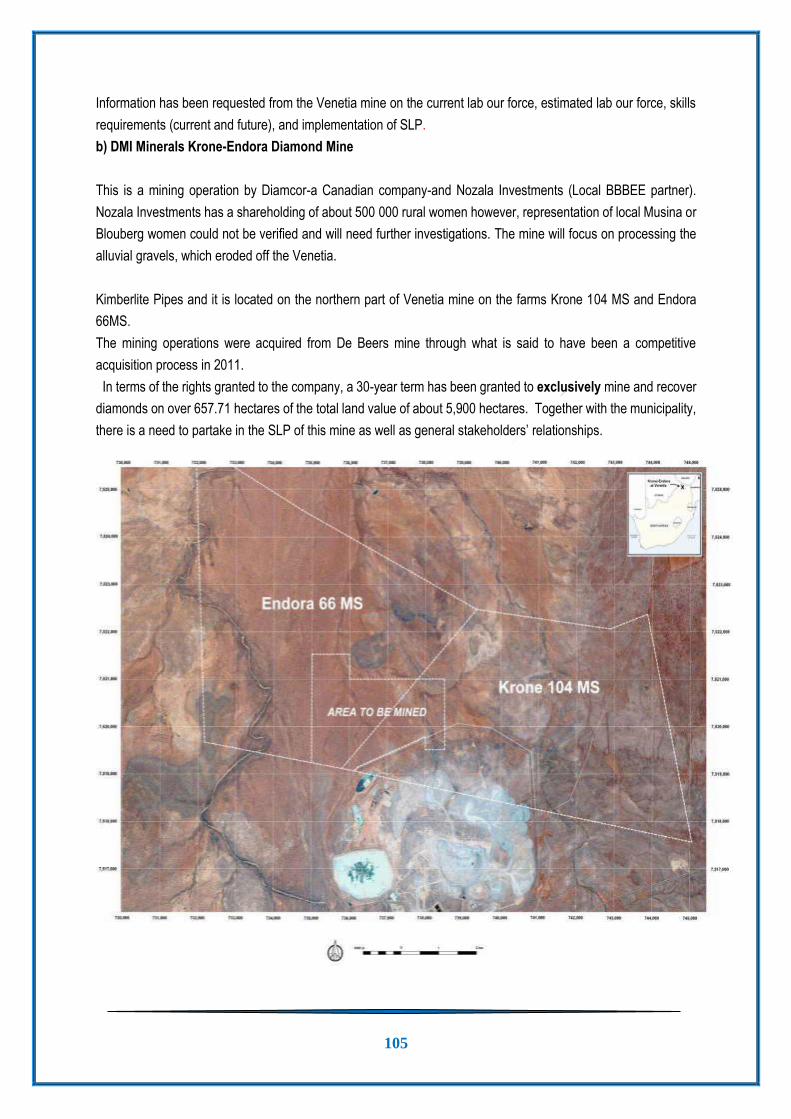
105
Information has been requested from the Venetia mine on the current lab our force, estimated lab our force, skills
requirements (current and future), and implementation of SLP.
b) DMI Minerals Krone-Endora Diamond Mine
This is a mining operation by Diamcor-a Canadian company-and Nozala Investments (Local BBBEE partner).
Nozala Investments has a shareholding of about 500 000 rural women however, representation of local Musina or
Blouberg women could not be verified and will need further investigations. The mine will focus on processing the
alluvial gravels, which eroded off the Venetia.
Kimberlite Pipes and it is located on the northern part of Venetia mine on the farms Krone 104 MS and Endora
66MS.
The mining operations were acquired from De Beers mine through what is said to have been a competitive
acquisition process in 2011.
In terms of the rights granted to the company, a 30-year term has been granted to exclusively mine and recover
diamonds on over 657.71 hectares of the total land value of about 5,900 hectares. Together with the municipality,
there is a need to partake in the SLP of this mine as well as general stakeholders’ relationships.

106
c) Haccra Mine
On the northern part of the Mogalakwena municipality and the South Western part of Blouberg Municipality, a huge
mining operation is in the pipeline. A mining company, Ironveld Plc, has been granted a mining license to mine at
farms overlapping from Mogalakwena municipality to Blouberg Municipality to produce high purity iron, vanadium
and titanium. According to Ironveld, final financial results for the year ended 30 June 2016 execution was awaited
for farms such Non Plus Ultra, which is adjacent to Nonnewerth, La Pucella and Altona. (Ironveld, 2016). The
operation of the mines will also result in the construction and operation of a 15 MW DC furnace smelter at the farm
Altona by the mining company. A mining license has been granted by the Department of Mineral Resources for
mining to commence on the farm Harriet’s wish, Aurora and Cracow under the banner of HACRA mining in the
Blouberg area.
The mine will trigger many transport activities for the conveyancing of goods, services and people as input and
output factors to and from the mine and the aspect of settlement planning and transport, planning must be
adequately provided for.

107
d) Platinum Group Metals (RSA) (Pty) Ltd
Platinum Group Metals successfully submitted several Prospecting Right applications within the Blouberg and
Mogalakwena Local Municipalities in Limpopo Province. The development is known as the Water Project since it
is a continuation of the platinum and related group mining in the Mogalakwena Municipality of the Waterberg
District. PGM’s Waterberg Project is a joint venture between Platinum Group (37.05%), JOGMEC (Japan Oil, Gas
and Metals National Corporation) (21.95%), BEE partner Mnombo Wethu Consultants (Pty) Ltd. (26%) and Impala
Platinum Holdings Ltd (Implats) (15%). Because of Platinum Group’s 49.90%, ownership in Mnombo the Company
has an effective interest in the Waterberg JV of 50.02%. There is effectively no local content in the structuring of
the ownership and shareholding of the mining group for local companies, local being Waterberg or Capricorn.
According to the prospecting rights issued by the DMR, the lifespan of the prospecting license is five years from
date of issue with the expiry of the right being 2018 as the license was issued in 2013. According to the Platinum
Group Metals first quarter financial results for the three months ended November 30, 2017 released in January
2018, the group plans to file its mining rights license in 2018. According to the Department of Mineral Resources,
the Prospecting Right applications cover a total of 44 farms that form a contiguous area of about 1 155 km2. This
area straddles the border of the Blouberg and Mogalakwena Local Municipalities in Limpopo Province. The greater
percentage of the project area falls within the Blouberg municipal area, with only 77 km2 (about 7%) falling in
Mogalakwena.
The Group indicates that the Waterberg Project has the potential to be a low-cost platinum and palladium producer
based on a fully mechanized mine plan. The deposit is dominated by palladium whose price has approximately
doubled since late 2015 due to its primary use in catalytic converters for automobiles and limited market supply.
Other minerals are gold, Radium and palladium. The original feasibility studies have clearly shown positive results
hence the mine has invested huge sums of money for drilling with a view to increase the confidence in certain
areas of the known mineral resource to the measured category. According to PGM’s 2016 independent Pre-
Feasibility Study (PFS) completed, the Waterberg Project is identified as one of the largest, lowest cost.
Undeveloped PGM assets globally. The initial life span of the mine is projected at 18 years from the first year of
operation with additional years to be confirmed with the expansion of exploration projects.
The following sketch shows the relations between the Waterberg project and other existing mines in the continuum

108
Agricultural Development
a) Crop/Vegetable Farming
According to the Limpopo Agro-Processing Strategy (2012) Blouberg Municipality is one of the biggest producers
and exporters of tomatoes, onions and potatoes in the Limpopo Province alongside Molemole, and Makhado
Municipalities and furthermore the strategy proposes that such production should be expanded. What is lacking is
that the processing of these produce is not made in the respective municipalities but mainly in the province of
Gauteng where finished products are sold at higher prices to these exporting municipalities. Furthermore, the
strategy also identifies tobacco farming as one of the strong pillars of agricultural development in the Blouberg
area.

109
Map 7 above reflects the performance of onion production in the Limpopo Province per municipality.
b) Livestock and Game Farming
Blouberg Municipality has comparative and competitive advantages about the production of red meat in
the form of beef and goat’s production.

110
Map 8 above shows the performance of BLM on beef production in the Limpopo Province
Blouberg municipality has also benefited from the Limpopo IDC Nguni Cattle Development Program me. The
program me is a partnership between the Limpopo Department of Agriculture, IDC and University of Limpopo and
to date the community of Junior sloop in ward 17 has benefited from the program me. However, institutional
weaknesses on the program me for the benefitting community of Junior sloop have resulted in the collapse of the
program me in 2017.
Other opportunities in farming involve game farming, which is also used for ecotourism in the southwestern part of
the municipality in areas such as Baltimore, Tolwe, and Maastroom, as well as in the regions northern and western
parts of Alldays.
Some challenges encountered in the sector relate to poor skills, group approaches to the sector, which resulted in
cooperatives running down established operations. This sector is also racially divided in the municipality. In terms
of agricultural development, most white farmers farm on a commercial basis while most black farmers practice
subsistence farming. Membership of organized commercial farmers is also done along racial lines. In the Blouberg
area, white commercial farmers are affiliated to various organized farmers’ unions such as Koedoesrand Landbou
Unie (KDLU), Bo-Brakrivier Boerevereneging, Transvaal Agricultural Union, while black commercial farmers are
affiliated to National African Farmers Union.

111
CHAPTER 4: STRATEGIES PHASE
4.1 INTRODUCTION
The attainment of these objectives and strategies will require the collective efforts of all spheres of government
and the private sector. While there has been no commitment on these objectives from other spheres of government
it is pre-empted that through the IGR fora there will be a buy-in and commitment of resources for the attainment of
such. It should be noted that there is an observation that with the resources available at the national fiscus not all
millennium development goals will be attained as planned.
4.2. MUNICIPALITY’ VISION
A participatory municipality that turns the prevailing challenges into opportunities for growth and development
through the optimal utilization of available resources.
4.3. MUNICIPALITY’ MISSION
To ensure the delivery of quality services through community participation and the creation of enabling environment
for economic growth and job creation
4.4. MUNICIPALITYS MOTTO
Kodumela moepa thutse (Persevere)
4.5. MUNICIPALITYS BROAD OBJECTIVES
The municipality’s strategies seek to address the following objectives:
To deliver basic services to communities in a sustainable manner in a quest to create a better life for all
To create an environment for local economic growth and job creation, focusing on the competitive
advantages of the municipality
To mobilize the broadest section of the community behind the municipality’s endeavors to develop them
with other government departments, public institutions, private sector, NGOs and CBOs as the
municipality’s critical partners.
4.6. MUNICIPAL OBJECTIVES AND STRATEGIES
The Municipality has developed and identified municipal objectives and strategies to address challenges identified
in the analysis phase.
KEY PERFORMANCE AREA 1: SPATIAL RATIONALE
STRATEGIC ISSUES OBJECTIVES STRATEGIES
1 Spatial Planning, Access to land and housing
To achieve an inclusive, sustainable and transformed spatial development
To provide different housing typologies to
Acquisition of strategically located land with the assistance of the Department of Rural Development and Land Reform, the National Housing Agency and CoGHSTA
Development and implementation of a Land Use Management Scheme.
Development and implementation of master plans to guide the growth of settlements starting

112
10 000 households by 2025
To develop new townships where there is a need
To dispose and acquire land to maximize land accessibility
To Ensure land tenure security
with growth points and corridors of development
Formalization of existing settlements
Implementation of tenure upgrading programs to ensure security of tenure for residents
Development and maintenance of good relations with traditional authorities
Engaging CoGHSTA on the provision of quality low cost houses as well as rental housing for the gap market
Radical shift away from Apartheid style of segregated development according to class to the implementation of integrated human settlements along the breaking new ground policy
Identification and demarcation of land for residential, business, agriculture and industrial purposes especially in areas of strategic importance
Building the planning capacity of the municipal personnel
Update the spatial data and infrastructure of the municipality to preserve spatial information
KEY PERFORMANCE AREA 2: BASIC SERVICE DELIVERY
STRATEGIC
ISSUES
OBJECTIVES STRATEGIES
1 Access to clean
water
To provide clean drinking
water to all villages
according to RDP standards
and yard connections by the
end of 2020
Long term strategy is to move away from
reliance on underground water to reliance on
surface water using the Glen Alpine and
Blouberg (Masetheku) dams as major sources of
water
The District, as the WSA, must engage DWA and
Water Users Association of the Glen Alpine dam
and the Mogalakwena River to change the use
of water from commercial agricultural use to
domestic use
The local municipality, together with the district,
must review and implement the Water Services
Development Plan which will also guide on the
maintenance and upgrading of water assets to
cover for the growth of settlements especially
growth points and corridors of development.
Develop systems to detect water leakages in
communities

113
Rehabilitation and maintenance of existing
boreholes and water infrastructure
Improvement of cost recovery strategy to curb
wastage of water
Identification of illegal connections and curbing
them especially those affecting the rising main
Implementation of a Free Basic Water strategy
User paying for higher level of services
The usage of term contractors to avoid water
services interruptions
Resuscitation and training of water committees
in communities
Embark on awareness campaigns on water
saving techniques among community members
To curb or reduce theft of diesel engine pumps
there should be a change to electric water
pumps and installation of tracking devices such
as micro-chips
Engage the Municipal Demarcation Board and
CDM to grant powers and functions of water and
sanitation to Blouberg Municipality.
Building the water treatment plant for the
cleaning of water.
2 Access to sanitation To provide each household
with a VIP toilet according to
National sanitation policy
standards by 2020
To have awareness
programs in place focusing
on health and hygiene
related to sanitation.
To upgrade the WWTW for
the urban areas.
Construction of sanitation facilities that adhere to
policy standards with the priority targeting areas
where the underground water table is closer to
the surface
Enter into partnership with NGOs to fast track the
provision of the service
Provision of Free Basic Sanitation to indigent
households
User paying for higher level of services
3 Access to energy
services
To ensure minimal energy
consumption by users as per
the national energy reduction
strategy
Using own electricity license to electrify
extensions in villages that have grown over the
years since their electrification.
Soliciting ESKOM for the provision of electricity
to extensions to reduce backlogs in areas of
ESKOM supply
Having a fully functional local energy forum
Exploration of alternative sources of energy
(non-grid)
Development and implementation of an energy
master plan

114
Provision of Free Basic Electricity to indigent
households
Embark on energy saving campaigns to reduce
unnecessary energy consumption
4 Access to storm
water
To tar additional 150 km of
roads and re – gravel 500 km
of access roads by the end of
2025
To maintain internal streets
and access roads on a
continuous basis
To ensure access to storm
water facilities by all
communities
To construct low water
bridges
To build bus stop shelters
and taxi ranks in strategic
locations.
To construct storm water
catchment areas.
Engagement of Roads Agency-Limpopo on the
tarring of roads especially the ones linking to
nodes of economic activities
Engagement of the Department of Public Works
and Roads for a grading program me and
adherence to such
Sustaining and beefing up the municipal roads
unit and capacity building to the three clusters
established
Partnership with the local mining houses (De
Beers and Coal of Africa) to help in funding and
implementing some of the programs on building
new roads and maintaining existing ones.
Embark on programs of upgrading some internal
streets with the provision of storm water
drainage facilities
Coordination of roads development and
maintenance
Development of Integrated Roads and Transport
master plan developments
Sustaining the local roads and transport forum
5 Public transport To ensure all settlements
have access to affordable
and sustainable public
transport by 2022
To ensure availability of
infrastructure to support
public transport
To build capacity to the
transport industry
Engage public transport operators to extend
areas of coverage as well as hours of operation
Embark on campaigns that promote the use of
public transport development specially to reduce
global warming
Construction of new taxi ranks and upgrading of
informal taxi ranks
Construction of taxis and bus shelters along
major roads
Capacity building to the taxi industry e.g. on
business management, safety awareness,
customer care etc.
Provide road surfacing with paving blocks.
6 Waste management To provide and improve
waste management and
refuse removal to 100% of
the population by 2020
Development and implementation of an
integrated waste management plan
Provision of onsite storage systems
Establishment and operation of
compliant\licensed landfill sites and transfer
stations

115
Provision of regular waste collection
Purchase and maintenance of additional waste
bins, waste compactor and waste plant.
Provision of environmental awareness of the
detrimental effects of waste.
Enlisting the services of contract general
workers to rollout the function
Integrating the CWP and EPWP and the use of
municipal staff into the waste program me
6 Access to
educational facilities
To ensure that all learners
have access to education by
2018.
Standard ECD facilities-85%
BY 2030
Establish and support
learner ship programs
through SETAs
Building additional classrooms in areas with few
classrooms
Identification of inaccessible educational
facilities
Engagement of the departments of education
and public works to provide the necessary
infrastructure
Fostering partnerships to achieve the objective
Provision of learner with bicycles and scholar
transport
Building of new schools
Promotion of ABET projects
Construction of early childhood educational
facilities to all settlements with a minimum of five
facilities constructed per year.
6 Access to health To ensure that all residents
in the municipal area have
access to primary health
care facilities within 5km
walking distance by 2020
Coordination of the establishment of and
increasing clinics and mobile centers in the area.
Operationalization of the clinics and health
centers 24 hours for seven days.
Lobbying the Department of Health to upgrade
old clinics such as Schoongezight and build new
ones in areas outside the norm
Upgrading Ratšhaatšhaa and Blouberg health
centers to be fully-fledged hospitals
Provision of mobile health facilities
Establishment of a program me of volunteerism
7 Access to
communication
To give 80% of the
population access to posts
and telecommunication by
2020
Building of new post offices
Establishment of telecentres
Facilitating the increase in cellular network
coverage by partnering with major cellular
operators to provide such
Supporting and encouraging the establishment
of Thusong Service Centers (MPCC)

116
KEY PERFORMANCE AREA 3: LOCAL ECONOMIC DEVELOPMENT
STRATEGIC AREA
OBJECTIVES STRATEGIES
1 Local Economic development
To promote job creation in the municipality by 6% annually
To create and promote LED
Reviewing current LED strategy and subsequent implementation through partnership
Planning and coordinating LED activities
Supporting entrepreneurial development
Supporting and promoting local procurement
Supporting and facilitating the establishment of
a community radio station
Establishing a local publication and newsletters
8 Emergency services To provide 100% of the
population with access to
emergency services by 2018
Development of a disaster management plan
Building emergency stations
09 Sports and
recreation
To ensure and improve
access to recreation and
sporting facilities to 90% of
the population by the end
2018
To promote the effective use
and maintenance of sports
facilities
Encouraging people to participate in sporting
activities
Construction of multipurpose sports complex
Renovation and upgrading existing sports
grounds
Diversification of sporting codes
Encouraging coaching clinics and sporting
competitions
10 Environment To provide a sound
environmental conservation
and management plan.
To have a well-coordinated
environmental strategy by
2020
Adoption of Integrated Environmental
Management principles for all development
projects
Development and conducting environmental
awareness campaigns
Exploration and promotion of alternative energy
sources, which are not harmful to the
environment.
Ensuring compliance with environmental laws,
especially NEMA.
11 HIV-AIDS To reduce and prevent the
infection of HIV-AIDS related
deaths by 2030
To establish programs to
deal with the effects of HIV-
AIDS, especially for AIDS
orphans
To encourage home based
care
Co-coordinating and supporting municipality –
based AIDS awareness in conjunction with the
Department of Health and Social Development
Developing HIV-AIDS support programs
Partnership with the private sector to deal with
the scourge of HIV.

117
initiatives in the SMME sector
To broaden the skills base of the communities
To acquire strategically located land for economic development
Implementation of local empowerment strategies that include joint venturing in the implementation of projects
Skills development and capacity building programs for locals.
Engage the Capricorn FET College to ensure the curriculum offers market-related programs
Develop a database of unemployed graduates and prioritize re-skilling where needed
Engage the SETAs to assist on skills development programs for community members
Lobby for the establishment of additional institutions of higher learning
Supporting and promoting lab our intensive methods in community based infrastructure projects.
Together with the provincial and national government there is a need to embark on programs such as Community Work program me and Expanded Public Works Program me to create a safety job net for local communities
Place marketing and investor attraction (development of place marketing brochures and video and placing such on the municipal website)
Identification of strategically located land and acquisition thereof
Provision of preferential tariffs on rates and taxes to help in the expansion and retention of business, farms and industries
Provision of supporting infrastructure such as roads networks, energy supply and water and sanitation supply to aid business development
KEY PERFORMANCE AREA 4: GOOD GOVERNANCE AND PUBLIC PARTICIPATION
STRATEGIC AREA STRATEGIC OBJECTIVES STRATEGIES
1. Good governance and public participation
Enhance total community participation
Ensure the attainment of a clean audit in line with Operation clean target of 2021
Sustain good community participation practice as contained in the communication strategy
Develop and implement action plan to address all issues raise by the Auditor—General
Capacitate and strengthen the MPAC
Establish and capacitate the risk unit and risk committee
Sustain the functionality of the internal audit committee
Establish an internal pre-audit committee

118
2. General planning (long term planning)
To ensure forward long term planning in line with the national government vision 2030
Municipality to develop a growth and development strategy (Blouberg Vision 2030)
Cluster development along nodes and corridors of development
Quantify all backlogs and develop a priority list for all such backlogs as reflected in the tables below
KEY PERFORMANCE AREA 5: FINANCIAL VIABILITY AND MANAGEMENT
STRATEGIC AREA STRATEGIC OBJECTIVES STRATEGIES
1 Financial sustainability
Submission of the credible reports in time to comply with Treasury Laws & regulations Realistic and credible budgeting Compliance with Treasury laws & regulations Proper accountability Improved and stable income generation Improved compliance of SCM laws & regulations. Credible contract management Improve compliance of SCM laws & regulations. Improve effective and efficiency of the services. Improve accounting treatment of transactions All incidents occurred will be claimed Accurate accounting treatment (assets)
Capacitate budget & Treasury office [(employ additional employee (Accountant)]
Proper research to be conducted for proper budgeting
BCX to take over control of the financial system (both software & hardware)
Additions of two cashiers at the main office and also each satellite must have a cashier
The concerns departments must develop strategies on how to collect revenue.
With forever changing Municipal laws & regulations, attendance of relevant workshops are key in this unit.
Contract amendments must be communicated with SCM prior and even post execution.
Provide awareness of SCM process and enforce adherence of SCM regulations.

119
Enhance sound financial management and viability. Increase municipal revenue base by 80% by 2021 Recover all outstanding debts by end of 2022/2023 financial year. Proper billing system that exempt indigents households. Ensure that the municipality complies with mSCOA
Intensify the training on accounting standards/GRAP
Assign the responsibility to the identified division officially.
Replacement of the assets
Development of a financial recovery plan
Implement the approved financial management policies in line with the Municipal Finance Management Act
Reduction of operational expenditure by cutting down on unnecessary costs (cost containment measures)
Continuous updates/reconciliation of the valuation roll through the compilation of supplementary rolls so that revenue out of rates and taxes can be augmented
Ensure the municipality is mSCOA compliant by regular sittings of the established committees for continuous drive of the processes,
KEY PERFORMANCE AREA 6: MUNICIPAL TRANSFORMATION AND ORGANIZATIONAL DEVELOPMENT
STRATEGIC AREA
STRATEGIC OBJECTIVES STRATEGIES
1. Municipal transformation and organizational development
To review the organogram to align with the municipal powers and functions
To comply with the policy of staff retention of skilled personnel by 2020 and the sustenance of such retention thereafter
Review of the organogram to align with powers and functions, especially with regard to services decentralized to satellite offices and service points
Development and implementation of the staff retention policy
Development and implementation of a credible WSDP specially to attend to training and development in priority areas such as Finance, Engineering, Auditing and Town planning
Beefing up the special focus unit to have personnel responsible for children and the

120
To address skills gaps
To address the plight of special focus groups such as youth, women, children and the elderly
To decentralize municipal services to communities for them to access such within reduced distances
To promote employment equity in the work place to reflect the representation of women, youth, people living with disability and other racial groups within the demographics of the Municipality.
elderly while sustaining and strengthening the existing youth and disability desk.
Sustain existing satellite offices and establish new ones
Assess the level of equity at the work place and identify sectors that need to be addressed in terms of equity targets, especially for the representatively of Whites and Indians

121
CHAPTER 5: PROJECTS PHASE
5.1. KEY PERFORMANCE AREA 1: BASIC SERVICES AND INFRSTRUCTURE DEVELOPMENT
SDG Goal 6. Ensure availability and sustainable management of water and sanitation for all
Goal 7. Ensure access to affordable, reliable, sustainable and modern energy for all
Goal 9. Build resilient infrastructure, promote inclusive and sustainable industrialization and foster innovation
NDP Expansion of the economy & making growth inclusive
KPA Basis Services and Infrastructure Development
Strategic objective To connect and provide sustainable energy to all households by 2021
Project
Number
Project
Name
Project
Description
(major activities)
Capital/
Operational
Location KPI MTERF Targets MTERF Budget Source of
Funding
Implementing
Agent
EIA
(YES/
NO)
Responsible
Department
2020/21 2021/22 2022/23 2020/21 2021/22 2022/23
BSID 1 Electrification
of extensions
Appointment of
consultant and
contractor for
connection of
households to
electricity grid
Capital Innes
Extension
66 units
Number
households
connected and
energized
Electrification of
66 households
_ _ R1 188 000
_ _ INEP BLM YES Technical
services
BSID 2 Electrification
of extensions
Appointment of
consultant and
contractor for
connection of
households to
electricity grid
Capital Diepsloot
Extension
20 units
Number of
households
connected and
energized
Electrification of
20 households
_ _ R360 000
_ _ INEP BLM YES Technical
services
BSID 3 Construction
of electricity
substation
Appointment of
contractor for
construction of
Senwabarwana
electricity
substation
Capital Senwabarwa
na
Substation
Number of
Completed and
operational
substation
Construction of
Senwabarwana
Substation
Construction of
Senwabarwana
Substation
_ R5 757 691.38 R25,000,000
R30,000, 000
INEP BLM YES Technical
services
BSID 4 Electrification
of extensions
Appointment of
consultant and
contractor for
connection of
households to
electricity grid
Capital Witten
Extension
248 units
Number of
households
connected and
energized
Electrification of
248 households
- - R5 144 303.73 - - INEP BLM YES Technical
services
BSID 5 Indigent relief Provision of
indigent services
OPEX BLM Number of Indigent
provided
Provision of
indigent services
Provision of indigent
services
Provision of
indigent
services
R1,450 000 - - Equitable
Shares
BLM YES Budget &
Treasury

122
SDG Goal 6. Ensure availability and sustainable management of water and sanitation for all
Goal 7. Ensure access to affordable, reliable, sustainable and modern energy for all
Goal 9. Build resilient infrastructure, promote inclusive and sustainable industrialization and foster innovation
NDP Expansion of the economy & making growth inclusive
KPA Basis Services and Infrastructure Development
Strategic objective To connect and provide sustainable energy to all households by 2021
Project
Number
Project
Name
Project
Description
(major activities)
Capital/
Operational
Location KPI MTERF Targets MTERF Budget Source of
Funding
Implementing
Agent
EIA
(YES/
NO)
Responsible
Department
2020/21 2021/22 2022/23 2020/21 2021/22 2022/23
BSID 6 Transformers Reconditioning
of Transformers
Capital BLM The number of
Transformers
reconditioned
Reconditioning of
Transformers
Reconditioning of
Transformers
Reconditioning
of
Transformers
R530 000 R560 000.000 R590 000 Equitable
Shares
BLM YES Technical
services
BSID 7 Electrical
Equipment
Purchasing of
Electrical
equipment
Capital BLM Number of
equipment
purchased
Purchasing of
Electrical
equipment
Purchasing of
Electrical equipment
Purchasing of
Electrical
equipment
R853,860 R853.86 - Equitable
Shares
BLM YES Technical
services
BSID 8 Transformers Installation of
emergency
Transformers
Capital BLM Number of new
transformers
installed
Installation of
emergency
Transformers
Installation of
emergency
Transformers
Installation of
emergency
Transformers
R550 000 R583 000 R617.980 Equitable
Shares
BLM YES Technical
services
BSID 9 Stand by -
Generators
Procurement of
stand by
generators
Capital BLM Number of stand by
generators
procured
Procurement of
stand by
generators
Procurement of
stand by generators
Procurement
of stand by
generators
R1,346.913 - - Equitable
Shares
BLM YES Technical
services
BSID 10 Machinery Purchase of
Rammer
Capital BLM Number of
machinery
purchased
Purchase of
Machinery
Purchase of
Machinery
Purchase of
Machinery
R50 000 - - Equitable
Shares
BLM YES Technical
services
BSID 11 Concrete
mixer
Purchase of
concrete mixer
Capital BLM Number of concrete
mixer purchased
Purchase of
concrete mixer
- - R100 000 - - Equitable
Shares
BLM YES Technical
services
BSID 12 Asphalt
cutter
Purchase of
Asphalt cutter
Capital BLM Number of Asphalt
cutter Purchased
Purchase of
Asphalt cutter
- - R 100 000 - - Equitable
Shares
BLM YES Technical
services
BSID 13 Plant
Maintenance
Maintenance of
Plant
Capital BLM Number of plant
maintained
Maintenance of
plant
Maintenance of plant Maintenance
of plant
R1,500 000 R1,500 000 R1.685 400 Equitable
Shares
BLM YES Corporate
services
BSID 14 Roads Maintenance of
roads
Capital Puraspan Maintenance of
Puraspan Internal
Streets and Storm
water
Maintenance of
Internal street
Maintenance of
Internal street
Maintenance
of Internal
street
R52,000 R54 590 R54 590 Equitable
Shares
BLM YES Technical
services

123
SDG Goal 6. Ensure availability and sustainable management of water and sanitation for all
Goal 7. Ensure access to affordable, reliable, sustainable and modern energy for all
Goal 9. Build resilient infrastructure, promote inclusive and sustainable industrialization and foster innovation
NDP Expansion of the economy & making growth inclusive
KPA Basis Services and Infrastructure Development
Strategic objective To connect and provide sustainable energy to all households by 2021
Project
Number
Project
Name
Project
Description
(major activities)
Capital/
Operational
Location KPI MTERF Targets MTERF Budget Source of
Funding
Implementing
Agent
EIA
(YES/
NO)
Responsible
Department
2020/21 2021/22 2022/23 2020/21 2021/22 2022/23
BSID 15 Roads Maintenance of
roads
Capital Witten Maintenance of
Witten Internal
Streets and Storm
water
Maintenance of
Internal street
Maintenance of
Internal street
Maintenance
of Internal
street
R52,000 R54 590 R54 590 Equitable
Shares
BLM YES Technical
services
BSID 16 Roads Maintenance of
roads
Capital Mamehlabe Maintenance of
Mamehlabe Internal
Streets and Storm
water
Maintenance of
Internal street
Maintenance of
Internal street
Maintenance
of Internal
street
R52 000 R85 000 R60 000 Equitable
Shares
BLM YES Technical
services
BSID 17 Roads Maintenance of
roads
Capital Dilaeneng Maintenance of
Dilaeneng Internal
Streets and Storm
water
Maintenance of
Internal street
Maintenance of
Internal street
Maintenance
of Internal
street
R52 000 R72 780 R54 786 Equitable
Shares
BLM YES Technical
services
BSID 18 Roads Maintenance of
roads
Capital Senwabarwa
na
Maintenance of
Senwabarwana
Internal Streets and
Storm water
Maintenance of
Internal street
Maintenance of
Internal street
Maintenance
of Internal
street
R100 000.00 R218 360 R218 360.00 Equitable
Shares
BLM YES Technical
services
BSID 19 Roads Maintenance of
roads
Capital Alldays Maintenance of
Alldays Internal
Streets and Storm
water
Maintenance of
Internal street
Maintenance of
Internal street
Maintenance
of Internal
street
R100 000.00 R272 950 R272 950 Equitable
Shares
BLM YES Technical
services
BSID 20 Roads Maintenance of
roads
Capital Devrede Maintenance of
Devrede Internal
Streets and Storm
water
Maintenance of
Internal street
Maintenance of
Internal street
Maintenance
of Internal
street
R52 000.00
R72 785 R54 786 Equitable
shares
BLM No Technical
Services

124
SDG Goal 6. Ensure availability and sustainable management of water and sanitation for all
Goal 7. Ensure access to affordable, reliable, sustainable and modern energy for all
Goal 9. Build resilient infrastructure, promote inclusive and sustainable industrialization and foster innovation
NDP Expansion of the economy & making growth inclusive
KPA Basis Services and Infrastructure Development
Strategic objective To connect and provide sustainable energy to all households by 2021
Project
Number
Project
Name
Project
Description
(major activities)
Capital/
Operational
Location KPI MTERF Targets MTERF Budget Source of
Funding
Implementing
Agent
EIA
(YES/
NO)
Responsible
Department
2020/21 2021/22 2022/23 2020/21 2021/22 2022/23
BSID 21 Roads Maintenance of
roads
Capital Taaibosch Maintenance of
Taaibosch Internal
Streets and Storm
water
Maintenance of
Internal street
Maintenance of
Internal street
Maintenance
of Internal
street
R52 000.00 R163 770 R163 770 Equitable
shares
BLM No Technical
Services
BSID 22 Roads Maintenance of
roads
Capital Kromhoek Maintenance of
kromhoek Internal
Streets and Storm
water
Maintenance of
Internal street
Maintenance of
Internal street
Maintenance
of Internal
street
R52 000
R80.000
R60.000
Equitable
shares
BLM No Technical
Services
BSID 23 Roads Maintenance of
roads
Capital Avon Maintenance of
Avon Internal
Streets and Storm
water
Maintenance of
Internal street
Maintenance of
Internal street
Maintenance
of Internal
street
58,693.82 R50,000
R45,000
Equitable
shares
BLM No Technical
Services
BSID 24 Roads Maintenance of
roads
Capital Indermark Maintenance of
Indermark Internal
Streets and Storm
water
Maintenance of
Internal street
Maintenance of
Internal street
Maintenance
of Internal
street
R 52 000 R80.000
R60.000
Equitable
shares
BLM No Technical
Services
BSID 25 Culverts Replacements
and construction
of new of culverts
Capital BLM Number of the
existing culverts
and new culverts
replaced/constructe
d
Replacements
and construction
of new of culverts
Replacements and
construction of new
of culverts
Replacements
and
construction of
new of culverts
R450 000
R500 000
R550 000
Equitable
shares
BLM No Technical
Services
BSID 26 Senwabarwa
na By-
Pass(2.5km)
Upgrading from
Gravel to Tar
Capital Senwabarwa
na
Number of
kilometers of road
upgraded
Upgraded
bypass road from
gravel to tar and
Stormwater
channel
completed
- _ R17 499 999
-
-
- MIG BLM Yes Technical
Services

125
SDG Goal 6. Ensure availability and sustainable management of water and sanitation for all
Goal 7. Ensure access to affordable, reliable, sustainable and modern energy for all
Goal 9. Build resilient infrastructure, promote inclusive and sustainable industrialization and foster innovation
NDP Expansion of the economy & making growth inclusive
KPA Infrastructure and Basis Services
Strategic objective Improvement of road infrastructure and storm water management
Project
Number
Project Name Project
Description
(major
activities)
Capital/
Operational
Location Key
Performance
Indicator
MTERF Targets MTERF Budget Source of
Funding
Impleme
nting
Agent
EIA
(YES/
NO)
Responsible
Department
2020/21 2021/22 2022/23 2020/21 2021/22 2022/23
BSID 27 Towerfontein
crèche
Appointment of
contractor and
supervision
Capital Towerfontein Crèche
constructed
and handed
over
Construction
of
Towerfontein
Crèche
_ - R 976 195.54 - - Equitable
shares
BLM Yes Technical
Services
BSID 28 Construction of
culverts
Construction of
culverts
Capital BLM Number of
culverts
constructed
Number of
Culverts
constructed
R350 000 R400 000 R400 000 Equitable
shares
BLM No Technical
Services
BSID 29 Witten Internal
Street and
Stormwater
channel
(2.4km)
Upgrading of
internal street
and Stormwater
channel from
Gravel to
Pavement
(2.4km)
Capital Witten Number of
kilometer
upgraded
Upgraded
internal street
from gravel to
pavement
and
Stormwater
channel
completed
Upgraded
internal street
from gravel to
pavement
and
Stormwater
channel
completed
- R6 258 517.59 R12,941,482.4
1
MIG BLM Yes Technical
Services
BSID 30 Senwabarwan
a Internal
street and
Storm Water
channel (5km)
Upgrading of
Senwabarwana
Internal Street
and StormWater
channel (5km)
Capital Senwabarwana Number of
kilometer
upgraded
- Upgraded
internal street
from gravel to
tar and
Stormwater
channel
completed
Upgraded
internal street
from gravel to
tar and
Stormwater
channel
completed
- R32,400,117.5
9
R7,599,882.41 MIG BLM Yes Technical
Services
BSID 31 Alldays Internal
Street and
Stormwater
channel
(3.8km)
Upgrading of
AlldaysInternal
Street and
Stormwater
channel (3.8km)
Capital Alldays Number of
kilometer
upgraded
- - Upgraded
internal street
from gravel to
pavement
and
Stormwater
channel
completed
- - R30,400
000.00
MIG BLM Yes Technical
Services

126
SDG Goal 6. Ensure availability and sustainable management of water and sanitation for all
Goal 7. Ensure access to affordable, reliable, sustainable and modern energy for all
Goal 9. Build resilient infrastructure, promote inclusive and sustainable industrialization and foster innovation
NDP Expansion of the economy & making growth inclusive
KPA Infrastructure and Basis Services
Strategic objective Improvement of road infrastructure and storm water management
Project
Number
Project Name Project
Description
(major
activities)
Capital/
Operational
Location Key
Performance
Indicator
MTERF Targets MTERF Budget Source of
Funding
Impleme
nting
Agent
EIA
(YES/
NO)
Responsible
Department
2020/21 2021/22 2022/23 2020/21 2021/22 2022/23
BSID 32 Boslaagte
internalstreets
and
Stormwater
channel
(1.1km)
Upgrading of
Boslaagte
Internal Street
and Stormwater
channel (1.1km)
Capital Boslaagte Number of
kilometer
upgraded
- - Upgraded
internal street
from gravel to
tar and
Stormwater
channel
completed
- - R8,800,000.00 MIG BLM Yes Technical
Services
BSID 33 Prospect
internal streets
and
Stormwater
channel
(500m)
Upgrading of
Prospect Internal
Street and
Stormwater
channel (500m)
Capital Prospect Number of
kilometer
upgraded
- - Upgraded
internal street
from gravel to
tar and
Stormwater
channel
completed
- - R1,086,768.59
MIG BLM Yes Technical
Services
BSID 34 Construction of
Senwabarwan
a Sports phase
4 and 5
Construction of
concrete grand
stand, athletic
tracks, Gym and
boxing building
Capital Senwabarwana Percentage of
Senwabarwan
a Sports
Complex
Constructed
Construction
of concrete
grand stand,
athletic
tracks, boxing
and gym
building
completed
- - R18 891 176.08 - - MIG BLM Yes Technical
Services
BSID 35 Free basic
Refuse
Payment of free
basic refuse
Operational BLM Number of
households
provided with
free basic
refuse
households
provided with
free basic
refuse
households
provided with
free basic
refuse
households
provided with
free basic
refuse
R800 000
R1,500 000
R 882,000
Equitable
shares
BLM No Community
Services
BSID 36 Infrastructure
Master plan
Inclusive
Infrastructure
Master plan of
Roads, energy,
water, sanitation
etc.
Operational Senwabarwana
and Alldays
Development
of an
infrastructure
master plan
Development
of an
infrastructure
master plan
- - - - - - DBSA No Technical
Services

127
SDG Goal 6. Ensure availability and sustainable management of water and sanitation for all
Goal 7. Ensure access to affordable, reliable, sustainable and modern energy for all
Goal 9. Build resilient infrastructure, promote inclusive and sustainable industrialization and foster innovation
NDP Expansion of the economy & making growth inclusive
KPA Infrastructure and Basis Services
Strategic objective Improvement of road infrastructure and storm water management
Project
Number
Project Name Project
Description
(major
activities)
Capital/
Operational
Location Key
Performance
Indicator
MTERF Targets MTERF Budget Source of
Funding
Impleme
nting
Agent
EIA
(YES/
NO)
Responsible
Department
2020/21 2021/22 2022/23 2020/21 2021/22 2022/23
BSID 37 Smart metering To change
meters to
prepaid Smart
meters and link
to the system
Operational Senwabarwana
and Alldays
Number of
smart meters
installed and
linked to the
system
To change
meters to
prepaid
Smart meters
and link to
the system
To change
meters to
prepaid
Smart meters
and link to
the system
To change
meters to
prepaid
Smart meters
and link to
the system
- - - - - No Technical
Services
BSID 38 Cluster 1-Post
connections of
155
households
connection
Electrification of
155 households Operational (Arrie (23),Sias
(25), Thorpe
(57), Motadi (20)
and Gideon (30))
Electrification
of 155
households
Electrification
of 155
households
- - R462 798.59 - - Equitable
shares
BLM No Technical
Services
BSID 39 Cluster 2 –Post
connections of
132
households
Electrification of
132 households Operational (Diepsloot
(50),Silvermine
(45), (Nailana
(22), Innes(15))
Electrification
of 132
households
Electrification
of 132
households
- - R882 657.60 - - Equitable
shares
BLM No Technical
Services
BSID 40 Cluster 3 –
Post
connection of
120 household
Electrification of
120 households
Operational (Kgokonyane(30
),Milbank (55)
,Mosehleng (35))
Electrification
of 120
households
Electrification
of 120
households
- - R802 416 - - Equitable
shares
BLM No Technical
Services
BSID 41 Gravel roads
and internal
street
maintenance
Graveling of
roads and
internal streets in
villages
Operational All wards Number of km
maintained
Graveling of
roads and
internal
streets
- - R3 000 000 - - Equitable
shares
BLM No Technical
services
BSDI 42 Asset care
plan
To develop an
asset care plan
Operational All wards Development
of asset care
plan
Asset care
plan
- - - - - - DBSA No Technical
services
BSDI 43 Street
sweeping
machine
Purchase of
Street sweeping
machine
Operational BLM Number of
street
sweeping
machines
procured
Purchase of
street
sweeping
machine
- - R500 000 - - Equitable
shares
BLM No Technical
Services

128
5.2. KEY PERFORMANCE AREA 2: LOCAL ECONOMIC DEVELOPMENT
SDG Goal 1. End poverty in all its forms everywhere
Goal 2. End hunger, achieve food security and improved nutrition and promote sustainable agriculture
Goal 8. Promote sustained, inclusive and sustainable economic growth, full and productive employment and decent work for all
Goal 9. Build resilient infrastructure, promote inclusive and sustainable industrialization and foster innovation
Goal 10. Reduce inequality within and among countries
Goal 12. Ensure sustainable consumption and production patterns
NDP Expansion of the economy & making growth inclusive
KPA Local Economic Development
Strategic objective Promotion and Support of Local Economic Development Initiatives
Project
Number
Project Name Project
Description
(major
activities)
Capital/
Operational
Location Key
Performance
Indicator
MTERF Targets MTERF Budget Source of
Funding
Implementing
Agent
EIA
(YES/NO)
Responsible
Department
2020/2021 2021/22 2022/23 2020/21 2021/22 2022/23
LED 01 Tourism Renovation of
Tourism center
Capital Senwabarwana Number of
centres renovated
Tourism Centre
Renovated
Tourism Centre
Renovated
Tourism Centre
Renovated
R150 000 R300, 000
R100, 000 Equitable
shares
BLM No EDP
LED 02
Tourism
Awareness
Conducting
Tourism
Awareness
Campaigns
Operational BLM Number of
Campaigns
Conducted
Conducting of
Awareness
Campaigns
Conducting of
Awareness
Campaigns
Conducting of
Awareness
Campaigns
-
R120, 000 R120, 000 Equitable
shares
BLM No EDP
LED 03 LED Summit Hosting of LED
Summit
Operational BLM Number of
Summit Hosted
Hosting of LED
Summit
Hosting of LED
Summit
Hosting of LED
Summit
R100 000 R150 000 R150 000 Equitable
shares
BLM No EDP
LED 04
Flea Markets
Hosting of the
flea markets
Operational BLM Number of the
flea markets
hosted
- Hosting of the
flea markets
Hosting of the
flea markets
- R50 000
R50 000
Equitable
shares
BLM No EDP
LED 05 LED Strategy Review of LED
Strategy
Operational BLM Number of
Strategies
Reviewed
Review of LED
Strategy
Review of LED
Strategy
Review of LED
Strategy
- R600 000 - Equitable
shares
BLM No EDP
LED 06 Job Summit Hosting of Job
Summit
Operational BLM Number of Job
Summit Hosted
Hosting of Job
Summit
Hosting of Job
Summit
Hosting of Job
Summit
- R250 000 R250 000 Equitable
shares
BLM No EDP
LED 07 LED Projects Support to LED
Projects
Capital BLM Number of LED
Projects
supported
Support to LED
Projects
Support to LED
Projects
Support to LED
Projects
- R700 000 R700 000 Equitable
shares
BLM No EDP
LED 08 Information
Sharing Day
Hosting of
Farmers
Information
sharing day
Operational BLM Number of
Information
Sharing day
Hosting of
Farmers
Information
sharing day
Hosting of
Farmers
Information
sharing day
Hosting of
Farmers
Information
sharing day
- R10 000 R10 000 Equitable
shares
BLM No EDP
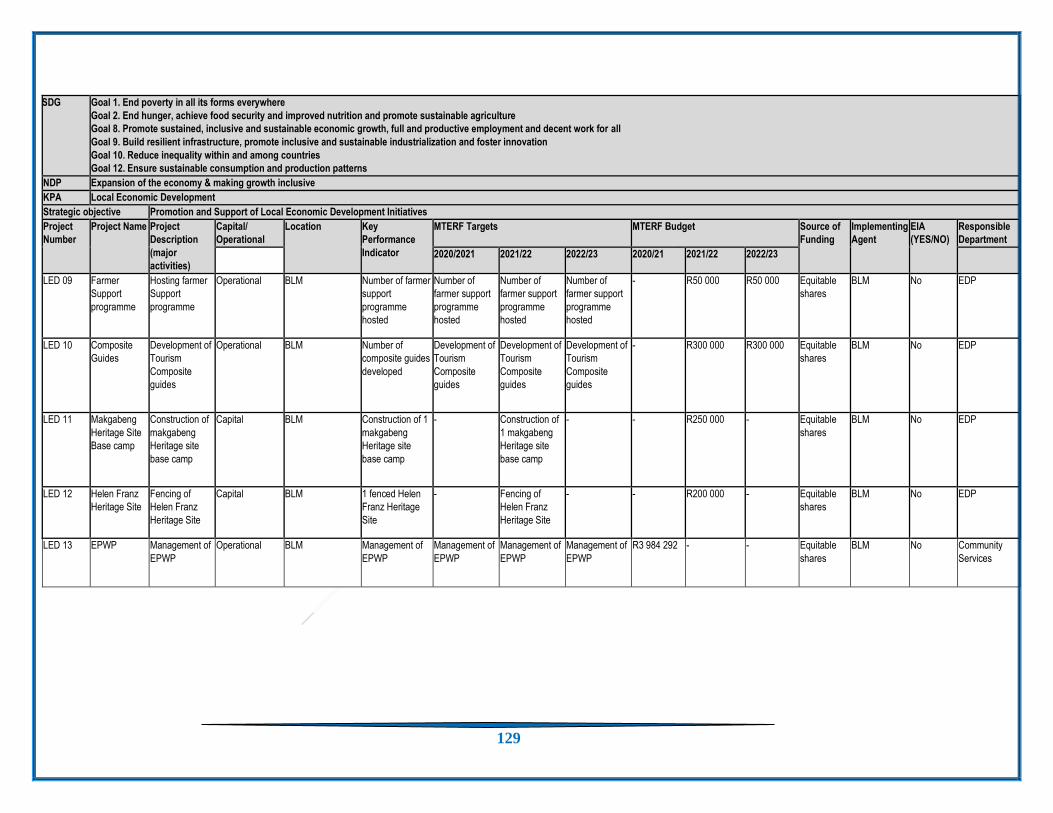
129
SDG Goal 1. End poverty in all its forms everywhere
Goal 2. End hunger, achieve food security and improved nutrition and promote sustainable agriculture
Goal 8. Promote sustained, inclusive and sustainable economic growth, full and productive employment and decent work for all
Goal 9. Build resilient infrastructure, promote inclusive and sustainable industrialization and foster innovation
Goal 10. Reduce inequality within and among countries
Goal 12. Ensure sustainable consumption and production patterns
NDP Expansion of the economy & making growth inclusive
KPA Local Economic Development
Strategic objective Promotion and Support of Local Economic Development Initiatives
Project
Number
Project Name Project
Description
(major
activities)
Capital/
Operational
Location Key
Performance
Indicator
MTERF Targets MTERF Budget Source of
Funding
Implementing
Agent
EIA
(YES/NO)
Responsible
Department
2020/2021 2021/22 2022/23 2020/21 2021/22 2022/23
LED 09 Farmer
Support
programme
Hosting farmer
Support
programme
Operational BLM Number of farmer
support
programme
hosted
Number of
farmer support
programme
hosted
Number of
farmer support
programme
hosted
Number of
farmer support
programme
hosted
- R50 000 R50 000 Equitable
shares
BLM No EDP
LED 10 Composite
Guides
Development of
Tourism
Composite
guides
Operational BLM Number of
composite guides
developed
Development of
Tourism
Composite
guides
Development of
Tourism
Composite
guides
Development of
Tourism
Composite
guides
- R300 000 R300 000 Equitable
shares
BLM No EDP
LED 11 Makgabeng
Heritage Site
Base camp
Construction of
makgabeng
Heritage site
base camp
Capital BLM Construction of 1
makgabeng
Heritage site
base camp
- Construction of
1 makgabeng
Heritage site
base camp
- - R250 000 - Equitable
shares
BLM No EDP
LED 12 Helen Franz
Heritage Site
Fencing of
Helen Franz
Heritage Site
Capital BLM 1 fenced Helen
Franz Heritage
Site
- Fencing of
Helen Franz
Heritage Site
- - R200 000 - Equitable
shares
BLM No EDP
LED 13
EPWP Management of
EPWP
Operational BLM Management of
EPWP
Management of
EPWP
Management of
EPWP
Management of
EPWP
R3 984 292 - - Equitable
shares
BLM No Community
Services

130
5.3. KEY PERFORMANCE AREA 3: SPATIAL PLANNING AND RATIONALE
SDG Goal 11. Make cities and human settlements inclusive, safe, resilient and sustainable
Goal 13. Take urgent action to combat climate change and its impacts
Goal 15. Protect, restore and promote sustainable use of terrestrial ecosystems, sustainably manage forests, combat desertification, and halt and reverse land degradation and halt biodiversity loss
NDP Expansion of the economy & making growth inclusive
KPA Spatial Planning and Rationale
Strategic
objective
Ensure proper spatial planning and Land Use management
Project
Number
Project Name Project Description
(major activities)
Capital/Opera
tional
Location Key Performance
Indicator
MTERF Targets MTERF Budget Source of
Funding
Implementing
Agent
EIA
(YES/NO)
Responsi
ble
Departme
nt
2020/21 2021/22 2022/23 2020/21 2021/22 2022/23
SPR 01 Township
Establishment
Conducting the
process of township
establishment
operational Alldays and
Senwabarwana
Township
establishment
completed
Township
establishment
completed
- - R1 495 438 - - Equitable
shares
BLM YES EDP
SPR 02 Tenure
Upgrading
Compilation and
submission of phase
2 of the project
Operational Senwabarwana Number of reports
compiled and
submitted for
phase 2
Phase 2 reports
compiled and
submitted for
phase 2 of the
project
- - R1 000 000 R1 000 000 - Equitable
shares
BLM No EDP
SPR 03 Land use
scheme
Development of Land
use Scheme
Operational BLM Number of Land
use scheme
developed
Development of
Land use
Scheme
Development
of Land use
Scheme
- R700 000 R700 000 - Equitable
shares
BLM No EDP
SPR 04 Precinct Plan Development of
Herriswich Precinct
Plan
Operational Herriswich Number of precinct
plans developed
Development of
Precinct Plan
Management of
a Township
Establishment
project
- R700 000 R850 000 - Equitable
shares
BLM No EDP
SPR 05 Valuation roll Compilation of a
supplementary
valuation roll
operational All wards Number of
Supplementary
rolls developed
Compilation of a
Supplementary
valuation roll
Compilation of
a
Supplementary
roll developed
Compilation of
a General
valuation roll
developed
R1 000 000 R800 000 R3 000 000 Equitable
shares
BLM No EDP
SPR 06 GIS system Purchase and
Installation of a GIS
system
Operational BLM Number of GIS
Systems
Purchased and
Installed
Purchase and
Installation of a
GIS system
Purchase and
Installation of a
GIS system
Purchase and
Installation of
a GIS system
R300 000 - - Equitable
shares
BLM No EDP
SPR 07 Farm Bochum
178 LS
Township
Establishment
500 sites
To establish a
Township in
Remainder of Farm
Operational Senwabarwana Township
establishment
completed
Farm Bochum
178 LS Township
Establishment
500 sites
Farm Bochum
178 LS
Township
Establishment
500 sites
Farm Bochum
178 LS
Township
Establishment
500 sites
R1000 000 R1 000 000 R2 200 000 Equitable
shares
BLM No EDP

131
SDG Goal 11. Make cities and human settlements inclusive, safe, resilient and sustainable
Goal 13. Take urgent action to combat climate change and its impacts
Goal 15. Protect, restore and promote sustainable use of terrestrial ecosystems, sustainably manage forests, combat desertification, and halt and reverse land degradation and halt biodiversity loss
NDP Expansion of the economy & making growth inclusive
KPA Spatial Planning and Rationale
Strategic
objective
Ensure proper spatial planning and Land Use management
Project
Number
Project Name Project Description
(major activities)
Capital/Opera
tional
Location Key Performance
Indicator
MTERF Targets MTERF Budget Source of
Funding
Implementing
Agent
EIA
(YES/NO)
Responsi
ble
Departme
nt
2020/21 2021/22 2022/23 2020/21 2021/22 2022/23
Bochum 178 LS with
500 sites
SPR 8 Township
Establishment
To establish a
Township in DRDLR
donated farms 145
LS and 143 LS
Operational BLM Township
establishment
completed
- Township
establishment
completed
Township
establishment
completed
- R400 000 R450 000 Equitable
shares
BLM No EDP
SPR 9 Land Audit To conduct land
audit within Blouberg
Operational All wards An approved
database report on
land audited
- Land audit - - R1 000 000 - Equitable
shares
BLM No EDP
SPR 10
Township
Establishment
Alldays Phase 1 and
2 Township
Establishment
Operational Alldays Township
Establishment for
Phase 1 & 2
Alldays
- Township
establishment
phase 1
Township
establishment
phase 2
- R900 000 R900 000 Equitable
shares
BLM No EDP
SPR 11 Deed search Subscription to deed
search services
Operational BLM Subscription to
deed search
services
- Subscription to
deed search
services
- R50 000 - Equitable
shares
BLM No EDP
SPR 12 Gazetting Publication of
notices in the
provincial gazette
Operational BLM Publication of
notices
Publication of
notices in the
provincial gazette
- - R5000 - - Equitable
shares
BLM No EDP
SPR 13 Prohibition
signboard
Procurement of
signboards
Operational BLM Number of sign
boards procured
Number of
signboards
procured
- - R5000 - - Equitable
shares
BLM No EDP
SPR 14
Procurement
of Survey
Equipment
Survey equipment
procured
Operational BLM Procurement of
Survey Equipment
Procurement of
Survey
equipment
- - R50 000 - - Equitable
shares
BLM No EDP

132
5.4. KEY PERFORMANCE AREA 4: GOOD GOVERNANCE AND PUBLIC PARTICIPATION
SDG Goal 3. Ensure healthy lives and promote well-being for all at all ages
Goal 16. Promote peaceful and inclusive societies for sustainable development, provide access to justice for all and build effective, accountable and inclusive institutions at all levels
NDP Active engagement of citizens in their own development
KPA Good Governance and Public Participation
Strategic objective Promote good governance and public participation
Project
Number
Project Name Project
Description
(major activities)
Capital/
Operational
Location Key
Performance
Indicator
MTERF Targets MTERF Budget Source of
Funding
Imple
menti
ng
Agent
EIA
(YES/
NO)
Responsi
ble
Departme
nt
2020/21 2021/22 2022/23 2020/21 2021/22 2022/23
GGD 01 Auditing Coordination of
external Audit
process
Operational BLM External Audit
process
completed
Coordination
external Audit
process
Coordination
external Audit
process
Coordination
external Audit
process
R4 000 000
R4 770 000
R5 056 200
Equitable
shares
BLM No Municipal
Manager’s
office
GGD 03 Audit & Risk
Committee
Allowances
Coordination of
Risk and Audit
Committee
meetings
Operational BLM Number of audit
Steering
Committee
meetings held
04 Risk and
Audit Committee
04 Risk and Audit
Committee
04 Risk and
Audit Committee
R650 000 R673 000 R 713 380 Equitable
shares
BLM No Municipal
Manager’s
office
GGD 04 Community
Participation
Coordination of
Public
Participation
activities
Operational BLM Number of
Public
Participation
programmes
coordinated
Coordination of
Public
participation
programme
Coordination of
Public participation
programme
Coordination of
Public
participation
programme
- R1 254 800 R1 325 848 Equitable
shares
BLM No Corporate
services
GGD 05 Newsletter Development ad
publication of
newsletter
Operational BLM Number of
newsletter
produced per
quarter
Number of
newsletter
produced per
quarter
Number of
newsletter
produced per
quarter
Number of
newsletter
produced per
quarter
R122,200
R 120,000
R120 000
Equitable
shares
BLM No Municipal
Manager’s
office
GGD 06
Advertisements Advertisement of
Municipal
activities
Operational BLM Number of
advertisement
made on print or
electronic media
Number of
advertisement
made on print or
electronic media
Number of
advertisement
made on print or
electronic media
Number of
advertisement
made on print or
electronic media
R450 000
R450 000
R 450,000
Equitable
shares
BLM No Municipal
Manager’s
office
GGD 07 Publicity Publicity of
Municipal
Activities
Operational BLM Number of
publicity made to
publish electronic
media
Number of
publicity made to
publish electronic
media
Number of
publicity made to
publish electronic
media
Number of
publicity made to
publish electronic
media
R340 000 R250,000 R250,000 Equitable
shares
BLM No Municipal
Manager’s
office
GGD 08 MPAC
programmes
Coordination of
MPAC
programmes
Operational BLM Number of MPAC
programmes
coordinated
Coordination of
MPAC programs
Coordination of
MPAC programs
Coordination of
MPAC programs
R150 000 R331 800 R331 800 Equitable
shares
BLM No Corporate
Services

133
SDG Goal 3. Ensure healthy lives and promote well-being for all at all ages
Goal 16. Promote peaceful and inclusive societies for sustainable development, provide access to justice for all and build effective, accountable and inclusive institutions at all levels
NDP Active engagement of citizens in their own development
KPA Good Governance and Public Participation
Strategic objective Promote good governance and public participation
Project
Number
Project Name Project
Description
(major activities)
Capital/
Operational
Location Key
Performance
Indicator
MTERF Targets MTERF Budget Source of
Funding
Imple
menti
ng
Agent
EIA
(YES/
NO)
Responsi
ble
Departme
nt
2020/21 2021/22 2022/23 2020/21 2021/22 2022/23
GGD 09 Bursary Fund
for Non
Employees
Advertisement
and selection of
recipients
Operational BLM Number of
students awarded
bursaries
Advertisement
and selection of
recipients
Advertisement and
selection of
recipients
Advertisement
and selection of
recipients
R378 000 R435 480 R479 608.80 Equitable
shares
BLM No Corporate
Services
GGD 10 Employees
Bursary
Support to
employees
Operational BLM Numbers of
employee
awarded a
bursary
Support to
employees
Support to
employees
Support to
employees
R400 000 R474 200 R430 900 Equitable
shares
BLM No Corporate
Services
GGD 11 Anti-Fraud And
Corruption
Coordination of
campaigns
Operational BLM Number of anti-
fraud campaigns
conducted
Coordination of
campaigns
Coordination of
campaigns
Coordination of
campaigns
R30 000 R63 600 R67 416 Equitable
shares
BLM No Municipal
Manager’s
office
GGD 12 Council
Support
Coordination
Council activities
Operational BLM Number of
Council activities
coordinated
Number of
Council activities
coordinated
Number of Council
activities
coordinated
Number of
Council activities
coordinated
R43 460 R46 067.60 R48 831.66 Equitable
shares
BLM No Corporate
Services
GGD 13 Security
Management
Appointment and
payment of
Physical Security
service provider
Operational BLM Functional
security services
Functional
security services
Functional
security services
Functional
security services
R15 000 000 R15 900 000 R16 854 000 Equitable
shares
BLM No Municipal
Manager’s
office
GGD 14 Security
Cameras
Appointment of
service providers
for the installation
of camera
Operational BLM Functional
Cameras
Functional
Cameras
Functional
Cameras
Functional
Cameras
R150 000 R159 000 R168 540 Equitable
shares
BLM No Municipal
Manager’s
office
GGD 15
Printing and
publications
Development and
printing of
publications
Operational BLM Number of
messages printed
and published
Development
and printing of
publications
Development and
printing of
publications
Development
and printing of
publications
R250 000 R56,000 R70.000 Equitable
shares
BLM No Corporate
Services
GGD 16 IDP Process
Plan
Development and
adoption of the
process plan
Operational BLM Approved
IDP/Budget
process plan
Development
and adoption of
process plan
Development and
adoption of
process plan
Development
and adoption of
process plan
R20 000 R50 000 R60 000 Equitable
shares
BLM No EDP
GGD 17. IDP
Stakeholder’s
Consultations
IDP stakeholder
consultations
Operational BLM IDP program me
and Reports
IDP program me
and Reports
IDP program me
and Reports
IDP program me
and Reports
R90 000 R340 000 R360 000 Equitable
shares
BLM No EDP

134
SDG Goal 3. Ensure healthy lives and promote well-being for all at all ages
Goal 16. Promote peaceful and inclusive societies for sustainable development, provide access to justice for all and build effective, accountable and inclusive institutions at all levels
NDP Active engagement of citizens in their own development
KPA Good Governance and Public Participation
Strategic objective Promote good governance and public participation
Project
Number
Project Name Project
Description
(major activities)
Capital/
Operational
Location Key
Performance
Indicator
MTERF Targets MTERF Budget Source of
Funding
Imple
menti
ng
Agent
EIA
(YES/
NO)
Responsi
ble
Departme
nt
2020/21 2021/22 2022/23 2020/21 2021/22 2022/23
GGD 18 IDP Steering
Committees
and Review
Sessions
Organizing
Quarterly Steering
Committee and
Performance
Review Sessions
Operational BLM Reports and
Resolutions
Reports and
Resolutions
Reports and
Resolutions
Reports and
Resolutions
R68 584.74 R70 000 R80 000 Equitable
shares
BLM No Municipal
Manager’s
office
GGD 19 Performance
Assessments
Conducting
individual
performance
Assessments
Operational BLM Reports
Performance
Assessments
Reports
Performance
Assessments
Reports
Performance
Assessments
Reports
Performance
Assessments
R50 000 R53 000 R56 180 Equitable
shares
BLM No Municipal
Manager’s
office
GGD 20 Ward
Committees
Conference
Coordination and
support
Operational BLM Coordination and
support to Ward
Committees
Conference
Coordination and
support to Ward
Committees
Conference
Coordination and
support to Ward
Committees
Conference
Coordination and
support to Ward
Committees
Conference
R695 000
R1,200,000
R1,500,000 Equitable
shares
BLM No Corporate
Services
GGD 21 Access control Procurement and
installation of
Access control
system
Operational BLM Procurement and
installation of
access control
system
Access control
system Installed
Access control
system Installed
Access control
system Installed
R650 000 R848 000 R898 880 Equitable
shares
BLM No Municipal
Manager’s
office
GGD 22 License and
maintenance of
team mate
Payment of
license fees and
maintenance of
team mate system
Operational BLM Payment of
license fees and
maintenance of
team mate system
Payment of
license fees and
maintenance of
team mate
system
Payment of license
fees and
maintenance of
team mate system
Payment of
license fees and
maintenance of
team mate
system
R60 000 R61 800 R63 708 Equitable
shares
BLM No Municipal
Manager’s
office

135
5.5. KEY PERFORMANCE AREA 5: MUNICIPAL TRANSFORMATION AND INSTITUTIONAL DEVELOPMENT
SDG Goal 4 Ensure inclusive and equitable quality education and promote lifelong learning opportunities for all.
Goal 16. Promote peaceful and inclusive societies for sustainable development, provide access to justice for all and build effective, accountable and inclusive institutions at all levels
NDP Building of key capabilities (human, physical & Institutional)
KPA Municipal Transformation and Organizational Development
Strategic objective
Project
Number
Project Name Project
Description
(major
activities)
Capital/Ope
rational
Location Key
Performance
Indicator
MTERF Targets MTERF Budget Source of
Funding
Implem
enting
Agent
EIA
(YES/
NO)
Responsible
Department
2020/21 2021/22 2022/23 2020/21 2021/22 2022/23
MTOD 01 Employee
wellness
Conducting
employee
wellness
Operational BLM Reports on the
employee
wellness
conducted
Reports on the
employee
wellness
conducted
Reports on the
employee
wellness
conducted
Reports on the
employee wellness
conducted
R300 000 R318 000 R337 080 Equitable
shares
BLM No Corporate
Services
MTOD 02 Youth
Programme
Support to
youth programs
Operational BLM Number of the
youth
programs
supported
Support to youth
programs
Support to youth
programs
Support to youth
programs
R70 000 R258 428 R273 933.68 Equitable
shares
BLM No Municipal
Manager’s
office
MTOD 03 Gender
Programme
Support to
gender
programs
Operational BLM Number of
gender
programs
supported
Support to the
gender programs
Support to the
gender
programs
Support to the
gender programs
R70 000 R114 584 R121 459 Equitable
Shares
BLM No Municipal
Manager’s
office
MTOD 04 Children
Programme
Support to the
children
programs
Operational BLM Number of the
children’s
programs
supported
Support to the
children’s
programs
Support to the
children’s
programs
Support to the
children’s programs
R70 000 R89 888 R95 281 Equitable
shares
BLM No Municipal
Manager’s
office
MTOD 05 Disability
Programme
Support to the
disability
programs
Operational BLM Number of the
disability
programs
supported
Support to the
disability
programs
Support to the
disability
programs
Support to the
disability programs
R70 000 R149 438 R158 405 Equitable
shares
BLM No Municipal
Manager’s
office
MTOD 06 HIV/AIDS
Programme
Implementation
of HIV/AIDS
Programs
Operational BLM Number of the
HIV/AIDS
programs
implemented
Implementation
of HIV/AIDS
Programs
Implementation
of HIV/AIDS
Programs
Implementation of
HIV/AIDS
Programs
R70 000 R224 720 R238 203 Equitable
share
BLM No Municipal
Manager’s
office

136
SDG Goal 4 Ensure inclusive and equitable quality education and promote lifelong learning opportunities for all.
Goal 16. Promote peaceful and inclusive societies for sustainable development, provide access to justice for all and build effective, accountable and inclusive institutions at all levels
NDP Building of key capabilities (human, physical & Institutional)
KPA Municipal Transformation and Organizational Development
Strategic objective
Project
Number
Project Name Project
Description
(major
activities)
Capital/Ope
rational
Location Key
Performance
Indicator
MTERF Targets MTERF Budget Source of
Funding
Implem
enting
Agent
EIA
(YES/
NO)
Responsible
Department
2020/21 2021/22 2022/23 2020/21 2021/22 2022/23
MTOD 07 Back to School
campaign
Conduct the
back to school
campaign
Operational BLM Number of the
back to school
campaigns
conducted
Conducting the
back to school
campaigns
Conducting the
back to school
campaigns
Conducting the
back to school
campaigns
R84 800 R89 888 R95 281 Equitable
shares
BLM No Municipal
Manager’s
office
MTOD 08 Licenses Licenses
Software
maintenance
Operational BLM Number of
licenses
software
maintained
Licenses
Software
maintenance
Licenses
Software
maintenance
Licenses Software
maintenance
R80 000 R84 000 R89 888 Equitable
shares
BLM No Corporate
services
MTOD 09 IT Software and
Licensing
Purchase of
new software
and renewal of
licenses
Capital BLM Software to be
renewed
VMware,
Backup exec
AntiVirus
Number of
software and
licenses
purchased and
renewed
Number
software and
licenses
purchased and
renewed
Number software
and licenses
purchased and
renewed
R1 200 000
R627 520 R665 171.20
Equitable
shares
BLM No Corporate
Services
MTOD 10 Rental of Office
Equipment
Rental Operational BLM Number of
office
equipment
rented
Number of office
equipment rented
Number of office
equipment
rented
Number of office
equipment rented
R 854,000
R 980 000 R1, 300 000 Equitable
shares
BLM No Corporate
Services
MTOD 11 IT equipment Maintenance of
IT equipment
Capital BLM % of
maintenance
done
100%
maintenance
100%
maintenance
100% maintenance R120 000 R127 200.00 R134 832 Equitable
shares
BLM No Corporate
Services
MTOD 12
Mayoral Imbizo Hosting of
Mayor’s Imbizo
Operational BLM Reports Reports Reports Reports R106 000 R112 360 R119 101.60 Equitable
shares
BLM No Municipal
Manager’s
office
MTOD 13
Mayor – Magoshi Hosting of
Mayor Magoshi
Operational BLM Program me
and Reports
Program me and
Reports
Program me
and Reports
Program me and
Reports
R50 000 R50,000 R50 000 Equitable
shares
BLM No Municipal
Manager’s
office
MTOD 14
Heritage
Celebrations
Hosting of
Heritage
Celebrations
Operational BLM Number of the
celebration
hosted
Hosting of
Heritage
Celebrations
Hosting of
Heritage
Celebrations
Hosting of Heritage
Celebrations
R150 000 R300,000 R350 000 Equitable
shares
BLM No Municipal
Manager’s
office

137
SDG Goal 4 Ensure inclusive and equitable quality education and promote lifelong learning opportunities for all.
Goal 16. Promote peaceful and inclusive societies for sustainable development, provide access to justice for all and build effective, accountable and inclusive institutions at all levels
NDP Building of key capabilities (human, physical & Institutional)
KPA Municipal Transformation and Organizational Development
Strategic objective
Project
Number
Project Name Project
Description
(major
activities)
Capital/Ope
rational
Location Key
Performance
Indicator
MTERF Targets MTERF Budget Source of
Funding
Implem
enting
Agent
EIA
(YES/
NO)
Responsible
Department
2020/21 2021/22 2022/23 2020/21 2021/22 2022/23
MTOD 15 IT Disaster
recovery plan
Multiyear
project for
development of
IT Disaster
recovery plan
Capital BLM Number of IT
disaster
recovery center
procured
Procurement of
IT disaster
recovery plan
Procurement of
IT disaster
recovery plan
Procurement of IT
disaster recovery
plan
R700 000 R850 000 R850 000 Equitable
shares
BLM No Corporate
Services
MTOD 16 Record
Management
Procurement of
record
management
system
Capital BLM Number of
record
management
system
procured
Procurement of
record
management
system
Procurement of
record
management
system
Procurement of
record
management
system
R1 200 000 - - Equitable
shares
BLM No Corporate
Services
MTOD 17 Tree Planting Number of
trees planted
Operational BLM Number of
trees planted
Number of trees
planted
- - - - - Equitable
shares
BLM No Community
Services
MTOD 18
Uniform and PPE Procurement of
uniform and
PPE
Capital BLM Number of
uniforms and
PPE procured
Procurement of
uniform and PPE
Procurement of
uniform and
PPE
Procurement of
uniform and PPE
- - - Equitable
share
BLM No Community
services
MTOD 19
Landfill Site Management of
landfill site
operational BLM Management of
landfill site
Management of
landfill site
Management of
landfill site
Management of
landfill site
R4 000 000 R4 240 000 R4 494 000 Equitable
shares
BLM No Community
Services
MTOD 20 Coordination of
the Disaster
Management
Plan
Curbing of the
disaster
incidents
Operational BLM Number of
Disaster
Management
programs
Number of
Disaster
Management
programs
Number of
Disaster
Management
programs
Number of Disaster
Management
programs
OPEX OPEX OPEX Equitable
shares
BLM No Community
Services
MTOD 21 Procurement and
maintenance of
aircon
Appointment of
Service
provider to
procure and
maintain aircon
Operational BLM Procurement and
maintenance of
aircon
Procurement and
maintenance of
aircon
Procurement
and
maintenance of
aircon
Procurement and
maintenance of
aircon
R700 000 - - Equitable
shares
BLM No Corporate
Services
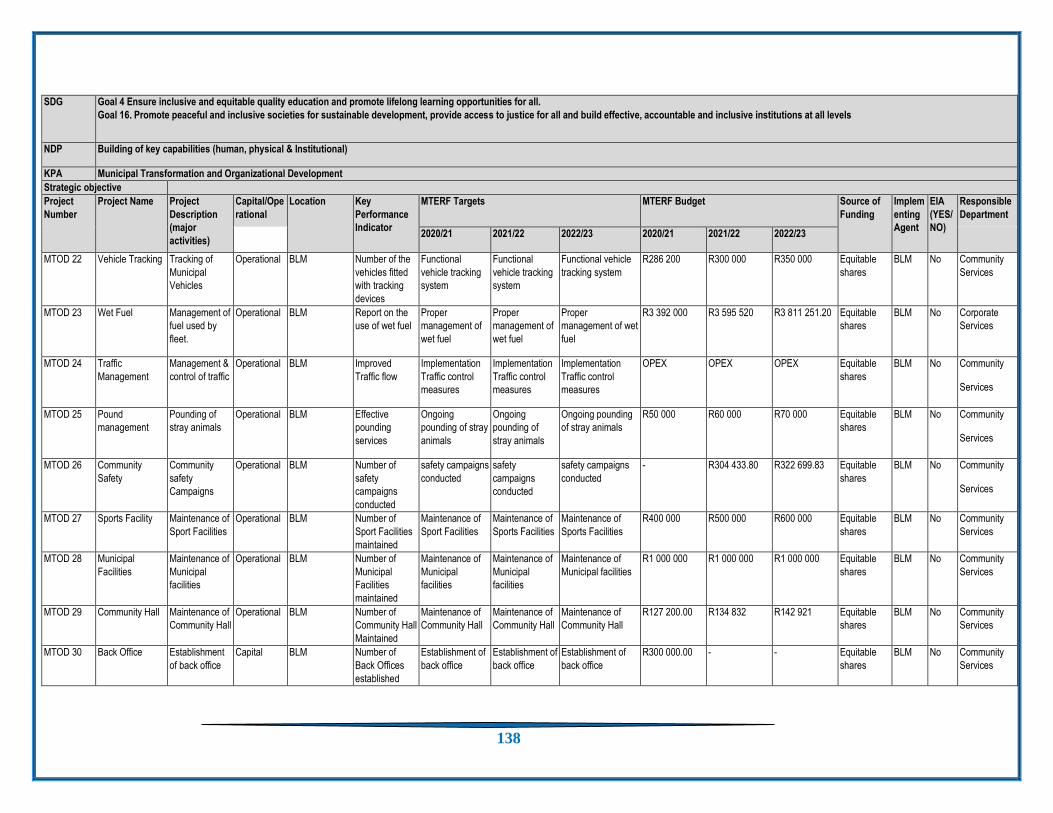
138
SDG Goal 4 Ensure inclusive and equitable quality education and promote lifelong learning opportunities for all.
Goal 16. Promote peaceful and inclusive societies for sustainable development, provide access to justice for all and build effective, accountable and inclusive institutions at all levels
NDP Building of key capabilities (human, physical & Institutional)
KPA Municipal Transformation and Organizational Development
Strategic objective
Project
Number
Project Name Project
Description
(major
activities)
Capital/Ope
rational
Location Key
Performance
Indicator
MTERF Targets MTERF Budget Source of
Funding
Implem
enting
Agent
EIA
(YES/
NO)
Responsible
Department
2020/21 2021/22 2022/23 2020/21 2021/22 2022/23
MTOD 22
Vehicle Tracking Tracking of
Municipal
Vehicles
Operational BLM Number of the
vehicles fitted
with tracking
devices
Functional
vehicle tracking
system
Functional
vehicle tracking
system
Functional vehicle
tracking system
R286 200 R300 000 R350 000 Equitable
shares
BLM No Community
Services
MTOD 23
Wet Fuel Management of
fuel used by
fleet.
Operational BLM Report on the
use of wet fuel
Proper
management of
wet fuel
Proper
management of
wet fuel
Proper
management of wet
fuel
R3 392 000 R3 595 520 R3 811 251.20 Equitable
shares
BLM No Corporate
Services
MTOD 24 Traffic
Management
Management &
control of traffic
Operational BLM Improved
Traffic flow
Implementation
Traffic control
measures
Implementation
Traffic control
measures
Implementation
Traffic control
measures
OPEX OPEX OPEX Equitable
shares
BLM No Community
Services
MTOD 25 Pound
management
Pounding of
stray animals
Operational BLM Effective
pounding
services
Ongoing
pounding of stray
animals
Ongoing
pounding of
stray animals
Ongoing pounding
of stray animals
R50 000 R60 000 R70 000 Equitable
shares
BLM No Community
Services
MTOD 26 Community
Safety
Community
safety
Campaigns
Operational BLM Number of
safety
campaigns
conducted
safety campaigns
conducted
safety
campaigns
conducted
safety campaigns
conducted
- R304 433.80 R322 699.83 Equitable
shares
BLM No Community
Services
MTOD 27 Sports Facility Maintenance of
Sport Facilities
Operational BLM Number of
Sport Facilities
maintained
Maintenance of
Sport Facilities
Maintenance of
Sports Facilities
Maintenance of
Sports Facilities
R400 000 R500 000 R600 000 Equitable
shares
BLM No Community
Services
MTOD 28 Municipal
Facilities
Maintenance of
Municipal
facilities
Operational BLM Number of
Municipal
Facilities
maintained
Maintenance of
Municipal
facilities
Maintenance of
Municipal
facilities
Maintenance of
Municipal facilities
R1 000 000 R1 000 000 R1 000 000 Equitable
shares
BLM No Community
Services
MTOD 29 Community Hall Maintenance of
Community Hall
Operational BLM Number of
Community Hall
Maintained
Maintenance of
Community Hall
Maintenance of
Community Hall
Maintenance of
Community Hall
R127 200.00 R134 832 R142 921 Equitable
shares
BLM No Community
Services
MTOD 30 Back Office Establishment
of back office
Capital BLM Number of
Back Offices
established
Establishment of
back office
Establishment of
back office
Establishment of
back office
R300 000.00 - - Equitable
shares
BLM No Community
Services

139
SDG Goal 4 Ensure inclusive and equitable quality education and promote lifelong learning opportunities for all.
Goal 16. Promote peaceful and inclusive societies for sustainable development, provide access to justice for all and build effective, accountable and inclusive institutions at all levels
NDP Building of key capabilities (human, physical & Institutional)
KPA Municipal Transformation and Organizational Development
Strategic objective
Project
Number
Project Name Project
Description
(major
activities)
Capital/Ope
rational
Location Key
Performance
Indicator
MTERF Targets MTERF Budget Source of
Funding
Implem
enting
Agent
EIA
(YES/
NO)
Responsible
Department
2020/21 2021/22 2022/23 2020/21 2021/22 2022/23
MTOD 31 Tolwe Office
Face lift
Face lifting of
Tolwe Office
Capital BLM Percentage of
Face lifting
done
Face lifting of
Tolwe Office
Face lifting of
Tolwe Office
Face lifting of
Tolwe Office
R500 000.00 - - Equitable
shares
BLM No Community
Services
MTOD 32 Cemetery Procurement of
Cemetery
digging
compressor
Operational BLM Number of
cemetery
digging
compressor
procured
Cemetery
digging
compressor
purchased
- - R100 000 - - Equitable
shares
BLM No Community
Services
MTOD 33 Cemetery Cemetery EIA
study
Operational Alldays Compilation of
EIA report for
new cemetery
site
EIA report - - R150 000 - - Equitable
shares
BLM No Community
Services
MTOD 34 Cemetery Cemetery
standardization
Operational Senwabarwana Report on
cemetery
Standardization
Standardized
cemetery
R100 000 - - Equitable
shares
BLM No Community
Services
MTOD 35 Machine Machine
calibration
Capital BLM Percentage of
calibration done
Machine
calibration
Machine
calibration
Machine calibration R50 000 R60 000 R70 000 Equitable
shares
BLM No Community
Services
MTOD 36 Transfer Station Management of
transfer station
Capital BLM Percentage of
management
work done
Management of
transfer station
Management of
transfer station
Management of
transfer station
R150 000 - - Equitable
shares
BLM No Community
Services
MTOD 37 Climate Change Climate
Change
mitigation
Capital BLM Number of
trees planted
Climate Change
mitigation
Climate Change
mitigation
Climate Change
mitigation
- R100 000 R150 000 Equitable
shares
BLM No Community
Services
MTOD 38 Waste X Chases Procurement of
waste chases
Capital BLM Number of
waste X chases
Procurement of
waste chases
- - R400 000 - - Equitable
shares
BLM No Community
Services
MTOD 39 Provision of
industrial bins
Procurement of
industrial bins
Capital BLM Number of
Industrial bins
procured
- Procurement of
industrial bins
Procurement of
industrial bins
R500 000 R500 000 R500 000 Equitable
shares
BLM No Community
Services
MTOD 40 Maintenance of
Equipment
Maintenance of
Equipment
Capital BLM Maintenance of
Equipment
Maintenance of
Equipment
Maintenance of
Equipment
Maintenance of
Equipment
R127 200 R134 832 R142 921.92 Equitable
shares
BLM No Community
Services

140
SDG Goal 4 Ensure inclusive and equitable quality education and promote lifelong learning opportunities for all.
Goal 16. Promote peaceful and inclusive societies for sustainable development, provide access to justice for all and build effective, accountable and inclusive institutions at all levels
NDP Building of key capabilities (human, physical & Institutional)
KPA Municipal Transformation and Organizational Development
Strategic objective
Project
Number
Project Name Project
Description
(major
activities)
Capital/Ope
rational
Location Key
Performance
Indicator
MTERF Targets MTERF Budget Source of
Funding
Implem
enting
Agent
EIA
(YES/
NO)
Responsible
Department
2020/21 2021/22 2022/23 2020/21 2021/22 2022/23
MTOD 41 Renovations of
Pax and Kibi
Community Hall
Renovations of
pax and Kibi
community Hall
Capital BLM Renovations of
Pax and Kibi
community Hall
- Renovations of
Pax and Kibi
community Hall
- - R500 000 - Equitable
shares
BLM No Community
Services
MTOD 42 Two way radio Procurement of
two way radio
Capital BLM Procurement of
two way radio
- Procurement of
two way radio
- - R100 000 - Equitable
shares
BLM No Community
Services
MTOD 43
Occupational
Health and safety
Provision of
health and
safety kits
Operational BLM Number of
health and
safety kits
procured
Availability of
health and safety
kits
Availability of
health and
safety kits
Availability of health
and safety kits
R970 000 R1 028 200 R1 089 892 Equitable
shares
BLM No Corporate
Services
MTOD 44 Professional
Bodies
Affiliation to
professional
bodies
Operational BLM Number of
officials
affiliated to the
professional
bodies
Payment of
membership fees
Payment of
membership
fees
Payment of
membership fees
R1 180 565 R1 980 056 R2 000 000 Equitable
shares
BLM No Corporate
Services
MTOD 45
Uniform &
protective
clothing
Purchasing of
Uniform and
protective
clothing
Operational BLM Number of
employees with
protective
clothing
Availability of
protective
clothing
Availability of
protective
clothing
Availability of
protective clothing
R500 000 R680 000 R700 000 Equitable
shares
BLM No Corporate
Services
MTOD 46 Labor relations Labour
relations
Operational BLM Sound Labor
relations
Sound Labor
relations
Sound Labor
relations
Sound Labor
relations
OPEX OPEX OPEX Equitable
shares
BLM No Corporate
services
MTOD 47 Publishing Publication of
Municipal
programmes
and process
Operational BLM Number of
publication
done
Publication of
Municipal
programmes
Publication of
Municipal
programmes
Publication of
Municipal
programmes
R223 554
R236 967
R251 185 Equitable
shares
BLM No Municipal
Manager’s
office
MTOD 48 Fleet
Management
Costs
Fleet control
measures
Control of fleet
costs
Operational BLM Affordable fleet
costs
Implementation
of fleet
management
measures
Implementation
of fleet
management
Implementation of
fleet management
R2,550 000 R3 000 000 R6,460 000 Equitable
shares
BLM No Corporate
Services
MTOD 49 Fleet
management
costs
Purchasing of
new fleet
assets
Operational BLM Number of new
fleet purchased
Purchasing of
new fleet assets
- - R1 400 000 - - Equitable
shares
BLM No Corporate
Services

141
SDG Goal 4 Ensure inclusive and equitable quality education and promote lifelong learning opportunities for all.
Goal 16. Promote peaceful and inclusive societies for sustainable development, provide access to justice for all and build effective, accountable and inclusive institutions at all levels
NDP Building of key capabilities (human, physical & Institutional)
KPA Municipal Transformation and Organizational Development
Strategic objective
Project
Number
Project Name Project
Description
(major
activities)
Capital/Ope
rational
Location Key
Performance
Indicator
MTERF Targets MTERF Budget Source of
Funding
Implem
enting
Agent
EIA
(YES/
NO)
Responsible
Department
2020/21 2021/22 2022/23 2020/21 2021/22 2022/23
MTOD 50 Job Evaluation Finalization of
Job evaluation
process
Operational BLM Percentage of
Job evaluation
finalised
Finalization of
Job evaluation
process
Finalization of
Job evaluation
process
Finalization of Job
evaluation process
R140 000 R148 400 R157 304 Equitable
shares
BLM No Corporate
Services
MTOD 51 Clocking System Installation of
Clocking
system
Capital BLM Percentage of
Clocking
system
installed
Installation of
Clocking system
Installation of
Clocking system
Installation of
Clocking system
R100 000 R100 000 R100 000 Equitable
shares
BLM No Corporate
Services
MTOD 52 Network Network
Maintenance
Capital BLM Percentage of
network
maintained
Network
Maintenance
Network
Maintenance
Network
Maintenance
R150 000 R159 000 R168 000 Equitable
shares
BLM No Corporate
Services
MTOD 53 Data line Procurement of
Data line
Capital BLM Percentage of
Data line
Procured
Procurement of
Data line
Procurement of
Data line
Procurement of
Data line
R212 000 R224 720 R238 203 Equitable
shares
BLM No Corporate
Services
MTOD 54 Furniture Purchase of
furniture
Capital BLM Number of
furniture
purchased
Purchase of
furniture
Purchase of
furniture
Purchase of
furniture
R1 585 000 R1 446 900 R1 533 714 Equitable
shares
BLM No Corporate
Services
MTOD 55 Computer/
Laptops
equipment
Purchase of
Laptops
Capital BLM Number of
Laptops
purchased
Purchase of
Laptops
Purchase of
Laptops
Purchase of
Laptops
R200 000 R236 000 R274 160 Equitable
shares
BLM No Corporate
Services
MTOD 56
Office Furniture
for PMU Office
Purchase of
office Furniture
Capital BLM % of office
furniture
purchased for
PMU Office
% of office
Furniture
purchased for
PMU Office
- - R50 000 - - MIG BLM No Technical
Services
MTOD 57 Batho Pele
Programmes
Coordination of
Batho Pele
Programmes
Operational BLM Number of
Batho Pele
Programmes
coordinated
Number of Batho
Pele
Programmes
coordinated
- - R170 000 R180 200 R191 012 Equitable
Shares
BLM No Corporate
Services
MTOD 58
Training guided
by WSP
Coordination of
training guided
by WSP
Operational BLM Number of
trainings
coordinated
through WSP
Number of
trainings
Number of
trainings
Number of trainings
coordinated
through WSP
R900 000 R954 000 R1 011 240 Equitable
Shares
BLM No Corporate
Services

142
SDG Goal 4 Ensure inclusive and equitable quality education and promote lifelong learning opportunities for all.
Goal 16. Promote peaceful and inclusive societies for sustainable development, provide access to justice for all and build effective, accountable and inclusive institutions at all levels
NDP Building of key capabilities (human, physical & Institutional)
KPA Municipal Transformation and Organizational Development
Strategic objective
Project
Number
Project Name Project
Description
(major
activities)
Capital/Ope
rational
Location Key
Performance
Indicator
MTERF Targets MTERF Budget Source of
Funding
Implem
enting
Agent
EIA
(YES/
NO)
Responsible
Department
2020/21 2021/22 2022/23 2020/21 2021/22 2022/23
coordinated
through WSP coordinated
through WSP
5.6. KEY PERFORMANCE AREA 6: FINANCIAL VIABILITY AND MANAGEMENT
SDG Goal 4 Ensure inclusive and equitable quality education and promote lifelong learning opportunities for all.
Goal 16. Promote peaceful and inclusive societies for sustainable development, provide access to justice for all and build effective, accountable and inclusive institutions at all levels
NDP Building of key capabilities (human, physical & Institutional)
KPA Financial Viability And Management
Strategic objective
Project
Number
Project Name Project
Description
(major activities)
Capital/Operati
onal
Location Key Performance
Indicator
MTERF Targets MTERF Budget Source of
Funding
Implem
enting
Agent
EIA
(YES/N
O)
Responsib
le
Departmen
t
2020/21 2021/22 2022/23 2020/21 2021/22 2022/23
FVM 01 Asset
Management
Plan
Development of
Asset
Management Plan
Operational BLM Number of Asset
management plans
developed
Development of
Asset
Management
Plan
Development of
Asset
Management
Plan
Development of
Asset
Management
Plan
R600 000 R500 000 R500 000 Equitable
shares
BLM No B&T
FVM 02 Recording the
assets
Recording of
Assets on the
Solar System
Operational BLM Uploaded asset
register on the Solar
System
Uploaded asset
register on the
Solar System
Uploaded asset
register on the
Solar System
Uploaded asset
register on the
Solar System
R700 000 R200 000 R200 000 Equitable
shares
BLM No B&T
FVM 03 Unbundling of
infrastructure
Assets
Unbundling of
infrastructure
Assets
Operational BLM Unbundling report Unbundling of
infrastructure
Assets
Unbundling of
infrastructure
Assets
Unbundling of
infrastructure
Assets
R900 000 R850 000 R900 000 Equitable
shares
BLM No B&T

143
SDG Goal 4 Ensure inclusive and equitable quality education and promote lifelong learning opportunities for all.
Goal 16. Promote peaceful and inclusive societies for sustainable development, provide access to justice for all and build effective, accountable and inclusive institutions at all levels
NDP Building of key capabilities (human, physical & Institutional)
KPA Financial Viability And Management
Strategic objective
Project
Number
Project Name Project
Description
(major activities)
Capital/Operati
onal
Location Key Performance
Indicator
MTERF Targets MTERF Budget Source of
Funding
Implem
enting
Agent
EIA
(YES/N
O)
Responsib
le
Departmen
t
2020/21 2021/22 2022/23 2020/21 2021/22 2022/23
FVM 04 Landfill
Rehabilitation
Calculation of
Landfill
rehabilitation costs
Operational BLM Land fill rehabilitation
report
Landfill
Rehabilitation
Report
Landfill
Rehabilitation
Report
Landfill
Rehabilitation
Report
R200 000 R200 000 R200 000 FMG BLM No B&T
FVM 05 Electricity Sale of Electricity Operational BLM Percentage of
Electricity sold
100% Sale of
Electricity
100% Sale of
Electricity
100% Sale of
Electricity
R2,4 000
000.00
R1,3 000
000.00
R1 4 000 000 Equitable
shares
BLM No B&T
FVM 06 FMCC Compilation of
Financial
Recovery Plan
Operational BLM Number of recons
developed
Compilation of
Financial
Recovery Plan
Compilation of
Financial
Recovery Plan
Compilation of
Financial
Recovery Plan
R400 000 - - FMG BLM No B&T
FVM 07 MSCOA MSCOA
implementation
Operational BLM Number of MSCOA
project implemented
MSCOA
implementation
MSCOA
implementation
MSCOA
implementation
R1,528 875 R1,628 .875 R1,728.875 Equitable
shares
BLM No B&T
FVM 08 Financial System
adviser
Development of
Financial system
adviser
Operational BLM Number of Financial
System advisers
developed
Development of
Financial system
adviser
Development of
Financial system
adviser
Development of
system adviser
R2,250 000 R2,009 000.00 R 2 077 540 Equitable
shares
BLM No B&T
FVM 09 AFS Compilation of
AFS
Operational BLM Number set of AFS
compiled and
submitted
Compilation of
AFS
Compilation of
AFS
Compilation of
AFS
R 1 150 000 R 1300 000 R1 400 000 FMG BLM No B&T
FVM 10 Elec: Connect
new Households
To effect new
connections
Operational BLM Post connections
effected
To connect new
households
To connect new
households
To connect new
households
R40,000 R12,402.00 R8,681.00 Equitable
shares
BLM No B&T
FVM 11 Elec Sales:
Domestic Low :
Prepaid
Sale of electricity Operational BLM Report on the vending
facilities
To avail
electricity in all
the areas
To avail
electricity in all
the areas
To avail
electricity in all
the areas
R17,800,000 R18,868,000.0
0
R20,000,080.0
0
Equitable
shares
BLM No B&T
FVM 12 Perform AFS
Quality review
To conduct quality
review
Operational BLM Number of quality
review performed
To perform
quality review
To perform
quality review
To perform
quality review
R200 000.00 R400 000.00 R400 000.00 Equitable
shares
BLM No B&T
FVM 13 Debt Collector To appoint the
debt collector
Operational BLM Percentage of debt
collected
To appoint the
debt collector
Debt collection Debt collection % % % Equitable
Shares
BLM No B&T

144
SDG Goal 4 Ensure inclusive and equitable quality education and promote lifelong learning opportunities for all.
Goal 16. Promote peaceful and inclusive societies for sustainable development, provide access to justice for all and build effective, accountable and inclusive institutions at all levels
NDP Building of key capabilities (human, physical & Institutional)
KPA Financial Viability And Management
Strategic objective
Project
Number
Project Name Project
Description
(major activities)
Capital/Operati
onal
Location Key Performance
Indicator
MTERF Targets MTERF Budget Source of
Funding
Implem
enting
Agent
EIA
(YES/N
O)
Responsib
le
Departmen
t
2020/21 2021/22 2022/23 2020/21 2021/22 2022/23
FVM 14 Insurance cover Insurance of
Municipal assets
Operational BLM Insured Municipal
assets
Insurance of all
Municipal Assets
Insurance of all
Municipal Assets
Insurance of all
Municipal
Assets
R 961, 000
R 1,028,270 R900,000.00 Equitable
shares
BLM No B & T
FVM 15 Road & TRSP:
Driver’s License
Applicant
Application for the
driver’s license
test
Operational BLM
Number of the
applications
Register
applicants for
driver’s license
Register
applicants for
driver’s license
Register
applicants for
driver’s license
R1,492,933 R1,492,933 R1,821,000 Equitable
shares
BLM No Community
Services
FVM 16 Road & TRSP:
Learners License
Application
Application for the
learner’s license
test
Operational BLM Number of the
applications
Register
applicants for
learners license
Register
applicants for
learners license
Register
applicants for
learners license
R1,040,000 R1,040,000 R1,040,000 Equitable
shares
BLM No Community
Services
FVM 17 Traffic Fine
Provision
Provision of traffic
fines
Operational BLM Number of traffic fines
issued
Issuing of traffic
fines
Issuing of traffic
fines
Issuing of traffic
fines
R2,600,000 R2,600,000 R3,350,000 Equitable
shares
BLM No Community
Services
FVM 18 Motor Vehicle
licenses
Licenses for Motor
Vehicles
Operational BLM Number of vehicles
with licenses
Motor Vehicle
licenses
Motor Vehicle
licenses
Motor Vehicle
licenses
_ R1,138,914 R1,138,914 Equitable
shares
BLM No Community
Services
FVM 19 Sub Total: Fines
Provision
Impounding of
stray animals
Operational BLM Number of stray
animals impounded
Removing of
stray animal on
the roads
Removing of
stray animal on
the roads
Removing of
stray animal on
the roads
R3,380,000 R3,440,343 R350 000 Equitable
shares
BLM No Community
Services
FVM 20 Sale of sites Disposal of
municipal owned
properties in
Senwabarwana
and Alldays
Operational Senwabarw
ana and
Alldays
Number of sites sold Sale of sites Sale of sites Sale of sites R2,000,000 R2,000,000 R2,000,000 Equitable
shares
BLM No EDP
FVM 21 Licensing and
registration of
vehicles
Licensing and
registration of
vehicles
Operational BLM Availability of
Licensing and
registration services
Licensing and
registration of
vehicles
Licensing and
registration of
vehicles
Licensing and
registration of
vehicles
R 265,000
R 280,900
R79,500
Equitable
shares
BLM No Community
Services

145
5.7. CAPRICORN DISTRICT MUNICIPALITY STRATGEGIES, PROJECTS AND BUDGETS
Table 86: Infrastructure Services Department: Project List and Budget for 2020/21-2022/23 MTERF Budget
Project Number
Project Name Project Description (major activities)
Location Key Performance Indicator
MTERF Targets MTERF Budget R Source of Funding
Implementing Agent
EIA/BAR/ EMP
2020/21 2021/22 2022/23 2020/21 2021/22 2022/23
WATER OPERATION & MAINTENANCE: CAPEX
INFR-01 Procurement of O&M Tools
Procurement of O&M Tools
CDM Percentage of requested O&M tools procured
100% of requested O&M tools procured.
100% of requested O&M tools procured.
100% of requested O&M tools procured.
220 000 220 000 220 000 Equitable shares
CDM N/A
INFR-02 Procurement of Backup Diesel Generators
Procurement of diesel generators
CDM Number of requested Backup Diesel Generators procured
2 requested Backup Diesel Generators procured
2 requested Backup Diesel Generators procured
2 requested Backup Diesel Generators procured
1 000 000 1 000 000 1 000 000 Equitable shares
CDM N/A
INFR-03
Refurbishment of Package Plants
Refurbishment of Package Plants
CDM Number of Package Plants refurbished
3 Package Plants refurbished
3 Package Plants refurbished
3 Package Plants refurbished
5 000 000 10 000 000 15 000 000 Equitable shares
CDM N/A
TOTAL BUDGET O&M CAPEX 6 220 000 11 220 000 16 220 000
WATER OPERATION & MAINTENANCE : OPEX
INFR-04 Water Infrastructure Repairs and Maintenance (Term Contractors)
Replacement of pipe-line, flow meters, major repairs of water equipment and infrastructure
CDM Percentage of reported breakdowns attended through the services of Maintenance Term Contractors
90% of reported breakdowns attended through the services of Maintenance Term Contractors
90% of reported breakdowns attended through the services of Maintenance Term Contractors
90% of reported breakdowns attended through the services of Maintenance Term Contractors
21 112 000 23 356 000 18 356 000 Equitable shares
CDM EMP
TOTAL BUDGET O & M OPEX 21 112 000 23 356 000 18 356 000
WATER QUALITY MANAGEMENT
INFR-05 Procurement of Water Quality Laboratory Equipment /Instruments.
Supply, delivery & installation of Water Analysis Instruments
CDM/University of Limpopo
Percentage of all required water quality laboratory instruments/ equipment procured.
100% of all required water quality laboratory instruments/ equipment procured.
100% of all required water quality laboratory instruments/ equipment procured.
100% of all required water quality laboratory instruments/ equipment procured
900 000 700 000 700 000 Equitable shares
CDM N/A

146
Project Number
Project Name Project Description (major activities)
Location Key Performance Indicator
MTERF Targets MTERF Budget R Source of Funding
Implementing Agent
EIA/BAR/ EMP
2020/21 2021/22 2022/23 2020/21 2021/22 2022/23
INFR-06 Implementation of Water Safety & Security Plans
Implementation of water safety & security Plans recommendations.
CDM Number of interventions on the Water Safety & Security Plans recommendations completed
Cleaning of 5 reservoir’s, installation of 8 level indicators and installation of 4 inline disinfection interventions on the Water Safety Plans recommendations completed
Cleaning of 5 reservoirs, installation of water quality parameter (pH, turbidity and electrical conductivity) on 3water supply scheme interventions on Safety Plans recommendations completed
Cleaning of 5 reservoirs, installation of water quality parameter (pH, turbidity and electrical conductivity) on 4 water supply scheme interventions on Safety Plans recommendations completed
525 000 525 000 525 000 Equitable shares
CDM N/A
INFR-07 Water Quality monitoring and sampling
Collection of water and wastewater samples throughout the district
CDM (all LM’s)
Number of chemicals and microbiological samples collected
600 chemicals and 800 microbiological samples collected
600 chemicals and 800 microbiological samples collected
700 chemicals and 900 microbiological samples collected
200 000 400 000 400 000 Equitable shares
CDM N/A
INFR-08 Procurement of online Disinfection chemicals (Reservoir Floaters)
Procurement of Disinfection chemicals
CDM (all LM’s)
Number of Disinfection chemicals procured
3000 Kg of disinfection chemicals procured
3000 Kg of disinfection chemicals procured
3500 Kg of disinfection chemicals procured
210 000 210 000 210 000 Equitable shares
CDM N/A
INFR-09 Procurement of Water and Wastewater consumables.
Procurement of consumable reagents to enable functioning of the Laboratory
CDM/University of Limpopo
Percentage of all requested water and wastewater consumables procured
100% of all requested water and wastewater consumables procured
100% of all requested water and wastewater consumables procured
100% of all requested water and wastewater consumables procured
700 000 750 000 750 000 Equitable shares
CDM N/A
INFR-10 Unit Process Audit
Assess the capacity and operational
CDM (All LM’s)
Number of Water Supply & Wastewater
3 Water Supply & 3 Wastewater
3 Water Supply & 3 Wastewater
3 Water Supply & 3 Wastewater
365 000 365 000 365 000 Equitable shares
CDM N/A

147
Project Number
Project Name Project Description (major activities)
Location Key Performance Indicator
MTERF Targets MTERF Budget R Source of Funding
Implementing Agent
EIA/BAR/ EMP
2020/21 2021/22 2022/23 2020/21 2021/22 2022/23
effectiveness of the Water Supply & Wastewater systems
Systems Assessed/ audited
Systems Assessed
Systems Assessed
Systems Assessed
INFR-11 Maintenance of Water Quality Laboratory accreditation status.
Maintain accreditation status of the Water Quality Laboratory
CDM/University of Limpopo
Percentage participation on SANAS, NLA and SABS by the Water Quality Laboratory
100% participation on SANAS, NLA and SABS by the Water Quality Laboratory
100% participation on SANAS, NLA and SABS by the Water Quality Laboratory
100% participation on SANAS, NLA and SABS by the Water Quality Laboratory
400 000 400 000 400 000 Equitable shares
CDM N/A
INFR-12 Implementation of Waste Water Risk Abatement Plans
Implementation of Wastewater Risk Assessment outcomes
CDM (LM’s)
Number of intervention on Green Drop recommendations completed
Implementation of bi- monthly effluent water quality monitoring cleaning of 3 WWTWs vegetation, installation of 2 disinfection units, removal of settled sludge in 1 WWTWs completed on Green Drop interventions
Installation of 2 flows meters at WWTWs, implementation bi- monthly effluent water quality monitoring cleaning of vegetation 3 WWTWs completed on Green Drop interventions
Implementation of weekly effluent water quality monitoring, implementation of record keeping on operation data (flow data, water quality data), cleaning of settled sludge completed on Green Drop interventions
300 000 300 000 300 000 Equitable shares
CDM N/A
INFR-13 Operations of waste water treatment works
Operations of waste water treatment works
CDM (LM’s)
Percentage of waste water treatment works operated
80% of waste water treatment works operated
80% of waste water treatment works operated
80% of waste water treatment works operated
2 200 000 2 332 000 1 500 000 Equitable shares
CDM N/A
INFR-14 Operations of Water Purification Facilities
Operations of Water Purification Facilities
CDM (LM’s)
Percentage of Water Purification Facilities operated ,
70 % of water purification facilities operated.
80 % of water purification facilities operated.
80 % of water purification facilities operated.
3 000 000 3 200 000 1 700 000 Equitable shares
CDM N/A

148
Project Number
Project Name Project Description (major activities)
Location Key Performance Indicator
MTERF Targets MTERF Budget R Source of Funding
Implementing Agent
EIA/BAR/ EMP
2020/21 2021/22 2022/23 2020/21 2021/22 2022/23
TOTAL BUDGET WATER QUALITY 8 800 000 9 182 000 6 850 000
PROJECT MANAGEMENT UNIT
INFR-15 Management of the Municipal Infrastructure Programme
Establish and enforce project management standards
CDM Percentage of MIG Expenditure
100 % MIG Expenditure of 229 161 000
100 % MIG Expenditure of 250 172 000
100 % MIG Expenditure of 265 547 000
5 615 696 9 137 913 10 675 957 MIG CDM N/A
INFR-16 Development of Project Management Systems and Processes
Development of Project Management Systems and Processes
CDM Percentage of Project Management Systems and Processes document developed, piloted and operational.
100% of the Project Management Systems and Processes document developed.
100% piloting of the Project Management Systems and Processes.
100% operational Project Management Systems and Processes.
4 347 826 1 739 130 869 565 MIG CDM N/A
TOTAL BUDGET PROJECT MANAGEMENT UNIT 9 963 522 10 877 043 11 545 522
SEWER AND RURAL SANITATION
INFR-17 WSIG Scheme Lepelle Nkumpi Sanitation
Sanitation Lepelle Nkumpi
Number of household with sanitation access
500 households with sanitation access
515 households with sanitation access
550 households with sanitation access
3 814 000 3 814 000 3 814 000 WSIG CDM EMP
INFR-18
Lepelle Nkumpi Sanitation
Lepelle Nkumpi Sanitation
Lepelle Nkumpi
Number of household with sanitation access
500 households with sanitation access
515 households with sanitation access
550 households with sanitation access
5 041 000 5 041 000 5 041 000 MIG CDM EMP
INFR-19 Molemole Sanitation
Molemole Sanitation
Molemole Number of household with sanitation access
500 households with sanitation access
515 households with sanitation access
550 households with sanitation access
5 041 000 5 041 000 5 041 000 MIG CDM EMP

149
Project Number
Project Name Project Description (major activities)
Location Key Performance Indicator
MTERF Targets MTERF Budget R Source of Funding
Implementing Agent
EIA/BAR/ EMP
2020/21 2021/22 2022/23 2020/21 2021/22 2022/23
INFR-20 Blouberg Sanitation
Blouberg Sanitation
Blouberg Number of household with sanitation access
500 households with sanitation access
515 households with sanitation access
550 households with sanitation access
5 041 000 5 041 000 5 041 000 MIG CDM EMP
TOTAL BUDGET SEWER AND RURAL SANITATION 18 937 000 18 937 000 18 937 000
WATER PLANNING & DESIGN
INFR-21 Planning and development of technical reports
Planning and development of technical reports
Capricorn DM
Number of technical reports developed
8 technical reports developed
8 technical reports developed
8 technical reports developed
30 000 000 26 708 000 26 708 000 Equitable share
CDM N/A
INFR-22 Water Service Infrastructure Grant (WSIG) Schemes
Planning and Implementation of WSIG Schemes
Capricorn DM
Percentage Planning and Implementation of Water Infrastructure Grant (WSIG) projects as per Business Plan.
100% Planning and Implementation of WSIG as per Business Plan.
100% Planning and Implementation of WSIG as per Business Plan.
100% Planning and Implementation of WSIG as per Business Plan.
65 751 000 78 795 000 65 751 000 WSIG CDM N/A
TOTAL WATER PLANNING & DESIGN 95 751 000 105 503 000 92 459 000
WATER PROJECTS: BLOUBERG LOCAL MUNICIPALITY
INFR-23 Allday Bulk Water Supply
Planning and construction of Water supply project
Blouberg Ward 17
Percentage planning and construction of water supply project
None 60% planning of water supply project.
100% planning of water supply project.
Nil 2 269 000 2 269 000 MIG CDM BAR
INFR-24 Grootpan, Sias,Londen, Ramaswikana Water Supply
Planning and construction of Water supply project
Blouberg Ward 17
Percentage planning and construction of water supply project
None 20% construction of water supply project. 0 households with water access
50% construction of water supply project. 0 households with water access
Nil 17 391 000 65 300 000 MIG CDM BAR
INFR-25 Kromhoek/Makgatho, Devrede,
Planning and construction of Water
Blouberg Ward 15
Percentage planning and construction of
None 20% construction of water
50% construction of
Nil 8 696 000 8 696 000 MIG CDM BAR

150
Project Number
Project Name Project Description (major activities)
Location Key Performance Indicator
MTERF Targets MTERF Budget R Source of Funding
Implementing Agent
EIA/BAR/ EMP
2020/21 2021/22 2022/23 2020/21 2021/22 2022/23
Taaibosch New Stand Water Supply
supply project
water supply project
supply project. 0 households with water access
water supply project. 0 households with water access
INFR-26 Milbank East, Water Supply
Planning and construction of Water supply project
Blouberg Ward 14
Percentage planning and construction of water supply project
100% planning of water supply project.
30% construction of water supply project. 0 households with water access
100% construction of water supply project. 842 households with water access
Nil 2 268 500 2 268 500 MIG CDM BAR
INFR-27 Nailana Water Supply
Planning and construction of Water supply project
Blouberg Ward 14
Percentage planning and construction of water supply project
100% planning of water supply project.
50% construction of water supply project. 0 households with water access
100% construction of water supply project. 432 households with water access
Nil 2 268 500 2 268 500 MIG CDM BAR
TOTAL BUDGET WATER PROJECTS BLOUBERG LOCAL MUNICIPALITY Nil 32 893 000 80 802 000
WATER PROJECTS: LEPELLE-NKUMPI LOCAL MUNICIPALITY
INFR-28 Groothoek (Lebowakgomo Zone B) Water Supply
Construction of Water supply project
Lepelle Nkumpi Ward 15
Percentage construction of water supply project Number of household with water access
70% construction of water supply project. 0 households with water access
100% construction of water supply project. 8342 households with water access
None 34 783 000 19 038 000 Nil MIG Equitable share
CDM BAR
INFR-29 Mphahlele (Bolatjane, Phalakwane, Makurung and
Construction of Water supply project
Lepelle Nkumpi Ward 19, 21 & 23
Percentage construction of water supply project
70% construction of water
100% construction of water
None 109 836 000 42 714 000 Nil MIG Equitable share
CDM BAR

151
Project Number
Project Name Project Description (major activities)
Location Key Performance Indicator
MTERF Targets MTERF Budget R Source of Funding
Implementing Agent
EIA/BAR/ EMP
2020/21 2021/22 2022/23 2020/21 2021/22 2022/23
Dithabaneng) RWS
Number of household with water access
supply project. 0 households with water access
supply project. 7564 households with water access
INFR-30
Mphahlele RWS Maijane, Sefalaolo, Makaepea, Sedimothole, Moshate & Mashite
Planning and construction of Water supply project
Lepelle Nkumpi Ward 19, 23 & 24
Percentage planning and construction of water supply project
None. 5% construction of water supply project. 0 households with water access
20% construction of water supply project. 0 households with water access
Nil 4 537 000 21 739 000 MIG CDM BAR
INFR-31 Stocks RWS (Hwelereng, Makotse, Motantanyane)
Planning and construction of Water supply project
Lepelle Nkumpi Ward 7 & 13
Percentage planning and construction of water supply project
None 5% construction of water supply project. 0 households with water access
20% construction of water supply project. 0 households with water access
Nil 26 087 000 26 087 000 MIG CDM BAR
INFR-32 Groothoek Regional Water Scheme (Madisha-Ditoro, Madisha-Leolo, Motserereng, Mamogwasha & Mapatjakeng)
Planning and construction of Water supply project
Lepelle Nkumpi Ward 4, 5 & 6
Percentage planning and construction of water supply project
None 50% construction of water supply project. 0 households with water access
20% construction of water supply project. 0 households with water access
Nil 13 043 000 17 391 000 MIG CDM BAR

152
Project Number
Project Name Project Description (major activities)
Location Key Performance Indicator
MTERF Targets MTERF Budget R Source of Funding
Implementing Agent
EIA/BAR/ EMP
2020/21 2021/22 2022/23 2020/21 2021/22 2022/23
INFR-33 MathabathaTongwane BWS Makgoba Madikeleng Lekgwareng Matatane
Construction of Water supply project
Lepelle Nkumpi Ward 15
Percentage construction of water supply project Number of household with water access
None 10% construction of water supply project. 0 households with water access
30% construction of water supply project. 0 households with water access
Nil 8 696 000 17 391 000 MIG CDM BAR
TOTAL BUDGET WATER PROJECTS LEPELLE-NKUMPI LOCAL MUNICIPALITY 144 619 000 114 115 000 82 608 000
WATER PROJECTS: MOLEMOLE LOCAL MUNICIPALITY
INFR-34 Sephala, Mokopu, Thoka, Makwetja RWS
Construction of Water supply project
Molemole Ward 3&4
Percentage construction of water supply project Number of household with water access
95% construction of water supply project. 0 households with water access
100% construction of water supply project. 5 499 households with water access
None 29 565 000 5 217 000 Nil MIG CDM BAR
INFR-35 Phasha Water Supply
Planning and construction of Water supply project
Molemole Ward 3
Percentage planning and construction of water supply project
None. 20% construction of water supply project. 0 households with water access
40% construction of water supply project. 0 households with water access
Nil 8 696 000 6 050 000 MIG CDM BAR
INFR-36 Sefene Water Supply
Planning and construction of Water supply project
Molemole Ward 7
Percentage planning and construction of water supply project
None. 15% construction of water supply project. 0 households with water access
30% construction of water supply project. 0 households with water access
Nil 22 097 000 17 391 000 MIG CDM BAR

153
Project Number
Project Name Project Description (major activities)
Location Key Performance Indicator
MTERF Targets MTERF Budget R Source of Funding
Implementing Agent
EIA/BAR/ EMP
2020/21 2021/22 2022/23 2020/21 2021/22 2022/23
INFR-37 Ratsaka Water Supply
Planning and construction of Water supply project
Blouberg % planning & Construction
None 20% construction of water supply project. 0 households with water access
45% construction of water supply project. 0 households with water access
Nil 8 522 000 17 391 000 MIG CDM BAR
FD-02 Financial Reporting
Financial Reporting
CDM Number of unqualified audit opinion
1 Unqualified audit opinion(without material matters)
1 Unqualified audit opinion(without material matters)
1 Unqualified audit opinion(without material matters)
OPEX OPEX OPEX Equitable Share
CDM BAR
FD-06 Demand Management
Development and implementation of the procurement plan.
CDM Number of municipal procurement plan developed and implemented
1 municipal procurement plan developed and implemented.
1 municipal procurement plan developed and implemented.
1 municipal procurement plan developed and implemented.
OPEX OPEX OPEX Equitable Share
CDM BAR
FD-07 Acquisition Management
Compliance to the SCM regulations
CDM % of compliance to the SCM regulations that result in R nil irregular expenditure
100% compliance to the SCM regulations that result in R nil irregular expenditure
100% compliance to the SCM regulations that result in R nil irregular expenditure
100% compliance to the SCM regulations that result in R nil irregular expenditure
OPEX OPEX OPEX Equitable Share
CDM BAR
TOTAL BUDGET WATER PROJECTS MOLEMOLE LOCAL MUNICIPALITY 29 565 000 44 532 000 40 832 000
TOTAL BUDGET WATER PROJECTS 290 954 000 317 949 000 314 581 000
TOTAL BUDGET INFRASTRUCTURE PROJECTS 334 967 522 370 615 043 368 609 522
Table 88: Strategic Executive Management Services Department (SEMS): Project List and Budget for 2020/21-2022/23 MTERF Budget

154
Project No. Project Name Project Description (major activities)
Location
Key performance indicator
MTERF Targets MTERF Budget (R) Source of Funding
Implementing Agent
EIA/B
2020/21 2021/22 2022/23 2020/21 2021/22 2022/23
INTER-GOVERNMENTAL RELATIONS
SEMSD-01 IGR meetings Coordination of IGR meetings
CDM Number of IGR meetings coordinated
100 IGR meetings coordinated
100 IGR meetings coordinated
100 IGR meetings coordinated
150 000
300 000
300 000
Equitable Share
CDM N/A
SEMSD-02 District Lekgotla Coordination of District Lekgotla
CDM Number of District Lekgotla coordinated
1 District Lekgotla coordinated
1 District Lekgotla coordinated
1 District Lekgotla coordinated
400 000 400 000 400 000 Equitable Share
CDM N/A
TOTAL BUDGET IGR 550 000 700 000 700 000
INTERNAL AUDIT
SEMSD-03 Internal Audit Perform internal audit
CDM Number of internal audit reports produced
4 internal audit reports produced
4 internal audit reports produced
4 internal audit reports produced
70 000
70 000
70 000 Equitable Share
CDM N/A
SEMSD-04 Audit Meetings
Coordinate external audit process, audit committee activities and Municipal support.
CDM Number of audit meetings coordinated
13 Audit meetings coordinated
13 Audit meetings coordinated
13 Audit meetings coordinated
840 000
840 000
840 000 Equitable shares
CDM
N/A
SEMSD-05 Municipal Support
Provide technical support to Local municipalities
CDM Number of municipal support reports issued on improved audit outcomes
4 municipal support reports issued on improved audit outcomes
4 municipal support reports issued on improved audit outcomes
4 municipal support reports issued on improved audit outcomes
OPEX OPEX OPEX Equitable shares
CDM
N/A
TOTAL BUDGET AUDIT 910 000 910 000 910 000
RISK MANAGEMENT
SEMSD-06 Risk assessment workshop, monitoring of risk implementations and training of management
Develop and monitor the risk management register for all departments and risk training of management and staff
CDM Number of risk registers produced, number of risk monitoring reports issued and number of risk trainings of
1 risk register produced, 4 Risk Monitoring reports issued and 1 risk training of
1 risk register produced, 4 Risk Monitoring reports issued and 1 risk training of management
1 risk register produced, 4 Risk Monitoring reports issued and 1 risk training of
OPEX OPEX OPEX
Equitable shares
CDM
N/A

155
Project No. Project Name Project Description (major activities)
Location
Key performance indicator
MTERF Targets MTERF Budget (R) Source of Funding
Implementing Agent
EIA/B
2020/21 2021/22 2022/23 2020/21 2021/22 2022/23
and staff on risk management.
management and staff coordinated
management and staff coordinated
and staff coordinated
management and staff coordinated
SEMSD-07 Risk committee meetings
Coordinate risk committee activities.
CDM Number of risk committee meetings coordinated
4 risk committee meetings coordinated
4 risk committee meetings coordinated
4 risk committee meetings coordinated
OPEX OPEX OPEX
Equitable shares
CDM N/A
SEMSD-08 Fraud prevention programmes (Awareness campaign)
Facilitate fraud prevention programmes
CDM & LMs Number of fraud prevention programmes facilitated (Awareness campaign)
4 Fraud prevention programs facilitated. (Awareness campaign)
4 Fraud prevention programs facilitated. (Awareness campaign)
4 Fraud prevention programs facilitated. (Awareness campaign)
58 000
58 000
58 000 Equitable shares
CDM N/A
SEMSD-09 Forensic investigations
Facilitate fraud prevention programmes
CDM & LMs Percentage of investigations reports prepared as per requests
100% of investigations reports prepared as per requests
100% of investigations reports prepared as per requests
100% of investigations reports prepared as per requests
80 000
80 000
80 000 Equitable shares
CDM N/A
SEMSD-10 Security Management services
Provision of sound physical security services to all municipal premises and employees
CDM Number of security reports issued
12 security reports issued.
12 security reports issued.
12 security reports issued.
19 360 000
21 296 000
23 426 000
Equitable shares
CDM N/A
TOTAL BUDGET RISK MANAGEMENT 19 498 000 21 434 000 23 564 000
COMMUNICATIONS MANAGEMENT
SEMSD-11 Communicate municipal programmes
Review and Implementation of communication strategy, events management guideline, Social Media policy and
CDM Number of Monitoring Report on communication, events management guideline, Social Media policy and
4 Monitoring Reports on communication, events management guideline, Social Media policy and corporate
4 Monitoring Reports on communication, events management guideline, Social Media policy and corporate
4 Monitoring Reports on communication, events management guideline, Social Media policy and corporate
OPEX OPEX OPEX Equitable shares
CDM N/A

156
Project No. Project Name Project Description (major activities)
Location
Key performance indicator
MTERF Targets MTERF Budget (R) Source of Funding
Implementing Agent
EIA/B
2020/21 2021/22 2022/23 2020/21 2021/22 2022/23
corporate image Manual
corporate image Manual developed
image Manual developed
image Manual developed
image Manual developed
SEMSD-12 Communication programmes (Advertising, publications, publicity, stakeholder participation and media relation programmes)
Communication of municipal programmes
CDM Percentage of communication programmes coordinated and publicised (Advertising, publications, publicity, stakeholder participation and media relation programmes)
100% of communication programmes coordinated and publicised (Corporate image and branding, Advertising, publications, publicity, events and stakeholder participation and media relation programmes)
100% of communication programmes coordinated and publicised (Corporate image and branding, Advertising, publications, publicity, events and stakeholder participation and media relation programmes)
100% of communication programmes coordinated and publicised (Corporate image and branding, Advertising, publications, publicity, events and stakeholder participation and media relation programmes)
3 250 000
3 650 000
3 650 000
Equitable shares
CDM N/A
SEMSD-13 District Communicator programme
District communicators programme coordinated
CDM Number of district communicators programme coordinated
4 district communicators programme coordinated
4 district communicators programme coordinated
4 district communicators programme coordinated
OPEX OPEX OPEX Equitable CDM N/A
SEMSD-14 Monitoring of Thusong Service Centers
Monitor all Thusong Service Centers and consolidated reports
CDM Percentage of Thusong Service Centers monitored and 4 consolidated reports produced
4 Thusong Service Centers monitored and 4 consolidated reports produced
4 Thusong Service Centers monitored and 4 consolidated reports produced
4 Thusong Service Centers monitored and 4 consolidated reports produced
OPEX OPEX OPEX Equitable Share
CDM N/A

157
Project No. Project Name Project Description (major activities)
Location
Key performance indicator
MTERF Targets MTERF Budget (R) Source of Funding
Implementing Agent
EIA/B
2020/21 2021/22 2022/23 2020/21 2021/22 2022/23
SEMSD-15 Customer care Management
Customer Care complaints and queries management through Call Centre
CDM Percentage of Customer Care complaints and queries received and resolved within 30 days period through Call Centre System
100% of Customer Care complaints and queries received and resolved within 30 days period through Call Centre System
100% of complaints and queries received and resolved within 30 days period through Call Centre System
100% of complaints and queries received and resolved within 30 days period through Call Centre System
500 000 500 000 500 000 Equitable Share
CDM N/A
SEMSD-16 Coordination and monitoring of District Bathopele forum
Coordinate district Bathopele monitoring forums
CDM Number of District monitoring forums coordinated
2 District Bathopele monitoring conducted and 4 forums coordinated.
2 District Bathopele monitoring conducted and 4 forums coordinated.
2 District Bathopele monitoring conducted and 4 forums coordinated.
250 000 250 000 250 000 Equitable Share
CDM N/A
TOTAL BUDGET COMMUNICATIONS MANAGEMENT 4 000 000 4 400 000 4 400 000
INSTITUTIONAL AND SOCIAL DEVELOPMENT
SEMSD-17 Facilitation of Service Delivery Projects
Facilitation of Project Steering Committees, key stakeholders, scope of works agreements, site hand overs, conflict management and resolution
CDM Percentage of approved service delivery projects facilitated for planning and implementation
100% of approved service delivery projects facilitated for planning and implementation
100% of approved service delivery projects facilitated for planning and implementation
100% of approved service delivery projects facilitated for planning and implementation
OPEX OPEX OPEX Equitable share
CDM
N/A
SEMSD-18 Job creation facilitation
Facilitation of job opportunities and training in the implementation of approved water and
CDM Number of job opportunities created in the implementation of approved water and
800 job opportunities created in the implementation of
800 job opportunities created in the implementation of
900 job opportunities created in the implementation of approved water and
OPEX OPEX OPEX Equitable share
CDM
N/A

158
Project No. Project Name Project Description (major activities)
Location
Key performance indicator
MTERF Targets MTERF Budget (R) Source of Funding
Implementing Agent
EIA/B
2020/21 2021/22 2022/23 2020/21 2021/22 2022/23
sanitation projects using EPWP guidelines
sanitation projects
approved water and sanitation projects
approved water and sanitation projects
sanitation projects
SEMSD-19 Water and Sanitation Community Forum coordination
Coordination of Water and Sanitation Community Forum
CDM Number of Water and Sanitation Community Forum coordinated
4 Water and Sanitation Community Forum coordinated
4 Water and Sanitation Community Forum coordinated
4 Water and Sanitation Community Forum coordinated
OPEX OPEX OPEX Equitable share
CDM
N/A
SEMSD-20 District Sanitation Task Team coordination
Coordination of District Sanitation Task Team
CDM Number of District Sanitation Task Team coordinated
4 District Sanitation Task Team coordinated
4 District Sanitation Task Team coordinated
4 District Sanitation Task Team coordinated
OPEX OPEX OPEX Equitable share
CDM
N/A
TOTAL BUDGET INSTITUTIONAL AND SOCIAL DEVELOPMENT OPEX OPEX OPEX
INSTITUTIONAL PERFORMANCE,PLANNING, MONITORING AND EVALUATION
SEMSD-21 Development and review of Service Delivery and Budget Implementation Plan
Coordination of the development and review of organizational Service Delivery and Budget implementation Plan (SDBIP)
CDM Number of organizational Service Delivery and Budget Implementation Plans (SDBIP) developed and reviewed
2 Service delivery and Budget Implementation Plans (SDBIP) developed and reviewed
2 Service delivery and Budget Implementation Plans (SDBIP) developed and reviewed
2 Service delivery and Budget Implementation Plans (SDBIP) developed and reviewed
OPEX OPEX OPEX Equitable shares
CDM
N/A
SEMSD-22 Monitoring and evaluation
Monitoring and evaluation of organizational performance reports
CDM Number of organizational performance reports produced
7 organizational performance reports produced
7 organizational performance reports produced
7 organizational performance reports produced
OPEX OPEX OPEX Equitable shares
CDM N/A
SEMSD-23 Back to Basics Compilations of Back to Basics reports
CDM Number of Back to Basics reports produced
4 Back to Basics reports produced
4 Back to Basics reports produced
4 Back to Basics reports produced
OPEX OPEX OPEX Equitable shares
CDM N/A
TOTAL BUDGET INSTITUTIONAL PERFORMANCE,PLANNING, MONITORING AND EVALUATION OPEX OPEX OPEX

159
Project No. Project Name Project Description (major activities)
Location
Key performance indicator
MTERF Targets MTERF Budget (R) Source of Funding
Implementing Agent
EIA/B
2020/21 2021/22 2022/23 2020/21 2021/22 2022/23
SPECIAL FOCUS
SEMSD-24 Special Focus Programmes
Special Focus Programmes Coordination (Children, Disability, Gender, Older Persons and Youth Programmes)
All local municipalities
Number of Special Focus Programmes Coordinated
80 Special Focus programmes coordinated. (12 Children, 12 disability, 24 Gender 12 older persons, 20 Youth development programmes coordinated).
80 Special Focus programmes coordinated. (12 Children, 12 disability, 24 Gender 12 older persons, 20 Youth development programmes coordinated).
80 Special Focus programmes coordinated. (12 Children, 12 disability, 24 Gender 12 older persons, 20 Youth development programmes coordinated).
529 000 529 000 529 000 Equitable shares
CDM
N/A
SEMSD-25 HIV & AIDS Programmes (Governance, Coordination, Prevention Care & Support, Capacity Building, CBO/NGOs Summit and Monitoring & Evaluation)
HIV & AIDS Programmes Coordination
All local municipalities
Number of HIV & AIDS Programmes Coordinated
32 HIV & AIDS Programmes coordinated (Governance, Coordination, Prevention, Care & Support, Capacity Building, Civil Society Summit and Monitoring & Evaluation)
32 HIV & AIDS Programmes coordinated (Governance, Coordination, Prevention, Care & Support, Capacity Building, Civil Society Summit and Monitoring & Evaluation)
32 HIV & AIDS Programmes coordinated (Governance, Coordination, Prevention, Care & Support, Capacity Building, Civil Society Summit and Monitoring & Evaluation)
481 000 481 000 481 000 Equitable shares
CDM N/A
TOTAL BUDGET SPECIAL FOCUS 1 010 000 1 010 000 1 010 000
OFFICE OF THE CHIEF WHIP
SEMSD-26 Whippery Management meetings
Coordination of Whippery meetings
CDM Number of Whippery meetings coordinated
6 Whippery meetings coordinated
6 Whippery meetings coordinated
6 Whippery meetings coordinated
108 000
108 000
1080 000 Equitable shares
CDM N/A

160
Project No. Project Name Project Description (major activities)
Location
Key performance indicator
MTERF Targets MTERF Budget (R) Source of Funding
Implementing Agent
EIA/B
2020/21 2021/22 2022/23 2020/21 2021/22 2022/23
SEMSD-27 Reports of the Chief Whip
Compilation of Mandatory reports of the Chief Whip
CDM Number of mandatory reports of the Chief Whip submitted to Council
4 mandatory reports of the Chief Whip submitted to Council
4 mandatory reports of the Chief Whip submitted to Council
4 mandatory reports of the Chief Whip submitted to Council
OPEX OPEX OPEX Equitable shares
CDM N/A
TOTAL BUDGET OFFICE OF THE CHIEFWHIP 108 000 108 000 108 000
OFFICE OF THE SPEAKER (COUNCIL SUPPORT)
SEMSD-28 Council Meetings
Coordination of Council meetings
CDM Number of council Meetings coordinated
6 Council Meetings Coordinated
6 Council Meetings Coordinated
6 Council Meetings Coordinated
100 000 100 000 100 000 Equitable shares
CDM N/A
SEMSD-29 Committee Meetings
Coordination of Committee meetings
CDM Number of Committee Meetings coordinated
99 Committee Meetings coordinated
99 Committee Meetings coordinated
99 Committee Meetings coordinated
OPEX OPEX OPEX Equitable shares
CDM N/A
SEMSD-30 Mandatory reports of the Speaker
Compilation of Mandatory reports of the Speaker
CDM Number of mandatory reports of the Speaker submitted to Council.
4 mandatory reports of the Speaker submitted to Council.
4 mandatory reports of the Speaker submitted to Council.
4 mandatory reports of the Speaker submitted to Council.
OPEX OPEX OPEX Equitable shares
CDM N/A
SEMSD-31 Management and Executive Management meetings
Coordination of Management and Executive Management meetings
CDM Number of Management and Executive Management meetings coordinated
49 Management and Executive Management meetings coordinated
49 Management and Executive Management meetings coordinated
49 Management and Executive Management meetings coordinated
OPEX OPEX OPEX Equitable shares
CDM N/A
SEMSD-32 Project Site visits
Coordination of Committees Site visits
CDM Number of Site Visits coordinated
30 Site Visits coordinated
30 Site Visits coordinated
30 Site Visits coordinated
40 000
40 000
40 000 Equitable shares
CDM N/A
SEMSD-33 Oversight programmes (MPAC)
Coordination of Public hearings
CDM Number of Oversight programmes coordinated.
6 Oversight programmes coordinated.
6 Oversight programmes coordinated.
6 Oversight programmes coordinated.
300 000 300 000 300 000 Equitable shares
CDM N/A

161
Project No. Project Name Project Description (major activities)
Location
Key performance indicator
MTERF Targets MTERF Budget (R) Source of Funding
Implementing Agent
EIA/B
2020/21 2021/22 2022/23 2020/21 2021/22 2022/23
SEMSD-34 Ethics programmes
Coordination of Ethics programmes
CDM Number of working sessions coordinated.
1 working session coordinated.
1 working session coordinated.
1 working session coordinated.
50 000 50 000 50 000 Equitable shares
CDM N/A
SEMSD-35 Public Participation programmes (Council Outreaches/Imbizo)
Coordination of Council Outreaches/Imbizo
CDM Number of Council Outreaches/Imbizo coordinated.
4 Council Outreaches/imbizo coordinated
4 Council Outreaches/imbizo coordinated
4 Council Outreaches/imbizo coordinated
421 000
521 000
521 000 Equitable shares
CDM N/A
SEMSD-36 Youth Parliament
Coordination of Youth Parliament
CDM Number of Youth Parliament coordinated
1 Youth Parliament coordinated
1 Youth Parliament coordinated
1 Youth Parliament coordinated
100 000
100 000
100 000 Equitable shares
CDM N/A
SEMSD-37 Women Parliament
Coordination of Women Parliament
CDM Number of Women Parliament coordinated
1 Women Parliament coordinated
1 Women Parliament coordinated
1 Women Parliament coordinated
85 000
85 000
85 000 Equitable shares
CDM N/A
SEMSD-38 Ward Committee Support
Strengthen capacity of ward committees
CDM Number of capacity building programmes coordinated
1 Ward Committee Capacity Building Programme coordinated
1 Ward Committee Capacity Building Programme coordinated
1 Ward Committee Capacity Building Programme coordinated
400 000
400 000
400 000 Equitable shares
CDM N/A
TOTAL BUDGET OFFICE OF THE SPEAKER 1 496 000 1 596 000 1 596 000
OFFICE OF EXECUTIVE MAYOR
SEMSD-39 State of the District Address
Coordination of State of the District Address
CDM Number of State of the District Address coordinated
1 State of the District Address coordinated.
1 State of the District Address coordinated.
1 State of the District Address coordinated.
800 000 1 000 000 1 000 000
Equitable shares
CDM N/A
SEMSD-40 Mayoral outreach programme
Coordination of Mayoral outreach programmes
CDM Number of Mayoral Outreaches programmes coordinated
4 Mayoral Outreaches programmes coordinated.
4 Mayoral Outreaches programmes coordinated.
4 Mayoral Outreaches programmes coordinated.
535 000
535 000
535 000 Equitable shares
CDM
N/A

162
Project No. Project Name Project Description (major activities)
Location
Key performance indicator
MTERF Targets MTERF Budget (R) Source of Funding
Implementing Agent
EIA/B
2020/21 2021/22 2022/23 2020/21 2021/22 2022/23
SEMSD-41 Educational Support Programme
Coordination of the Educational Support Programme
CDM Number of Educational Support Programme coordinated.
2 Educational Support Programme coordinated
2 Educational Support Programme coordinated.
2 Educational Support Programme coordinated.
385 000 385 000 385 000 Equitable shares
CDM N/A
SEMSD-42 Traditional Authority/Magoshi Support Forums
Coordination and support to Traditional Authority/Magoshi Forums
CDM Number of Traditional Authority/Magoshi Support Forums coordinated.
4 Traditional/Magoshi support Forums coordinated.
4 Traditional/Magoshi support Forums coordinated
4 Traditional/Magoshi support Forums coordinated.
250 000 250 000 250 000 Equitable Share
CDM N/A
FD-02 Financial Reporting
CDM Number of unqualified audit opinion
1 Unqualified audit opinion(without material matters)
1 Unqualified audit opinion(without material matters)
1 Unqualified audit opinion(without material matters)
OPEX OPEX OPEX Equitable Shares
CDM N/A
FD-06 Demand Management
Development and implementation of the procurement plan.
CDM Number of municipal procurement plan developed and implemented
1 municipal procurement plan developed and implemented.
1 municipal procurement plan developed and implemented.
1 municipal procurement plan developed and implemented.
OPEX OPEX OPEX Equitable Shares
CDM N/A
FD-07 Acquisition Management
Compliance to the SCM regulations
CDM % of compliance to the SCM regulations that result in R nil irregular expenditure
100% compliance to the SCM regulations that result in R nil irregular expenditure
100% compliance to the SCM regulations that result in R nil irregular expenditure
100% compliance to the SCM regulations that result in R nil irregular expenditure
OPEX OPEX OPEX Equitable Shares
CDM N/A
TOTAL BUDGET EXECUTIVE MAYOR OFFICE 1 970 000 2 170 000 2 170 000
TOTAL BUDGET STRATEGIC EXECUTIVE MANAGEMENT SERVICES (SEMS) 29 542 000 32 328 000 34 458 000
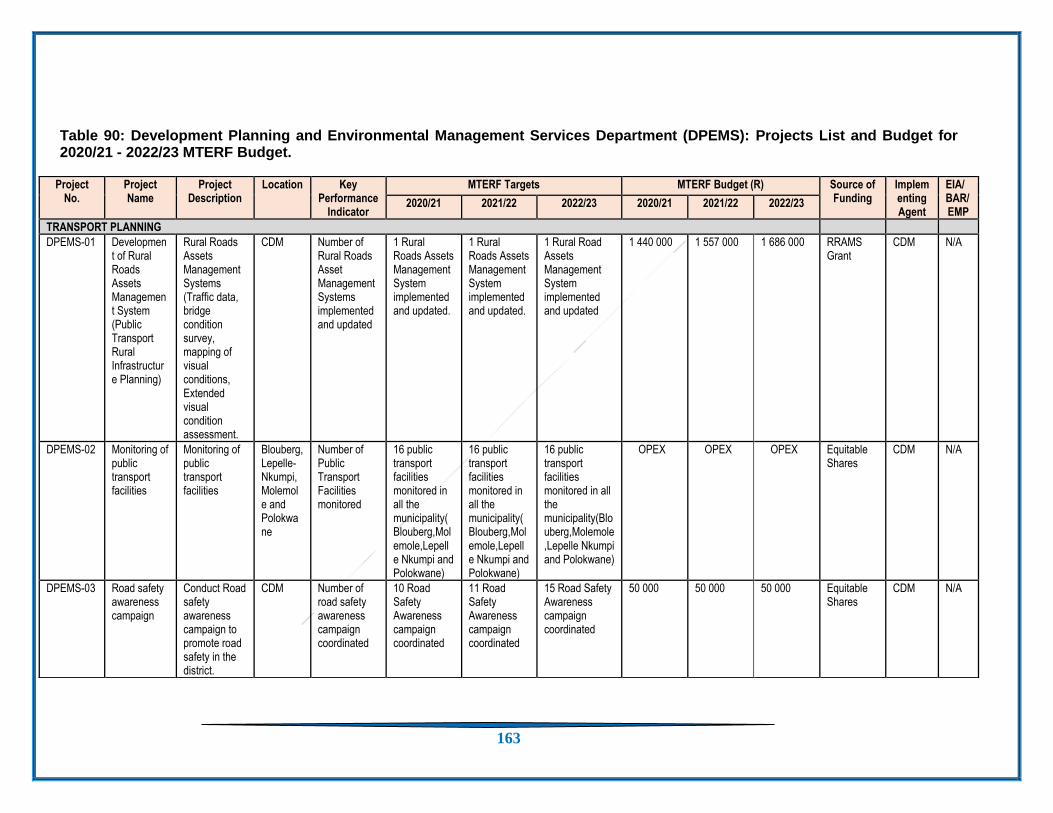
163
Table 90: Development Planning and Environmental Management Services Department (DPEMS): Projects List and Budget for 2020/21 - 2022/23 MTERF Budget.
Project No.
Project Name
Project Description
Location Key Performance
Indicator
MTERF Targets MTERF Budget (R) Source of Funding
Implementing Agent
EIA/BAR/ EMP
2020/21 2021/22 2022/23 2020/21 2021/22 2022/23
TRANSPORT PLANNING
DPEMS-01
Development of Rural Roads Assets Management System (Public Transport Rural Infrastructure Planning)
Rural Roads Assets Management Systems (Traffic data, bridge condition survey, mapping of visual conditions, Extended visual condition assessment.
CDM Number of Rural Roads Asset Management Systems implemented and updated
1 Rural Roads Assets Management System implemented and updated.
1 Rural Roads Assets Management System implemented and updated.
1 Rural Road Assets Management System implemented and updated
1 440 000 1 557 000
1 686 000 RRAMS Grant
CDM N/A
DPEMS-02 Monitoring of public transport facilities
Monitoring of public transport facilities
Blouberg, Lepelle-Nkumpi, Molemole and Polokwane
Number of Public Transport Facilities monitored
16 public transport facilities monitored in all the municipality(Blouberg,Molemole,Lepelle Nkumpi and Polokwane)
16 public transport facilities monitored in all the municipality(Blouberg,Molemole,Lepelle Nkumpi and Polokwane)
16 public transport facilities monitored in all the municipality(Blouberg,Molemole,Lepelle Nkumpi and Polokwane)
OPEX OPEX OPEX Equitable Shares
CDM N/A
DPEMS-03 Road safety awareness campaign
Conduct Road safety awareness campaign to promote road safety in the district.
CDM Number of road safety awareness campaign coordinated
10 Road Safety Awareness campaign coordinated
11 Road Safety Awareness campaign coordinated
15 Road Safety Awareness campaign coordinated
50 000 50 000 50 000 Equitable Shares
CDM N/A

164
DPEMS-04 Transport Forum Engagement
Conduct Transport Forum Engagement
CDM Number of Transport Forum engagements coordinated
4 Transport Forum engagements coordinated
4 Transport Forum engagements coordinated
4 Transport Forum engagements coordinated
OPEX OPEX OPEX Equitable Shares
CDM N/A
TOTAL BUDGET TRANSPORT 1 490 000 1 607 000 1 736 000
Project No.
Project Name
Project Description
Location Key Performance Indicator
MTERF Targets MTERF Budget (R) Source of Funding
Implementing Agent
EIA/BAR/EMP
2020/21 2021/22 2022/23 2020/21 2021/22 2022/23
ENVIRONMENTAL MANAGEMENT
DPEMS-05 Provision of waste equipment for local municipalities
Provision of waste equipment for local municipalities
3 Local municipalities
Number of local municipalities provided with waste equipment
3 local municipalities provided with waste equipment
3 local municipalities provided with waste equipment
3 local municipalities provided with waste equipment
5 438 000 5 418 000 5 413 000 Equitable Shares
CDM N/A
DPEMS-06 Provide recycling units / depots
Provision of recycling units / depots for municipalities
All municipal areas
Number of recycling units / bins provided to local municipalities
32 recycling units / bins provided to local municipalities
32 recycling units / bins provided to local municipalities
32 recycling units / bins provided to local municipalities
600 000 400 000 400 000 Equitable Shares
CDM N/A
DPEMS-07 Laboratory analysis air quality (Air quality monitoring)
Passive ambient air quality monitoring (Laboratory Analysis Air Quality)
All municipal areas
Number of reports on passive ambient air quality monitoring results compiled
4 reports on passive ambient air quality monitoring results compiled
4 reports on passive ambient air quality monitoring results compiled
4 reports on passive ambient air quality monitoring results compiled
23 000 23 000 23 000 Equitable Shares
CDM N/A
DPEMS-08 Air quality monitoring (Calibration and Repair of equipment)
Calibration & Repair of air quality monitoring equipment
CDM Number of air quality monitoring equipment calibrated & repaired
5 air quality monitoring equipment calibrated & repaired
5 air quality monitoring equipment calibrated & repaired
5 air quality monitoring equipment calibrated & repaired
100 000 100 000 100 000 Equitable Shares
CDM N/A

165
DPEMS-09 Operation & maintenance of a continuous ambient air quality monitoring station
Operation and maintenance of a continuous air quality monitoring station
Polokwane LM
Number of continuous air quality monitoring reports compiled
12 continuous air quality monitoring reports compiled
12 continuous air quality monitoring reports compiled
12 continuous air quality monitoring reports compiled
1 400 000 1 500 000 1 500 000 Equitable shares
CDM N/A
DPEMS-10 Environmental compliance, inspections and enforcement)
Undertake compliance, monitoring, inspections and enforcement actions.
CDM Number of environmental compliance, monitoring, inspection & enforcement reports compiled
20 Environmental compliance, monitoring inspection reports compiled
20 Environmental compliance, monitoring inspection reports compiled
20 Environmental compliance, monitoring inspection reports compiled
20 000 20 000 20 000 Equitable shares
CDM N/A
DPEMS-11 Greening and beautifying the district
Planting of trees All municipal areas
Number of trees planted
800 trees planted
800 trees planted
800 trees planted
535 000 535 000 535 000 Equitable Shares
CDM N/A
DPEMS-12
Renewable energy sources
Provide alternative energy sources to households (Bio digesters)
All municipal areas
Number of households provided with alternative energy sources (Bio digesters)
5 Households equipped with alternative energy sources (Bio digesters)
None None 800 000 Nil Nil
Equitable Shares
CDM / University of Venda
N/A
DPEMS-13 Alien plant eradication project
Eradication of alien plants
All municipal areas
Number of EPWP jobs created
100 EPWP jobs created
150 EPWP jobs created
150 EPWP jobs created
1 200 000 1 800 000 1 800 000
Equitable Shares
CDM / Local Municipalities
N/A
DPEMS-14 Support to Wildlife and Environmental Society of South Africa (WESSA) Eco Schools Environmental Education awareness campaign
Support provided to WESSA Eco Schools Environmental Education campaign
CDM
Number of signed MoUs for transfer of funds to WESSA and number of progress reports on eco-school activities
1 signed MoU and 4 progress reports on eco-School activities
1 signed MoU and 4 progress reports on eco-School activities
1 signed MoU and 4 progress reports on eco-School activities
250 000 250 000 250 000 Equitable Shares
CDM N/A

166
DPEMS-15 Environmental awareness campaigns
Development of promotional materials for environmental awareness campaigns
All municipal areas
Number of environmental promotional materials developed
4 Promotional materials developed
4 Promotional materials developed
4 Promotional materials developed
100 000 418 000 420 000 Equitable Shares
CDM N/A
TOTAL BUDGET ENVIRONMENTAL MANAGEMENT 10 466 000 10 464 000 10 461 000
Project No. Project Name
Project Description
Location Key Performance Indicator
MTERF Targets MTERF Budget (R) Source of Funding
Implementing Agent
EIA/BAR/EMP
2020/21 2021/22 2022/23 2020/21 2021/22 2022/23
INTEGRATED DEVELOPMENT PLANNING (IDP)
DPEMS-16 Review of IDP/Budget
Review of Integrated Development Plan
CDM Number of IDP/Budget developed/reviewed
1 IDP/Budget developed
1 IDP/Budget reviewed
1 IDP/Budget reviewed
649 000 749 000 749 000 Equitable Shares
CDM N/A
DPEMS-17 Strategic Planning Sessions
Coordination of strategic planning sessions
CDM Number of strategic planning sessions coordinated
8 strategic planning sessions coordinated
8 strategic planning sessions coordinated
8 strategic planning sessions coordinated
400 000 550 000 550 000 Equitable Shares
CDM N/A
DPEMS-18
IDP Awareness Sessions
Co-ordination of IDP awareness sessions
CDM Number of IDP awareness sessions
4 IDP awareness sessions co-ordinated
4 IDP awareness sessions co-ordinated
4 IDP awareness sessions co-ordinated
70 000 70 000 70 000 Equitable Shares
CDM N/A

167
co-ordinated
DPEMS-19
Implementation of 2040 GDS
Implementation of 2040 GDS
CDM Number of reports on implementation of 2040 GDS developed
4 reports on implementation of 2040 GDS
4 reports on implementation of 2040 GDS
4 reports on implementation of 2040 GDS
OPEX OPEX OPEX Equitable Shares
CDM N/A
TOTAL BUDGET IDP 1 119 000 1 369 000 1 369 000
SPATIAL PLANNING
DPEMS-20 Implementation of SPLUMA (District Municipal Planning Tribunal)
Coordination of District Municipal Planning Tribunal
CDM Number of reports on the District Municipal Planning Tribunal
4 reports on the District Municipal Planning Tribunal
4 reports on the District Municipal Planning Tribunal
4 reports on the District Municipal Planning Tribunal
150 000 150 000 150 000 Equitable Shares
CDM N/A
DPEMS-21 Implementation of SDF
CDM Number of SDF projects implemented
1 SDF project implemented
1 SDF project implemented
1 SDF project implemented
500 000 500 000 500 000 Equitable Shares
CDM N/A
DPEMS-22 Spatial planning awareness sessions
Coordination of Spatial planning awareness sessions
CDM Number of spatial planning awareness session coordinated
1 Spatial planning awareness sessions coordinated
1 Spatial planning awareness sessions coordinated
2 Spatial planning awareness sessions coordinated
50 000 50 000 50 000 Equitable Shares
CDM N/A
DPEMS-23 Management of CDM GIS Systems
GIS Coordination.
CDM Number of reports on GIS coordination.
4 reports on GIS Coordination.
4 reports on GIS Coordination.
4 reports on GIS Coordination.
50 000 50 000 50 000 Equitable Shares
CDM N/A
TOTAL BUDGET SPATIAL PLANNING 750 000 750 000 750 000

168
Project No. Project Name
Project Description
Location Key Performance Indicator
MTERF Targets MTERF Budget (R) Source of Funding
Implementing Agent
EIA/BAR/EMP
2020/21 2021/22 2022/23 2020/21 2021/22
2022/23
LOCAL ECONOMIC DEVELOPMENT (LED)
DPEMS-27 LED stakeholder engagement
Hosting of LED forum meetings to integrate plans
CDM Number of LED Forum Meetings held.
4 LED Forum Meetings held.
4 LED Forum Meetings held.
4 LED Forum Meetings held.
OPEX OPEX OPEX Equitable Shares
CDM N/A
DPEMS-28 CDM Economic Profile
Compilation of district economic profile
CDM Number of Economic Profiles produced.
1 economic profile produced
1 economic profile produced
1 economic profile produced
OPEX OPEX OPEX Equitable Shares
CDM N/A
DPEMS-29 Job creation monitoring
Monitor and report on the number of jobs created in the district.
CDM Number of job creation reports developed
4 job creation reports developed
4 job creation reports developed
4 job creation reports developed
OPEX OPEX OPEX Equitable Shares
CDM N/A
DPEMS-30 Entrepreneurship Support (farmers)
Supporting farmers with linkages and information
CDM Number of SMMEs supported in farming
10 farmers supported with linkage to markets and information
10 farmers supported with linkage to markets and information
10 farmers supported with linkage to markets and information
200 000 200 000
200 000 Equitable Shares
CDM N/A
DPEMS-31 Entrepreneurship Support (SMMEs incubation)
Incubation of SMMEs
CDM Number of SMMEs incubated
20 SMMEs incubated
20 SMMEs incubated
20 SMMEs incubated
850 000 460 000
460 000 Equitable Shares
CDM N/A
DPEMS-32 Entrepreneurship Support (SMMEs Exhibitions and Transport)
Coordination of SMMEs exhibitions
CDM Number of SMME exhibitions coordinated
5 Exhibitions coordinated
5 Exhibitions coordinated
5 Exhibitions coordinated
1 200 000 614 000
614 000 Equitable Shares
CDM N/A
DPEMS-33 Support to Hawkers
Planning, designs and construction of hawkers stalls
Boyne Number of progress reports developed.
4 progress reports developed.
4 progress
reports
developed.
4 progress
reports
developed.
OPEX OPEX OPEX Equitable Shares
CDM N/A
DPEMS-34 Motumo Trading Post
Development of Motumo Trading Post
CDM Number of Monitoring Reports developed
4 Monitoring Reports developed
4 Monitoring Reports developed
4 Monitoring Reports developed
OPEX OPEX OPEX Equitable Shares
CDM N/A
DPEMS-35 Agri-Parks Development of an Agri-Park in the District
CDM Number of monitoring reports developed.
4 monitoring reports developed
4 monitoring reports developed
4 monitoring reports developed
OPEX OPEX OPEX Equitable Shares
CDM N/A
DPEMS-36 Monitoring of SETAS
Monitoring of SETAS
CDM Number of monitoring
4 monitoring reports developed
4 monitoring reports developed
4 monitoring reports developed
OPEX OPEX OPEX Equitable Shares
CDM N/A

169
initiatives in the district
initiatives in the district
reports developed
DPEMS-37 Investment Attraction
Support investment attraction opportunities
CDM Number of Investment initiatives undertaken
1 Investment Initiative undertaken
1 Investment Initiative undertaken
1 Investment Initiative undertaken
160 000 160 000 160 000 Equitable Shares
CDM N/A
TOTAL BUDGET LED 2 410 000 1 434 000
1 434 000
Project No. Project Name
Project Description
Location Key Performance Indicator
MTERF Targets MTERF Budget (R) Source of Funding
Implementing Agent
EIA/BAR/EMP
2020/21 2021/22 2022/23 2020/21 2021/22 2022/23
EXPANDED PUBLIC WORKS PROGRAMME
DPEMS-24 EPWP Coordination
EPWP Forums
CDM Number of EPWP Forums coordinated
4 EPWP Forums coordinated
4 EPWP Forums coordinated
4 EPWP Forums coordinated
OPEX OPEX OPEX Equitable Shares
CDM N/A
DPEMS-25 EPWP Coordination
EPWP work opportunities created
CDM Number of EPWP work opportunities created
2 800 EPWP work opportunities created
3 000 EPWP work opportunities created
3 000 EPWP work opportunities created
OPEX OPEX OPEX Equitable Shares
CDM N/A
DPEMS-26 Implementation of EPWP grant projects
Implementation of EPWP grant projects
CDM Number of EPWP grant projects implemented
8 EPWP grant projects implemented
8 EPWP grant projects implemented
8 EPWP grant projects implemented
500 000 Grant Allocation
Grant Allocation
EPWP Grant
CDM N/A
TOTAL BUDGET EXPANDED PUBLIC WORKS PROGRAMME 500 000 OPEX OPEX
Project No. Project Name
Project Description
Location Key Performance Indicator
MTERF Targets MTERF Budget (R) Source of Funding
Implementing Agent
EIA/BAR/EMP 2020/21 2021/22 2022/23 2020/21 2021/22 2022/23
FD-02 Financial Reporting
CDM Number of unqualified audit opinion
1 Unqualified audit opinion(without material matters)
1 Unqualified audit opinion(without material matters)
1 Unqualified audit opinion(without material matters)
OPEX OPEX OPEX Equitable Shares
CDM N/A

170
Table 92: Community Services Department: Project List and Budget for 2020/21-2022/23 MTERF Budget
Project No. Project Name
Project Description (major activities)
Location
Key performance indicator
MTERF Targets MTERF Budget (R) Source of Funding
Implementing Agent
EIA/BAR/EMP
2020/21 2021/22 2022/23 2020/21 2021/22 2022/23
EMERGENCY SERVICES (FIRE AND RESCUE)
CMSD-01 Extrication Equipment
Procurement of extrication equipment
CDM Number of set of extrication equipment procured.
1 set of extrication equipment procured
1 set of extrication equipment procured
1 set of extrication equipment procured
700 000 700 000 700 000
Equitable Share
CDM N/A
CMSD-02 Fire safety awareness programme
Fire safety week CDM area Number of Fire safety awareness events held.
1 fire safety awareness event held.
1 fire safety awareness event held.
1 fire safety awareness event held.
225 000 225 000 225 000
Equitable Share
CDM N/A
CMSD-03 Miscellaneous equipment
Procurement of small gear equipment and tools
CDM Number of set of small gear equipment and tools procured
1 set of small gear equipment and tools procured
1 set of small gear equipment and tools procured
1 set of small gear equipment and tools procured
1 200 000 400 000 400 000
Equitable Share
CDM N/A
CMSD-04 High Pressure grass skid units
Procurement of high pressure skid units
CDM Number of high pressure skid units procured
8 high pressure skid units procured
None None 400 000 Nil Nil Equitable Share
CDM N/A
CMSD-05 Complete Breathing
Procurement of complete
CDM Number set of complete Breathing
1 set of complete Breathing
1 set of complete Breathing
None 400 000 800 000 Nil Equitable Share
CDM N/A
FD-06 Demand Management
Development and implementation of the procurement plan.
CDM Number of municipal procurement plan developed and implemented
1 municipal procurement plan developed and implemented.
1 municipal procurement plan developed and implemented.
1 municipal procurement plan developed and implemented.
OPEX OPEX OPEX Equitable Shares
CDM N/A
FD-07 Acquisition Management
Compliance to the SCM regulations
CDM % of compliance to the SCM regulations that result in R nil irregular expenditure
100% compliance to the SCM regulations that result in R nil irregular expenditure
100% compliance to the SCM regulations that result in R nil irregular expenditure
100% compliance to the SCM regulations that result in R nil irregular expenditure
OPEX OPEX OPEX Equitable Shares
CDM N/A
TOTAL BUDGET DPEMS 16 735 000 15 624 000 15 750 000

171
Project No. Project Name
Project Description (major activities)
Location
Key performance indicator
MTERF Targets MTERF Budget (R) Source of Funding
Implementing Agent
EIA/BAR/EMP
2020/21 2021/22 2022/23 2020/21 2021/22 2022/23
Apparatus sets
Breathing Apparatus sets
Apparatus sets procured
Apparatus sets procured
Apparatus sets procured
CMSD-06 Hazardous material equipment
Procurement of Hazardous material equipment
CDM Number of set of hazardous material equipment procured
None None 1 set of hazardous material equipment procured
Nil Nil
800 000
Equitable Share
CDM N/A
CMSD-07 Office Machinery/Equipment and cascade system
Maintenance of Office Machinery/Equipment and cascade system
CDM Number of set of Office Machinery/Equipment and cascade system maintained
1 set of Office Machinery/Equipment and cascade system maintained
1 set of Office Machinery/Equipment and cascade system maintained
1 set of Office Machinery/Equipment and cascade system maintained
150 000
150 000 150 000
Equitable Share
CDM N/A
CMSD-08 Library and training materials
Library and training material procured
CDM Number of set of library and training material procured
1 set of library and training material procured
1 set of library and training material procured
1 set of library and training material procured
25 000 25 000 25 000 Equitable Share
CDM N/A
CMSD-09 Fire Station TT Cholo
Establishment of TT Cholo Fire Station
CDM Percentage establishment of TT Cholo fire station
100% establishment of TT Cholo fire station
None None 200 000 Nil Nil Equitable Share
CDM N/A
TOTAL BUDGET EMERGENCY SERVICES (FIRE AND RESCUE) 3 300 000 2 300 000 2 300 000
DISASTER MANAGEMENT SERVICE
CMSD-10 Disaster risk management capacity building workshops for community based structures.
Capacity building workshops on disaster management for community based structures.
LMs Number of Disaster Management Capacity building workshops conducted
4 disaster management Capacity building workshops conducted
4 disaster management Capacity building workshops conducted
5 disaster management Capacity building workshops conducted
60 000 60 000 100 000
Equitable Share
CDM N/A

172
Project No. Project Name
Project Description (major activities)
Location
Key performance indicator
MTERF Targets MTERF Budget (R) Source of Funding
Implementing Agent
EIA/BAR/EMP
2020/21 2021/22 2022/23 2020/21 2021/22 2022/23
CMSD-11 Recruitment, engagement and registration of disaster management volunteers
Recruitment, engagement and registration of disaster management volunteers
CDM Number of Disaster management volunteers engaged and monitored
50 Disaster management volunteers engaged and monitored
50 Disaster management volunteers engaged and monitored
50 Disaster management volunteers engaged and monitored
230 000 250 000 300 000
Equitable Share
CDM N/A
CMSD-12 Procurement of Disaster relief materials and shelters
Procurement of disaster relief material (tents, sleeping mattress, blankets, lamps, salvage sheets, foldable shacks)
CDM Number of Disaster relief material and shelters procured
Procurement of 30, tents, 250 sleeping mattress,1200 blankets, 250 lamps, and 220 salvage sheets, 45 single burner canister , 45 canister burner, 5 foldable shacks and 5 Solar lighting system
Procurement of 50, tents, 300 sleeping mattress, 1000 blankets, 250 lamps, and 230 salvage sheets, 40 single burner canister , 40 canister burner, 5 foldable shacks and 5 Solar lighting system
Procurement of 100, tents, 600 sleeping mattress, 2000 blankets, 300 lamps, and 280 salvage sheets, 60 single burner canister , 60 canister burner, 15 foldable shacks and 15 Solar lighting system
2 100 000 1 400 000
1 600 000
Equitable Share
CDM N/A
CMSD-13 Disaster management awareness services
Commemoration of International day for disaster risk reduction (IDDRR)
CDM Number of International Day for Disaster Risk Reduction (IDDRR) awareness event held
1 IDDRR awareness event held
1 IDDRR Conference event held
1 IDDRR awareness event held
150 000 200 000 250 000
Equitable share
CDM N/A
CMSD-14 Disaster Risk Management Support
Disaster Risk Management Support Schools
CDM Number of Disaster Risk management school
1 Disaster Risk Management school
1 Disaster Risk Management school
1 Disaster Risk Management school
100 000 200 000 250 000
Equitable share
CDM N/A

173
Project No. Project Name
Project Description (major activities)
Location
Key performance indicator
MTERF Targets MTERF Budget (R) Source of Funding
Implementing Agent
EIA/BAR/EMP
2020/21 2021/22 2022/23 2020/21 2021/22 2022/23
Schools Competition for Learners
Competition for Learners
competitions for learners coordinated
competitions for learners coordinated
competitions for learners coordinated
competitions for learners coordinated
CMSD-15 Schools support programs
Disaster Management safety and resilience programs implemented at schools
CDM Number of schools assisted to implement disaster risk reduction programs
8 Schools (Primary and secondary )supported on implementation of disaster risk reduction programs
8 Schools (Primary and secondary )supported on implementation of disaster risk reduction programs
8 Schools (Primary and secondary )supported on implementation of disaster risk reduction programs
70 000 80 000 90 000 Equitable Shares
CDM N/A
CMSD-16 Disaster Management coordination
Disaster management co-ordination services(advisory forums)
CDM /LM Number of disaster management advisory forums coordinated.
16 disaster management advisory forum coordinated
16 disaster management advisory forum coordinated
16 disaster management advisory forum coordinated
70 000 70 000 70 000 Equitable Shares
CDM N/A
CMSD-17 Review of Disaster Management Plan and Framework
Review of Disaster Management Plan and Framework
CDM/LM Number Local Disaster Management Plan Review
None None 1 Local Disaster Management Plan Reviewed
Nil
Nil 250 000
Equitable Shares
CDM N/A
CMSD-18 Disaster Management Centre
Planning of Disaster Management Centre
CDM Percentage of Disaster Management Centre established.
None None 20% of Disaster Management Centre established (purchase land, appointment of service provider, planning designs)
Nil Nil OPEX Equitable Shares
CDM N/A
CMSD-19 Procurement of Disaster Manageme
Procurement of Disaster management
CDM Percentage of required Disaster
None None 100% of required Disaster
Nil Nil 150 000
Equitable Shares
CDM N/A

174
Project No. Project Name
Project Description (major activities)
Location
Key performance indicator
MTERF Targets MTERF Budget (R) Source of Funding
Implementing Agent
EIA/BAR/EMP
2020/21 2021/22 2022/23 2020/21 2021/22 2022/23
nt equipment
trailer and equipment
Management trailer and equipment procured.
Management trailer and equipment procured.
TOTAL BUDGET DISASTER MANAGEMENT SERVICE 2 780 000 2 260 000 2 810 000
MUNICIPAL HEALTH SERVICES
CMSD-20 Food handling facilities monitoring
Food handling facilities monitoring
All LM’s Number of reports on monitored food handling facilities
12 reports on monitored food handling facilities
12 reports on monitored food handling facilities
12 reports on monitored food handling facilities
OPEX OPEX OPEX Equitable Shares
CDM N/A
CMSD-21 Cleanest school competition
Cleanest school competition
Molemole Number of Cleanest school competition coordinated
1 Cleanest school competition coordinated
1 Cleanest school competition coordinated
1 Cleanest school competition coordinated
200 000 200 000 200 000
Equitable Shares
CDM N/A
CMSD-22 Health awareness campaign
Health awareness campaign
Blouberg Number of health awareness campaign conducted
1 health awareness campaign conducted
1 health awareness campaign conducted
1 health awareness campaign conducted
150 000 150 000 150 000
Equitable Shares
CDM N/A
CMSD-23 Water quality inspected/tested at sources
Monitoring of water sources
All LM`s Number of reports on water sources inspected
12 reports on water sources inspected
12 reports on water sources inspected
12 reports on water sources inspected
OPEX OPEX OPEX Equitable Shares
CDM N/A
CMSD-24 Food and Water quality monitoring accessories
Procurement of Food and Water quality monitoring accessories
CDM Number of set of food and water quality monitoring accessories procured
Set of food and water quality monitoring accessories procured
Set of food and water quality monitoring accessories procured
Set of food and water quality monitoring accessories procured
85 000 85 000 85 000 Equitable Shares
CDM N/A
CMSD-25 Food and water quality monitoring equipment
Procurement of Food and water quality monitoring equipment
CDM Number of food and water quality monitoring equipment procured
10 food and water quality monitoring equipment procured
10 food and water quality monitoring equipment procured
10 food and water quality monitoring equipment procured
100 000 100 000 100 000
Equitable Shares
CDM N/A

175
Project No. Project Name
Project Description (major activities)
Location
Key performance indicator
MTERF Targets MTERF Budget (R) Source of Funding
Implementing Agent
EIA/BAR/EMP
2020/21 2021/22 2022/23 2020/21 2021/22 2022/23
CMSD-26 Water quality sampling
Water sampling All LMs Number of reports water sampling
12 reports on water sampling
12 reports on water sampling
12 reports on water sampling
50 000 50 000 50 000 Equitable Shares
CDM N/A
CMSD-27 Food sampling and Moore pads planting
Food sampling and Planting of Moore pads for cholera surveillance
All LMs Number of food sampling and analysis reports on Moore pads planted
12 food sampling and analysis reports on Moore pads planted
12 food sampling and analysis reports on Moore pads planted
12 food sampling and analysis reports on Moore pads planted
155 000 155 000 155 000
Equitable Shares
CDM N/A
CMSD-28 Communicable disease monitoring and control
Follow-up of reported communicable diseases
All LMs Number of reports on reported communicable diseases cases followed up
12 reports on reported communicable diseases followed up
12 reports on reported communicable diseases followed up
12 reports on reported communicable diseases followed up
OPEX OPEX OPEX Equitable Shares
CDM N/A
CMSD-29 Monitoring compliance with health legislation of non-food handling premises
Monitoring of non-food handling premises
All LMs Number of reports on non-food handling premises monitored
12 reports on non-food handling premises monitored
12 reports on non-food handling premises monitored
12 reports on non-food handling premises monitored
OPEX OPEX OPEX Equitable Shares
CDM N/A
TOTAL BUDGET MUNICIPAL HEALTH SERVICES 740 000 740 000 740 000
SPORTS, RECREATION, ARTS AND CULTURE
CMSD-30 Coordination of Community Safety Forums
Coordination of four community safety forums
CDM Number of Community safety forums coordinated
2 Community safety forums coordinated
2 Community safety forums coordinated
2 Community safety forums coordinated
125 000 100 000 100 000
Equitable Shares
CDM N/A
CMSD-31 Heritage event celebration
Celebration of one heritage event
Local municipalities
Number of heritage events celebrated
1 heritage event celebrated
1 heritage event celebrated
1 heritage event celebrated
OPEX 225 000 225 000
Equitable Shares
CDM N/A
CMSD-32 Community development
Communal outreach programme
Local municipalities
Number of communal outreach programmes organised
2 communal outreach programmes organised
2 communal outreach programmes organised
2 communal outreach programmes organised
OPEX 500 000 500 000
Equitable Shares
CDM N/A

176
Project No. Project Name
Project Description (major activities)
Location
Key performance indicator
MTERF Targets MTERF Budget (R) Source of Funding
Implementing Agent
EIA/BAR/EMP
2020/21 2021/22 2022/23 2020/21 2021/22 2022/23
CMSD-33 Refurbishment of community asset
Refurbishment of community asset
Local municipalities
Number of community assets refurbished
None 1 community assets refurbished
1 community assets refurbished
Nil 300 000 300 000
Equitable Shares
CDM N/A
FD-02 Financial Reporting
CDM Number of unqualified audit opinion
1 Unqualified audit opinion(without material matters)
1 Unqualified audit opinion(without material matters)
1 Unqualified audit opinion(without material matters)
OPEX OPEX OPEX Equitable Shares
CDM N/A
FD-06 Demand Management
Development and implementation of the procurement plan.
CDM Number of municipal procurement plan developed and implemented
1 municipal procurement plan developed and implemented.
1 municipal procurement plan developed and implemented.
1 municipal procurement plan developed and implemented.
OPEX OPEX OPEX Equitable Shares
CDM N/A
FD-07 Acquisition Management
Compliance to the SCM regulations
CDM % of compliance to the SCM regulations that result in R nil irregular expenditure
100% compliance to the SCM regulations that result in R nil irregular expenditure
100% compliance to the SCM regulations that result in R nil irregular expenditure
100% compliance to the SCM regulations that result in R nil irregular expenditure
OPEX OPEX OPEX Equitable Shares
CDM N/A
TOTAL BUDGET SPORTS, RECREATION, ARTS AND CULTURE 125 000 1 125 000 1 125 000
TOTAL BUDGET COMMUNITY SERVICES PROJECTS 6 945 000 6 425 000 6 975 000
Table 94: Corporate Services Department: Project List and Budget for 2020/22-2022/23 MTERF
Project No.
Project Name Project Description (major activities)
Location
Key performance indicator
MTERF Targets MTERF Budget (R) Source of Funding
Implementing Agent
EIA/BAR/EMP
2020/21 2021/22 2022/23 2020/21 2021/22 2022/23
Legal Services

177
Project No.
Project Name Project Description (major activities)
Location
Key performance indicator
MTERF Targets MTERF Budget (R) Source of Funding
Implementing Agent
EIA/BAR/EMP
2020/21 2021/22 2022/23 2020/21 2021/22 2022/23
CPSD-01 Attendance and management of effective litigation
Litigation Management
CDM % attendance and management of litigation cases
100% attendance and management of all cases instituted or defended by June 2021
100% attendance and management of all cases instituted or defended by June 2022
100% attendance and management of all cases instituted or defended by June 2023
3 985 000
3 989 000 3 989 000 Equitable Shares
CDM N/A
CPSD-02 Provision of legal advices and support
Advisory services
CDM % of requested legal advices and support provided
100% of requested legal advices and support provided by June 2021
100% of requested legal advices and support provided by June 2022
100% of requested legal advices and support provided by June 2023
OPEX OPEX OPEX Equitable Shares
CDM N/A
CPSD-03 Development and or editing of contracts
Contracts development
CDM % of requested contracts developed or edited and signed.
100% of requested contracts developed or edited and signed by June 2021
100% of requested contracts developed or edited and signed by June 2022
100% of requested contracts developed or edited and signed by June 2023
OPEX OPEX OPEX Equitable Shares
CDM N/A
CPSD-04 Development or review of by-laws
Development and review of by-laws
CDM % of requested by-laws developed or reviewed
100% of requested by-laws developed or reviewed by June 2021
100% of requested by-laws developed or reviewed by June 2022
100% of requested by-laws developed or reviewed by June 2023
50 000 50 000 50 000 Equitable Shares
CDM N/A
TOTAL BUDGET LEGAL SERVICES 4 035 000 4 039 000 4 039 000
HUMAN RESOURCES
CPSD-05 Recruitment and selection processes
Recruit and select suitable candidates for positions
CDM Percentage Coordination of recruitment and selection processes
100% coordination of recruitment and selection processes
100% coordination of recruitment and selection processes
100% coordination of recruitment and selection processes
569 000 569 000 569 000 Equitable Shares
CDM N/A
CPSD-06 Performance Management Capacity building
Coordination of Capacity Building Activities
CDM Number of Performance Management support sessions conducted
2 Performance Management support sessions conducted
2 Performance Management support sessions conducted
2 Performance Management support sessions conducted
OPEX OPEX OPEX Equitable Shares
CDM N/A
CPSD-07 Performance reviews
Performance Reviews
CDM Number of Performance
4 Performance reviews conducted
4 Performance reviews conducted
4 Performance reviews conducted
7 052 000 7 757 000 8 533 000 Equitable Shares
CDM N/A
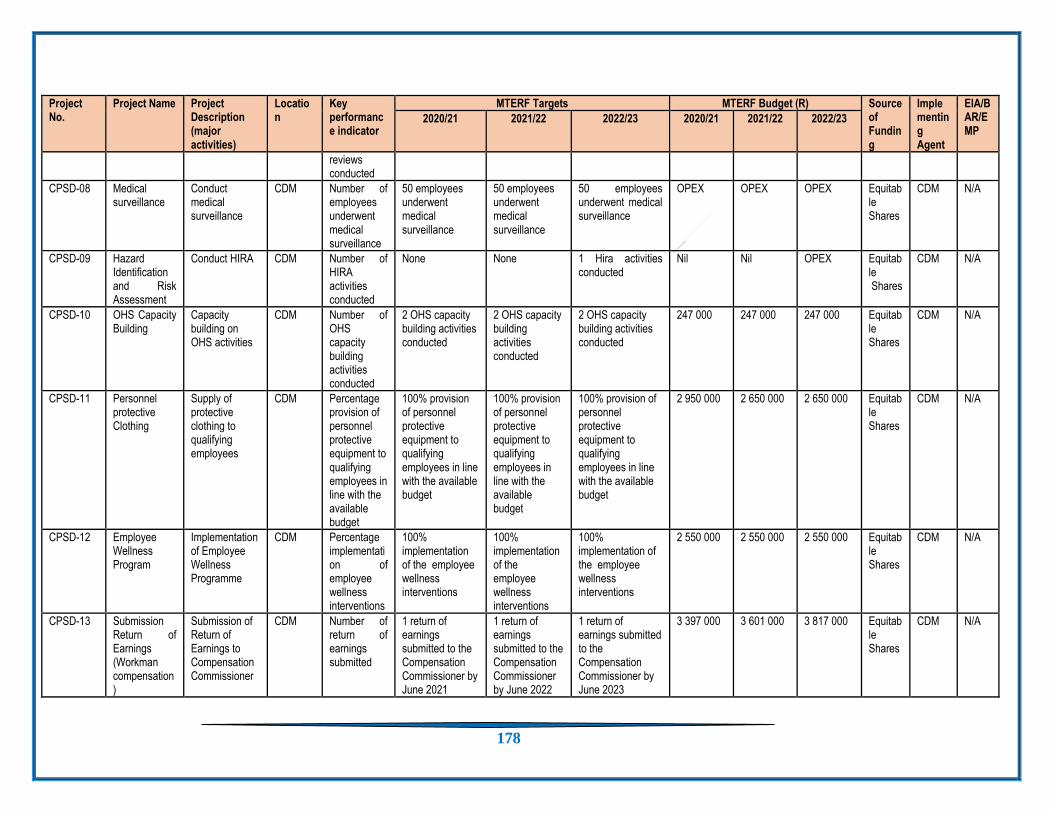
178
Project No.
Project Name Project Description (major activities)
Location
Key performance indicator
MTERF Targets MTERF Budget (R) Source of Funding
Implementing Agent
EIA/BAR/EMP
2020/21 2021/22 2022/23 2020/21 2021/22 2022/23
reviews conducted
CPSD-08 Medical surveillance
Conduct medical surveillance
CDM Number of employees underwent medical surveillance
50 employees underwent medical surveillance
50 employees underwent medical surveillance
50 employees underwent medical surveillance
OPEX OPEX OPEX Equitable Shares
CDM N/A
CPSD-09 Hazard Identification and Risk Assessment
Conduct HIRA CDM Number of HIRA activities conducted
None None 1 Hira activities conducted
Nil Nil OPEX Equitable Shares
CDM N/A
CPSD-10 OHS Capacity Building
Capacity building on OHS activities
CDM Number of OHS capacity building activities conducted
2 OHS capacity building activities conducted
2 OHS capacity building activities conducted
2 OHS capacity building activities conducted
247 000 247 000 247 000 Equitable Shares
CDM N/A
CPSD-11 Personnel protective Clothing
Supply of protective clothing to qualifying employees
CDM Percentage provision of personnel protective equipment to qualifying employees in line with the available budget
100% provision of personnel protective equipment to qualifying employees in line with the available budget
100% provision of personnel protective equipment to qualifying employees in line with the available budget
100% provision of personnel protective equipment to qualifying employees in line with the available budget
2 950 000 2 650 000 2 650 000 Equitable Shares
CDM N/A
CPSD-12 Employee Wellness Program
Implementation of Employee Wellness Programme
CDM Percentage implementation of employee wellness interventions
100% implementation of the employee wellness interventions
100% implementation of the employee wellness interventions
100% implementation of the employee wellness interventions
2 550 000 2 550 000 2 550 000 Equitable Shares
CDM N/A
CPSD-13 Submission Return of Earnings (Workman compensation)
Submission of Return of Earnings to Compensation Commissioner
CDM Number of return of earnings submitted
1 return of earnings submitted to the Compensation Commissioner by June 2021
1 return of earnings submitted to the Compensation Commissioner by June 2022
1 return of earnings submitted to the Compensation Commissioner by June 2023
3 397 000 3 601 000 3 817 000 Equitable Shares
CDM N/A

179
Project No.
Project Name Project Description (major activities)
Location
Key performance indicator
MTERF Targets MTERF Budget (R) Source of Funding
Implementing Agent
EIA/BAR/EMP
2020/21 2021/22 2022/23 2020/21 2021/22 2022/23
CPSD-14 Employee (Labour) Relations
Effective Management of Labour cases
CDM Percentage of referred cases attended to within the required time frame
100 % of referred cases attended to within the required time frame
100 % of referred cases attended to within the required time frame
100 % of referred cases attended to within the required time frame
360 000 360 000 360 000 Equitable Shares
CDM N/A
CPSD-15 Induction sessions
Induction of new and current employees
CDM Number of induction sessions conducted
2 induction sessions conducted
2 induction sessions conducted
2 induction sessions conducted
50 000 50 000 50 000 Equitable Shares
CDM N/A
CPSD-16 Submission of WSP.
Submission of the WSP to LGSETA
CDM Number of Workplace Skills Plan and Annual Training Report (WSP and ATR) submitted to LGSETA
1 Workplace Skills Plan and Annual Training Report (WSP and ATR) submitted to LGSETA by April 2021
1 Workplace Skills Plan and Annual Training Report (WSP and ATR) submitted to LGSETA by April 2022
1 Workplace Skills Plan and Annual Training Report (WSP and ATR) submitted to LGSETA by April 2022
OPEX OPEX OPEX Equitable Shares
CDM N/A
CPSD-17 Training of employees
Training of employees
CDM Percentage of the training budget spent on training of employees.
90% of the training budget spent on training of employees
90% of the training budget spent on training of employees
90% of the training budget spent on training of employees
1 250 000 1 250 000 1 250 000 Equitable Shares
CDM N/A
CPSD-18 Training of councillors and traditional leaders
Training of Councillors and Traditional Leaders
CDM Percentage implementation of identified training programmes for Councillors and Traditional Leaders
90% implementation of identified training programmes for Councillors and Traditional Leaders
90% implementation of identified training programmes for Councillors and Traditional Leaders
90% implementation of identified training programmes for Councillors and Traditional Leaders
1 500 000 1 500 000 1 500 000 Equitable Shares
CDM N/A
CPSD-19 Bursary fund Internal
Awarding of bursaries to internal employees
CDM Percentage of eligible employees awarded with
100 % of eligible employees awarded with bursaries in line
100 % of eligible employees awarded with
100 % of eligible employees awarded with bursaries in line
1 000 000 1 000 000 1 000 000 Equitable Shares
CDM N/A

180
Project No.
Project Name Project Description (major activities)
Location
Key performance indicator
MTERF Targets MTERF Budget (R) Source of Funding
Implementing Agent
EIA/BAR/EMP
2020/21 2021/22 2022/23 2020/21 2021/22 2022/23
bursaries in line with available budget
with available budget
bursaries in line with available budget
with available budget
CPSD-20 Bursary fund external
Awarding and monitoring of bursary to external people
CDM Percentage monitoring of external bursary
100% monitoring of external bursary
100% monitoring of external bursary
100% monitoring of external bursary
400 000 400 000 400 000 Equitable Shares
CDM N/A
CPSD-21 Learnership, Internships and experiential training
Capacitate young people in the district with regard to Learnership, internship and experiential training
CDM Number of program put in place to capacitate young people in the district ( internships, or experiential training)
1 program put in place to capacitate young people in the district ( internships or experiential training)
1 program put in place to capacitate young people in the district ( internships or experiential training)
1 program put in place to capacitate young people in the district ( internships or experiential training)
500 000 500 000 500 000 Equitable Shares
CDM N/A
CPSD-22 Employment Equity
Submission of the Employment Equity Report to Department of Labour
CDM Number of submission of the Employment Equity Reports to DoL.
1 Submission of the Employment Equity Reports to Do L by January 2021
1 Submission of the Employment Equity Reports to Do L by January 2022
1 Submission of the Employment Equity Reports to Do L by January 2023
OPEX OPEX OPEX Equitable Shares
CDM N/A
CPSD-23 Employment Equity Plan
Implementation of employment equity plan
CDM Percentage of filled positions occupied by employees from Employment Equity target groups employed in the four highest levels of management
95 % of filled positions occupied by employees from Employment Equity target groups employed in the four highest of management in compliance with the Employment Equity Act
95 % of filled positions occupied by employees from Employment Equity target groups employed in the four highest of management in compliance with the Employment Equity Act
95 % of filled positions occupied by employees from Employment Equity target groups employed in the four highest of management in compliance with the Employment Equity Act
OPEX OPEX OPEX Equitable Shares
CDM N/A

181
Project No.
Project Name Project Description (major activities)
Location
Key performance indicator
MTERF Targets MTERF Budget (R) Source of Funding
Implementing Agent
EIA/BAR/EMP
2020/21 2021/22 2022/23 2020/21 2021/22 2022/23
in compliance with the Employment Equity Act
TOTAL BUDGET HUMAN RESOURCES 21 825 000 22 434 000 23 426 000
ICT and IKM
CPSD-24 Computer hardware, software and networks
Procurement of Internal software, network, switches, tablets and computers
All CDM offices
Number of computer hardware equipment, software and networks procured and implemented
54 computer hardware, software and networks procured and implemented
60 computer hardware, software and networks procured and implemented
65 computer hardware, software and networks procured and implemented
1 110 000 1 410 000 1 410 000 Equitable Shares
CDM N/A
CPSD-25 ICT systems, computer equipment and licences
Maintenance of ICT systems, computer and licences.
CDM Percentage of ICT systems, computer equipment and licencing maintained
100% maintenance of ICT systems, computer equipment and licencing
100% maintenance of ICT systems, computer equipment and licencing
100% maintenance of ICT systems, computer equipment and licencing
5 313 000 5 313 000 5 313 000 Equitable Shares
CDM N/A
CPSD-26 Financial systems
Upgrade , enhancement support and maintenance and support of Financial Systems
CDM Percentage Upgrade, enhancement support and maintenance and support of Financial Systems
100% Upgrade, enhancement support and maintenance and support of Financial Systems
100% Upgrade, enhancement support and maintenance and support of Financial Systems
100% Upgrade, enhancement support and maintenance and support of Financial Systems
3 937 000 3 637 000 3 637 000 Equitable Shares
CDM N/A
CPSD-27 Access Control Systems and Camera system
Access Control and camera System at the remote office
CDM Number of offices installed with access control and/or camera
3 CDM offices installed with access control and/or camera systems
1 CDM offices installed with access control and/or camera systems
1 CDM offices installed with access control and/or camera systems
200 000 200 000 200 000 Equitable Shares
CDM N/A
CPSD-28 Procurement of Network Access
Back – up Storage Procurement of
CDM Number of Network Access
1 Network Access Storage Devices procured
1 Network Access Storage
1 Network Access Storage Devices procured
400 000 490 000 560 000 Equitable Shares
CDM N/A

182
Project No.
Project Name Project Description (major activities)
Location
Key performance indicator
MTERF Targets MTERF Budget (R) Source of Funding
Implementing Agent
EIA/BAR/EMP
2020/21 2021/22 2022/23 2020/21 2021/22 2022/23
Storage Devices
Network Access Storage Devices
Storage Devices procured
Devices procured
CPSD-29 Share Point Migration of Share Point to Microsoft
CDM Number of Share Point migrated to Microsoft
1 Share Point migrated to Microsoft
None None 100 000 Nil Nil Equitable Shares
CDM N/A
CPSD-30 System Centre Solution
Deployment of Microsoft system Centre
CDM Number of system centre solution implemented
1 system centre solution implemented
None None 350 000 Nil Nil Equitable Shares
CDM N/A
CPSD-31 Disaster Management software
Maintenance of the Disaster Management software
CDM Percentage of disaster management software maintained
100% maintenance of Disaster Management software
100% maintenance of Disaster Management software
100% maintenance of Disaster Management software
240 000 240 000 240 000 Equitable Shares
CDM N/A
CPSD-32 Internal Communication System
Installation of Internal Communication System in the Council Chamber
CDM Number of Internal Communication System installed
1 Internal Communication System installed
None None 500 000 Nil Nil Equitable Shares
CDM N/A
CPSD-33 Employee Shared Network
Implementation of Employee Shared Network
CDM Number of sites implemented with Employee Shared Network
2 sites with Employee Shared Network
2 sites with Employee Shared Network
2 sites with Employee Shared Network
500 000 300 000 300 000 Equitable Shares
CDM N/A
TOTAL BUDGET ICT and IKM 12 650 000 11 590 000 11 660 000
ADMINISTRATION
CPSD-34 Office Furniture
Procurement of office furniture
CDM Percentage of requested office furniture procured
None 100% of requested office furniture procured in line with available budget by June 2022
100% of requested office furniture procured in line with available budget by June 2023
Nil 1 800 00 1 800 000 Equitable Shares
CDM N/A

183
Project No.
Project Name Project Description (major activities)
Location
Key performance indicator
MTERF Targets MTERF Budget (R) Source of Funding
Implementing Agent
EIA/BAR/EMP
2020/21 2021/22 2022/23 2020/21 2021/22 2022/23
CPSD-35 Air- Conditioners
Procurement and replacement of air conditioners
CDM Percentage of obsolete air conditioners replaced.
100% obsolete air conditioners replaced.
100% obsolete air conditioners replaced.
100% obsolete air conditioners replaced.
250 000 450 000 450 000 Equitable Shares
CDM N/A
CPSD-36 Refurbishment of Fire Stations
Refurbishment of Fire Stations
CDM Number of fire stations refurbished
1 fire station refurbished
1 fire station refurbished
1 fire station refurbished
500 000 2 000 000 3 000 000 Equitable shares
CDM N/A
CPSD-37 Refurbishment of Motumo Trading Post
Refurbishment of Motumo Trading Post
CDM Number of sites refurbished
1 site refurbished 1 site refurbished
None 3 174 000 1 000 000 Nil Equitable shares
CDM N/A
CPSD-38 Blouberg Offices
Construction of Blouberg office
CDM Percentage of Blouberg Water offices constructed
50% of Blouberg water office constructed (Phase 1)
100% of Blouberg water office constructed (Phase 2)
None 6 000 000 6 000 000 Nil Equitable shares
CDM N/A
CPSD-39 Toilets and showers
Installation of Toilets and showers
CDM Number of fire station installed with toilets and showers
1 fire station installed with toilets and showers
None None 300 000 Nil Nil Equitable Shares
CDM N/A
CPSD-40 Roof construction
Construction of roof (Biccard)
CDM Number of roof constructed
1 roof constructed
None None 1 500 000 Nil Nil Equitable Shares
CDM N/A
CPSD-41 Paving of fire station
Installation of paving fire station
CDM fire stations
Number of fire station paved.
None 1 fire station paved
1 fire station paved Nil 500 000 500 000 Equitable Shares
CDM N/A
CPSD-42 Guard house Installation of guard house
CDM Number of guard house installed
3 guard house installed
None None 1 000 000 Nil Nil Equitable Shares
CDM N/A
CPSD-43 Plant and equipment
Procurement of plant and equipment
CDM Number of vehicles purchased
1 vehicle purchased
2 vehicles purchased
2 vehicles purchased
1 000 000 1 350 000 3 350 000 Equitable Shares
CDM N/A
CPSD-44 Rapid Response vehicles
Procurement of Rapid Response vehicles
CDM Number of Rapid Response vehicle procured
1 Rapid Response vehicles procured
1 Rapid Response vehicles procured
1 Rapid Response vehicles procured
1 500 000 2 000 000 2 500 000 Equitable Shares
CDM N/A

184
Project No.
Project Name Project Description (major activities)
Location
Key performance indicator
MTERF Targets MTERF Budget (R) Source of Funding
Implementing Agent
EIA/BAR/EMP
2020/21 2021/22 2022/23 2020/21 2021/22 2022/23
CPSD-45 Fire vehicles Procurement of fire vehicles
CDM Number of fire vehicle procured
1 Fire vehicles procured
1 Fire vehicles procured
1 Fire vehicles procured
2 100 000 1 600 000 3 500 000 Equitable Shares
CDM N/A
CPSD-46 Refurbishment of Fire vehicles
Refurbishment of Fire vehicles
CDM Number of fire vehicles refurbished
1 fire vehicle refurbished
2 fire vehicle refurbished
2 fire vehicle refurbished
500 000 1 100 000 1 100 000 Equitable shares
CDM N/A
CPSD-47 Water Vehicles
Procurement of water vehicles
CDM Number of water vehicle procured
1 water vehicles procured
2 water vehicles procured
2 water vehicles procured
1 500 000 3 000 000 4 000 000 Equitable Shares
CDM N/A
CPSD-48 PAIA Compliance
Submission of PAIA report submitted to South African Human Rights Commission
CDM Number of PAIA reports compiled and submitted to Human Right Commission
1 PAIA reports compiled and submitted to Human right Commission.
1 PAIA reports compiled and submitted to Human right Commission.
1 PAIA reports compiled and submitted to Human right Commission.
OPEX OPEX OPEX Equitable Shares
CDM N/A
CPSD-49 Records Management
Implementation of records management
CDM Number of compliance reports compiled and submitted on file plan
4 compliance reports compiled and submitted on file plan.
4 compliance reports compiled and submitted on file plan.
4 compliance reports compiled and submitted on file plan.
OPEX OPEX OPEX Equitable Shares
CDM N/A
FD-02 Financial Reporting
CDM Number of unqualified audit opinion
1 Unqualified audit opinion(without material matters)
1 Unqualified audit opinion(without material matters)
1 Unqualified audit opinion(without material matters)
OPEX OPEX OPEX Equitable Shares
CDM N/A
FD-06 Demand Management
Development and implementation of the procurement plan.
CDM Number of municipal procurement plan developed and implemented
1 municipal procurement plan developed and implemented.
1 municipal procurement plan developed and implemented.
1 municipal procurement plan developed and implemented.
OPEX OPEX OPEX Equitable Shares
CDM N/A
FD-07 Acquisition Management
Compliance to the SCM regulations
CDM % of compliance to the SCM regulations that result in
100% compliance to the SCM regulations that result in R nil irregular expenditure
100% compliance to the SCM regulations that result in R nil
100% compliance to the SCM regulations that result in R nil irregular expenditure
OPEX OPEX OPEX Equitable Shares
CDM N/A

185
Project No.
Project Name Project Description (major activities)
Location
Key performance indicator
MTERF Targets MTERF Budget (R) Source of Funding
Implementing Agent
EIA/BAR/EMP
2020/21 2021/22 2022/23 2020/21 2021/22 2022/23
R nil irregular expenditure
irregular expenditure
TOTAL BUDGET ADMIN 19 324 000 20 800 000 20 200 000
TOTAL BUDGET CORPORATE SERVICES 57 834 000 58 863 000 59 325 000
Table 96: Finance Department: Project List and Budget for 2020/21-2022/23 - MTERF Budget
Project No.
Project Name Project Description (major activities)
Location Key performance indicator
MTERF Targets MTERF Budget (R) Source of Funding
Implementing Agent
EIA/BAR/EMP
2020/21 2021/22 2022/23 2020/21 2021/22 2022/23
BUDGET AND TREASURY
FD-01 Budget Compliance
Budget Treasury CDM Number of approved credible adjustment budget as per Municipal Finance Management Act (MFMA) by 28 February
1 approved credible adjustment budget as per Municipal Finance Management Act (MFMA) by 28 February
1 approved credible adjustment budget as per Municipal Finance Management Act (MFMA) by 28 February
1 approved credible adjustment budget as per Municipal Finance Management Act (MFMA) by 28 February
OPEX OPEX OPEX Equitable shares
CDM N/A
Number of draft credible annual budgets tabled as per Municipal Finance Management Act (MFMA) by 31 March
1 draft credible annual budget tabled as per Municipal Finance Management Act (MFMA) by 31 March
1 draft credible annual budget tabled as per Municipal Finance Management Act (MFMA) by 31 March.
1 draft credible annual budget tabled as per Municipal Finance Management Act (MFMA) by 31 March
OPEX OPEX OPEX Equitable shares
CDM N/A
Number of credible annual budgets adopted as per Municipal Finance
1 credible annual budget adopted as per Municipal Finance Management Act
1 credible annual budget adopted as per Municipal Finance Management
1 credible annual budget adopted as per Municipal
OPEX OPEX OPEX Equitable shares
CDM N/A

186
Project No.
Project Name Project Description (major activities)
Location Key performance indicator
MTERF Targets MTERF Budget (R) Source of Funding
Implementing Agent
EIA/BAR/EMP
2020/21 2021/22 2022/23 2020/21 2021/22 2022/23
Management Act (MFMA) by 30 May
(MFMA) by 30 May
Act (MFMA) by 30 May.
Finance Management Act (MFMA) by 30 May.
FD-02 Financial reporting
Budget Treasury CDM Number of quarterly financial statements submitted to stakeholders within 60 days after the end of the quarter
4 quarterly financial statements submitted to stakeholders within 60 days after the end of the quarter
4 quarterly financial statements submitted to stakeholders within 60 days after the end of the quarter
4 quarterly financial statements submitted to stakeholders within 60 days after the end of the quarter
OPEX OPEX OPEX Equitable shares
CDM N/A
Number of Unqualified audit opinion
1 Unqualified audit opinion
1 Unqualified audit opinion
1 Unqualified audit opinion
OPEX OPEX OPEX Equitable shares
CDM N/A
Number of annual financial statements and performance reports submitted to the Auditor General by 31st August
1 annual financial statement and performance reports submitted to the Auditor General by 31st August
1 annual financial statements and performance reports submitted to the Auditor General by 31st August
1 annual financial statements and performance reports submitted to the Auditor General by 31st August
OPEX OPEX OPEX Equitable shares
CDM N/A
Number of draft budget submitted to Treasury within10 working days after tabling
1 draft budget submitted to Treasury within10 working days after tabling
1 draft budget submitted to Treasury within 10 working days after tabling
1 draft budget submitted to Treasury within 10 working days after tabling
OPEX OPEX OPEX Equitable shares
CDM N/A
Number of final budget submitted to Treasury within
1 final budget submitted to Treasury within
1 final budget submitted to Treasury within 10
1 final budget submitted to Treasury
OPEX OPEX OPEX Equitable shares
CDM N/A

187
Project No.
Project Name Project Description (major activities)
Location Key performance indicator
MTERF Targets MTERF Budget (R) Source of Funding
Implementing Agent
EIA/BAR/EMP
2020/21 2021/22 2022/23 2020/21 2021/22 2022/23
10 working days after approval
10 working days after approval
working days after approval
within 10 working days after approval
Number of quarterly MFMA budget return submitted to Treasury within 30 working days
4 quarterly MFMA budget return submitted to Treasury within 30 working days
4 quarterly MFMA budget return submitted to Treasury within 30 working days
4 quarterly MFMA budget return submitted to Treasury within 30 working days
OPEX OPEX OPEX Equitable shares
CDM N/A
Number of monthly budget statements submitted to Treasury within 10 working days after month-end
12 monthly budget statements submitted to Treasury within 10 working days after month-end
12 monthly budget statements submitted to treasury within 10 working days after month-end
12 monthly budget statements submitted to treasury within 10 working days after month-end
OPEX OPEX OPEX Equitable shares
CDM N/A
FD-03 Treasury management
Monthly monitoring over the financial processes regarding cash flow management
CDM Number of monthly cash flow projections, bank and investment reconciliations prepared
12 cash flow projections bank and investment reconciliations prepared
12 cash flow projection bank investment reconciliation prepared
12 cash flow projection bank investment reconciliation prepared
OPEX OPEX OPEX Equitable shares
CDM N/A
TOTAL BUDGET AND TREASURY OPEX OPEX OPEX
EXPENDITURE
FD-04 Payables Adhere to service standards and MFMA for payment of liabilities
CDM Percentage creditors paid within 30 days of receipts of an invoice by finance.
100% creditors paid within 30 days of receipts of an invoice by finance.
100% creditors paid within 30 days of receipts of an invoice by finance.
100% creditors paid within 30 days of receipts of
OPEX OPEX OPEX Equitable shares
CDM N/A
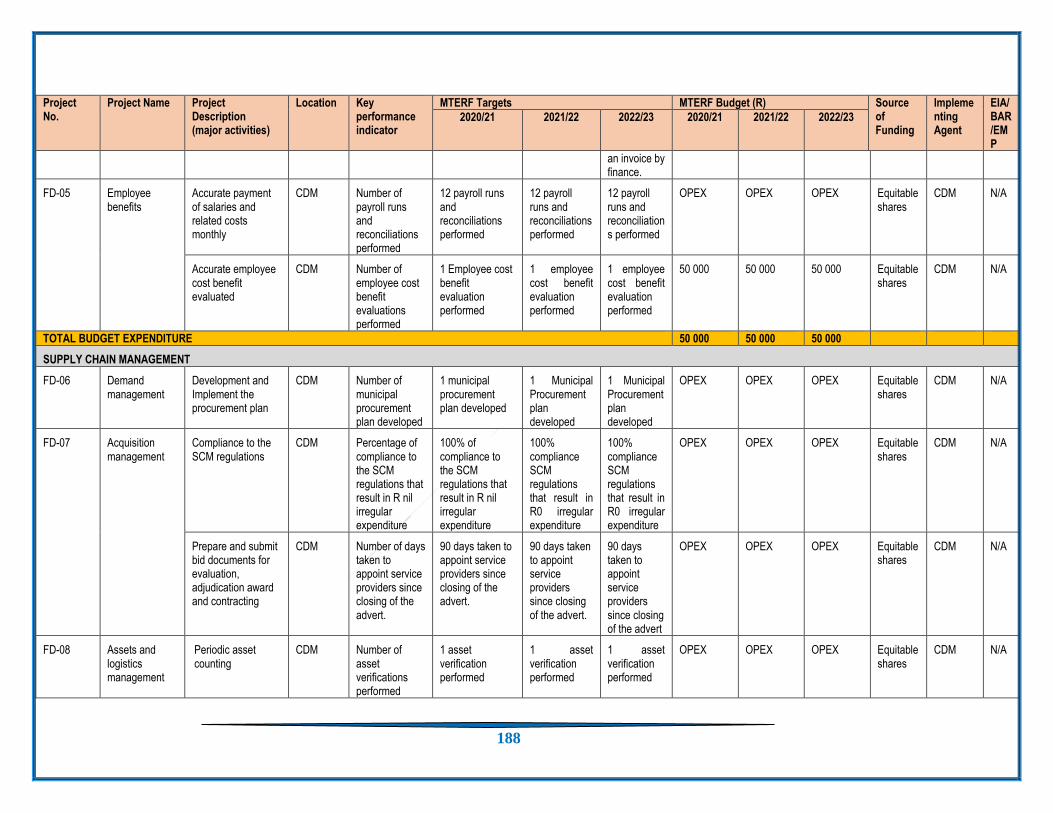
188
Project No.
Project Name Project Description (major activities)
Location Key performance indicator
MTERF Targets MTERF Budget (R) Source of Funding
Implementing Agent
EIA/BAR/EMP
2020/21 2021/22 2022/23 2020/21 2021/22 2022/23
an invoice by finance.
FD-05 Employee benefits
Accurate payment of salaries and related costs monthly
CDM Number of payroll runs and reconciliations performed
12 payroll runs and reconciliations performed
12 payroll runs and reconciliations performed
12 payroll runs and reconciliations performed
OPEX OPEX OPEX Equitable shares
CDM N/A
Accurate employee cost benefit evaluated
CDM Number of employee cost benefit evaluations performed
1 Employee cost benefit evaluation performed
1 employee cost benefit evaluation performed
1 employee cost benefit evaluation performed
50 000 50 000 50 000 Equitable shares
CDM N/A
TOTAL BUDGET EXPENDITURE 50 000 50 000 50 000
SUPPLY CHAIN MANAGEMENT
FD-06 Demand management
Development and Implement the procurement plan
CDM Number of municipal procurement plan developed
1 municipal procurement plan developed
1 Municipal Procurement plan developed
1 Municipal Procurement plan developed
OPEX
OPEX
OPEX
Equitable shares
CDM N/A
FD-07 Acquisition management
Compliance to the SCM regulations
CDM Percentage of compliance to the SCM regulations that result in R nil irregular expenditure
100% of compliance to the SCM regulations that result in R nil irregular expenditure
100% compliance SCM regulations that result in R0 irregular expenditure
100% compliance SCM regulations that result in R0 irregular expenditure
OPEX OPEX OPEX Equitable shares
CDM N/A
Prepare and submit bid documents for evaluation, adjudication award and contracting
CDM Number of days taken to appoint service providers since closing of the advert.
90 days taken to appoint service providers since closing of the advert.
90 days taken to appoint service providers since closing of the advert.
90 days taken to appoint service providers since closing of the advert
OPEX OPEX OPEX Equitable shares
CDM N/A
FD-08 Assets and logistics management
Periodic asset counting
CDM Number of asset verifications performed
1 asset verification performed
1 asset verification performed
1 asset verification performed
OPEX OPEX OPEX Equitable shares
CDM N/A
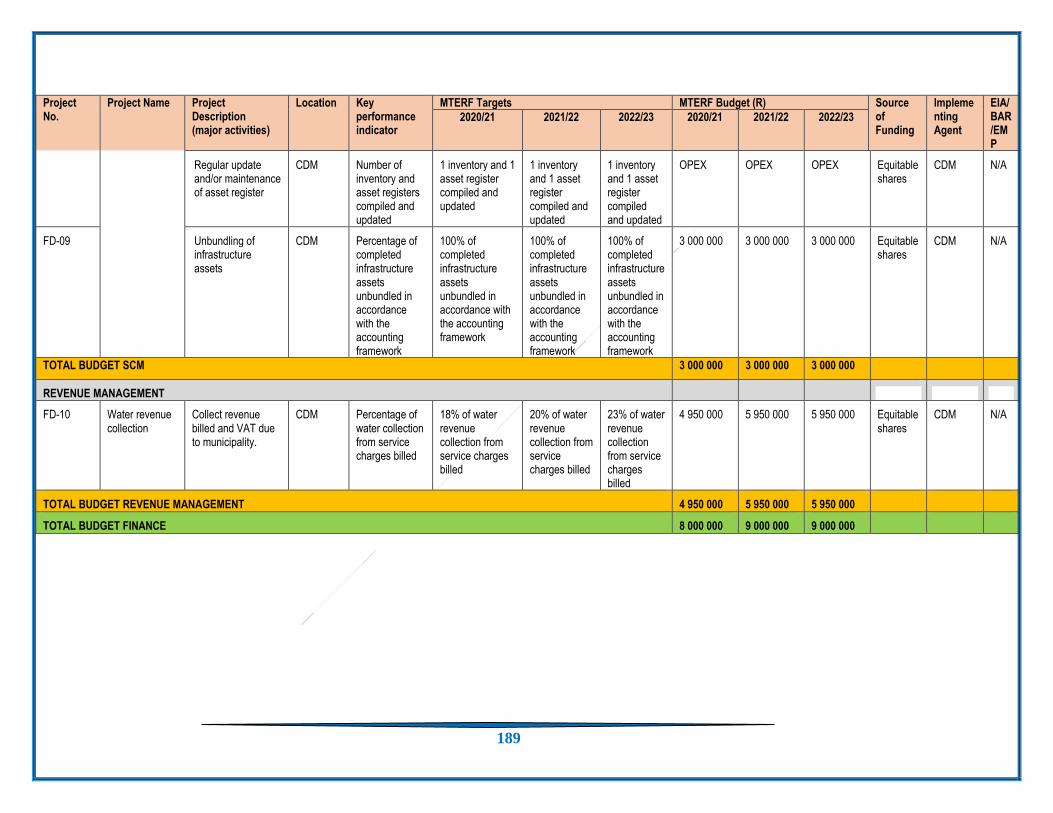
189
Project No.
Project Name Project Description (major activities)
Location Key performance indicator
MTERF Targets MTERF Budget (R) Source of Funding
Implementing Agent
EIA/BAR/EMP
2020/21 2021/22 2022/23 2020/21 2021/22 2022/23
Regular update and/or maintenance of asset register
CDM Number of inventory and asset registers compiled and updated
1 inventory and 1 asset register compiled and updated
1 inventory and 1 asset register compiled and updated
1 inventory and 1 asset register compiled and updated
OPEX OPEX OPEX Equitable shares
CDM N/A
FD-09 Unbundling of infrastructure assets
CDM Percentage of completed infrastructure assets unbundled in accordance with the accounting framework
100% of completed infrastructure assets unbundled in accordance with the accounting framework
100% of completed infrastructure assets unbundled in accordance with the accounting framework
100% of completed infrastructure assets unbundled in accordance with the accounting framework
3 000 000 3 000 000 3 000 000 Equitable shares
CDM N/A
TOTAL BUDGET SCM 3 000 000 3 000 000 3 000 000
REVENUE MANAGEMENT
FD-10 Water revenue collection
Collect revenue billed and VAT due to municipality.
CDM Percentage of water collection from service charges billed
18% of water revenue collection from service charges billed
20% of water revenue collection from service charges billed
23% of water revenue collection from service charges billed
4 950 000 5 950 000 5 950 000 Equitable shares
CDM N/A
TOTAL BUDGET REVENUE MANAGEMENT 4 950 000 5 950 000 5 950 000
TOTAL BUDGET FINANCE 8 000 000 9 000 000 9 000 000

190
5.7. VENETIA MINE PROJECTS
NAME OF
PROJECT Municipality 2019 2020 2021 2022 2023 Total
Alldays Streetlights
(Phase 2) Blouberg 1 105 838 569 162 - - - 1 675 000
Hawkers Stalls in
Senwabarwana Blouberg - - - - 2 088 075 2 088 075
Alldays Road
Paving Blouberg - 2 323 988 - - - 2 323 988
Water supply
project in
Taaiboschgroet
Blouberg 794 908 1 905 092 - - - 2 700 000
Upgrading of
Health Care
Centres in
Blouberg and
purchasing of
equipment
Blouberg - - - - 5 500 000 5 500 000
Taaiboschgroet
Community Hall Blouberg - - - - 1 125 750 1 125 750
Alldays Hawkers
Stalls Blouberg - - - - 2 088 075 2 088 075
High Mast solar
lights and street
lights
Blouberg - 1 500 000 - - - -

191
Upgrading of
Alldays Sports
Complex
Blouberg - - 1 040 844 - - 1 040 844
Eldorado Crop
Farm Blouberg - - 2 186 400 - - 2 186 400
Blouberg Chilli
Farm Blouberg - - - 2 210 000 - 2 210 000
Manufacturing
Cooperatives :
Peanut Butter
Project
Blouberg - - - 2 482 680 1 655 170 4 137
850
5.8. DEPARTMENT OF COOPERATIVE GOVERNANCE AND TRADITIONAL AFFAIRS
HSDG PROJECTS
Capital and maintenance Projects Municipality Coordinates Period Project cost vs Expenditure to date
Budget over MTEF period
Project Name Project description
Local Municipality
Status Latitude Longitude Starting Date
End Date
Total Project Cost
Actual Expenditure 2019/20
Budget 2020/21
Budget 2021/22
Budget 2022/23
Prospect Rural Subsidy Housing for 200 units
CAPRICON Blouberg
Implementation 29.001348 -23.601869 R 23,113,400.00
R 0 R 23,113,400.00
Mamehlabe 28.97268 -23.551995
Pinkisebotse 28.990866 23.520482
Uitkyk no.1 28.994187 -23.408686
Driekoppies 28.70788 -23.221293
Werden 29.143265 -23.254063
Donkerhoek 28.844613 -23.834546
Juniorsloop 28.84354 -22.840954
Royston 28.833326 -22.845423
SIMPSON 28.787449 -23.765194
GROOTPAN 28.834485 -23.762899

192
HSDG PROJECTS
Capital and maintenance Projects Municipality Coordinates Period Project cost vs Expenditure to date
Budget over MTEF period
TAAIBOSCH 28.909243 -22.846372
WITTEN Rural Subsidy Housing for 37 units
CAPRICON Blouberg
Implementation 29.143265 -23.254063 R 4,275,979.00 R 0 R 4,275,979.00
WINDHOEK 28.715521 -23.16091
PAPEGAAI 28.701488 -23.162923
BULL BULL 29.063428 -23.139366
AURORA 28.881184 -23.461525
5.9. UNFUNDED RAL PROJECTS Tarring of Road D3269 and Road D1200 towards the south of Harrietswish Tarring of road D3436 from Harrieswish to Tibane ( Which is in Mogalakwena Local Municipality) D3278 (BUFFELSHOEK-AVON) D3270 (MY-DARLING- BURGEREGHT) D3275 (LANGLAAGTE-GIDEON) D3287 Gideon to D1589 Devrede via Eldorado D3318 My Darling via Makgari to Kgomotshehlo D1589 (KROMHOEK- GROOTPAN) D287 (ALLDAYS-TOLWE) D3474 Shashe to Schoongezight D 873,D 1517 and D887 Alldays to Swartwater D3440 (UITKYK 1 - BYSWATER) D3340 (GEMARKE – UITKYK 3) D3274 (MADIBENG – KGWALE – DEVILLIERSDALE – NON-PARELLA) D4443 (MORALE - MANAKA) D3293 Makgari to Eldorado via Essouringa D3272 MY-Darling to Letswatla D3270 My-Darling to Rammutla D 3309 My Darling via Pax to Kgomotshehlo D3314 Devrede to Lovely

193
5.10. EXECUTIVE SUMMARY 2020/2021 BUDGET
In terms of section 16 (2) of the Municipal Finance Management Act, Act 56 of 2003, the mayor of the municipality must table the annual budget
at a council meeting at least 30 days before the start of the budget year.
The budget of the municipality was prepared taking into consideration the Municipal Budget and reporting regulations, the National Treasury circulars (98 & 99) and the inputs from the provincial treasury made during budget benchmarking session held. The application of sound financial management principles for the compilation of the municipality’s budget is essential and critical to ensure that the municipality remains financially sound and that the municipality is able to provide services to all communities in a sustainable manner. These area remains one of the most critical as it deals with sustainability of the municipality. The revenue collection is the lifeline of the municipality and as the municipality do not have reliable sources of revenue. The revenue of the municipality is dependent on electricity, traffic services, assessment rates and grants from national treasury as the sources. The municipality however has challenges in the area of revenue collection. The Municipality has anticipated on implementing a variety of revenue collection strategies to optimize the collection of debt owed by consumers and also circulating its credit control and debt collection policy. The Revenue Management Committee has established to deal with revenue collection issues and also taking it from Finance Minister during his budget speech says National Treasury will lead a process to encourage those, including government departments, who owe money to municipalities, to pay for services. The preparation of the 2020/2021 medium Term revenue and Expenditure Framework (MTREF) were an extremely challenging, with considerable potential
impacts on core service delivery cost and revenue components which influenced the outcomes of MTREF. Another challenge is lower revenue collection
due to non-payment by residents and none cash item e.g. Depreciation.
In view of the aforementioned, the following table is a consolidated overview of the Budget 2020/21 Medium-term Revenue and Expenditure Framework
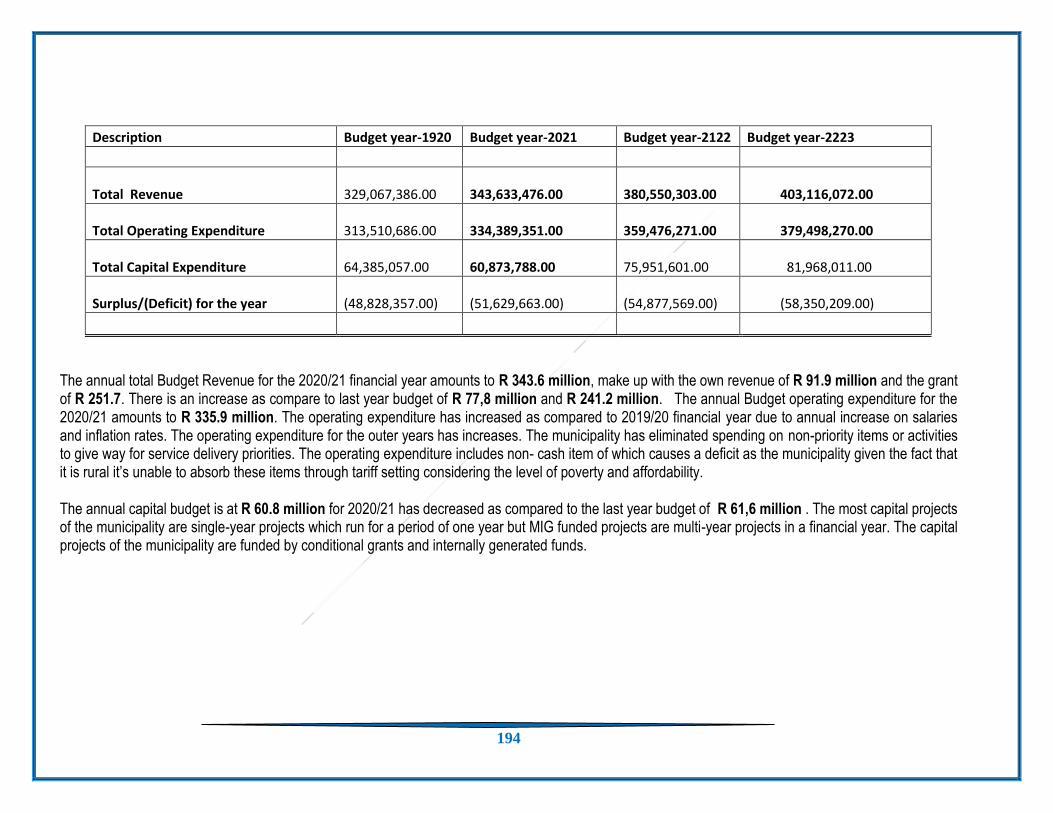
194
The annual total Budget Revenue for the 2020/21 financial year amounts to R 343.6 million, make up with the own revenue of R 91.9 million and the grant of R 251.7. There is an increase as compare to last year budget of R 77,8 million and R 241.2 million. The annual Budget operating expenditure for the 2020/21 amounts to R 335.9 million. The operating expenditure has increased as compared to 2019/20 financial year due to annual increase on salaries and inflation rates. The operating expenditure for the outer years has increases. The municipality has eliminated spending on non-priority items or activities to give way for service delivery priorities. The operating expenditure includes non- cash item of which causes a deficit as the municipality given the fact that it is rural it’s unable to absorb these items through tariff setting considering the level of poverty and affordability. The annual capital budget is at R 60.8 million for 2020/21 has decreased as compared to the last year budget of R 61,6 million . The most capital projects of the municipality are single-year projects which run for a period of one year but MIG funded projects are multi-year projects in a financial year. The capital projects of the municipality are funded by conditional grants and internally generated funds.
Description Budget year-1920 Budget year-2021 Budget year-2122 Budget year-2223
Total Revenue 329,067,386.00
343,633,476.00
380,550,303.00 403,116,072.00
Total Operating Expenditure 313,510,686.00
334,389,351.00
359,476,271.00 379,498,270.00
Total Capital Expenditure 64,385,057.00
60,873,788.00
75,951,601.00 81,968,011.00
Surplus/(Deficit) for the year (48,828,357.00)
(51,629,663.00)
(54,877,569.00) (58,350,209.00)

195
Operating Revenue and Expenditure Framework
Revenue:
The total Budget Revenue for 2020/21 is at R 343.6 million which is more than last year‘s budget (R 329, 0 million) , the main cause for increase is the
grant allocation. The total grant revenue budget for Blouberg Local Municipality for the 2020/21 financial year is at R 251.7 million which is more than last
year budget ( R 251.2 million). The total Own revenue is at R 91.9 million which is more than last year‘s budget (R77,8 million).
Expenditure:
Further key parameters applied to the Blouberg Municipality's financial framework include the following for the 2020/2021 financial year:
The total Budget Expenditure for 2020/21 is at R 334,3 million excluding capital budget. Employee related cost including section 56 is at R 128,1 million
and councilors is at R 18,1 million and in percentage is 38% of the total budget. The increase in terms of the employee cost is 6.2% for 20/21 as per
employee collective agreement.
Repairs and Maintenance R 4,1 million and in percentage is 6.7% of the total capital budget.
Description Budget year-1920 Budget year-2021 Budget year-2122 Budget year-2223
Own Revenue Budget 77,802,386.00 91,922,476.00 96,014,303.00 101,207,072.00
Grant Revenue Budget 251,265,000.00 251,711,000.00 284,536,000.00 301,909,000.00
Total Revenue Budget 329,067,386.00 343,633,476.00 380,550,303.00 403,116,072.00

196
Capital Expenditure
The total Capital Budget for 2020/21 is amounting to R60,8 Million, which is equals to 18.2% of the total Operation budget. In the outer years this amount
totals R 75,9 Million, for the 2018/19 and R81,9 Million financial years.
Budget 2020/21 Budget 2021/22 Budget 2022/23
EMPLOYEE RELATED COST 128,158,870 138,095,312 147,653,119
REMUNERATION OF COUNCILLORS 18,116,396 17,762,020 18,827,742
DEPRECIATION 43,988,216 46,382,859 49,165,828
BAD DEBTS PROVISION 8,746,928 9,621,621 10,583,783
BULK PURCHASE OF ELECTRICITY 37,100,000 39,326,000 41,685,560
REPAIRS AND MAINTANANCE 4,124,694 2,995,772 3,175,519
OTHER GENERAL EXPENDITURE 94,154,247 105,292,687 108,406,719
TOTAL 334,389,351 359,476,271 379,498,270
Capital Budget Budget-19/20 Budget 2020/21 Budget 2021/22 Budget 2022/23
Own Capital Budget 4,254,476 12,961,087 5,550,000 4,011,360
Grant capital Budget 57,402,500 47,912,707 70,401,601 77,956,651
Total 61,656,976 60,873,794 75,951,601 81,968,011

197
DETAILED BUDGET 2020/2021
Vote No Vote Description Final Budget Entity Project
35052260420EQQ09ZZHO OS: B&A VALUER 1,000,000 GENERAL VALUATION ROLL_25
35052260600EQP66ZZHO OS: CATERING SERVICES 50,000 LED SUMMIT_7
35052260600EQQ15ZZHO OS: CATERING SERVICES 10,000 IDP/BUDGET REPRESENTATIVES FORUM_4
35052260600EQQ71ZZHO OS: CATERING SERVICES 20,000 REVIEW OF THE 2020/2021 IDP/BUDGET _2
35052265720EQQ14ZZHO OS: TRANSPORT SERVICES 70,000 IDP/BUDGET PUBLIC CONSULTATION 2020_3
35052272560EQQ23ZZHO C&PS: I&P LAND & QUANTITY SURVEYORS
1,000,000 LAND TENURE UPGRADE SENWABARWANA_18 _Transfer cost
35052272560EQQ83ZZHO C&PS: I&P LAND & QUANTITY SURVEYORS
1,400,000 TOWNSHIP ESTABLISHMENT ALLDAYS & SE_27
35052272560EQQ85ZZHO C&PS: I&P LAND & QUANTITY SURVEYORS
1,000,000 TOWNSHIP ESTABLISHMENT FOR REMAINDE_20
35052272560EQR06ZZHO C&PS: I&P LAND & QUANTITY SURVEYORS
700,000 WALL TO WALL LAND USE SCHEME _17
35052272560EQR09ZZHO C&PS: I&P LAND & QUANTITY SURVEYORS:RAWESHI
700,000 Precinct Plan RAWESHI
3505226037OEQR12ZZHO Review of IDP after adoption 50,000 Review of IDP after adoption
35052300120EQP55ZZHO OC: ADV/PUB/MARK - CORP & MUN ACTIVITIES
600,200 ADVERTISEMENTS: NEWSLETTER: LED
35052300140EQP66ZZHO OC: ADV/PUB/MARK - GIFTS & PROMO ITEMS
50,000 LED SUMMIT_7
35052300160EQQ63ZZHO OC: ADV/PUB/MARK - SIGNS 5,000 PROHIBITION SIGN BOARDS_29

198
35052300180EQP67ZZHO OC: ADV/PUB/MARK - TENDERS 50,000 Survey Equipment
35052301870EQQ15ZZHO OC: HIRE CHARGES 10,000 IDP/BUDGET REPRESENTATIVES FORUM_4
35052304510EQQ06ZZHO OC: PRINTING & PUBLICATIONS 5,000 GAZETTING_5
35052305760EQQ96ZZHO OC: T&S DOM - ACCOMMODATION
106,000 TRAVEL & SUBSISTANCE - LED_13
35052305820PRMRCZZHO S & T 100,000 S & T
30052260360EQP97ZZHO OS: B&A OCCUPATIONAL HEALTH & SAFETY
150,000 EMPLOYEE WELLNESS PROGRAM_45
30052260360EQQ10ZZHO OS: B&A OCCUPATIONAL HEALTH & SAFETY
190,000 HEALTH AND SAFETY_54
30052260360EQQ29ZZHO OS: B&A OCCUPATIONAL HEALTH & SAFETY
55,120 MAINTANANCE - SHE BINS_58
30052260600EQP76ZZHO OS: CATERING SERVICES 60,000 BATHO PELE CUSTOMER CARE CAMPAIGNS_43
30052260600EQP77ZZHO OS: CATERING SERVICES 20,000 BATHO PELE CUSTOMER CARE MEETINGS_42
30052260600EQP96ZZHO OS: CATERING SERVICES 30,000 EMPLOYEE AWARENESS PROGRAM_46
30052260600EQP97ZZHO OS: CATERING SERVICES 30,000 EMPLOYEE WELLNESS PROGRAM_45
30052260600EQQ13ZZHO OS: CATERING SERVICES 25,000 HR POLICIES WORKSHOP_57
30052260600EQQ19ZZHO OS: CATERING SERVICES 90,000 JOB EVALUATION - EVALUATION OF OUTS_55
30052260600EQQ20ZZHO OS: CATERING SERVICES 40,000 JOB EVALUATION - EVALUATION OF OUTS_56
30052260600EQQ47ZZHO OS: CATERING SERVICES 30,000 MANDELA DAY_40

199
30052260600EQQ52ZZHO OS: CATERING SERVICES 100,000 MPAC EXPENDITURE_33
30052265720EQQ52ZZHO OS: TRANSPORT SERVICES 50,000 MPAC EXPENDITURE_33
30052283610EQQ32ZZHO CONTR: MAINTENANCE OF EQUIPMENT
179,840 MAINTANANCE OF CLOCKING SYSTEM _60
30052283610EQQ35ZZHO CONTR: MAINTENANCE OF EQUIPMENT
120,000 MAINTANANCE OF IT EQUIPMENT_62
30052283610EQQ54ZZHO CONTR: MAINTENANCE OF EQUIPMENT
150,000 NETWORKING MAINTANANCE_63
30052283610PRP08ZZHO CONTR: MAINTENANCE OF EQUIPMENT:AIRCORN
150,000 CONTR: MAINTENANCE OF EQUIPMENT:AIRCORN
30052260370EQR11ZZHO FLEET MANAGEMENT ASSESSMENT
100,000 FLEET MANAGEMENT ASSESSMENT
30052283620EQQ04ZZHO CONTR: MAINTENANCE OF UNSPECIFIED ASSETS
1,500,000 FLEET MANAGEMENT_41
30052300110EQQ49ZZHO OC: ADV/PUB/MARK -BURSARIES (NON-EMPLOY)
90,000 MAYORÆS BURSARY FUND_51
30052300140EQP77ZZHO OC: ADV/PUB/MARK - GIFTS & PROMO ITEMS
50,000 BATHO PELE CUSTOMER CARE MEETINGS_42
30052300150EQP96ZZHO OC: ADV/PUB/MARK - MUNICIPAL NEWSLETTERS
30,000 EMPLOYEE AWARENESS PROGRAM_46
30052300490PRMRCZZHO OC: BURSARIES (EMPLOYEES) 330,000 P-MUNICIPAL RUNNING COST
30052301120PRMRCZZHO
OC: COMM - POSTAGE/STAMPS/FRANKING MACH
26,500 P-MUNICIPAL RUNNING COST
30052301170PRMRCZZHO OC: COMM - PHONE FAX TELEGRAPH & TELEX
1,684,000 P-MUNICIPAL RUNNING COST
30052301700PRMRCZZHO OC: EXT COM SERV PROV - DATA LINES
212,000 P-MUNICIPAL RUNNING COST
30052301780EQQ68ZZHO OC: EXT COM SERV PROV - S/WARE LICENCES
592,000 RENEWAL OF SOFTWARE LICENCES_66

200
30052301870EQP76ZZHO OC: HIRE CHARGES 40,000 BATHO PELE CUSTOMER CARE CAMPAIGNS_43
30052301870EQQ13ZZHO OC: HIRE CHARGES 5,000 HR POLICIES WORKSHOP_57
30052301870EQQ19ZZHO OC: HIRE CHARGES 50,000 JOB EVALUATION - EVALUATION OF OUTS_55
30052302400PRMRCZZHO OC: INSUR UNDER - INSURANCE AGGREGATION
801,000 P-MUNICIPAL RUNNING COST
30052302440PRMRCZZHO OC: INSUR UNDER - INSURANCE EXCESS
100,000 OC: INSUR UNDER - INSURANCE EXCESS
30052304510EQP96ZZHO OC: PRINTING & PUBLICATIONS 30,000 EMPLOYEE AWARENESS PROGRAM_46
30052304520EQQ66ZZHO OC: PROFESSIONAL BODIES M/SHIP & SUBS
306,000 REGISTRATION OF PROFESSIONAL BODIES_49
30052304520EQQ90ZZHO OC: PROFESSIONAL BODIES M/SHIP & SUBS
600,000 TRAINING GUIDED BY WSP_47
30052304520PRMRCZZHO OC: PROFESSIONAL BODIES M/SHIP & SUBS
1,520,000 P-MUNICIPAL RUNNING COST
30052305100EQQ16ZZHO OC: REG FEESPROF & REGULATORY BODIES
10,000 IMPSA CONFERENCE_48
30052305100EQQ89ZZHO OC: REG FEESPROF & REGULATORY BODIES
200,000 TRAINING (COUNCILLORS)_50
30052305110EQP73ZZHO OC: REG FEES NATIONAL 38,000 ATTENTING ANNUAL GOVTECH CONFERENCE_64
30052305110ORMRCZZHO OC: REG FEES NATIONAL/WARD COMMITTEE CONFERENCE
696,000 P-MUNICIPAL RUNNING COST
30052305110PRMRCZZHO OC: REG FEES NATIONAL/MPAC 530,000 P-MUNICIPAL RUNNING COST
30052305130EQQ67ZZHO OC: REMUNERATION TO WARD COMMITTEES
4,494,400 REMUNERATION TO WARD COMITTEES_34
30052305720EQQ77ZZHO OC: TOLL GATE FEES 27,000 SUBSISTANCE & TRAVELING - CORPORATE_35

201
30052305720EQQ89ZZHO OC: TOLL GATE FEES 30,000 TRAINING (COUNCILLORS)_50
30052305760EQP98ZZHO OC: T&S DOM - ACCOMMODATION
50,000 EMPLOYEES BURSARY FUND_52
30052305760EQQ20ZZHO OC: T&S DOM - ACCOMMODATION
40,000 JOB EVALUATION - EVALUATION OF OUTS_56
30052305760EQQ49ZZHO OC: T&S DOM - ACCOMMODATION
20,000 MAYORÆS BURSARY FUND_51
30052305760EQR00ZZHO OC: T&S DOM - ACCOMMODATION/ward comitee
696,000 TRAVEL & SUBSISTANCE - WARD COMITEE_31
30052305810EQQ77ZZHO OC: T&S DOM TRP - W/OUT OPR OWN TRANSPRT
100,000 SUBSISTANCE & TRAVELING - CORPORATE_35
30052305810EQQ93ZZHO OC: T&S DOM TRP - W/OUT OPR OWN TRANSPRT
56,600 TRANSPORT - NON EMPLOYEES_59
30052305810EQQ95ZZHO OC: T&S DOM TRP - W/OUT OPR OWN TRANSPRT
857,200 TRAVEL & SUBSISTANCE - COUNCILLORS _38
30052305830EQP73ZZHO OC: T&S DOM PUB TRP - AIR TRANSPORT
12,000 ATTENTING ANNUAL GOVTECH CONFERENCE_64
30052306100EQQ10ZZHO OC: UNIFORM & PROTECTIVE CLOTHING
700,000 HEALTH AND SAFETY_54
30052306100EQQ47ZZHO OC: UNIFORM & PROTECTIVE CLOTHING
30,000 MANDELA DAY_40
30052306300EQQ04ZZHO OC: VEHICLE TRACKING 400,000 FLEET MANAGEMENT_41
30052306610PRMRCZZHO OC: WET FUEL 2,892,000 P-MUNICIPAL RUNNING COST
30052306620PRMRCZZHO OC: WORKMEN'S COMPENSATION FUND
530,000 P-MUNICIPAL RUNNING COST
30052300100PRMRCZZHO OC:HYGIENE-HYGIENE 270,000 OC:HYGIENE-HYGIENE
30052262100DGMRCZZHO OC:HYGIENE-HYGIENE-GRANT 358,000 OC:HYGIENE-HYGIENE-GRANT

202
30052381500PRMRCZZHO OPR LEASES: FURNITURE & OFFICE EQUIPMENT
1,765,000 P-MUNICIPAL RUNNING COST
34052260630EQP84ZZHO OS: CLEARING & GRASS CUTTING SERVICES
88,722 CLEARING AND GRASS CUTTING_169
34052264500EQQ46ZZHO OS: PERSONNEL & LABOUR 2,437,292 MANAGEMENT OF EPWP _178
34052264500F2Q46ZZHO OS: PERSONNEL & LABOUR 1,062,708 MANAGEMENT OF EPWP _178
34052283600EQQ42ZZHO CONTR: MAINT OF BUILDINGS & FACILITIES
127,200 MAINTENANCE OF COMMUNITY HALLS_171
34052283600EQQ44ZZHO CONTR: MAINT OF BUILDINGS & FACILITIES
1,000,000 MAINTENANCE OF MUNICIPAL FACILITIES_167
34052283600EQQ45ZZHO CONTR: MAINT OF BUILDINGS & FACILITIES
400,000 MAINTENANCE OF SPORT FACILITIES _168
34052284540EQP89ZZHO
CONTR: PRESER/RESTOR/DISMANT/CLEAN SERV
66,780 CONTR: PRESER/RESTOR/DISMANT/CLEAN _172
3405226037OEQR12ZZHO LANDFILL PROVISSION COST 1,752,668 LANDFILL PROVISSION COST
34052305760EQMRCZZHO OC: T&S DOM - ACCOMMODATION
50,000
34052305770WSMRCZZHO OC: T&S DOM TRP - W/OUT OPR OWN TRANSPRT
100,000
34052300160F2Q46ZZHO OC: ADV/PUB/MARK - SIGNS 100,000 MANAGEMENT OF EPWP _178
34052306100F2Q46ZZHO OC: UNIFORM & PROTECTIVE CLOTHING
284,292 MANAGEMENT OF EPWP _178
34052323600F2Q46ZZHO INVENTORY - MATERIALS & SUPPLIES
100,000 MANAGEMENT OF EPWP _178
34102265710EQQ61ZZHO OS: TRAFFIC FINES MANAGEMENT 178,500 OS: TRAFFIC FINES MANAGEMENT_188
34102305780FIMRCZZWM OC: T&S DOM - ACCOMMODATION
50,000

203
34102305770FIMRCZZWM OC: T&S DOM TRP - W/OUT OPR OWN TRANSPRT
100,000
34102283600EQQ92ZZHO CONTR: MAINT OF BUILDINGS & FACILITIES
100,000 TRANSFER STATION _187
34102304510FIMRCZZHO OC: PRINTING & PUBLICATIONS 42,400 P-MUNICIPAL RUNNING COST
34102307020EQQ92ZZHO OC: INDIGENT RELIEF 50,000 TRANSFER STATION _187
34102320600FIMRCZZWM INV - CONSUMABLE STORES - STANDARD RATED
100,000 P-MUNICIPAL RUNNING COST
34162260010EQQ25ZZHO OS: ADMINISTRATIVE & SUPPORT STAFF
4,000,000 LANDFILL SITE MANAGEMENT _179
34162283610EQQ43ZZHO CONTR: MAINTENANCE OF EQUIPMENT
127,200 MAINTENANCE OF EQUIPMENT - COMMUNIT_182
34162320610WSMRCZZWM INV - CONSUMABLE STORES - ZERO RATED
300,000 P-MUNICIPAL RUNNING COST
30102260600EQP81ZZHO OS: CATERING SERVICES 43,460 CATETRING SERVICES - COUNCIL SUPPOR_72
30102260600EQP83ZZHO OS: CATERING SERVICES 50,000 CHILDREN PROGRAMMES_82
30102260600EQP95ZZHO OS: CATERING SERVICES 50,000 DISABILITY PROGRAMMES_83
30102260600EQQ07ZZHO OS: CATERING SERVICES 50,000 GENDER PROGRAMMES_81
30102260600EQQ11ZZHO OS: CATERING SERVICES 50,000 HIV/AIDS PROGRAMMES_84
30102260600EQQ48ZZHO OS: CATERING SERVICES 11,260 MAYOR TOURNEMENT_86
30102260600EQQ50ZZHO OS: CATERING SERVICES 106,000 MAYORAL IMBIZO_76
30102260600EQQ78ZZHO OS: CATERING SERVICES 45,000 SUPPORT BACK TO SCHOOL PROGRAMMES_85
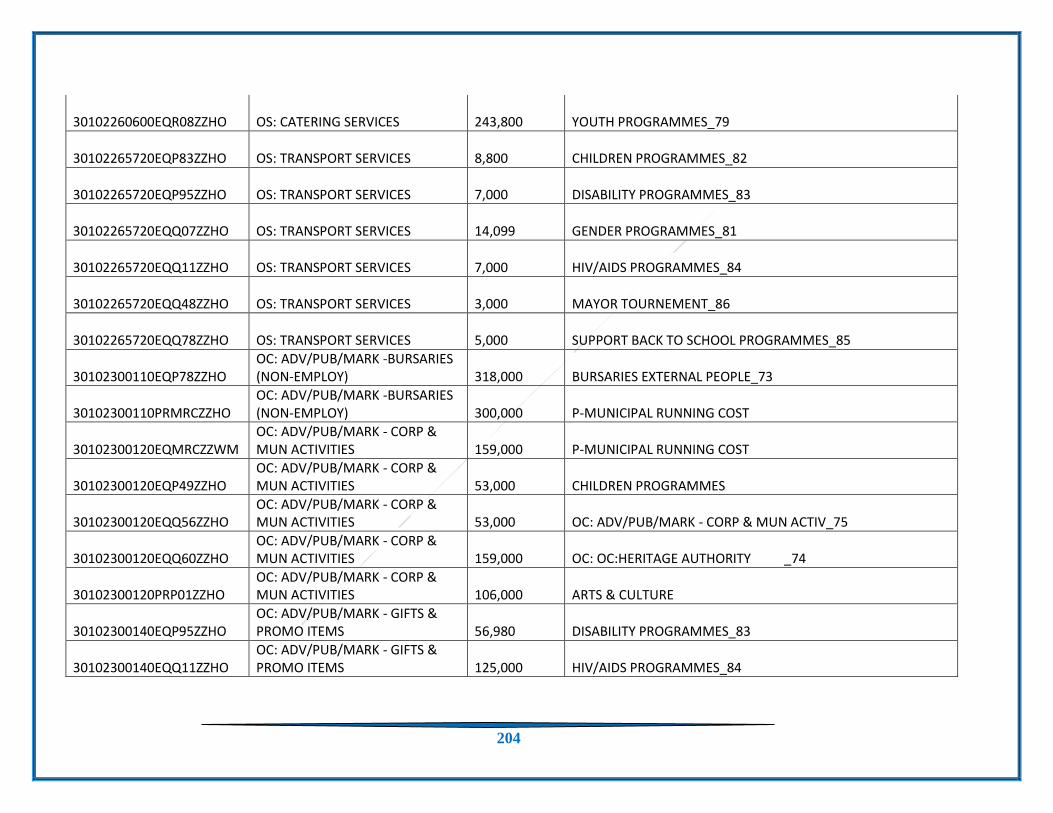
204
30102260600EQR08ZZHO OS: CATERING SERVICES 243,800 YOUTH PROGRAMMES_79
30102265720EQP83ZZHO OS: TRANSPORT SERVICES 8,800 CHILDREN PROGRAMMES_82
30102265720EQP95ZZHO OS: TRANSPORT SERVICES 7,000 DISABILITY PROGRAMMES_83
30102265720EQQ07ZZHO OS: TRANSPORT SERVICES 14,099 GENDER PROGRAMMES_81
30102265720EQQ11ZZHO OS: TRANSPORT SERVICES 7,000 HIV/AIDS PROGRAMMES_84
30102265720EQQ48ZZHO OS: TRANSPORT SERVICES 3,000 MAYOR TOURNEMENT_86
30102265720EQQ78ZZHO OS: TRANSPORT SERVICES 5,000 SUPPORT BACK TO SCHOOL PROGRAMMES_85
30102300110EQP78ZZHO OC: ADV/PUB/MARK -BURSARIES (NON-EMPLOY)
318,000 BURSARIES EXTERNAL PEOPLE_73
30102300110PRMRCZZHO OC: ADV/PUB/MARK -BURSARIES (NON-EMPLOY)
300,000 P-MUNICIPAL RUNNING COST
30102300120EQMRCZZWM OC: ADV/PUB/MARK - CORP & MUN ACTIVITIES
159,000 P-MUNICIPAL RUNNING COST
30102300120EQP49ZZHO OC: ADV/PUB/MARK - CORP & MUN ACTIVITIES
53,000 CHILDREN PROGRAMMES
30102300120EQQ56ZZHO OC: ADV/PUB/MARK - CORP & MUN ACTIVITIES
53,000 OC: ADV/PUB/MARK - CORP & MUN ACTIV_75
30102300120EQQ60ZZHO OC: ADV/PUB/MARK - CORP & MUN ACTIVITIES
159,000 OC: OC:HERITAGE AUTHORITY _74
30102300120PRP01ZZHO OC: ADV/PUB/MARK - CORP & MUN ACTIVITIES
106,000 ARTS & CULTURE
30102300140EQP95ZZHO OC: ADV/PUB/MARK - GIFTS & PROMO ITEMS
56,980 DISABILITY PROGRAMMES_83
30102300140EQQ11ZZHO OC: ADV/PUB/MARK - GIFTS & PROMO ITEMS
125,000 HIV/AIDS PROGRAMMES_84

205
30102300140EQQ48ZZHO OC: ADV/PUB/MARK - GIFTS & PROMO ITEMS
8,000 MAYOR TOURNEMENT_86
30102300140EQQ78ZZHO OC: ADV/PUB/MARK - GIFTS & PROMO ITEMS
22,800 SUPPORT BACK TO SCHOOL PROGRAMMES_85
30102300150EQQ57ZZHO OC: ADV/PUB/MARK - MUNICIPAL NEWSLETTERS
392,200 OC: ADV/PUB/MARK - MUNICIPAL NEWSLE_77
30102300150PRMRCZZWM OC: ADV/PUB/MARK - MUNICIPAL NEWSLETTERS
120,000 P-MUNICIPAL RUNNING COST
30102300150PRP30ZZHO OC: ADV/PUB/MARK - MUNICIPAL NEWSLETTERS
250,000 SUPPORT FOR WARD COMMITTEES
30102300160EQQ58ZZHO OC: ADV/PUB/MARK - SIGNS 570,800 OC: ADV/PUB/MARK - SIGNS_78
30102300160PRP02ZZHO OC: ADV/PUB/MARK - SIGNS 573,490 COMMUNITY PARTICIPATION
30102301870EQP83ZZHO OC: HIRE CHARGES 26,000 CHILDREN PROGRAMMES_82
30102301870EQP95ZZHO OC: HIRE CHARGES 27,000 DISABILITY PROGRAMMES_83
30102301870EQQ07ZZHO OC: HIRE CHARGES 44,000 GENDER PROGRAMMES_81
30102301870EQQ11ZZHO OC: HIRE CHARGES 30,000 HIV/AIDS PROGRAMMES_84
30102301870EQQ59ZZHO OC: HIRE CHARGES 90,100 OC: HIRE CHARGES_80
30102301870EQQ78ZZHO OC: HIRE CHARGES 12,000 SUPPORT BACK TO SCHOOL PROGRAMMES_85
30102301870PRMRCZZHO OC: HIRE CHARGES 230,000 P-MUNICIPAL RUNNING COST
30102301870PRP01ZZHO OC: HIRE CHARGES 85,000 ARTS & CULTURE
30102301870PRP02ZZHO OC: HIRE CHARGES 101,980 COMMUNITY PARTICIPATION

206
30102301870PRP26ZZHO OC: HIRE CHARGES 80,000 SPECIAL FOCUS
30102301870PRP28ZZHO OC: HIRE CHARGES 133,000 SPORTS DEVELOPMENT
30102301870PRP29ZZHO OC: HIRE CHARGES 200,000 SPORTS FOR EMPLOYEES
30102301870PRP30ZZHO OC: HIRE CHARGES 80,000 SUPPORT FOR WARD COMMITTEES
30102303330EQQ04ZZHO OC: LIC - VEHICLE LIC & REGISTRATIONS
100,000 FLEET MANAGEMENT_41
30102305110PRMRCZZHO OC: REG FEES NATIONAL 21,000 P-MUNICIPAL RUNNING COST
31052260600EQP68ZZHO OS: CATERING SERVICES 15,000 ANTI-FRAUD & CORRUPTIONS CAMPAIGNS_94
31052260600EQP74ZZHO OS: CATERING SERVICES 100,000 AUDIT & RISK COMMITTEE_88
31052260600EQP79ZZHO OS: CATERING SERVICES 50,000 CATERING SERVICES FOR PMS_90
31052260600EQQ75ZZHO OS: CATERING SERVICES 68,585 STEERING COMMITTEE AND REVIEW_95
31052265400ORMRCZZHO OS: SECURITY SERVICES 14,633,300 P-MUNICIPAL RUNNING COST
31052270320EQP74ZZHO C&PS: B&A AUDIT COMMITTEE 500,000 AUDIT & RISK COMMITTEE_88
31052270400EQQ27ZZHO C&PS: B&A ORGANISATIONAL 60,000 LICENCES & MAINTANANCE OF TEAMMATE_93
31052270400PRMRCZZHO C&PS: B&A ORGANISATIONAL 3,149,000 P-MUNICIPAL RUNNING COST
31052300120EQP53ZZHO OC: ADV/PUB/MARK - CORP & MUN ACTIVITIES
159,000 NEWSLETTER
31052300120EQP54ZZHO OC: ADV/PUB/MARK - CORP & MUN ACTIVITIES
31,460 PUBLICITY

207
31052300200EQP75ZZHO OC: AUDIT COST: EXTERNAL 4,000,000 AUDITOR GENERAL_87
31052304510EQP68ZZHO OC: PRINTING & PUBLICATIONS 74,200 ANTI-FRAUD & CORRUPTIONS CAMPAIGNS_94
31052305760EQP74ZZHO OC: T&S DOM - ACCOMMODATION
50,000 AUDIT & RISK COMMITTEE_88
31052305760PRMRCZZHO OC: T&S DOM - ACCOMMODATION
50,000
3105230580PRMRCZZHO OC: T&S DOM TRP - W/OUT OPR OWN TRANSPRT
80,000
33102260600EQQ91ZZHO OS: CATERING SERVICES 30,000 TRAINING/MEETINGS/WORKSHOPS_134
33102281200EQQ69ZZHO CONTR: ELECTRICAL 853,087 REPAIRS & MAINTANANCE - PURCHASING _133
33102281200EQQ70ZZHO CONTR: ELECTRICAL 530,000 REPAIRS & MAINTANENCE - RECONDITION_135
33102305760EQP70ZZHO OC: T&S DOM - ACCOMMODATION
8,000 ATTENDING IMESA CONFERENCE_136
33102305770EQP70ZZHO OC: T&S DOM - DAILY ALLOWANCE
2,000 ATTENDING IMESA CONFERENCE_136
33102305790EQP70ZZHO OC: T&S DOM - INCIDENTAL COST 1,000 ATTENDING IMESA CONFERENCE_136
33102305810EQP70ZZHO OC: T&S DOM TRP - W/OUT OPR OWN TRANSPRT
3,000 ATTENDING IMESA CONFERENCE_136
33102305810EQQ91ZZHO OC: T&S DOM TRP - W/OUT OPR OWN TRANSPRT
20,000 TRAINING/MEETINGS/WORKSHOPS_134
33102305830EQP70ZZHO OC: T&S DOM PUB TRP - AIR TRANSPORT
6,000 ATTENDING IMESA CONFERENCE_136
33102307020ELMRCZZHO OC: INDIGENT RELIEF 1,537,000 P-MUNICIPAL RUNNING COST
33102340200ELMRCZZWM ELECTRICITY: SELF GENERATION 37,100,000 P-MUNICIPAL RUNNING COST

208
33102722490ELMRCZZWM DEPRECIATION ELEC LV NETWORKS
11,749,326 P-MUNICIPAL RUNNING COST
33202260600F5Q12ZZHO OS: CATERING SERVICES 50,000 HOSTING OF PROVINCIAL & DISTRCT MIG_161
33202272460EQP88ZZHO C&PS: I&P ENGINEERING CIVIL 3,450,000 CONSTRUCTION/MAINANENCE OF CULVERTS_147
33202272460EQQ30ZZHO C&PS: I&P ENGINEERING CIVIL 30,000 MAINTANANCE OF ALLDAYS INTERNAL STR_143
33202272460EQQ31ZZHO C&PS: I&P ENGINEERING CIVIL 48,694 MAINTANANCE OF AVON INTERNAL STREET_148
33202272460EQQ33ZZHO C&PS: I&P ENGINEERING CIVIL 42,000 MAINTANANCE OF DEVREDE INTERNAL STR_144
33202272460EQQ34ZZHO C&PS: I&P ENGINEERING CIVIL 42,000 MAINTANANCE OF DILAENENG INTERNAL S_141
33202272460EQQ36ZZHO C&PS: I&P ENGINEERING CIVIL 42,000 MAINTANANCE OF KROMHOEK INTERNAL ST_146
33202272460EQQ37ZZHO C&PS: I&P ENGINEERING CIVIL 42,000 MAINTANANCE OF MAMEHLABE INTERNAL S_140
33202272460EQQ38ZZHO C&PS: I&P ENGINEERING CIVIL 42,000 MAINTANANCE OF PURASPAN INTERNAL ST_138
33202272460EQQ39ZZHO C&PS: I&P ENGINEERING CIVIL 70,000 MAINTANANCE OF SENWABARWANA INTERNA_142
33202272460EQQ40ZZHO C&PS: I&P ENGINEERING CIVIL 42,000 MAINTANANCE OF TAAIBOSCH INTERNAL S_145
33202272460EQQ41ZZHO C&PS: I&P ENGINEERING CIVIL 42,000 MAINTANANCE OF WITTEN INTERNAL STRE_139
33202283620EQQ30ZZHO CONTR: MAINTENANCE OF UNSPECIFIED ASSETS
70,000 MAINTANANCE OF ALLDAYS INTERNAL STR_143
33202283620EQQ31ZZHO CONTR: MAINTENANCE OF UNSPECIFIED ASSETS
10,000 MAINTANANCE OF AVON INTERNAL STREET_148
33202283620EQQ33ZZHO CONTR: MAINTENANCE OF UNSPECIFIED ASSETS
10,000 MAINTANANCE OF DEVREDE INTERNAL STR_144

209
33202283620EQQ34ZZHO CONTR: MAINTENANCE OF UNSPECIFIED ASSETS
10,000 MAINTANANCE OF DILAENENG INTERNAL S_141
33202283620EQQ36ZZHO CONTR: MAINTENANCE OF UNSPECIFIED ASSETS
10,000 MAINTANANCE OF KROMHOEK INTERNAL ST_146
33202283620EQQ37ZZHO CONTR: MAINTENANCE OF UNSPECIFIED ASSETS
10,000 MAINTANANCE OF MAMEHLABE INTERNAL S_140
33202283620EQQ38ZZHO CONTR: MAINTENANCE OF UNSPECIFIED ASSETS
10,000 MAINTANANCE OF PURASPAN INTERNAL ST_138
33202283620EQQ39ZZHO CONTR: MAINTENANCE OF UNSPECIFIED ASSETS
30,000 MAINTANANCE OF SENWABARWANA INTERNA_142
33202283620EQQ40ZZHO CONTR: MAINTENANCE OF UNSPECIFIED ASSETS
10,000 MAINTANANCE OF TAAIBOSCH INTERNAL S_145
33202283620EQQ41ZZHO CONTR: MAINTENANCE OF UNSPECIFIED ASSETS
10,000 MAINTANANCE OF WITTEN INTERNAL STRE_139
33202272460EQR13ZZHO CONTR: MAINTENANCE OF UNSPECIFIED ASSETS
52,000 MAINTANANCE OF INDERMARK INTERNAL STRE_139
33202305720F5Q88ZZHO OC: TOLL GATE FEES 2,000 TRAINING - PROJECT MANAGEMENT_160
33202305760F5P70ZZHO OC: T&S DOM - ACCOMMODATION
208,000 ATTENDING IMESA CONFERENCE_136
33202305810F5P70ZZHO OC: T&S DOM TRP - W/OUT OPR OWN TRANSPRT
200,000 ATTENDING IMESA CONFERENCE_136
33202728000PRMRCZZWM DEPRECIATION ROADS 12,003,770 P-MUNICIPAL RUNNING COST
33202728810PRMRCZZWM DEPRECIATION COMMUNITY CENTRES
4,901,656 P-MUNICIPAL RUNNING COST
33202728820PRMRCZZWM DEPRECIATION COMMUNITY CRECHES
7,021,658 P-MUNICIPAL RUNNING COST
33202728900PRMRCZZWM DEPRECIATION COMMUNITY CEMETERIES/CREMAT
4,901,658 P-MUNICIPAL RUNNING COST
32052270300EQQ53ZZHO C&PS: B&A ACCOUNTANTS & AUDITORS
1,558,626 MSCOA PROJECT IMPLEMENTATION_106

210
32052270300EQMRCZZHO C&PS: B&A ACCOUNTANTS & PROPERTY
2,000,000 B&A ACCOUNTANTS & PROPERTY
32052270300EQR05ZZHO C&PS: B&A ACCOUNTANTS & AUDITORS
1,200,000 VAT RECOVERY_103
32052270300FMP87ZZHO C&PS: B&A ACCOUNTANTS & AUDITORS
950,000 COMPILATION OF ANNUAL FINANCIAL STA_105
32052270300FMQ51ZZHO C&PS: B&A ACCOUNTANTS & AUDITORS
250,000 MINIMUM COMPETENCY - INTERNS_110
32052270300FMQ64ZZHO C&PS: B&A ACCOUNTANTS & AUDITORS
200,000 QUALITY REVIEW - AFS_111
32052270340EQP69ZZHO C&PS: B&A BUSINESS & FIN MANAGEMENT
600,000 ASSET MANAGEMENT PLAN_99
32052270340EQQ24ZZHO C&PS: B&A BUSINESS & FIN MANAGEMENT
200,000 LANDFILL REHABILITATION CALCULATION_102
32052270340EQQ65ZZHO C&PS: B&A BUSINESS & FIN MANAGEMENT
700,000 RECORD THE ASSETS ON THE SOLAR SYST_100
32052270340EQQ80ZZHO C&PS: B&A BUSINESS & FIN MANAGEMENT
2,250,000 SYSTEM ADVISOR_107
32052270340EQR04ZZHO C&PS: B&A BUSINESS & FIN MANAGEMENT
900,000 UNBUNDLE THE ASSETS_101
32052270340FMQ05ZZHO C&PS: B&A BUSINESS & FIN MANAGEMENT
400,000 FMCMM IMPLEMENTATION_113
32052300400PRMRCZZHO OC: BC/FAC/C FEES - BANK ACCOUNTS
630,000 P-MUNICIPAL RUNNING COST
32052300910ELMRCZZHO OC: COMMISSION - PREPAID ELECTRICITY
3,000,000 P-MUNICIPAL RUNNING COST
32052305760EQP13ZZHO OC: T&S DOM - ACCOMMODATION
100,000
32052305770EQMRCZZHO OC: T&S DOM TRP - W/OUT OPR OWN TRANSPRT
100,000
32052320600PRMRCZZHO INV - CONSUMABLE STORES - STANDARD RATED
2,070,249 P-MUNICIPAL RUNNING COST

211
32052381500ORMRCZZHO OPR LEASES: FURNITURE & OFFICE EQUIPMENT
447,256 P-MUNICIPAL RUNNING COST
32052400010PRMRCZZHO BAD DEBTS WRITTEN OFF 8,746,928 P-MUNICIPAL RUNNING COST
32052721500PRMRCZZWM DEPRECIATION FURNITURE & OFFICE EQUIPM
1,273,870 P-MUNICIPAL RUNNING COST
32052723600PRMRCZZWM DEPRECIATION MACHINERY & EQUIPMENT
2,136,278 P-MUNICIPAL RUNNING COST
30052030850EQMRCZZHO SM D01: SAL & ALL - BASIC SALARY
729,932 P-MUNICIPAL RUNNING COST
30052030870EQMRCZZHO SM D01: ALLOW - CELLULAR & TELEPHONE
30,432 P-MUNICIPAL RUNNING COST
30052030890EQMRCZZHO SM D01: ALLOW - TRAVEL OR MOTOR VEHICLE
235,165 P-MUNICIPAL RUNNING COST
30052051000EQMRCZZHO SM D01: SOC CONTR: GROUP LIFE INSURANCE
231,849 P-MUNICIPAL RUNNING COST
30052051020EQMRCZZHO SM D01: SOC CONTR: PENSION FUNDS
108,300 P-MUNICIPAL RUNNING COST
30052051030EQMRCZZHO SM D01: SOC CONTR: UIF 2,167 P-MUNICIPAL RUNNING COST
30052051040EQMRCZZHO SM D01: SOC CONTR: BARGAINING COUNCIL
119 P-MUNICIPAL RUNNING COST
30052110010EQMRCZZHO MS: SAL & ALL: BASIC SALARY & WAGES
23,191,901 P-MUNICIPAL RUNNING COST
30052110220EQMRCZZHO MS: ALL - CELLULAR & TELEPHONE
513,796 P-MUNICIPAL RUNNING COST
30052110260EQMRCZZHO MS: HB & INC: HOUSING BENEFITS
35,791 P-MUNICIPAL RUNNING COST
30052110320EQMRCZZHO MS: ALL - LEAVE PAY 513,038 P-MUNICIPAL RUNNING COST
30052110340EQMRCZZHO MS: ALL - TRAVEL OR MOTOR VEHICLE
3,887,783 P-MUNICIPAL RUNNING COST

212
30052110360EQMRCZZHO MS: OVERTIME - NON STRUCTURED
386,452 P-MUNICIPAL RUNNING COST
30052110440EQMRCZZHO MS: SRB - ACTING ALLOWANCE 27,478 P-MUNICIPAL RUNNING COST
30052110460EQMRCZZHO MS: SRB - ANNUAL BONUS 2,076,931 P-MUNICIPAL RUNNING COST
30052130010EQMRCZZHO MS: SOC CONTR - BARGAINING COUNCIL
5,649 P-MUNICIPAL RUNNING COST
30052130100EQMRCZZHO MS: SOC CONTR - GROUP LIFE INSURANCE
34,670 P-MUNICIPAL RUNNING COST
30052130200EQMRCZZHO MS: SOC CONTR - MEDICAL 1,007,425 P-MUNICIPAL RUNNING COST
30052130300EQMRCZZHO MS: SOC CONTR - PENSION 4,556,663 P-MUNICIPAL RUNNING COST
30052130400EQMRCZZHO MS: SOC CONTR - UNEMPLOYMENT INSUR FUND
249,232 P-MUNICIPAL RUNNING COST
30052305410PRMRCZZHO OC: SKILLS DEVELOPMENT FUND LEVY
275,575 P-MUNICIPAL RUNNING COST
30102210050EQMRCZZHO SPEAKER: TRAVELLING ALLOWANCE
259,419 P-MUNICIPAL RUNNING COST
30102210100EQMRCZZHO SPEAKER: BASIC SALARY 633,637 P-MUNICIPAL RUNNING COST
30102210120EQMRCZZHO SPEAKER: CELL PHONE ALLOWANCE
56,035 P-MUNICIPAL RUNNING COST
30102210350EQMRCZZHO WHIP: TRAVELLING ALLOWANCE 185,333 P-MUNICIPAL RUNNING COST
30102210400EQMRCZZHO WHIP: BASIC SALARY 550,014 P-MUNICIPAL RUNNING COST
30102210420EQMRCZZHO WHIP: CELL PHONE ALLOWANCE 56,035 P-MUNICIPAL RUNNING COST
30102210650EQMRCZZHO EXEC MAYOR: TRAVELLING ALLOWANCE
201,938 P-MUNICIPAL RUNNING COST

213
30102210700EQMRCZZHO EXEC MAYOR: BASIC SALARY 632,396 P-MUNICIPAL RUNNING COST
30102210720EQMRCZZHO EXEC MAYOR: CELL PHONE ALLOWANCE
56,035 P-MUNICIPAL RUNNING COST
30102211250EQMRCZZHO EXCO: TRAVELLING ALLOWANCE 467,298 P-MUNICIPAL RUNNING COST
30102211300EQMRCZZHO EXCO: BASIC SALARY 1,445,188 P-MUNICIPAL RUNNING COST
30102211320EQMRCZZHO EXCO: CELL PHONE ALLOWANCE 390,179 P-MUNICIPAL RUNNING COST
30102211550EQMRCZZHO OTH COUNCIL: TRAVELLING ALLOWANCE
2,687,320 P-MUNICIPAL RUNNING COST
30102211600EQMRCZZHO OTH COUNCIL: BASIC SALARY 7,506,557 P-MUNICIPAL RUNNING COST
30102211620EQMRCZZHO OTH COUNCIL: CELL PHONE ALLOWANCE
1,762,077 P-MUNICIPAL RUNNING COST
30102220050EQMRCZZHO SPEAKER: PENSION FUND CONTRIBUTIONS
48,913 P-MUNICIPAL RUNNING COST
30102220350EQMRCZZHO WHIP: PENSION FUND CONTRIBUTIONS
45,974 P-MUNICIPAL RUNNING COST
30102220650EQMRCZZHO EXEC MAYOR: PENSION FUND CONTRIBUTIONS
248,579 P-MUNICIPAL RUNNING COST
30102221250EQMRCZZHO EXCO: PENSION FUND CONTRIBUTIONS
883,469 P-MUNICIPAL RUNNING COST
31052030050EQMRCZZHO SM MM: SAL & ALL - BASIC SALARY
1,014,802 P-MUNICIPAL RUNNING COST
31052030060EQMRCZZHO SM MM: SAL & ALL - PERFORM BASED BONUS
64,459 P-MUNICIPAL RUNNING COST
31052030070EQMRCZZHO SM MM: ALLOW - CELLULAR & TELEPHONE
29,316 P-MUNICIPAL RUNNING COST
31052030090EQMRCZZHO SM MM: ALLOW - TRAVEL OR MOTOR VEHICLE
311,527 P-MUNICIPAL RUNNING COST

214
31052030160EQP80ZZHO SM MM: SRB - ENTERTAINMENT 80,000 CATERING/REFRESHMENTS - DIRECTORS_89
31052050200EQMRCZZHO SM MM: SOC CONTR: GROUP LIFE INSURANCE
23,229 P-MUNICIPAL RUNNING COST
31052050220EQMRCZZHO SM MM: SOC CONTR: PENSION FUNDS
125,249 P-MUNICIPAL RUNNING COST
31052050230EQMRCZZHO SM MM: SOC CONTR: UIF 2,128 P-MUNICIPAL RUNNING COST
31052050240EQMRCZZHO SM MM: SOC CONTR: BARGAINING COUNCIL
117 P-MUNICIPAL RUNNING COST
31052110010EQMRCZZHO MS: SAL & ALL: BASIC SALARY & WAGES
7,092,280 P-MUNICIPAL RUNNING COST
31052110220EQMRCZZHO MS: ALL - CELLULAR & TELEPHONE
346,727 P-MUNICIPAL RUNNING COST
31052110320EQMRCZZHO MS: ALL - LEAVE PAY 365,336 P-MUNICIPAL RUNNING COST
31052110340EQMRCZZHO MS: ALL - TRAVEL OR MOTOR VEHICLE
2,639,010 P-MUNICIPAL RUNNING COST
31052110440EQMRCZZHO MS: SRB - ACTING ALLOWANCE 129,726 P-MUNICIPAL RUNNING COST
31052110460EQMRCZZHO MS: SRB - ANNUAL BONUS 635,607 P-MUNICIPAL RUNNING COST
31052130010EQMRCZZHO MS: SOC CONTR - BARGAINING COUNCIL
1,965 P-MUNICIPAL RUNNING COST
31052130200EQMRCZZHO MS: SOC CONTR - MEDICAL 337,895 P-MUNICIPAL RUNNING COST
31052130300EQMRCZZHO MS: SOC CONTR - PENSION 1,830,548 P-MUNICIPAL RUNNING COST
31052130400EQMRCZZHO MS: SOC CONTR - UNEMPLOYMENT INSUR FUND
85,495 P-MUNICIPAL RUNNING COST
31052305410EQMRCZZHO OC: SKILLS DEVELOPMENT FUND LEVY
304,559 P-MUNICIPAL RUNNING COST

215
32052030450EQMRCZZHO SM CFO: SAL & ALL - BASIC SALARY
729,932 P-MUNICIPAL RUNNING COST
32052030460EQMRCZZHO SM CFO: SAL & ALL - PERFORM BASED BONUS
54,060 P-MUNICIPAL RUNNING COST
32052030470EQMRCZZHO SM CFO: ALLOW - CELLULAR & TELEPHONE
30,432 P-MUNICIPAL RUNNING COST
32052030490EQMRCZZHO SM CFO: ALLOW - TRAVEL OR MOTOR VEHICLE
205,996 P-MUNICIPAL RUNNING COST
32052050600EQMRCZZHO SM CFO: SOC CONTR: GROUP LIFE INSURANCE
23,668 P-MUNICIPAL RUNNING COST
32052050620EQMRCZZHO SM CFO: SOC CONTR: PENSION FUNDS
108,300 P-MUNICIPAL RUNNING COST
32052050630EQMRCZZHO SM CFO: SOC CONTR: UIF 2,167 P-MUNICIPAL RUNNING COST
32052050640EQMRCZZHO SM CFO: SOC CONTR: BARGAINING COUNCIL
119 P-MUNICIPAL RUNNING COST
32052110010EQMRCZZHO MS: SAL & ALL: BASIC SALARY & WAGES
8,426,470 P-MUNICIPAL RUNNING COST
32052110010FMQ73ZZHO MS: SAL & ALL: BASIC SALARY & WAGES
500,000 SALARIES & WAGES INTERNS_114
32052110220EQMRCZZHO MS: ALL - CELLULAR & TELEPHONE
321,516 P-MUNICIPAL RUNNING COST
32052110260EQMRCZZHO MS: HB & INC: HOUSING BENEFITS
107,000 P-MUNICIPAL RUNNING COST
32052110320EQMRCZZHO MS: ALL - LEAVE PAY 319,112 P-MUNICIPAL RUNNING COST
32052110340EQMRCZZHO MS: ALL - TRAVEL OR MOTOR VEHICLE
2,330,233 P-MUNICIPAL RUNNING COST
32052110360EQMRCZZHO MS: OVERTIME - NON STRUCTURED
228,980 P-MUNICIPAL RUNNING COST
32052110440EQMRCZZHO MS: SRB - ACTING ALLOWANCE 71,631 P-MUNICIPAL RUNNING COST

216
32052110460EQMRCZZHO MS: SRB - ANNUAL BONUS 914,511 P-MUNICIPAL RUNNING COST
32052130010EQMRCZZHO MS: SOC CONTR - BARGAINING COUNCIL
3,439 P-MUNICIPAL RUNNING COST
32052130200EQMRCZZHO MS: SOC CONTR - MEDICAL 613,215 P-MUNICIPAL RUNNING COST
32052130300EQMRCZZHO MS: SOC CONTR - PENSION 2,114,281 P-MUNICIPAL RUNNING COST
32052130400EQMRCZZHO MS: SOC CONTR - UNEMPLOYMENT INSUR FUND
96,420 P-MUNICIPAL RUNNING COST
32052142200EQMRCZZHO MS: PRB - OTHER: LONG TERM SERVICE AWARD
89,238 P-MUNICIPAL RUNNING COST
32052305410EQMRCZZHO OC: SKILLS DEVELOPMENT FUND LEVY
69,515 P-MUNICIPAL RUNNING COST
33052031250EQMRCZZHO SM D02: SAL & ALL - BASIC SALARY
93,931 P-MUNICIPAL RUNNING COST
33052031260EQMRCZZHO SM D02: SAL & ALL - PERFORM BASED BONUS
53,000 P-MUNICIPAL RUNNING COST
33052031270EQMRCZZHO SM D02: ALLOW - CELLULAR & TELEPHONE
30,432 P-MUNICIPAL RUNNING COST
33052031290EQMRCZZHO SM D02: ALLOW - TRAVEL OR MOTOR VEHICLE
205,995 P-MUNICIPAL RUNNING COST
33052051400EQMRCZZHO SM D02: SOC CONTR: GROUP LIFE INSURANCE
23,667 P-MUNICIPAL RUNNING COST
33052051420EQMRCZZHO SM D02: SOC CONTR: PENSION FUNDS
108,300 P-MUNICIPAL RUNNING COST
33052051430EQMRCZZHO SM D02: SOC CONTR: UIF 2,167 P-MUNICIPAL RUNNING COST
33052051440EQMRCZZHO SM D02: SOC CONTR: BARGAINING COUNCIL
119 P-MUNICIPAL RUNNING COST
33052110010EQMRCZZHO MS: SAL & ALL: BASIC SALARY & WAGES
1,984,118 P-MUNICIPAL RUNNING COST

217
33052110220EQMRCZZHO MS: ALL - CELLULAR & TELEPHONE
102,642 P-MUNICIPAL RUNNING COST
33052110260EQMRCZZHO MS: HB & INC: HOUSING BENEFITS
23,313 P-MUNICIPAL RUNNING COST
33052110320EQMRCZZHO MS: ALL - LEAVE PAY 121,379 P-MUNICIPAL RUNNING COST
33052110340EQMRCZZHO MS: ALL - TRAVEL OR MOTOR VEHICLE
873,972 P-MUNICIPAL RUNNING COST
33052110360EQMRCZZHO MS: OVERTIME - NON STRUCTURED
279,052 P-MUNICIPAL RUNNING COST
33052110460EQMRCZZHO MS: SRB - ANNUAL BONUS 359,990 P-MUNICIPAL RUNNING COST
33052130010EQMRCZZHO MS: SOC CONTR - BARGAINING COUNCIL
2,052 P-MUNICIPAL RUNNING COST
33052130200EQMRCZZHO MS: SOC CONTR - MEDICAL 105,612 P-MUNICIPAL RUNNING COST
33052130300EQMRCZZHO MS: SOC CONTR - PENSION 849,654 P-MUNICIPAL RUNNING COST
33052130400EQMRCZZHO MS: SOC CONTR - UNEMPLOYMENT INSUR FUND
31,320 P-MUNICIPAL RUNNING COST
33052305410EQMRCZZHO OC: SKILLS DEVELOPMENT FUND LEVY
34,863 P-MUNICIPAL RUNNING COST
33102110010ELMRCZZWM MS: SAL & ALL: BASIC SALARY & WAGES
4,470,213 P-MUNICIPAL RUNNING COST
33102110220ELMRCZZWM MS: ALL - CELLULAR & TELEPHONE
67,829 P-MUNICIPAL RUNNING COST
33102110320ELMRCZZWM MS: ALL - LEAVE PAY 121,380 P-MUNICIPAL RUNNING COST
33102110340ELMRCZZWM MS: ALL - TRAVEL OR MOTOR VEHICLE
516,469 P-MUNICIPAL RUNNING COST
33102110360ELMRCZZWM MS: OVERTIME - NON STRUCTURED
618,995 P-MUNICIPAL RUNNING COST

218
33102110460EQMRCZZHO MS: SRB - ANNUAL BONUS 359,990 P-MUNICIPAL RUNNING COST
33102110560ELMRCZZWM MS: SRB - STANDBY ALLOWANCE 218,676 P-MUNICIPAL RUNNING COST
33102130010ELMRCZZWM MS: SOC CONTR - BARGAINING COUNCIL
845 P-MUNICIPAL RUNNING COST
33102130200ELMRCZZWM MS: SOC CONTR - MEDICAL 283,790 P-MUNICIPAL RUNNING COST
33102130300ELMRCZZWM MS: SOC CONTR - PENSION 815,955 P-MUNICIPAL RUNNING COST
33102130400ELMRCZZWM MS: SOC CONTR - UNEMPLOYMENT INSUR FUND
33,999 P-MUNICIPAL RUNNING COST
33102142200EQMRCZZHO MS: PRB - OTHER: LONG TERM SERVICE AWARD
80,250 P-MUNICIPAL RUNNING COST
33102305410ELMRCZZHO OC: SKILLS DEVELOPMENT FUND LEVY
42,492 P-MUNICIPAL RUNNING COST
33202110010EQMRCZZHO MS: SAL & ALL: BASIC SALARY & WAGES
4,397,768 P-MUNICIPAL RUNNING COST
33202110010F5MRCZZHO MS: SAL & ALL: BASIC SALARY & WAGES
1,293,300 MS: SAL & ALL: BASIC SALARY & WAGES
33202110340F5MRCZZHO MS: ALL - TRAVEL OR MOTOR VEHICLE
360,000 MS: ALL - TRAVEL OR MOTOR VEHICLE
33202110220EQMRCZZHO MS: ALL - CELLULAR & TELEPHONE
144,509 P-MUNICIPAL RUNNING COST
33202110260EQMRCZZHO MS: HB & INC: HOUSING BENEFITS
11,670 P-MUNICIPAL RUNNING COST
33202110320EQMRCZZHO MS: ALL - LEAVE PAY 71,202 P-MUNICIPAL RUNNING COST
33202110340EQMRCZZHO MS: ALL - TRAVEL OR MOTOR VEHICLE
761,123 P-MUNICIPAL RUNNING COST
33202110360EQMRCZZHO MS: OVERTIME - NON STRUCTURED
293,095 P-MUNICIPAL RUNNING COST

219
33202110440EQMRCZZHO MS: SRB - ACTING ALLOWANCE 27,478 P-MUNICIPAL RUNNING COST
33202110460EQMRCZZHO MS: SRB - ANNUAL BONUS 359,988 P-MUNICIPAL RUNNING COST
33202110560EQMRCZZHO MS: SRB - STANDBY ALLOWANCE 45,172 P-MUNICIPAL RUNNING COST
33202130010EQMRCZZHO MS: SOC CONTR - BARGAINING COUNCIL
2,166 P-MUNICIPAL RUNNING COST
33202130200EQMRCZZHO MS: SOC CONTR - MEDICAL 248,322 P-MUNICIPAL RUNNING COST
33202130300EQMRCZZHO MS: SOC CONTR - PENSION 1,060,465 P-MUNICIPAL RUNNING COST
33202130400EQMRCZZHO MS: SOC CONTR - UNEMPLOYMENT INSUR FUND
44,186 P-MUNICIPAL RUNNING COST
33202142200EQMRCZZHO MS: PRB - OTHER: LONG TERM SERVICE AWARD
187,250 P-MUNICIPAL RUNNING COST
33202305410EQMRCZZHO OC: SKILLS DEVELOPMENT FUND LEVY
116,828 P-MUNICIPAL RUNNING COST
34052031650EQMRCZZHO SM D03: SAL & ALL - BASIC SALARY
729,931 P-MUNICIPAL RUNNING COST
34052031660EQMRCZZHO SM D03: SAL & ALL - PERFORM BASED BONUS
53,000 P-MUNICIPAL RUNNING COST
34052031670EQMRCZZHO SM D03: ALLOW - CELLULAR & TELEPHONE
30,432 P-MUNICIPAL RUNNING COST
34052031690EQMRCZZHO SM D03: ALLOW - TRAVEL OR MOTOR VEHICLE
205,996 P-MUNICIPAL RUNNING COST
34052051800EQMRCZZHO SM D03: SOC CONTR: GROUP LIFE INSURANCE
23,668 P-MUNICIPAL RUNNING COST
34052051820EQMRCZZHO SM D03: SOC CONTR: PENSION FUNDS
108,300 P-MUNICIPAL RUNNING COST
34052051830EQMRCZZHO SM D03: SOC CONTR: UIF 2,167 P-MUNICIPAL RUNNING COST

220
34052051840EQMRCZZHO SM D03: SOC CONTR: BARGAINING COUNCIL
119 P-MUNICIPAL RUNNING COST
34052110010EQMRCZZHO MS: SAL & ALL: BASIC SALARY & WAGES
6,460,242 P-MUNICIPAL RUNNING COST
34052110220EQMRCZZHO MS: ALL - CELLULAR & TELEPHONE
138,060 P-MUNICIPAL RUNNING COST
34052110260EQMRCZZHO MS: HB & INC: HOUSING BENEFITS
21,382 P-MUNICIPAL RUNNING COST
34052110320EQMRCZZHO MS: ALL - LEAVE PAY 217,182 P-MUNICIPAL RUNNING COST
34052110340EQMRCZZHO MS: ALL - TRAVEL OR MOTOR VEHICLE
1,124,284 P-MUNICIPAL RUNNING COST
34052110360EQMRCZZHO MS: OVERTIME - NON STRUCTURED
222,111 P-MUNICIPAL RUNNING COST
34052110440EQMRCZZHO MS: SRB - ACTING ALLOWANCE 27,478 P-MUNICIPAL RUNNING COST
34052110460EQMRCZZHO MS: SRB - ANNUAL BONUS 680,353 P-MUNICIPAL RUNNING COST
34052110560EQMRCZZHO MS: SRB - STANDBY ALLOWANCE 26,957 P-MUNICIPAL RUNNING COST
34052130010EQMRCZZHO MS: SOC CONTR - BARGAINING COUNCIL
2,415 P-MUNICIPAL RUNNING COST
34052130200EQMRCZZHO MS: SOC CONTR - MEDICAL 455,467 P-MUNICIPAL RUNNING COST
34052130300EQMRCZZHO MS: SOC CONTR - PENSION 1,608,412 P-MUNICIPAL RUNNING COST
34052130400EQMRCZZHO MS: SOC CONTR - UNEMPLOYMENT INSUR FUND
57,394 P-MUNICIPAL RUNNING COST
34052142200EQMRCZZHO MS: PRB - OTHER: LONG TERM SERVICE AWARD
160,500 P-MUNICIPAL RUNNING COST
34052305410WSMRCZZHO OC: SKILLS DEVELOPMENT FUND LEVY
108,328 P-MUNICIPAL RUNNING COST

221
34102110010EQMRCZZHO MS: SAL & ALL: BASIC SALARY & WAGES
7,225,293 P-MUNICIPAL RUNNING COST
34102110220EQMRCZZHO MS: ALL - CELLULAR & TELEPHONE
247,126 P-MUNICIPAL RUNNING COST
34102110260EQMRCZZHO MS: HB & INC: HOUSING BENEFITS
21,383 P-MUNICIPAL RUNNING COST
34102110320EQMRCZZHO MS: ALL - LEAVE PAY 208,376 P-MUNICIPAL RUNNING COST
34102110340EQMRCZZHO MS: ALL - TRAVEL OR MOTOR VEHICLE
1,687,970 P-MUNICIPAL RUNNING COST
34102110360EQMRCZZHO MS: OVERTIME - NON STRUCTURED
471,699 P-MUNICIPAL RUNNING COST
34102110440EQMRCZZHO MS: SRB - ACTING ALLOWANCE 27,478 P-MUNICIPAL RUNNING COST
34102110460EQMRCZZWM MS: SRB - ANNUAL BONUS 680,358 P-MUNICIPAL RUNNING COST
34102110560EQMRCZZHO MS: SRB - STANDBY ALLOWANCE 223,714 P-MUNICIPAL RUNNING COST
34102130010EQMRCZZHO MS: SOC CONTR - BARGAINING COUNCIL
2,778 P-MUNICIPAL RUNNING COST
34102130200EQMRCZZHO MS: SOC CONTR - MEDICAL 816,942 P-MUNICIPAL RUNNING COST
34102130300EQMRCZZHO MS: SOC CONTR - PENSION 2,019,149 P-MUNICIPAL RUNNING COST
34102130400EQMRCZZHO MS: SOC CONTR - UNEMPLOYMENT INSUR FUND
74,943 P-MUNICIPAL RUNNING COST
34102142200EQMRCZZHO MS: PRB - OTHER: LONG TERM SERVICE AWARD
160,500 P-MUNICIPAL RUNNING COST
34102305410FIMRCZZHO OC: SKILLS DEVELOPMENT FUND LEVY
196,725 P-MUNICIPAL RUNNING COST
34102305410FIMRCZZWM OC: SKILLS DEVELOPMENT FUND LEVY
219,433 P-MUNICIPAL RUNNING COST

222
35052032450EQMRCZZHO SM D05: SAL & ALL - BASIC SALARY
729,931 P-MUNICIPAL RUNNING COST
35052032460EQMRCZZHO SM D05: SAL & ALL - PERFORM BASED BONUS
53,000 P-MUNICIPAL RUNNING COST
35052032470EQMRCZZHO SM D05: ALLOW - CELLULAR & TELEPHONE
30,432 P-MUNICIPAL RUNNING COST
35052032490EQMRCZZHO SM D05: ALLOW - TRAVEL OR MOTOR VEHICLE
205,996 P-MUNICIPAL RUNNING COST
35052052600EQMRCZZHO SM D05: SOC CONTR: GROUP LIFE INSURANCE
23,667 P-MUNICIPAL RUNNING COST
35052052620EQMRCZZHO SM D05: SOC CONTR: PENSION FUNDS
108,300 P-MUNICIPAL RUNNING COST
35052052630EQMRCZZHO SM D05: SOC CONTR: UIF 2,167 P-MUNICIPAL RUNNING COST
35052052640EQMRCZZHO SM D05: SOC CONTR: BARGAINING COUNCIL
119 P-MUNICIPAL RUNNING COST
35052110010EQMRCZZHO MS: SAL & ALL: BASIC SALARY & WAGES
4,325,133 P-MUNICIPAL RUNNING COST
35052110220EQMRCZZHO MS: ALL - CELLULAR & TELEPHONE
166,748 P-MUNICIPAL RUNNING COST
35052110260EQMRCZZHO MS: HB & INC: HOUSING BENEFITS
23,860 P-MUNICIPAL RUNNING COST
35052110320EQMRCZZHO MS: ALL - LEAVE PAY 139,800 P-MUNICIPAL RUNNING COST
35052110340EQMRCZZHO MS: ALL - TRAVEL OR MOTOR VEHICLE
1,531,697 P-MUNICIPAL RUNNING COST
35052110440EQMRCZZHO MS: SRB - ACTING ALLOWANCE 63,224 P-MUNICIPAL RUNNING COST
35052110460EQMRCZZHO MS: SRB - ANNUAL BONUS 362,461 P-MUNICIPAL RUNNING COST
35052130010EQMRCZZHO MS: SOC CONTR - BARGAINING COUNCIL
1,107 P-MUNICIPAL RUNNING COST

223
35052130200EQMRCZZHO MS: SOC CONTR - MEDICAL 197,104 P-MUNICIPAL RUNNING COST
35052130300EQMRCZZHO MS: SOC CONTR - PENSION 1,043,887 P-MUNICIPAL RUNNING COST
35052130400EQMRCZZHO MS: SOC CONTR - UNEMPLOYMENT INSUR FUND
43,495 P-MUNICIPAL RUNNING COST
35052142200EQMRCZZHO MS: PRB - OTHER: LONG TERM SERVICE AWARD
80,574 P-MUNICIPAL RUNNING COST
35052305410EQMRCZZHO OC: SKILLS DEVELOPMENT FUND LEVY
79,675 P-MUNICIPAL RUNNING COST
30056151420OFD89ZZWM PROCURING NEW SOFTWARE_68 608,000
30056151420OFD97ZZWM RECORD MANAGEMENT SYSTEM_71
1,040,000
30056420420OFD75ZZWM FLEET MANAGEMENT - PURCHASING NEW A_44
1,400,000
30056470020OFD65ZZWM DISASTER RECOVERY CENTER_67 750,000
30056474020OFE25ZZHO Carports 150,000 Carports
30056456020OFE18ZZHO AIRCONDITIONERS 550,000 Asphalt Cutter
30056470020OFD87ZZWM PROCURING NEW COMPUTERS\LAPTOPS_69
200,000 Concrete Mixer
30056470020OFD88ZZWM PROCURING NEW IT EQUIPMENT_70
500,000 Ramer
34056456020OFE20ZZHO DUSTBINS - INDUSTRIAL 500,000
30056470020OFD96ZZWM RECORD MANAGEMENT SYSTEM_71
160,000
31056470020OFD86ZZWM PROCURING ACCESS CONTROL SYSTEM_97
650,000

224
31056470020OFD91ZZWM PROCURING SECURITY CAMERAS_98
150,000
32056460020OFD76ZZWM FURNITURE_116 50,000
30056460020OFE19ZZHO FURNITURE AT SATELLITE 220,000
32056470020OFD60ZZWM COMPUTER EQUIPMENT - LAPTOPS_117
200,000
32056470020OFD80ZZWM IT EQUIPMENT_115 100,000
33106456020OFD90ZZWM PROCURING OF GENERATORS_132
1,353,087
33106610020OFD79ZZWM INSTALLATION OF NEW EMERGENCY TRANS_127
550,000
33206456020OFD95ZZWM PURCHASING OF RAMMER_150 30,000
33206473520OFD64ZZWM CONSTRUCTION OF TOWER FONTEIN CRECH_156
900,000
34056474020OFE03ZZWM TOLWE OFFICE FACE LIFT _176 500,000
34106151420OFD73ZZWM ESTABLISHMENT OF BACK OFFICE _192
150,000
34106456020OFD81ZZWM MACHINES CALIBRATION _193 50,000
34106470020OFD72ZZWM ESTABLISHMENT OF BACK OFFICE _192
150,000
34166420420OFE11ZZWM WASTE X-CHASSIS _185 400,000
34166474020OFD99ZZWM RENOVATING - POUND _186 50,000
34166654420OFD84ZZHO POUND _181 50,000

225
34056473520OFE23ZZWM CEMETERY AT SENWABARWANA 100,000
34056473520OFE24ZZWM CEMETERY AT ALLDAYS 150,000
34056456020OFE21ZZWM STREET SWEEPING MACHINE 500,000
34056456020OFE22ZZWM CEMETERY DIGGING COMPRESSOR
100,000
33206456020CTD49ZZHO Asphalt Cutter 100,000 Asphalt Cutter
33206456020CTD50ZZHO Concrete Mixer 100,000 Concrete Mixer
33206456020OFE26ZZHO Ramer 50,000 Ramer
35056151420OFD93ZZWM PURCHASE & INSTALLATION OF THEGIS S_30
300,000
35056473520OFE01ZZWM RENOVATION OF THE TOURISM INFORMATI_16
150,000
33106610020NPD66ZZWM
ELECTRIFICATION OF 248 HOUSEHOLD CONNECTIONAT WITTEN
4,452,000
33106610020NPD67ZZWM
ELECTRIFICATION OF 20 HOUSEHOLD CONNECTION AT DIEPSLOOT
360,000
33106610020NPD68ZZWM ELECTRFICATION OF HOUSEHOLD CONNECTION AT INNES
1,188,000
33206460020M2D94ZZWM PURCHASING OF OFFICE FURNITURE_164
50,000
33206653020M2E16ZZWM UPGRADING OF WITTEN INTERNAL STREET_152
6,258,518
33206653020M2E17ZZWM UPGRADING SENWABARWANA BY PASS ROAD_151
17,500,000

226
33106473520M2E13ZZWM CONSTRUCTION OF SENWABARWANA SPORTS_128
18,104,183
30051179000DGZZZZZHO TS_O_M_NG_MUNICIPAL DISASTER RELIEF
(358,000)
30051385330ORZZZZZHO SKILLS DEVELOPMENT LEVY REFUND
(236,000)
30051425400GSZZZZZHO SALE OF: AGRIC PROD - CATTLE CRAZING
(106,000)
32051020300PRZZZZZWM BUSINESS & COMMERCIAL PROPERTIES
(4,071,917)
32051021500PRRB1ZZWM FARM PROPERTIES: AGRICULTURAL PURPOSES
3,703,690
32051021500PRZZZZZWM FARM PROPERTIES: AGRICULTURAL PURPOSES
(5,251,409)
32051021510PRRB1ZZWM FARM PROPERTIES: BUSINESS & COMMERCIAL
321,986
32051021510PRZZZZZWM FARM PROPERTIES: BUSINESS & COMMERCIAL
(467,459)
32051021540PRRB1ZZWM FARM PROP: OTH PURPOSES THAN THE ABOVE
416,731
32051021540PRZZZZZWM FARM PROP: OTH PURPOSES THAN THE ABOVE
(563,975)
32051023610PRRB7ZZWM MUNICIPAL PROPERTIES 805,776
32051023610PRZZZZZWM MUNICIPAL PROPERTIES (805,776)
32051025100PRRB6ZZWM RESIDENTIAL PROPERTIES: DEVELOPED
760,830
32051025100PRZZZZZWM RESIDENTIAL PROPERTIES: DEVELOPED
(2,597,994)
32051025110PRZZZZZWM RESIDENTIAL PROPERTIES: VACANT LAND
(111,436)

227
32051025460PRZZZZZWM STATE-OWNED PROPERTIES (24,614,448)
32051178950FMZZZZZHO TS_O_M_NG_LOCAL GOV FIN MNG GRANT
(2,500,000)
32051179100EQZZZZZHO TS_O_M_NRF_EQUITABLE SHARE (197,240,000)
32051341090IDZZZZZWM INTER: RECEIV - SERVICE CHARGES
(241,829)
32051341150XTZZZZZWM INTER: BANK ACCOUNTS (300,000)
32051341170XTZZZZZHO INTER: SHORT TERM INVEST & CALL ACCOUNTS
(1,502,000)
32051343020DRZZZZZHO RENT ON LAND: LAND - UNDEVELOPED LAND
(848,000)
32051351200IDZZZZZWM INT DIV & RENT LAND -INT: REC-PROP RATES
(1,020,100)
32051380620ORZZZZZHO COMMISSION: TRANSACTION HANDLING FEES
(159,000)
32051402020FAZZZZZHO M-R INV PROP - SUB-LEASE PAYMENT
(218,000)
32051424510GSZZZZZHO PHOTOCOPIES & FAXES (37,100)
32051482130LPZZZZZHO ROAD & TRSP: MOTOR VEHICLE LICENSES
(1,102,400)
33101040020FIZZZZZHO FINES: ILLEGAL CONNECTIONS - ELECTRICITY
(42,764)
33101258910NPZZZZZHO TS_C_M_NG_INEP GRANT (6,000,000)
33101258940M2ZZZZZHO TS_C_M_NG_MIG GRANT (44,066,000)
33101321040ELZZZZZWM ELEC: CONNEC/RECON DISCONN/RECONN FEES
(307,400)

228
33101321130ELZZZZZWM ELEC SALES: COMMERCIAL CONVEN 3-PHASE
(5,181,130)
33101321190ELZZZZZWM ELEC SALES: DOMESTIC LOW: PREPAID
(31,708,871)
33101321380ELZZZZZWM ELEC: AVAILABILITY CHARGES (2,119,618)
33101341010IDZZZZZWM INTER: RECEIV - ELECTRICITY (272,146)
34051178910EPZZZZZHO TS_O_M_NG_EPWP GRANT (1,547,000)
34051365000FCZZZZZHO AGENCY SERV - DIST MUNI: LIMPOPO
(1,100,000)
34101040090FIZZZZZWM FINES: TRAFFIC - SERVICE PROVIDER
(3,551,000)
34101062030LPZZZZZWM ROAD & TRSP: DRIVER LICENCE APPLICAT FEE
(1,930,351)
34101062130LPZZZZZWM ROAD & TRSP: MOTOR VEHICLE LICENSES
(1,207,249)
34161322030WSZZZZZWM WASTE MANGEMENT: REFUSE REMOVAL
(265,000)
34161322050WSZZZZZWM WASTE MANGEMENT: AVAILABILITY CHARGES
(566,040)
34161341120IDZZZZZWM INTER: RECEIV - WASTE MANAGEMENT
(53,000)
34161420610GSZZZZZHO CEMETERY & BURIAL (42,400)
35051385250ORZZZZZHO SALE OF PROPERTY (5,000,000)
35051420080GSZZZZZHO ADVERTISEMENTS (35,200)
35051424540GSZZZZZHO PLAN & DEV: BUILDING PLAN APPROVAL
(178,652)

229
35051480110LPZZZZZHO TRADING (115,825)
51,629,663

230
LIM351 Blouberg - Table A1 Budget Summary
Description 2016/17 2017/18 2018/19 Current Year 2019/20 2020/21 Medium Term Revenue & Expenditure Framework
R thousands Audited
Outcome Audited
Outcome Audited
Outcome Original Budget
Adjusted Budget
Full Year Forecast
Pre-audit outcome
Budget Year
2020/21
Budget Year +1 2021/22
Budget Year +2 2022/23
Financial Performance
Property rates 25,065
26,602 24,056 28,090 28,090 28,090 24,303 32,475 33,510 35,463
Service charges 20,948
22,942 22,984 32,836 33,086 33,086 22,419 40,148 42,347 44,678
Investment revenue 2,072 2,475 1,308 1,700 1,700 1,700 685 1,802 1,910 2,025 Transfers recognised -
operational 185,947
209,413 182,424 210,915 191,915 191,915 144,746 201,287 211,808 221,502
Other own revenue 7,769 11,121 8,473 15,226 14,926 14,926 6,455 17,497 18,247 19,042
Total Revenue (excluding capital transfers and contributions)
241,800
272,554
239,246 288,767 269,717 269,717 198,609 293,209 307,822 322,709
Employee costs – 99,328 103,613 123,855 120,628 120,628 71,847 129,159 138,095 147,653
Remuneration of councillors 17,510
15,739 16,187 15,434 17,091 17,091 10,961 18,116 19,203 20,356
Depreciation & asset impairment –
35,463 35,257 41,674 41,118 41,118 – 43,757 46,383 49,166
Finance charges – – – – – – – – – –
Materials and bulk purchases 5,441 31,635 31,570 33,615 37,695 37,695 24,040 40,026 42,322 44,861
Transfers and grants – – 73 – – – – – – –
Other expenditure (3,067)
115,399 88,934 97,836 96,979 96,979 56,050 104,582 113,473 117,463
Total Expenditure 19,884
297,564 275,634 312,413 313,511 313,511 162,898 335,641 359,476 379,498
Surplus/(Deficit) 221,916
(25,010)
(36,388)
(23,646)
(43,793)
(43,793) 35,710
(42,431)
(51,654) (56,789)
Transfers and subsidies - capital (monetary allocations) (National / Provincial and District)
75,676
46,555 51,875 44,350 59,350 59,350 46,191 50,066 72,728 80,407
Transfers and subsidies - capital (monetary allocations) (National / Provincial Departmental Agencies, Households, Non-profit Institutions, Private Enterprises, Public Corporatons, Higher Educational Institutions) & Transfers and subsidies - capital (in-kind - all) – – – – – – – – – –

231
Surplus/(Deficit) after capital transfers & contributions
297,592
21,544
15,487 20,704 15,557 15,557 81,901 7,635 21,074 23,618
Share of surplus/ (deficit) of associate – – – – – – – – – –
Surplus/(Deficit) for the year 297,592
21,544 15,487 20,704 15,557 15,557 81,901 7,635 21,074 23,618
Capital expenditure & funds sources
Capital expenditure 75,204
36,099 2,242 69,533 64,385 64,385 30,832 59,334 75,952 81,968
Transfers recognised - capital 67,030 5,591 – 63,483 60,131 60,131 29,701 47,913 70,402 77,957
Borrowing – – – 200 79 79 – – – –
Internally generated funds 8,174 30,508 957 5,850 4,176 4,176 1,131 11,421 5,550 4,011
Total sources of capital funds 75,204
36,099 957 69,533 64,385 64,385 30,832 59,334 75,952 81,968
Financial position
Total current assets 126,707
122,580 123,683 71,157 146,055 146,055 166,125 168,314 190,945 213,515
Total non current assets 860,190
894,159 919,636 328,378 942,348 942,348 950,469 940,799 971,772 993,975
Total current liabilities 60,619
52,079 52,400
(3,115) 61,930 61,930 45,947 65,564 69,899 74,535
Total non current liabilities 13,515
16,766 17,576 – 19,276 19,276 17,576 20,726 22,341 24,069
Community wealth/Equity 912,763
947,894 973,342 402,650 1,007,196 1,007,196 1,053,071 1,022,823 1,070,477 1,108,886
Cash flows
Net cash from (used) operating 87,991
32,111 41,501 63,209 66,444 66,444 66,444 62,895 81,076 84,650
Net cash from (used) investing (75,204)
(60,323)
(46,981)
(69,533)
(64,385)
(64,385)
(64,385)
(59,334)
(75,952) (81,968)
Net cash from (used) financing (560) 2,984
(2,540) (9)
(100)
(100)
(100) – – –
Cash/cash equivalents at the year end
41,113
15,885 7,564 45,259 9,523 9,523 9,523 13,084 18,208 20,891
Cash backing/surplus reconciliation
Cash and investments available 44,205
19,350 10,654 54,689 12,621 12,621 17,680 16,337 21,535 24,281
Application of cash and investments
34,180
(5,300)
(61,510)
(16,210)
(35,382)
(35,382)
(123,204)
(44,935)
(54,950) (67,073)
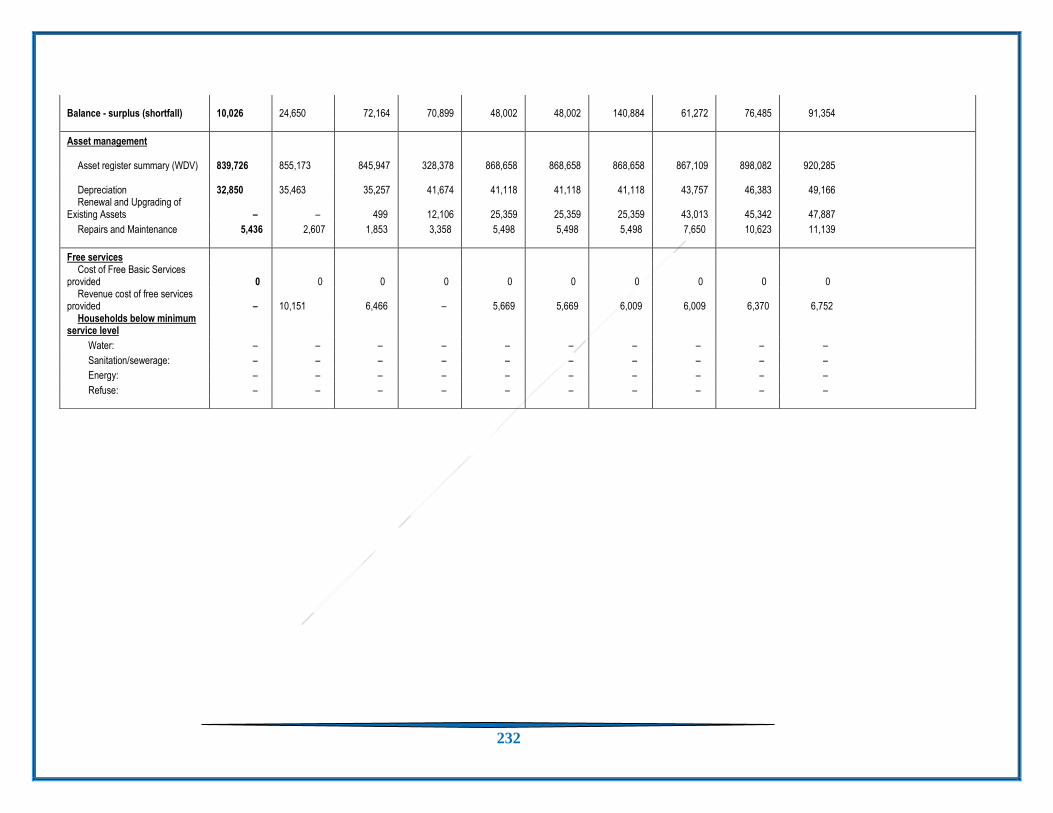
232
Balance - surplus (shortfall) 10,026
24,650 72,164 70,899 48,002 48,002 140,884 61,272 76,485 91,354
Asset management
Asset register summary (WDV) 839,726
855,173 845,947 328,378 868,658 868,658 868,658 867,109 898,082 920,285
Depreciation 32,850
35,463 35,257 41,674 41,118 41,118 41,118 43,757 46,383 49,166
Renewal and Upgrading of Existing Assets – – 499 12,106 25,359 25,359 25,359 43,013 45,342 47,887
Repairs and Maintenance 5,436 2,607 1,853 3,358 5,498 5,498 5,498 7,650 10,623 11,139
Free services Cost of Free Basic Services
provided 0 0 0 0 0 0 0 0 0 0 Revenue cost of free services
provided – 10,151 6,466 – 5,669 5,669 6,009 6,009 6,370 6,752
Households below minimum service level
Water: – – – – – – – – – –
Sanitation/sewerage: – – – – – – – – – –
Energy: – – – – – – – – – –
Refuse: – – – – – – – – – –

233
Summary Budget A1 Schedule
LIM351 Blouberg - Table A2 Budgeted Financial Performance (revenue and expenditure by functional classification)
Functional Classification Description Ref 2016/17 2017/18 2018/19
R thousand 1Audited
Outcome
Audited
Outcome
Audited
Outcome
Original
Budget
Adjusted
Budget
Full Year
Forecast
Budget Year
2020/21
Budget Year
+1 2021/22
Budget Year
+2 2022/23
Revenue - Functional
Governance and administration 212,180 225,902 206,340 220,451 221,530 221,530 237,986 251,435 263,449
Ex ecutiv e and council 19,272 25,856 6,784 – – – – – –
Finance and administration 192,908 200,047 199,556 220,451 221,530 221,530 237,986 251,435 263,449
Internal audit – – – – – – – – –
Community and public safety 9,606 6,224 4,691 7,350 6,211 6,211 6,689 7,090 7,515
Community and social serv ices 4,891 – – – – – – – –
Sport and recreation – – – – – – – – –
Public safety 4,716 6,224 4,691 7,350 6,211 6,211 6,689 7,090 7,515
Housing – – – – – – – – –
Health – – – – – – – – –
Economic and environmental services 67,074 47,046 44,150 2,363 2,373 2,373 5,330 5,349 5,370
Planning and dev elopment 397 491 659 2,363 2,373 2,373 5,330 5,349 5,370
Road transport 66,676 46,555 43,491 – – – – – –
Env ironmental protection – – – – – – – – –
Trading services 30,184 39,936 35,941 102,954 98,954 98,954 93,271 116,676 126,782
Energy sources 29,710 33,113 31,068 97,843 93,843 93,843 89,698 114,528 124,505
Water management – – – – – – – – –
Waste w ater management – – – – – – – – –
Waste management 474 6,823 4,873 5,111 5,111 5,111 3,573 2,148 2,277
Other 4 – – – – – – – – –
Total Revenue - Functional 2 319,044 319,108 291,121 333,117 329,067 329,067 343,275 380,550 403,116
Expenditure - Functional
Governance and administration 162,669 200,316 150,167 166,624 164,984 164,984 176,953 190,795 202,866
Ex ecutiv e and council 62,802 80,863 63,171 58,181 58,487 58,487 62,724 67,392 71,399
Finance and administration 99,867 119,453 86,995 108,443 106,497 106,497 114,229 123,402 131,467
Internal audit – – – – – – – – –
Community and public safety 28,019 13,049 14,890 15,544 14,684 14,684 15,061 15,945 17,050
Community and social serv ices 16,241 – – – – – – – –
Sport and recreation – – – – – – – – –
Public safety 11,778 13,049 14,890 15,544 14,684 14,684 15,061 15,945 17,050
Housing – – – – – – – – –
Health – – – – – – – – –
Economic and environmental services 19,949 19,262 31,358 49,837 49,645 49,645 55,673 60,862 62,235
Planning and dev elopment 8,028 9,661 9,852 12,066 11,607 11,607 16,249 18,458 17,300
Road transport 11,921 9,600 21,506 37,771 38,037 38,037 39,424 42,404 44,934
Env ironmental protection – – – – – – – – –
Trading services 36,276 64,938 79,220 80,409 84,198 84,198 87,954 91,875 97,348
Energy sources 36,198 43,394 59,141 57,911 61,569 61,569 64,756 67,882 72,103
Water management – – – – – – – – –
Waste w ater management – – – – – – – – –
Waste management 77 21,543 20,079 22,498 22,628 22,628 23,199 23,993 25,245
Other 4 – – – – – – – – –
Total Expenditure - Functional 3 246,912 297,564 275,634 312,413 313,511 313,511 335,641 359,476 379,498
Surplus/(Deficit) for the year 72,132 21,544 15,487 20,704 15,557 15,557 7,635 21,074 23,618
Current Year 2019/202020/21 Medium Term Revenue &
Expenditure Framework
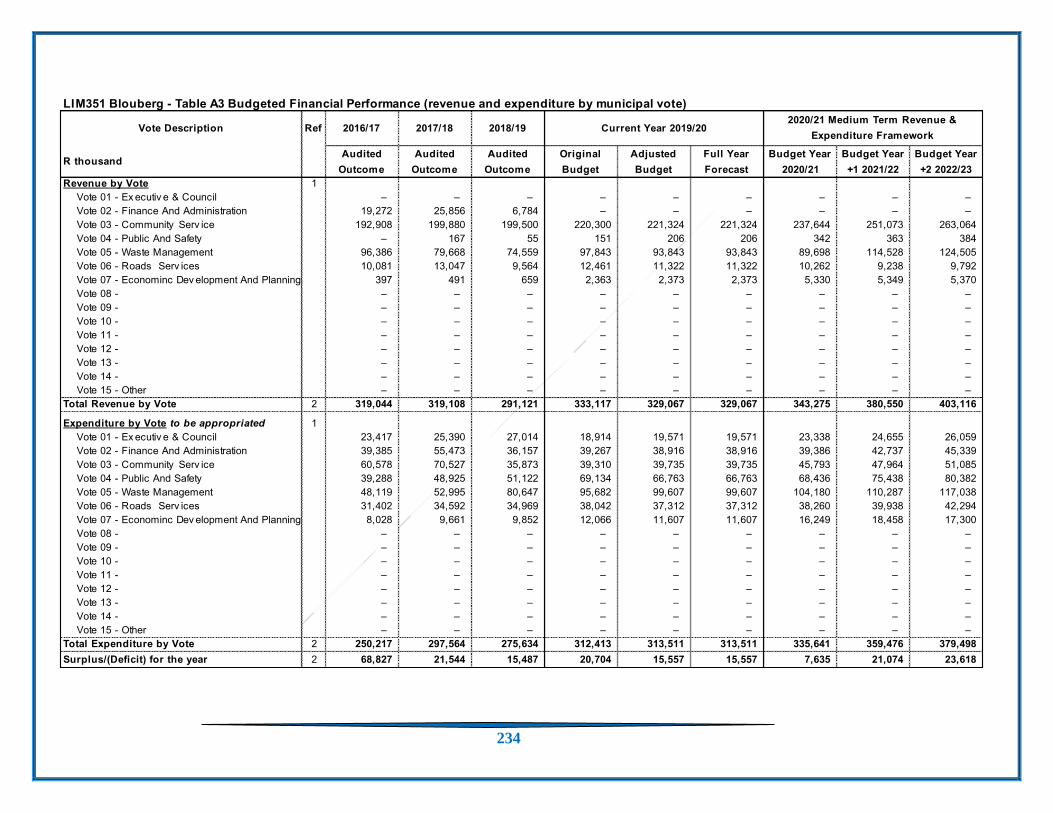
234
LIM351 Blouberg - Table A3 Budgeted Financial Performance (revenue and expenditure by municipal vote)
Vote Description Ref 2016/17 2017/18 2018/19
R thousandAudited
Outcome
Audited
Outcome
Audited
Outcome
Original
Budget
Adjusted
Budget
Full Year
Forecast
Budget Year
2020/21
Budget Year
+1 2021/22
Budget Year
+2 2022/23
Revenue by Vote 1
Vote 01 - Ex ecutiv e & Council – – – – – – – – –
Vote 02 - Finance And Administration 19,272 25,856 6,784 – – – – – –
Vote 03 - Community Serv ice 192,908 199,880 199,500 220,300 221,324 221,324 237,644 251,073 263,064
Vote 04 - Public And Safety – 167 55 151 206 206 342 363 384
Vote 05 - Waste Management 96,386 79,668 74,559 97,843 93,843 93,843 89,698 114,528 124,505
Vote 06 - Roads Serv ices 10,081 13,047 9,564 12,461 11,322 11,322 10,262 9,238 9,792
Vote 07 - Econominc Dev elopment And Planning 397 491 659 2,363 2,373 2,373 5,330 5,349 5,370
Vote 08 - – – – – – – – – –
Vote 09 - – – – – – – – – –
Vote 10 - – – – – – – – – –
Vote 11 - – – – – – – – – –
Vote 12 - – – – – – – – – –
Vote 13 - – – – – – – – – –
Vote 14 - – – – – – – – – –
Vote 15 - Other – – – – – – – – –
Total Revenue by Vote 2 319,044 319,108 291,121 333,117 329,067 329,067 343,275 380,550 403,116
Expenditure by Vote to be appropriated 1
Vote 01 - Ex ecutiv e & Council 23,417 25,390 27,014 18,914 19,571 19,571 23,338 24,655 26,059
Vote 02 - Finance And Administration 39,385 55,473 36,157 39,267 38,916 38,916 39,386 42,737 45,339
Vote 03 - Community Serv ice 60,578 70,527 35,873 39,310 39,735 39,735 45,793 47,964 51,085
Vote 04 - Public And Safety 39,288 48,925 51,122 69,134 66,763 66,763 68,436 75,438 80,382
Vote 05 - Waste Management 48,119 52,995 80,647 95,682 99,607 99,607 104,180 110,287 117,038
Vote 06 - Roads Serv ices 31,402 34,592 34,969 38,042 37,312 37,312 38,260 39,938 42,294
Vote 07 - Econominc Dev elopment And Planning 8,028 9,661 9,852 12,066 11,607 11,607 16,249 18,458 17,300
Vote 08 - – – – – – – – – –
Vote 09 - – – – – – – – – –
Vote 10 - – – – – – – – – –
Vote 11 - – – – – – – – – –
Vote 12 - – – – – – – – – –
Vote 13 - – – – – – – – – –
Vote 14 - – – – – – – – – –
Vote 15 - Other – – – – – – – – –
Total Expenditure by Vote 2 250,217 297,564 275,634 312,413 313,511 313,511 335,641 359,476 379,498
Surplus/(Deficit) for the year 2 68,827 21,544 15,487 20,704 15,557 15,557 7,635 21,074 23,618
Current Year 2019/202020/21 Medium Term Revenue &
Expenditure Framework

235
LIM351 Blouberg - Table A4 Budgeted Financial Performance (revenue and expenditure)
Description Ref 2016/17 2017/18 2018/19
R thousand 1Audited
Outcome
Audited
Outcome
Audited
Outcome
Original
Budget
Adjusted
Budget
Full Year
Forecast
Pre-audit
outcome
Budget Year
2020/21
Budget Year
+1 2021/22
Budget Year
+2 2022/23
Revenue By Source
Property rates 2 25,065 26,602 24,056 28,090 28,090 28,090 24,303 32,475 33,510 35,463
Serv ice charges - electricity rev enue 2 20,534 22,516 22,470 32,302 32,302 32,302 18,277 39,317 41,466 43,744
Serv ice charges - w ater rev enue 2 – – – – – – 3,417 – – –
Serv ice charges - sanitation rev enue 2 – – – – – – 19 – – –
Serv ice charges - refuse rev enue 2 414 427 514 534 784 784 705 831 881 934
Rental of facilities and equipment 1,046 – – 200 200 200 – 218 231 245
Interest earned - ex ternal inv estments 2,072 2,475 1,308 1,700 1,700 1,700 685 1,802 1,910 2,025
Interest earned - outstanding debtors 1,961 523 1,287 617 617 617 1,238 1,587 1,682 1,783
Div idends receiv ed –
Fines, penalties and forfeits 1,273 3,301 1,815 3,390 3,390 3,390 223 3,594 3,809 4,038
Licences and permits 3,489 3,999 3,699 4,109 4,109 4,109 2,467 4,356 4,617 4,894
Agency serv ices – – – 3,300 3,150 3,150 1,500 1,100 1,166 1,236
Transfers and subsidies 185,947 209,413 182,424 210,915 191,915 191,915 144,746 201,287 211,808 221,502
Other rev enue 2 – 3,299 1,673 3,610 3,460 3,460 1,027 6,642 6,741 6,845
Gains – – – – – – – – – –
Total Revenue (excluding capital transfers
and contributions)
241,800 272,554 239,246 288,767 269,717 269,717 198,609 293,209 307,822 322,709
Expenditure By Type
Employ ee related costs 2 – 99,328 103,613 123,855 120,628 120,628 71,847 129,159 138,095 147,653
Remuneration of councillors 17,510 15,739 16,187 15,434 17,091 17,091 10,961 18,116 19,203 20,356
Debt impairment 3 (3,067) 2,309 (2,313) 8,330 8,330 8,330 – 8,747 9,622 10,584
Depreciation & asset impairment 2 – 35,463 35,257 41,674 41,118 41,118 – 43,757 46,383 49,166
Finance charges
Bulk purchases 2 – 30,341 29,686 31,000 35,000 35,000 22,960 37,100 39,326 41,686
Other materials 8 5,441 1,295 1,884 2,615 2,695 2,695 1,081 2,926 2,996 3,176
Contracted serv ices – 66,532 45,323 40,680 42,070 42,070 26,861 54,026 58,061 58,453
Transfers and subsidies – – 73 – – – – – – –
Other ex penditure 4, 5 – 45,804 45,806 48,825 46,578 46,578 29,189 41,809 45,790 48,426
Losses – 755 119 – – – – – – –
Total Expenditure 19,884 297,564 275,634 312,413 313,511 313,511 162,898 335,641 359,476 379,498
Surplus/(Deficit) 221,916 (25,010) (36,388) (23,646) (43,793) (43,793) 35,710 (42,431) (51,654) (56,789)
Transfers and subsidies - capital (monetary
allocations) (National / Prov incial and District) 75,676 46,555 51,875 44,350 59,350 59,350 46,191 50,066 72,728 80,407
Transfers and subsidies - capital (monetary
allocations) (National / Prov incial Departmental
Agencies, Households, Non-profit Institutions,
Priv ate Enterprises, Public Corporatons, Higher
Educational Institutions) 6 –
Transfers and subsidies - capital (in-kind - all) – – – – – – – – – –
Surplus/(Deficit) after capital transfers &
contributions
297,592 21,544 15,487 20,704 15,557 15,557 81,901 7,635 21,074 23,618
Tax ation
Surplus/(Deficit) after taxation 297,592 21,544 15,487 20,704 15,557 15,557 81,901 7,635 21,074 23,618
Attributable to minorities
Surplus/(Deficit) attributable to municipality 297,592 21,544 15,487 20,704 15,557 15,557 81,901 7,635 21,074 23,618
Share of surplus/ (deficit) of associate 7
Surplus/(Deficit) for the year 297,592 21,544 15,487 20,704 15,557 15,557 81,901 7,635 21,074 23,618
2020/21 Medium Term Revenue &
Expenditure FrameworkCurrent Year 2019/20
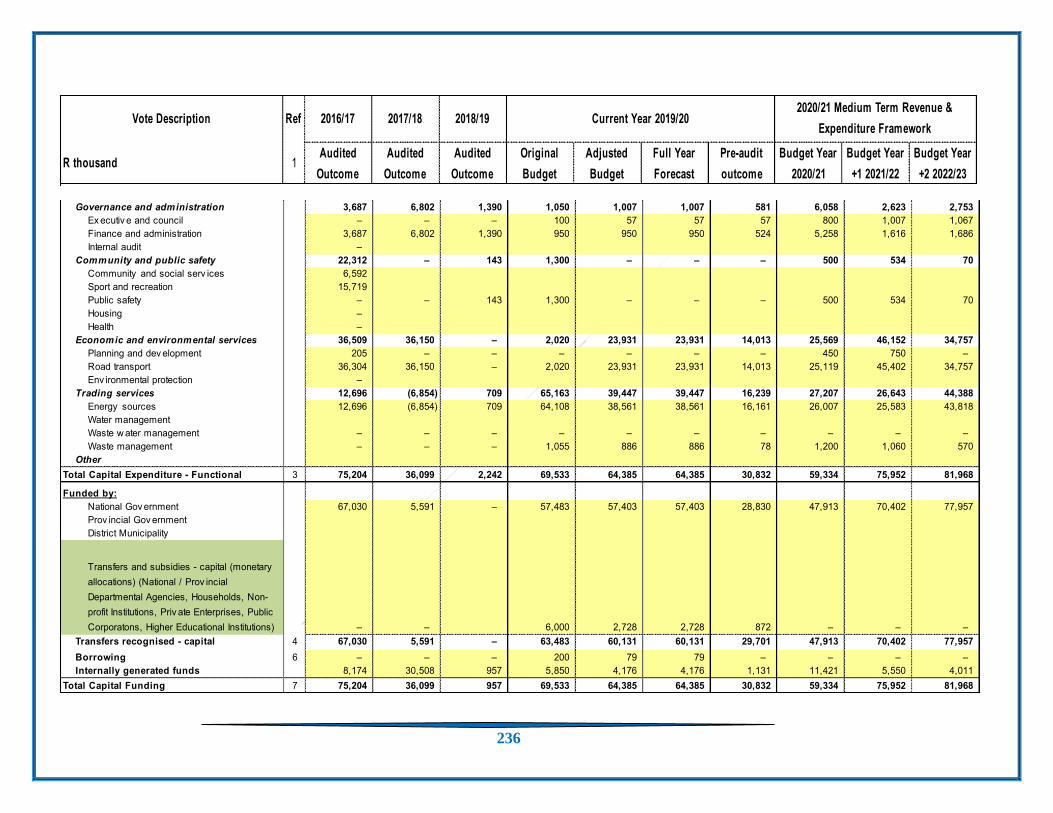
236
Vote Description Ref 2016/17 2017/18 2018/19
R thousand 1Audited
Outcome
Audited
Outcome
Audited
Outcome
Original
Budget
Adjusted
Budget
Full Year
Forecast
Pre-audit
outcome
Budget Year
2020/21
Budget Year
+1 2021/22
Budget Year
+2 2022/23
2020/21 Medium Term Revenue &
Expenditure FrameworkCurrent Year 2019/20
Governance and administration 3,687 6,802 1,390 1,050 1,007 1,007 581 6,058 2,623 2,753
Ex ecutiv e and council – – – 100 57 57 57 800 1,007 1,067
Finance and administration 3,687 6,802 1,390 950 950 950 524 5,258 1,616 1,686
Internal audit –
Community and public safety 22,312 – 143 1,300 – – – 500 534 70
Community and social serv ices 6,592
Sport and recreation 15,719
Public safety – – 143 1,300 – – – 500 534 70
Housing –
Health –
Economic and environmental services 36,509 36,150 – 2,020 23,931 23,931 14,013 25,569 46,152 34,757
Planning and dev elopment 205 – – – – – – 450 750 –
Road transport 36,304 36,150 – 2,020 23,931 23,931 14,013 25,119 45,402 34,757
Env ironmental protection –
Trading services 12,696 (6,854) 709 65,163 39,447 39,447 16,239 27,207 26,643 44,388
Energy sources 12,696 (6,854) 709 64,108 38,561 38,561 16,161 26,007 25,583 43,818
Water management
Waste w ater management – – – – – – – – – –
Waste management – – – 1,055 886 886 78 1,200 1,060 570
Other
Total Capital Expenditure - Functional 3 75,204 36,099 2,242 69,533 64,385 64,385 30,832 59,334 75,952 81,968
Funded by:
National Gov ernment 67,030 5,591 – 57,483 57,403 57,403 28,830 47,913 70,402 77,957
Prov incial Gov ernment
District Municipality
Transfers and subsidies - capital (monetary
allocations) (National / Prov incial
Departmental Agencies, Households, Non-
profit Institutions, Priv ate Enterprises, Public
Corporatons, Higher Educational Institutions) – – 6,000 2,728 2,728 872 – – –
Transfers recognised - capital 4 67,030 5,591 – 63,483 60,131 60,131 29,701 47,913 70,402 77,957
Borrowing 6 – – – 200 79 79 – – – –
Internally generated funds 8,174 30,508 957 5,850 4,176 4,176 1,131 11,421 5,550 4,011
Total Capital Funding 7 75,204 36,099 957 69,533 64,385 64,385 30,832 59,334 75,952 81,968

237
Overview of Budget Related policy
Budget Related Policy
The purpose of budget-related and financial policies is to provide a sound environment to manage the financial affairs of the municipality. The following are
key budget relating policies:
Tariff Structure and Policy – the policy prescribes the procedures for calculating tariffs. This policy is required in terms of Section 74 of the Local Government
Municipal Systems Act, Act 22 of 2000.
Indigent Support Policy – to provide access to and regulate free basic services to all indigent households.
Credit Control and Debt Collection Policy – to provide for credit and debt collection procedures and mechanisms to ensure that all consumers pay for the
services that are supplied.
Debtors impairment and write-off policy –to ensure that debtors are disclosed in the annual financial statement at the amounts deemed to be collected
and uncollectable debts is written off within the guidelines of existing policies and applicable legislation.
Budget Policy – this policy set out the principles, which must be followed in preparing a medium term revenue and expenditure framework budget. It further
ensures that the budget reflects the strategic outcomes embodied in the IDP and related strategic policies.
Investment Policy – this policy was compiled in accordance with the Municipal Investment Regulations and ensures that cash resources are managed in
the most efficient and effective manner possible.
Asset Management Policy – the objective of the policy is to prescribe the accounting and administrative procedures relating to property, plant and equipment
(assets).

238
Supply Chain Management Policy – this policy is developed in terms of Section 111 of the Municipal Finance Management Act, Act 56 of 2003. The
principles of this policy is to give effect to a fair, equitable, transparent, competitive and cost-effective system for the procuring of goods and services,
disposing of goods and selecting of contractors in the provision of municipal services.
Cash Management Policy- to ensure that there is a proper cash flow management and control.
Fund Reserve Policy: In terms of regulation 8 of the Municipal Budget and Reporting Regulations., each Municipality must have a funding and reserves
policy
Property Rates and By-Law Policy - to enable the municipality to levy rates on ratable properties
and apply rebates and discounts on certain categories of properties.
MFMA CIRCULAR No.98 & 99 and 94- Municipal Budget circular for 2019/20 MTREF
THE SUMMARY OF AMENDMENTS:
Indigent policy
Households earning a joint income of not more than R 4 000 per month (proof of pay slips/copy of recent bond statements). Residents of Blouberg Local
Municipality and Residents in possession of a valid South African Identity Document.
Supply Chain Management (SCM) Policy
Cost containment measures, all measures in the cost containment regulation are to be aligned with the approved SCM policy.

239
List of accredited service providers, the municipality will only do business with service providers registered in the central supply database.
Municipality will remind service providers through its notice boards, newspapers circulating locally and the website.
Appointment of consultants, cost containment guideline will apply where is motivation to acquire service from service provider will be sourced
prior the appointment.
Sundry payments, the following line items are not required to be procured through the SCM process. Therefore end user will complete and
submit the sundry documents with the invoice to the SCM unit to check for SCM / legal compliancy.
- Audit Fees
- Bursary and Student Practical work
- Statutory Payments
- License fees
- Postage
- Entertainment
- Membership fees
- Telkom
- Eskom
- Fixed Term Services contracts appointed through the formal Bid Process where it is difficult to identify beforehand what the total quantity of work will
be done on sundry payments (e.g. Maintenance of tarred road, vacuum tank services, maintenance of sewer pipelines, etc) clearly marked with the bid
number.
Subcontracting, subcontracting a value of contract is limited to a minimum of 30%, if the sub contraction is before appointment of the main Contractor and 25%
after the appointment of the main Contractor.
Tariffs Policy
Sale of Electricity,
The electricity tariffs
Electricity tariffs will increase by 6% as proposed and approved by NERSA.

240
Refuse and Other Revenue source, In terms of MFMA Circular 93 and 94 National Treasury encourage municipalities to maintain tariff increase at levels that reflect an appropriate balance
between the affordability to poorer households and other customers while ensuring the financial sustainability of the municipality. The Consumer Price index
(CP) inflation has however breached the upper limit of the 3 to 6 per cent target band; therefore, municipalities are now required to justify all increases in
excess of the 6 per cent projected inflation target in their budget narratives.
Therefore, Municipal services tariffs will increase by 6% percent of the services offered by municipality revenue sources e.g. refuse removal, Advertisements,
Animal pounds and Cemeteries.
Property Rate
CATEGORY CURRENT TARIFF PROPOSED TARIFF (CENT IN A RAND)
Residential 0.0067 0.0071
Residential property consent use 0.0106 0.011
Residential impermissible or illegal use
0.0138 0.0146
Residential vacant land 0.0093 0.0099
Farms 0.0020 0.0021
State owned properties 0.0371 0.0393
Businesses\ commercial 0.0093 0.0099

241
CHAPTER 6: INTEGRATION PHASE
This Chapter gives a brief summary of how the planning and implementation of IDP projects align and integrate with
IDP sector plans.
The following are approved municipal sector plans in summary form:
6.1 LOCAL ECONOMIC DEVELOPMENT STRATEGY
The Municipality has an approved Local Economic Development Strategy (LED Strategy) in place. The Council adopted
the Strategy in March 2013. The development of the Strategy was done with the maximum participation of all role
players within the Municipality and there were a series of public participation sessions to interrogate, input and inform
the Strategy. The strategy is aligned to the National Spatial Development Perspective and the Limpopo Provincial
Growth and Development Strategy and Limpopo Employment Growth and Development Plan. The strategy takes into
account the National Development Plan 2030
The Strategy notes the high levels of poverty, dependency and illiteracy levels within the Blouberg area. The Strategy
focuses on areas of comparative and competitive economic advantages within the Municipality and developed ways of
using such to turn the Municipality’s poor economic base around and make sure that the Municipality lives up to its
vision of being a participatory municipality that turns prevailing challenges into opportunities for growth and
development through optimal utilization of available resources.
The LED Strategy for Blouberg Municipality identifies the following as key drivers of the local economy:
Agriculture
There is abundant land, which is mainly used for agricultural development. The area consists of two economies in the
farming sector - the established and commercial white farming community and the less established and subsistence
black farming community.
The strategy identifies even game farming as one of the pillars of the agricultural sector especially the one practiced
in areas around Alldays and the surrounding farms.
Tourism
Due to the Municipality’s rich cultural and heritage background, the strategy identifies tourism as one of the key
economic drivers. This is evidenced by the existence of the rock art paintings at the Makgabeng Mountains, the
Malebogo\Boer battlefields that have been declared a Provincial Heritage Site, the footprints of the missionaries at
areas such as Leipzig and Milbank, the existence of two-nature reserves-Malebogo and Blouberg as well as the game
farms which mainly attract international tourists.
Retail and SMME development
The strategy recognizes the need for job creation through SMMEs and retails as pillars of growing the economy and
job creation. The strategy notes the fact that local retail sector has not been doing well in sustaining itself and
recommends that the municipality be proactive in coordinating the retail and business sector and further come up with
ways of supporting their sustainability. The strategy identifies nodal points such as Eldorado, Alldays and
Senwabarwana as areas where major retail should be encouraged.
242
Mining
There are mining deposits, which have a potential of growing the economy and creating sustainable jobs if explored
and mined to the fullest. Potential of mineral deposits are found in areas such as Harriswich and Aurora (platinum),
Arrie, and Steamboat farms (pencil and coal, gold and other minerals). There is also a huge potential for sand mining
within the Blouberg area, especially in areas such as Indermark and Eussoringa.
The Blouberg LED Strategy is currently going through a process of review to ensure its relevance to the current
situation. The review of the LED strategy will ensure maximum alignment with the Limpopo Employment and Growth
Development Strategy, the National Spatial Development Perspective, the New Growth Path and the District Led
strategy.
6.2 BLOUBERG LOCAL ECONOMIC EMPOWERMENT STRATEGY
The strategy was developed by the Economic Development and Planning Department in-house and was approved by
Council in the 2007\2008 financial year.
The strategy seeks to attain local economic empowerment with the usage of procurement as a tool of local economic
reform. The strategy focuses on the Municipality’s supply chain management practice. In terms of the strategy, Council
is biased towards locally owned entities when it procures goods and services from external service providers.
The strategy ensures that for all goods and services, except for specialized services, local SMMEs must be contracted
to provide for such services. Noting that local SMMEs may not have relevant and enough grading when it comes to the
implementation of capital projects such as electrification, building and road construction the strategy enforces joint
venture agreements between locally owned SMMEs and external SMMEs with the minimum shareholding being 70\30
percentage.
The strategy benefits locally owned businesses two folds:
Skills transfer (this is the primary benefit of the strategy. Local SMMEs are given the chance to acquire relevant
skills so that their grading with relevant bodies such as the CIDB is improved)
Financial benefits (local SMMEs benefit from profits accrued from the procurement process)
So far, the local economic empowerment strategy has been used in all the MIG funded roads construction projects,
electrification projects, as well as other capital projects implemented by the Municipality. The implementation of the
strategy has further seen a gradual increase in the grading ratings of local SMMEs with the CIDB.
The implementation of the LED Strategy should be read in line the implementation of projects in compliance with the
Spatial Development Framework.
The Municipality’s rollout of the waste management function is a fulfillment of the LED strategy and the attainment of
the municipal vision and mission. By recruiting 100 general workers for the Municipality’s Community Works program
me and Expanded Public Works program me the Municipality is turning the prevailing challenge (which is waste in this
instance) into an opportunity for growth and development (which is job creation initiative in this instance). This is also
in line with the national government’s priority on job creation as encapsulated in the President’s State of the Nation
Address (2016).
Massive retail investments are also aligned with the municipal LED strategy and Spatial Development Framework. The
development of two shopping centers in the Senwabarwana and Eldorado nodes is an example of such.
The implementation of the Expanded Public Works Program me by the Department of Roads and Transport and
Community Works program me by CoGTA is a clear indication of the attainment of the municipal vision and mission.

243
6.3 BLOUBERG SPATIAL DEVELOPMENT FRAMEWORK
The municipality has an approved spatial development framework in place. The review of the SDF was approved in
the 2018\2019 financial year. The development of the Blouberg Integrated Spatial Development Framework went
through the process of stakeholder engagements to ensure that the inputs of all development-oriented practitioners
are taken into account before Council approves the framework. The Limpopo spatial rationale played a huge role in
informing the development of the Blouberg Spatial Development Framework. The framework took into account and is
aligned to the National Spatial Development Perspective in the sense that in the identification of nodal points and
corridors of development the spirit of the NSDP on using strategically located land and investing in corridors of
development to trigger economic development were taken into account. Further, the inclusion of newly re - demarcated
areas such as Tolwe, Vivo, Swaartwater and Maastroom influenced the contents and core areas identified in the original
SDF
The SDF identifies the following as core nodes of the Blouberg Municipality:
Senwabarwana (also a district growth point)
Alldays (also a district growth point)
Eldorado (identified as a provincial rural node)
Tolwe
Laanglaagte
Inveraan
Harriswich
Puraspan-Avon - Indermark corridor
The implementation of massive infrastructure projects and retail investments has been done in compliance with the
principles of the National Spatial Development Perspective, the Limpopo Employment Growth Plan and the dictates of
the municipal Spatial Development Framework. The two large retail investments are implemented in the two municipal
primary nodes, Senwabarwana and Eldorado.
A large percentage of the municipal infrastructure grant is implemented in the municipal nodes and development
corridors. It is clear that government and private sector spending is geared towards the nodal points identified.
Township establishment, water and sanitation, electrification, upgrading of roads and cemeteries are all implemented
in nodal points and population concentration points, while settlements in the periphery are provided with a basic level
of services.
6.4 BLOUBERG HOUSING CHAPTER
The IDP should have as one of the core components a housing plan\chapter that determines areas of priority in terms
of housing development within the Municipality. The Housing Chapter of the Blouberg Municipality was developed also
to indicate which areas will need inclusionary housing, which ones will require the provision of basic low cost houses
etc. the development of the chapter was highly informed by the SDF as well as the active participation of the ward
Councilors, community development workers, ward committees and municipal officials, especially in the planning and
housing divisions.
The aim of the Housing Chapter was to move away from the arbitrary and reactive way of allocating low cost housing
to a neutral and proactive way of doing that. The document needs to be revised as it is outdated. The Department of

244
Cooperative Governance, Human Settlements and Traditional Affairs funds and implements the housing projects on
behalf of the Municipality.
6.5 BLOUBERG TOURISM DEVELOPMENT PLAN
Due to the identification of tourism as one of the pillars of the Blouberg economy, the municipality commissioned Wits
University to develop a Tourism Development Plan for its area of jurisdiction.
The Tourism Development Plan identifies the Senwabarwana-Makgabeng-Blouberg Mountains as having a rich cultural
and heritage background to propel the local economy through tourism development. This is because the area has a
rich history and culture trail left by the San through their rock art paintings at the Makgabeng Mountains, the legacy of
the German missionaries at Leipzig, Thabananhlana at Milbank, the Malebogo-Boer war and the battlefields, which
have recently been declared a Provincial Heritage Site.
The Plan makes provision for its implementation through the construction of accommodation establishments such as
hotels and bed and breakfast facilities. The plan further indicates that for that to be attained there must be concessions
entered into between concessionaries and local communities to ensure that the benefits of tourism are shared between
the investors and the local communities. The plan also indicates as immediate plans for implementation the need to
construct three interpretation centers at Leipzig, Milbank and Makgabeng.
Blouberg Municipality, in partnership with Capricorn District Municipality, has established a tourism information center
at Senwabarwana. A tourism unit has been established within the Local Economic Development Division of the
Municipality.
6.6 BLOUBERG LAND USE MANAGEMENT SCHEME
Land management is the process of managing the use and development (in both urban and suburban settings) of land
resources in a sustainable way. Land resources are used for a variety of purposes, which interact and may compete
with one another; therefore, it is desirable to plan and manage all uses in an integrated manner.
We come from a background where the country was divided along racial lines with the white community and black
communities operating in different localities with different pieces of legislations governing them. The Blouberg LUMS
seeks to ensure that there is integration in the way in which land is used to achieve sustainability. The scheme ensures
that different land uses and their zonings are managed in such a way that there is compatibility and sustainability in
the way in which land is used. In terms of the Blouberg LUMS, most areas are zoned as agricultural. In urban areas of
Senwabarwana and Alldays the predominant use is residential and business.
The scheme regulates the types of zonings areas within the Municipality, as well as the kind of uses that may be
permitted and those that may not be permitted. Within the Blouberg scheme, there is provision for the kind of uses that
may only be practiced with the permission\consent of the Authorized official and/or the Joint District Planning Tribunal.
The Blouberg LUMS will be reviewed in this financial year 2020/2021 to ensure that it is aligned to the provisions of
SPLUMA.
Currently the scheme is fully implemented in the Alldays and Senwabarwana nodes while all applications for land
development in the rest of Blouberg are also processed in line with the scheme, though to a lesser extent.
6.7 THE BLOUBERG ENVIRONMENTAL MANAGEMENT PLAN
The EMP was developed and adopted in 2008 and raised serious concern regarding environmental governance,
amongst others staffing issues which were later addressed.
The Plan unearthed hidden risks and impacts that require serious measures to prevent further environmental
degradation and to mitigate the impacts of such problems.

245
EMP implementation is not done satisfactorily as it has to be done on daily basis i.e. inspections in the entire
Municipality.
The EMP identified areas that were affected by pollution, soil erosion, deforestation that needed to be attended to, non-
compliance and mitigation that affect negatively on the biophysical and or socio economic environment. Strategies to
enforce compliance and mitigation are in place after consultation with all relevant stakeholders. The rollout of the waste
management function complies with the municipal spatial development framework as it identifies nodal points,
population concentration points and R293 towns along the Witten-Puraspan-Avon-Indermark corridor as the point of
departure for the implementation of the service.
6.8 MUNICIPAL INSTITUTIONAL PLAN
The municipality has an institutional plan in place and such plan is revised annually taking into account the material
conditions of the institution. The plan addresses institutional challenges identified in the analysis phase amongst such
challenges being staff retention of scarce personnel, efficiency and effectiveness.
6.9 WORKPLACE SKILLS DEVELOPMENT PLAN
The WSDP is in place and is reviewed annually taking into place the skills gap and requirements to address IDP needs
and objectives. The WSDP is done by management, through the skills development office, jointly with the trade union
and submitted annually to the relevant authorities. Amongst prioritized skills needs in the WSDP are clerical, artisans
mainly on roads and storm water, financial management and the attainment of core competencies for section 56 and
57 managers. The municipality goes further and addresses skills gaps of communities on learner ship programs in
issues such as LED and general construction.
6.10 ORGANISATIONAL PERFORMANCE MANAGEMENT SYSTEMS
The municipality has a performance management system in place. Such is enforcement by the availability of a
performance management policy in place. The municipality quarterly conducts institutional performance assessment
and individual performance assessments for its section 56 and 57 managers. The plan is to cascade the systems to all
levels of the workforce. The PMS is linked to the municipal SDBIP and the approved IDP.
6.11 IGR STRUCTURES ALIGNMENT
The municipality has local IGR structures and participates in district and provincial IGR structures. Local IGR structures
are aligned along specific sectors. Such includes water sector forum, energy forum, LED forum, roads and transport
forum, waste management forum. All sector departments with a role to play in such forums are members of the above
forums. The municipality participates in the district municipal managers’ forum, district energy forum, district CFO’s
forum, district IDP managers’ forum, district Mayors’ and Speakers’ forum and district monitoring and evaluation forum
to align programs and plans of all local municipalities with those of the district and in such forums relevant sector
departments participate. In the province, the municipality participates, amongst others, in the Premier IGR forum, the
provincial planning and development forum, provincial municipal managers’ forum etc.
6.12. COMMUNICATION STRATEGY AND PUBLIC PARTICIPATION
The municipality has a communication strategy which indicates who communicates to whom, when and how. There is
a communications unit established and such is located in the Corporate Services Department. The municipality is
Community participation model is one of the best models in the country and through such model, Council and its
committees are able to reach out to the municipal constituencies. EXCO and Council meetings are held in public at
venues rotated throughout the municipal area. After every EXCO and Council, meeting an outreach program me is

246
held. Views and issues raised by community members are recorded and feedback is provided to members of the
community who raised such matters.
6.13. RISK MANAGEMENT, OVERSIGHT, ANTI-CORRUPTION STRATEGY AND AUDIT PROGRAMMES
The municipality has an anti-corruption and risk management strategy in place. Both internal audit and risk
management units have been established and are located in the office of the Municipal Manager.
The internal audit committee is in place and it comprised of four members who have relevant experience and
qualification to discharge their responsibilities. The Risk Management Committee has also been established and is
chaired by an external person. Both Committees sit at least once per quarter. A Municipal Publics Account Committee
(MPAC) comprising of multi-party Councilors is in place and sits on a monthly basis.
In the 2013\14 financial year, the Municipality received an unqualified audit opinion from the office of the Auditor-
General, an improvement from the previous financial years of qualifications and a disclaimer. However, the municipality
recorded a regress in both 2014/15, 2015\16 and 2016/2017 audit report by obtaining a qualified opinion.
An audit action plan has been developed with clear periods to deal with matters raised by the Auditor-General.
6.14 LOCAL INTEGRATED TRANSPORT PLAN (LITP)
The municipality has approved the integrated transport plan in March 2013 to guide the transport system, road networks
and the improvement required to allow for easier accessibility of transportation.
The Local Integrated Transport plan gives a detailed synopsis of the transport status quo in Blouberg, challenges
encountered, and possible interventions and programs to realize a safe and integrated transport system for all
residents.
6.15. BLOUBERG INTEGRATED WASTE MANAGEMENT PLAN (IWMP)
The plan has been developed in-house to provide long lasting solutions to the challenge of waste management and
environmental degradation. The plan appreciates that the municipality has challenges of waste management,
especially in nodal points and population concentration camps. As a result, it identifies opportunities that can be
harnessed to solve the waste challenge and contribute to environmental sustainability.
6.16. FIVE-YEAR FINANACIAL PLAN
The plan has been developed in-house to provide an indication of how the municipality is going to sustain the service
rendered to the communities in Blouberg. The plan indicates the sources of revenue and policies developed to enable
the municipality to collected the projected revenue. The human resource required to implement the plan is also
identified. The aim of the plan is to move the municipality from being grant dependent to a municipality with financial
sustainability occasioned by its capacity to raise own revenue, collect all debt due to it in terms of its credit control and
debt management policies as well as prudent expenditure management. The plan has identified the major revenue
sources as the following: Electricity, Traffic Services, Assessment Rates, Refuse Removal and Investments. This plan
was given further impetus by adoption by Council of the special finance turnaround plan in November 2015. The
turnaround plan also focuses on the invoking of austerity measures to curb rampant and wasteful spending in line with
MFMA Circulars on Cost Containment measures.
There are other sources of revenue that have been identified but key ones are those that are listed above. The
strategies and by-laws adopted to collect the targeted revenue are also identified in the plan. For the proper
implementation of the municipality’s five-year financial plan the municipality has adopted budget related policies such
as tariffs policy, credit control and debt management policy, rates policy, supply chain management policy, investment
policy, assets and inventory management policy, indigent policy, etc.

247
6.17 COMMUNITY SAFETY PLAN
The municipality has developed and adopted the Community safety plan.
The plan details the stakeholders and the process to be undertaken when engaging on the plan. The plan identifies
the types of criminal activities that are predominant in the municipality as well as the crime hotspots.
The main purpose of the plan is to equip the communities with knowledge, to assist in the fight against crime, and to
report the criminal activities. The Blouberg Community Safety Model has been granted a provincial award as the best
model in the province.
The municipality intends to implement the plan by installing the high mast lights in the crime hotspots identified
settlements and as a result, budget has been set aside for the project. In the Premiers state of the province address,
he indicated that all the traditional leaders’ homes are equipped with the high mast lights for safety and security reasons
and identification purposes.
6.18. EMPLOYMENT EQUITY PLAN
The Municipality has developed and adopted an Employment Equity Plan in compliance with the Employment Equity
Act. Under this plan, the Municipality wants to ensure that equity groups are equitable represented in the municipal
workforce. While strides were made in addressing women, youth and people living with disability challenges exist with
regard to the recruitment of other groups such as Indians and Whites and the municipality is currently exploring the
aspect of recruiting of these groupings.
6.19. BLOUBERG GROWTH AND DEVELOPMENT STRATEGY (VISION 2040)
The municipality is finalizing the long-term strategy to guide its economic development and planning for the period until
2040.
The strategy has short, medium and long-term objectives. It is a micro economic strategy for the municipality aligned
to the district growth and development strategy, the Limpopo Development Plan and the National Development Plan.
The revised Local Economic Strategy shall be based on this vision. The strategy outlines the projects to be
implemented for the development of the economy.
After its finalization, unemployment shall be reduced to only 7% in the municipality.
CHAPTER 7: APPROVAL PHASE
Blouberg Local Municipality adopted its 2020/2021 IDP and Budget in an Ordinary Council meeting held on the 29th
June 2020 through a virtual system and the meeting was live on the municipality’s Official Facebook page.

248
STAKEHOLDER’S REPORT FOR 2020/2021 FINANCIAL YEAR
WARD SETTLEMENT PRIORITIES PROJECTS & LOCATION
FUNDING BUDGET
1 Vienan, Norma A&B, Earlydawn, Audlongsyne, Kgatlu, Lewaneng, Uitkyk No,03, Raweshi, Byswater, Sadu, Aurora A&B
Network Water Roads upgrade Electricity Youth entrepreneur support programmes Skills development and training Library and Museum at Ga-Maleboho
Housing – 10 units: Aurora
CoGHSTA
2 Gemarke , Mokumuru, Lekgwara, Schoengezight A & B, Branen
3 Miltonduff, Mongalo, Milbank(Monyebodi), Ga Hlako, New Jerusalem
4 Nonparella, Devilliersdale, Kgwale, Driekoppies, Swartz, Normandy, Montz, Silvermine, Baltimore
Housing- 25: Swartz 10, Driekoppies 15
CoGHSTA
5 Sekhung, Mankgodi(Windhoek), Pappegaai, Vergelegen, Grootdraai, Diepslot, Thebere, Letswatla
Housing Housing- 7: Windhoek 3, Pappegaai 4
CoGHSTA
Electricity Supply Apollo lights Internal tarred streets Community sports ground Clinic to operate 24 hours Roads and Bridge Full time ambulance Water,machine and pressure pumps Big dam Jojo tanks Fancing the graveyards Rdp houses Epwp and CWP Security fence for livestock
Electricity-20 Diepsloot household connection
INEP R360 000.00
6 MyDarling, Bergendal, Mamoleka, Kgatla, Tikilaane,
7 Ga-kobe , Bognafarm, Machoana, Matoana, Lepzig, Sweethome
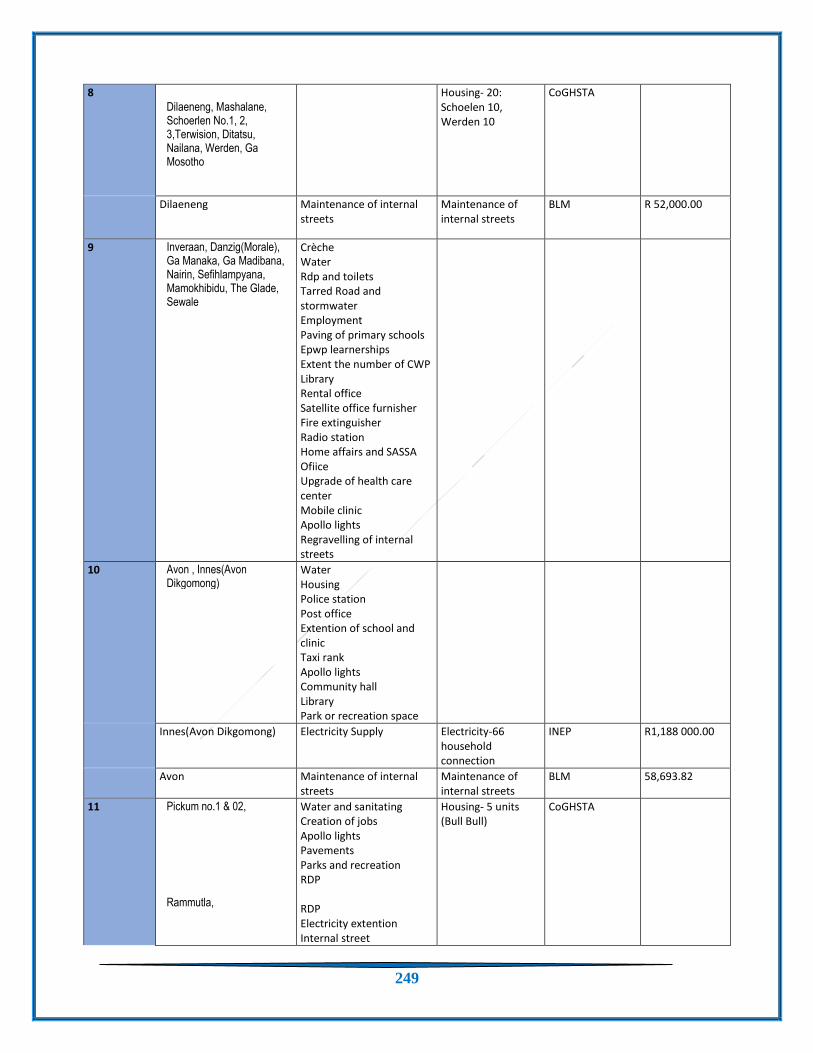
249
8 Dilaeneng, Mashalane, Schoerlen No.1, 2, 3,Terwision, Ditatsu, Nailana, Werden, Ga Mosotho
Housing- 20: Schoelen 10, Werden 10
CoGHSTA
Dilaeneng Maintenance of internal streets
Maintenance of internal streets
BLM R 52,000.00
9 Inveraan, Danzig(Morale), Ga Manaka, Ga Madibana, Nairin, Sefihlampyana, Mamokhibidu, The Glade, Sewale
Crèche Water Rdp and toilets Tarred Road and stormwater Employment Paving of primary schools Epwp learnerships Extent the number of CWP Library Rental office Satellite office furnisher Fire extinguisher Radio station Home affairs and SASSA Ofiice Upgrade of health care center Mobile clinic Apollo lights Regravelling of internal streets
10 Avon , Innes(Avon Dikgomong)
Water Housing Police station Post office Extention of school and clinic Taxi rank Apollo lights Community hall Library Park or recreation space
Innes(Avon Dikgomong) Electricity Supply Electricity-66 household connection
INEP R1,188 000.00
Avon Maintenance of internal streets
Maintenance of internal streets
BLM 58,693.82
11 Pickum no.1 & 02, Rammutla,
Water and sanitating Creation of jobs Apollo lights Pavements Parks and recreation RDP RDP Electricity extention Internal street
Housing- 5 units (Bull Bull)
CoGHSTA

250
Mmakwara, Bull-Bull, Machaba(Puraspan), Lethaleng / lekgokgonong
Sanitation Musk for elders Cleaning of graveyards School garden Crèche toys Access road Stormwater Water electricity sports facility RDP Water Crèche Community wall RDP Maintenance of access road and internal streets Clinic Primary school RDP Water Electricity RDP Roads and stomwater Epwp and cwp Community hall
Machaba(Puraspan), Maintenance of internal streets
Maintenance of internal streets
BLM R 52,000.00
12 Indermark, Vivo Maintenance of internal streets Water Roads (D1468, D1447, R561) Network Cemetery Vivo Management of Hawker stalls Waste management Sanitation Employment Mobile clinic Apollo lights Land for residential RDP
Maintenance of internal streets
BLM R 52,000.00
13 Glenfernis , Edwinsdale, Mmotlana, Burgerecht, Pax, Stoking, Ga Maphoto, Lovely
Survey of land Water Roads and stormwater Food parcels Employment Extension of school ( pokanong) Sanitation

251
RDP Apollo lights Dustbin
14 Mampote ,
Mochemi,
Mafateng,Mokgweng,
Thalaane, Bosehla,
Kwarung
Community hall Apollo lights Clinic Network Roads Water Road and stormwater RDP Extention of school Apollo lights Employment Renovation of ben seraki Renovation of dam Water Employment Internal street
15 Ga-Makgato , Devrede
Devrede Maintenance of internal streets
Maintenance of internal streets
BLM R 52,000.00
Ga-Makgato Maintenance of internal streets Youth funding Employment Water ( yard connection) Sanitation Sports complex Cemetery fence Support back to school RDP Apollo lights Police station Extention of schools Computer center Library Demarcation of Residential sites Refuse transfer station Maintenance of taxi rank Maintenance of community hall Training for cooperatives
Maintenance of internal streets
BLM R 52,000.00
16 Thlona(Towerfontein),
Makaepea,
Water Roads Upgrade of schools apollo lights toilets
Eldorado Crop Farming

252
Essauringa,
Eldorado,
Makgari,
Mashamaite
Water Sanitation RDP Dam Epwp and CWP Extention of schools Water Tarred roads Sanitation Apollo lights Eskom office Shopping malls RDP RDP Youth and disability training skills and forum Health and social development Sports center Mobile toilet and mobile classroom Roads and stormwater Water Roads RDP Sanitation
Thlona(Towerfontein), Social Development Construction of creche
BLM R 976 195.54
17 Sampson Royston, Sias,
Arrie,Grootpan, Longden, ,
Rakwele,
Water Tarred roads Sanitation Apollo lights Mobile police station RDP Epwp and CWP Extention of schools Health center
Housing- 25 units (Sampson 5, Grootpan 5, Royston 5, Juniorsloop 5, Donkerhoek 5)
18 Taaibosch, Alldays Waste management Waste management Housing- 30 units (Taaibosch) Waste management Street lights Road paving Taaibosch water supply Sports Complex Township establishment (500 erven)
Department of Environment and Forestry

253
Township registration Ext 2
Alldays Maintenance of internal streets Site demarcation Bulk water Fixing potholes Sports ground lights Rdp Sign road and speed humps Maintenance of parks
Maintenance of internal streets
BLM R 100,000.00
Taaibosch Maintenance of internal streets
Maintenance of internal streets
BLM R 52,000.00
19
Witten ,Desmondpark,
Bochum Township,
Bochum Ext 05
Waste management Human settlements
Waste Management Housing- 15 units Township establishment (1000 erven)
Department of Environment and Forestry CoGHSTA
Senwabarwana and Witten Construction of internal
street and sports
recreation
By- Pass road phase 1 Internal street Sports complex
MIG MIG MIG
R17,500,000.00 R6,258.517.59 R18,104,182.00
Witten Electricity Supply Electricity-248 household connection
INEP R4,452 000.00
Senwabarwana Maintenance of internal streets
Maintenance of internal streets
BLM R 100,000.00
20 Mokhurumela ,
Thorp,
Gedion,
Motadi, Wegdraai,
Water Graveling of roads Maintenance of bridges RDP Apollo lights RDP Water Dam for livestock School block Fancing of farms Graveling of internal streets Water Roads and stormwater Crèche Tarred roads Internal streets High bill of electricity Water tanks

254
Slaaphoek,
Tolwe, Maastroom,
Swartwater
Tarred roads RDP Classrooms Dumping site Community hall toilets RDP Community hall RDP Mobile clinic Crèche Apollo lights Toilet
21 Rosenkraanz
Uitkyk No.1 & 2,
Telburg,
Bugwell,
Mankgodi, Mosehleng,
Dam for livestock Tarred roads Border fence, cattle kraal and grazing camp Motor-gate 3 apollo lights Graveyard CWP Bridges Roads and stormwater Community hall Network ( cellphone) Epwp and CWP Graveyard fence Household connection water CWP and Epwp Cwp Mud dam Dumbing site Roads Water Electricity Library Street lights Community hall Toilet RDP Three phase electricity RDP Toilets
Housing- 50 units
(Pinkie Sebotse 40
and Uitkyk 10)
CoGHSTA

255
Cooperspark,
Pinkie Sebotse
Epwp and cwp Roads and stormwater Roads Water Farming fence Training youth on crop farming RDP Toilets Epwp and cwp Roads and stormwater Community hall
22 Boslaagte,
Prospect
Ngwanallela
Mamehlabe
Leokaneng
Water Rdp Electricity Clinic Employment Apollo lights Rdp clinic RDP Toilets Roads and storm water Electricity Water Rdp Electricity Apollo lights Employment Apollo lights Water tanks Bore holes Roads Health centers
Housing- 50 units (Prospect 25, Mamehlabe 20, Boslaagte 5)
CoGHSTA
Mamehlabe Connector roads and internal streets
Maintenance of internal streets
BLM R 52,000.00

256