Embed Size (px)
Citation preview

Public Review Draft June 27, 2012
Vision for Clean Air: A Framework for Air Quality and Climate Planning
This document has been prepared by the staffs of the California Air Resources Board,
the South Coast Air Quality Management District and the San Joaquin Valley Unified Air Pollution Control District. Publication does not signify that the contents reflect the views
and policies of the Air Resources Board, the South Coast Air Quality Management District or the San Joaquin Valley Unified Air Pollution Control District. This document will be presented as an informational item at a noticed public meeting scheduled for
June 28, 2012.

PUBLIC REVIEW DRAFT JUNE 27, 2012
PUBLIC REVIEW DRAFT JUNE 27, 2012
Table of Contents Executive Summary ........................................................................................................ 1
Achieving California’s Air Quality and Climate Goals................................................... 4
Coordinated Air Quality and Climate Planning ............................................................. 5
An Approach for Integrating Air Quality and Climate Planning ........................................ 7
Vision Scenarios .......................................................................................................... 7
Vision Targets .............................................................................................................. 9
Air Quality Challenges in the South Coast and San Joaquin Valley ....................... 10
Vision Tool ................................................................................................................. 13
Keys Concepts for Achieving California’s Air Quality and Climate Goals ...................... 15
Concept 1. Technology Transformation .................................................................... 17
Concept 2. Early Action ............................................................................................ 19
Concept 3. Cleaner Combustion ............................................................................... 21
Concept 4. Multiple Strategies .................................................................................. 24
Concept 5. Federal Action ........................................................................................ 26
Concept 6. Efficiency Gains ...................................................................................... 28
Concept 7. Energy Transformation ........................................................................... 30
Conclusion and Next Steps ........................................................................................... 34
Statewide Planning and Program Implementation ..................................................... 36
SIP Development ....................................................................................................... 37
Actions for Development, Demonstration and Deployment of Needed Cleaner Engine and Zero- and Near-Zero Emission Technologies ..................................... 38
Appendix: Actions for Development, Demonstration, and Deployment of Needed
Advanced Technologies

PUBLIC REVIEW DRAFT JUNE 27, 2012

PUBLIC REVIEW DRAFT JUNE 27, 2012
1
Executive Summary As California plans for the future, transformational technologies, cleaner energy, and greater efficiency are expected to provide the foundation for meeting air quality standards and climate goals. California’s success in reducing smog has largely relied on technology and fuel advances, and as health-based air quality standards are tightened, the introduction of cleaner technologies must keep pace. More broadly, a transition to zero- and near-zero emission technologies is necessary to meet 2023 and 2032 air quality standards and 2050 climate goals. Many of the same technologies will address both air quality and climate needs. As such, strategies developed for air quality and climate change planning should be coordinated to make the most efficient use of limited resources and the time needed to develop cleaner technologies. Vision for Clean Air: A Framework for Air Quality and Climate Planning takes a coordinated look at strategies to meet California’s multiple air quality and climate goals well into the future. Its quantitative demonstration of the needed technology and energy transformation provides a foundation for future integrated air quality and climate program development. Vision for Clean Air focuses on mobile sources and associated energy production. Similar analyses will be necessary for industrial and other emission sources to develop a complete foundation for integrated planning. Recognizing that the severity of California’s air quality problems varies by region, Vision for Clean Air examines what is needed to attain air quality standards by the federal deadlines in the areas with the worst air quality -- the South Coast Air Basin and the San Joaquin Valley Air Basin. However, the technologies and strategies identified will pay clean air dividends for all air districts, helping them achieve or maintain federal air quality standards and reduce local air toxics exposure. Achieving the 2020 greenhouse gas emission target established by the Global Warming Solutions Act of 2006 (AB 32) is a statewide goal. For the long term, California has set for itself the 2050 goal of greenhouse gas emissions of 80 percent less than 1990 levels overall, and specifically 80 percent less than 1990 levels for the transportation sector.1 In 2013, the
1 Governor Brown Executive Order B-16-2012
Ozone and Climate Planning Horizons
Figure 1

PUBLIC REVIEW DRAFT JUNE 27, 2012
2
AB 32 Scoping Plan will be updated to address post-2020 greenhouse gas emissions. In 2009, the Air Resources Board (ARB), the South Coast Air Quality Management District (SCAQMD) and the San Joaquin Valley Air Pollution Control District (SJVAPCD) developed a partnership with the U.S. Environmental Protection Agency (U.S. EPA) to promote technology advancements needed to meet air quality standards by federal deadlines. In Vision for Clean Air, ARB and the South Coast and San Joaquin Valley air districts examine how those technologies can meet both air quality and climate goals over time. California’s deadlines for meeting federal air quality standards extend past 2020, and U.S. EPA recently announced that the deadline for the updated ozone standard will be 2032.2 Since scientific studies continue to document health impacts of air pollution at progressively lower levels, air quality standards are periodically revised, becoming more stringent over time. Broad deployment of zero- and near-zero emission technologies in the South Coast and San Joaquin Valley air basins will be needed in the 2023 to 2032 timeframe to attain current national health-based air quality standards as required by federal law. For greenhouse gases, California’s 2050 climate goal provides an ambitious long-term target. Many strategies developed to meet the shorter-term air quality standards — notably use of cleaner energy sources — will have benefits toward the longer-term climate goal. Pursuing cleaner energy sources is also the focus of the State’s energy policies, providing the opportunity for economic, as well as environmental benefits. Coordinated planning with identified milestones will support the transition to zero-and near-zero emission technologies needed to meet these goals. To explore the scope of technology advancements needed to meet air quality and climate goals, several key questions are posed:
What technologies, fuels, and other strategies are needed to meet local air quality and greenhouse gas goals? Are they the same?
What are the implications of federal air quality deadlines coming 20 to 30 years before the 2050 greenhouse gas goal?
How can the strategies to meet local air quality targets and greenhouse gas goals best complement each other?
What are the energy infrastructure demands of coordinated air quality and greenhouse gas strategies?
2 Vision for Clean Air uses 2035 as the target date for the updated ozone standard. After the analytical effort for Vision for Clean Air began, U.S. EPA formally set the attainment deadline at 2032.

PUBLIC REVIEW DRAFT JUNE 27, 2012
3
How do California’s air quality and climate policies need to adapt as emissions move from the vehicle itself to predominantly upstream sources such as electricity and hydrogen or equivalent generation facilities?
Quantitative scenarios were developed for key transportation-related sectors to gain insight into the key questions above. The sectors that are the focus of this report are by far the largest contributors to greenhouse gas emissions and regional air pollution in California. Greenhouse gas emission reduction goals are statewide and the scenarios use a lifecycle emissions analysis approach. The analysis of smog-forming pollutants is regional, reflecting the need to meet air quality standards on that basis. The localized impacts of toxic diesel particulate matter are recognized, and play an important role when evaluating the passenger and freight transport systems. Reducing emissions in these mobile source sectors is key to attaining air quality and climate goals, but does not represent all of the emission reductions needed for individual regions to demonstrate attainment of federal air quality standards. Comprehensive attainment strategies containing both mobile and stationary source measures will be developed as individual regions develop new air quality plans. The scenarios illustrate the nature of the technology transformation needed to meet the multiple program milestones through 2050. The scenarios highlight the interplay between reducing smog-forming pollutants and greenhouse gases. The scenario results demonstrate the importance of considering the multi-pollutant impacts of policy choices. Planning efforts, public investment, and rulemaking decisions by State, federal, and local agencies will play an important role in the outcome. In making these decisions, agencies will need to consider factors including technical feasibility and cost, downstream and upstream emission reduction potential, energy production capacity and infrastructure, and the necessary pace of transformation needed to meet air quality and climate goals. In designing the scenarios, it was necessary to make general assumptions about future growth, the pace of introduction of various technologies, and other factors. It is recognized that the scenarios contained herein are not the only pathways to meet air quality and climate goals. Thus, the scenarios are not refined analyses that would be directly used for program development, but will provide input into future planning efforts by air quality agencies. Similarly, economic and environmental analyses are steps that need to be done in future plans. An update to the AB 32 Scoping Plan is due in 2013. State Implementation Plans (SIPs) to meet the federal particulate matter air quality standards in the South Coast and the San Joaquin Valley are due later this year and major ozone SIPs for the recently updated federal ozone standard will be due in 2015. More detailed analyses will begin to emerge as part of these efforts.

PUBLIC REVIEW DRAFT JUNE 27, 2012
4
Achieving California’s Air Quality and Climate Goals The federal Clean Air Act requires states to identify the reductions of smog-forming emissions necessary to meet each federal air quality standard. Also under the federal planning process, states must identify the actions needed to bring emissions down to the attainment levels by the required deadlines. These two parts of a state’s SIP comprise the attainment demonstration. Federal rules set out detailed procedures, technical requirements, and public processes for the development of attainment demonstrations. As mentioned earlier, the scenarios in Vision for Clean Air are not intended to be attainment demonstrations within the meaning of the Clean Air Act, but they do serve to illustrate the scale of technology change needed to meet the federal standards in 2023 and beyond. The federal Clean Air Act specifically recognizes the need for advanced technologies in attainment demonstrations for extreme ozone nonattainment areas. The South Coast and San Joaquin Valley air basins are the only two extreme ozone areas in the nation. The federally approved SIPs for these two regions rely on a mix of currently available technologies and the development of advanced technologies in order to attain the ozone air quality standard by 2023. Reaching the longer-term 2032 ozone air quality standard and the 2050 climate goal requires even greater transformation. This includes, for example, nearly complete transformation of passenger vehicles to zero-emission technologies, approximately 80 percent of the truck fleet to zero-or near-zero technology, and nearly all locomotives operating in the South Coast air basin to be using some form of zero-emission technology.
The Global Warming Solutions Act of 2006 set the 2020 greenhouse gas emissions reduction goal into law. It directed ARB to develop early actions to reduce greenhouse gases while also preparing a Scoping Plan to identify how best to reach the 2020 limit. The State’s goal to further reduce greenhouse gases by 2050 was first established
when Governor Schwarzenegger signed Executive Order S-3-05 in 2005. In March 2012, Governor Brown issued Executive Order B-16-2012 setting a California target for reductions of greenhouse gas emissions from the transportation sector of 80 percent less than 1990 levels by 2050 and calling for the establishment of benchmarks for the penetration of zero-emission vehicles and infrastructure for 2015, 2020, and 2025.
Meeting Federal Ozone Standards
For the South Coast Air Basin, it is estimated that oxides of nitrogen, one of the key
ingredients in ozone and fine particulate formation, must be reduced by around
80 percent from 2010 levels by 2023, and almost 90 percent by 2032. Similar levels of
emissions reductions are likely needed in the San Joaquin Valley by 2032.
Meeting Climate Change Goals
To meet the goal of reducing California’s greenhouse gas
emissions to 1990 levels by 2050, emissions must be reduced by 85 percent from today’s levels.

PUBLIC REVIEW DRAFT JUNE 27, 2012
5
Coordinated Air Quality and Climate Planning The Vision for Clean Air scenarios illustrate seven key concepts that together provide a foundation for coordinated solutions to California’s air quality and climate goals.
Technology Transformation: Transformation to advanced, zero-and near-zero emission technologies, renewable clean fuels, and greater efficiency that can achieve both federal air quality standards and climate goals.
Early Action: Acceleration of the pace of transformation to meet federal air quality standard deadlines, with early actions to develop and deploy zero- and near-zero technologies also needed to meet climate goals.
Cleaner Combustion: Advanced technology NOx emissions standards for on- and off-road heavy-duty engines beyond the cleanest available today to meet federal air quality standards in a timely manner.
Multiple Strategies: A combination of strategies — technology, energy, and efficiency — applied to each sector.
Federal Action: Federal actions, in addition to actions by state and local agencies and governments, to help clean-up sources that travel nationally and internationally such as trucks, ships, locomotives and aircraft.
Efficiency Gains: Greater system and operational efficiencies to mitigate the impacts of growth, especially in high-growth freight transport sectors and vehicle efficiency gains to reduce fuel usage and mitigate the cost of new technologies.
Energy Transformation: Transformation of the upstream energy sector and its greenhouse gas and smog forming emissions concurrent with the transformation to advanced technologies downstream.
Development of coordinated solutions to California’s air quality and climate goals will require the efforts of multiple agencies at all levels of government. The solutions span all sectors, rely on the development of multiple technologies, and require the coordinated deployment of technologies and energy infrastructure. ARB has the role of setting technology-forcing standards for mobile sources that have been the distinguishing feature of the State’s air quality progress and climate leadership. Action by the federal government, for trucks, locomotives, aircraft, and ships, is also critical. Finally, transformation of the energy sector will require multiple agencies, including the California Energy Commission, the Public Utilities Commission, ARB, and local air districts, to share a common vision. The SCAQMD, SJVAPCD, and other local air districts play a key role through actions to accelerate the use of new, cleaner mobile technologies at the regional level to improve air quality and meet federal air quality standards. While Vision for Clean Air focuses on
PUBLIC REVIEW DRAFT JUNE 27, 2012
6
the mobile sectors and the energy system to power them, attainment of the federal air quality standards will also require similar transformation of traditional stationary sources covered through SIP planning. Air districts will need to continue their actions to reduce emissions from these sources in order to meet federal requirements. Metropolitan planning organizations, port authorities, and local governments will also play important roles in the overall pollution control strategies. Private sector activities will be key to developing the technology, building the engines, and implementing the necessary transformation. Engine and vehicle manufacturers will need to continue the development and marketing of advanced technologies. Energy industries will need to supply the renewable fuels and energy, including the necessary infrastructure. In the freight transport industries, increased efficiencies that support growth while mitigating environmental impacts will be essential. Both public and private investment will be needed to enable the technology transformation necessary to achieve California's air quality and climate goals. Vision for Clean Air lays the foundation for an integrated approach to develop and deploy the cleanest emissions control technologies. For many of the sectors discussed, zero- and near-zero emission technologies have been developed or anticipated to be developed over the next few years. Vision for Clean Air provides a timeline for coordinated development and accelerated deployment of the types of technologies expected to be needed in each of the sectors. Vision for Clean Air is being released as a draft document for discussion at a public meeting in June 2012 and at public workshops in August. The document sets the stage for subsequent planning efforts through scenarios designed to illustrate the scope of change needed to meet federal air quality standards and California’s climate goals. The scenarios presented are not intended to identify a specific course of action to meet each air quality and climate goal. Nor are the scenarios a prediction of the actual mix of vehicle technologies, fuels, and clean energy sources expected to emerge in the long term. Public and private investment, regulatory decisions, and consumer preferences will all affect the success of specific strategies and options to meet these ambitious goals.

PUBLIC REVIEW DRAFT JUNE 27, 2012
7
An Approach for Integrating Air Quality and Climate Planning The federally approved 2007 State Implementation Plans for the South Coast Air Basin and the San Joaquin Valley Air Basin call for broad use of advanced technologies, clean energy, and greater efficiencies to provide the foundation for meeting federal air quality standards. The 2008 Scoping Plan, required by California’s Global Warming Solutions Act of 2006, similarly called for a statewide transition to clean energy and advanced technologies and outlined actions toward that end. To understand the interplay among strategies to meet air quality and climate goals, and to develop common and effective solutions to both, basic questions need to be answered. These include:
What technologies, fuels, and other strategies are needed to meet local air quality and greenhouse gas goals? Are they the same?
What are the implications of federal air quality deadlines coming 20 to 30 years before the 2050 greenhouse gas goal?
Is the pace of needed transformation the same? How can the strategies to meet air quality targets and greenhouse gas goals best complement each other?
What are the energy infrastructure demands of coordinated air quality and greenhouse gas strategies?
How do California’s air quality and climate policies need to adapt as emissions move from the vehicle itself to predominantly upstream sources such as electricity and hydrogen generation facilities?
To begin to answer these questions and lay a foundation for future coordinated planning for criteria pollutants regulated through air quality standards (i.e., criteria pollutants), toxic pollutants such as diesel particulate matter, and greenhouse gases, Vision for Clean Air uses quantitative scenarios. These scenarios examine the nature of the technology and fuel transformation needed to meet the multiple air quality and greenhouse gas milestones between now and 2050. Vision Scenarios Under the Clean Air Act, traditional air quality planning typically focuses on the emissions reductions expected in a single future year from regulations adopted in the
Crosscutting Issues
Figure 2
PUBLIC REVIEW DRAFT JUNE 27, 2012
8
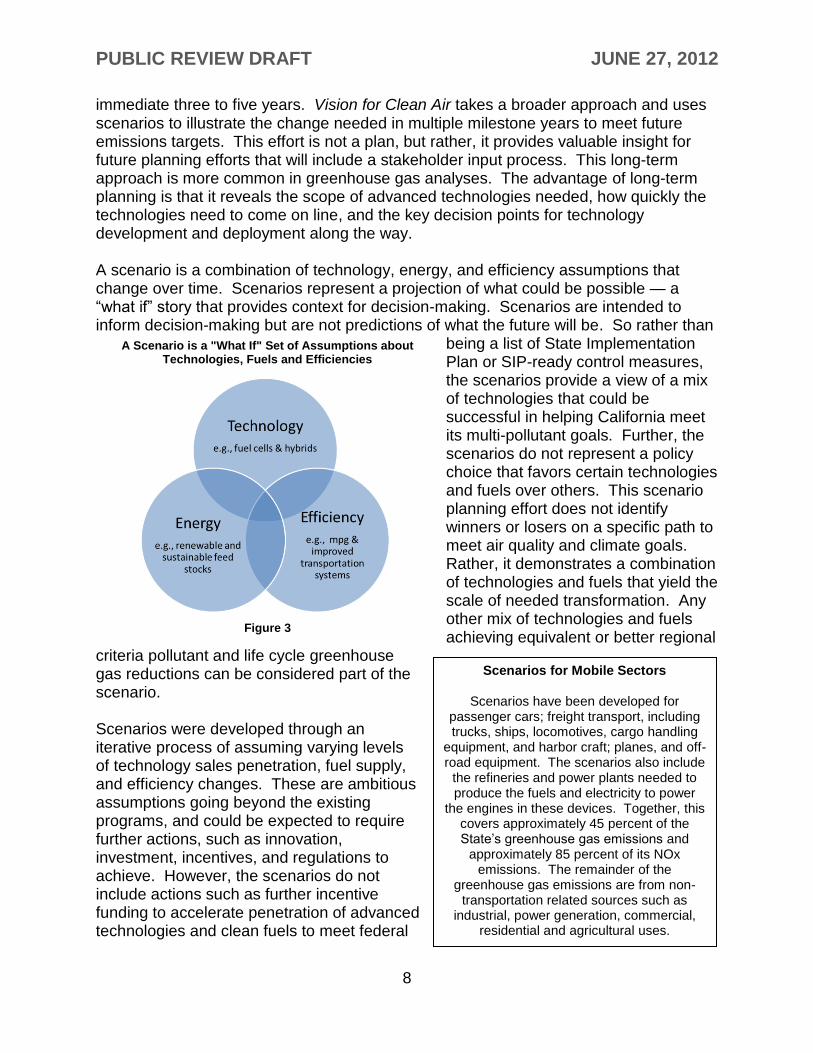
immediate three to five years. Vision for Clean Air takes a broader approach and uses scenarios to illustrate the change needed in multiple milestone years to meet future emissions targets. This effort is not a plan, but rather, it provides valuable insight for future planning efforts that will include a stakeholder input process. This long-term approach is more common in greenhouse gas analyses. The advantage of long-term planning is that it reveals the scope of advanced technologies needed, how quickly the technologies need to come on line, and the key decision points for technology development and deployment along the way. A scenario is a combination of technology, energy, and efficiency assumptions that change over time. Scenarios represent a projection of what could be possible — a ―what if‖ story that provides context for decision-making. Scenarios are intended to inform decision-making but are not predictions of what the future will be. So rather than
being a list of State Implementation Plan or SIP-ready control measures, the scenarios provide a view of a mix of technologies that could be successful in helping California meet its multi-pollutant goals. Further, the scenarios do not represent a policy choice that favors certain technologies and fuels over others. This scenario planning effort does not identify winners or losers on a specific path to meet air quality and climate goals. Rather, it demonstrates a combination of technologies and fuels that yield the scale of needed transformation. Any other mix of technologies and fuels achieving equivalent or better regional
criteria pollutant and life cycle greenhouse gas reductions can be considered part of the scenario. Scenarios were developed through an iterative process of assuming varying levels of technology sales penetration, fuel supply, and efficiency changes. These are ambitious assumptions going beyond the existing programs, and could be expected to require further actions, such as innovation, investment, incentives, and regulations to achieve. However, the scenarios do not include actions such as further incentive funding to accelerate penetration of advanced technologies and clean fuels to meet federal
Scenarios for Mobile Sectors
Scenarios have been developed for passenger cars; freight transport, including trucks, ships, locomotives, cargo handling
equipment, and harbor craft; planes, and off-road equipment. The scenarios also include
the refineries and power plants needed to produce the fuels and electricity to power
the engines in these devices. Together, this covers approximately 45 percent of the State’s greenhouse gas emissions and
approximately 85 percent of its NOx emissions. The remainder of the
greenhouse gas emissions are from non-transportation related sources such as
industrial, power generation, commercial, residential and agricultural uses.
A Scenario is a "What If" Set of Assumptions about Technologies, Fuels and Efficiencies
Figure 3
PUBLIC REVIEW DRAFT JUNE 27, 2012
9
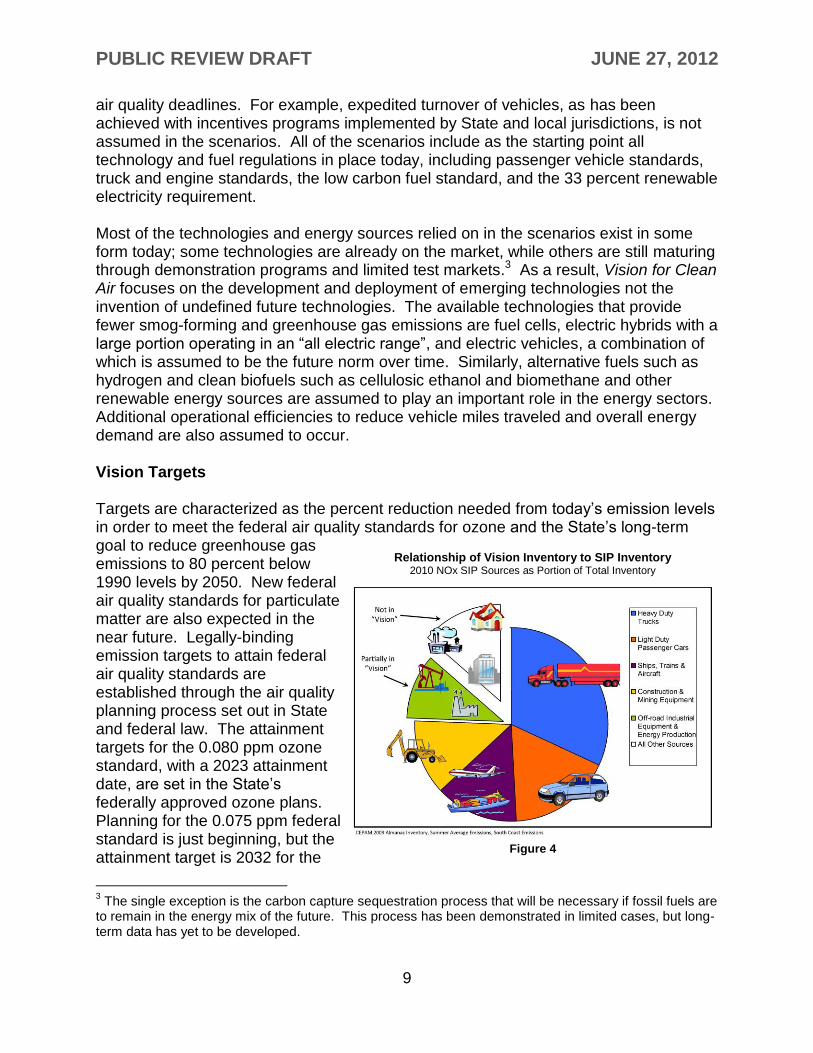
air quality deadlines. For example, expedited turnover of vehicles, as has been achieved with incentives programs implemented by State and local jurisdictions, is not assumed in the scenarios. All of the scenarios include as the starting point all technology and fuel regulations in place today, including passenger vehicle standards, truck and engine standards, the low carbon fuel standard, and the 33 percent renewable electricity requirement. Most of the technologies and energy sources relied on in the scenarios exist in some form today; some technologies are already on the market, while others are still maturing through demonstration programs and limited test markets.3 As a result, Vision for Clean Air focuses on the development and deployment of emerging technologies not the invention of undefined future technologies. The available technologies that provide fewer smog-forming and greenhouse gas emissions are fuel cells, electric hybrids with a large portion operating in an ―all electric range‖, and electric vehicles, a combination of which is assumed to be the future norm over time. Similarly, alternative fuels such as hydrogen and clean biofuels such as cellulosic ethanol and biomethane and other renewable energy sources are assumed to play an important role in the energy sectors. Additional operational efficiencies to reduce vehicle miles traveled and overall energy demand are also assumed to occur. Vision Targets Targets are characterized as the percent reduction needed from today’s emission levels in order to meet the federal air quality standards for ozone and the State’s long-term goal to reduce greenhouse gas emissions to 80 percent below 1990 levels by 2050. New federal air quality standards for particulate matter are also expected in the near future. Legally-binding emission targets to attain federal air quality standards are established through the air quality planning process set out in State and federal law. The attainment targets for the 0.080 ppm ozone standard, with a 2023 attainment date, are set in the State’s federally approved ozone plans. Planning for the 0.075 ppm federal standard is just beginning, but the attainment target is 2032 for the
3 The single exception is the carbon capture sequestration process that will be necessary if fossil fuels are
to remain in the energy mix of the future. This process has been demonstrated in limited cases, but long-term data has yet to be developed.
Relationship of Vision Inventory to SIP Inventory 2010 NOx SIP Sources as Portion of Total Inventory
Figure 4

PUBLIC REVIEW DRAFT JUNE 27, 2012
10
extreme ozone areas of the South Coast Air Basin and San Joaquin Valley. The targets used here are estimates of what the attainment targets could be past 2023 based on current air quality information. Vision for Clean Air focuses on oxides of nitrogen (NOx) emissions as NOx is the most critical pollutant for reducing regional ozone and fine particulate matter. The SIP air quality targets and the 2050 greenhouse gas goal apply to the total emissions from all sources. In developing future SIPs and climate plans, the full spectrum of emissions sources must be considered. Vision for Clean Air focuses on mobile sectors and assumes the same percent reduction must be achieved by each. Future planning efforts will need to look at the tradeoffs among strategies for specific source categories that achieve relatively more or fewer reductions in light of technological, economic, and other factors. The following are the air quality goals used in the scenario development process:
Achieve the 0.08 ppm 8-hour federal ozone standard by 2023 by reducing NOx emissions by 80 percent from 2010 levels.
Achieve the 0.075 ppm 8-hour federal ozone standard by 2032 by reducing NOx emissions by 90 percent from 2010 levels.
Reduce greenhouse gas emissions by 80 percent below 1990 levels by 2050. This is equivalent to 85 percent from today’s levels.
This document does not evaluate emission reductions needed to attain a potential new ozone standard (i.e., 0.06 - 0.07 ppm 8-hr standard). As scientific studies are documenting health impacts of air pollution at very low levels, it is expected that further NOx reductions will be needed in the long-term. U.S. EPA is expected to consider adopting an ozone standard lower than 0.075 ppm in 2013. Achieving a future ozone standard in the range EPA is expected to consider could require additional NOx emissions reductions, totaling 95 percent from 2010 levels. Air Quality Challenges in the South Coast and San Joaquin Valley California is home to two of the nation’s most pressing air quality challenges. The South Coast and the San Joaquin Valley are the only two areas in the country designated as extreme nonattainment for the federal ozone standard. These same two areas also experience high levels of fine particulate matter. Because of the severity of the air quality changes in these two areas, they determine the transformational change needed to meet federal air quality standards throughout the State. Still, while they face a similar air quality challenge, they are different in terms of the nature of their emission sources.

PUBLIC REVIEW DRAFT JUNE 27, 2012
11
South Coast Air Basin The 2007 SIP for the federal ozone standard contains commitments for emission reductions from mobile sources that rely on advancement of technologies, as authorized under Section 182(e)(5) of the federal Clean Air Act. These measures, which have come to be known as the ―Black Box,‖ account for a substantial portion of the NOx emission reductions needed to attain the federal ozone standards — over 200 tons/day. Attaining these standards will require reductions in emissions of nitrogen oxides (NOx) well beyond reductions resulting from current rules, programs, and commercially-available technologies. Mobile sources emit over 80 percent of regional NOx and therefore must be the largest part of the solution. For the South Coast, the top NOx emission sources projected in 2023 are shown in Figure 5. On-road truck categories are projected to comprise the single largest contributor to regional NOx in 2023. Other equipment involved in goods movement, such as marine vessels, locomotives and aircraft, are also substantial NOx sources.
Preliminary projections indicate that the region must reduce regional NOx emissions by about two-thirds by 2023 beyond the benefits of adopted rules and programs, and three quarters by 2032, to attain the national ozone standards as required by federal law. Since most of the significant sources are already controlled by over 90 percent, attainment of the ozone standards in the
South Coast Air Basin will require broad deployment of zero- and near-zero emission technologies in the 2023 to 2032 timeframe. On-land transportation sources such as trucks, locomotives, and cargo handling equipment have technological potential to achieve zero- and near-zero emission levels. Current and potential technologies include hybrid-electric, battery-electric, and hydrogen fuel cell on-road vehicle technologies. Other technologies and fuels may also serve regional
Largest South Coast NOx Emission Sources
2023 in tons per day
Figure 5
Figure 6

PUBLIC REVIEW DRAFT JUNE 27, 2012
12
needs, e.g. natural gas-electric hybrids or alternative fuels coupled with advanced aftertreatment technologies. Air quality regulatory agencies have historically set policies and requirements that are performance based and allow any technologies that will achieve needed emission reductions on time. While there has been much progress in developing and deploying transportation technologies with zero- and near-zero emissions (particularly for light-duty vehicles and passenger transit), additional technology development, demonstration, and commercialization will be required prior to broad deployment in freight and other applications. San Joaquin Valley Air Basin Diesel trucks are also the single largest source of NOx emissions in the San Joaquin Valley. However, truck traffic in the Valley is dominated by interstate trucks and other through traffic traveling on the major north-south corridors of Interstate 5 and State Route 99. In contrast, a significant amount of South Coast truck traffic is associated with freight transport from the ports and inland. As a result, the age and activity of the trucks in the two regions differ, suggesting that there may be different options and constraints in terms of technology transformation for trucks that operate in the Valley. Passenger vehicles are the second largest source of NOx emissions in the San Joaquin Valley. The Valley may present different challenges in terms of infrastructure to support advanced technology passenger vehicles given the nature of urban development in the region. With the most productive agricultural region in the nation, the San Joaquin Valley is also home to the unique emissions sources of the agricultural industry. While mobile agricultural equipment emissions are significant, a separate scenario was not developed for these sources. Efforts are underway now to clean up mobile agricultural equipment to the cleanest currently available conventional technology. Emission reductions from those efforts are important for reducing ozone levels and measures to achieve these reductions are part of the region’s ozone SIP. Given the challenges posed by the operational requirements of this type of equipment and the importance of continuing the current cleanup efforts, consideration of potential future technologies is not included here. The current NOx targets are set in the approved ozone SIP for the San Joaquin Valley. Like the South Coast, the San Joaquin Valley SIP includes longer-term (―Black Box‖) emission reductions due by 2023. Because emissions in the South Coast are so large compared to the Valley, the absolute magnitude of the reductions needed is less than in the South Coast. Nevertheless, the scale of needed transformation is similar. Air quality modeling for the San Joaquin Valley to determine what emission reductions are needed to attain the 0.075 ppm ozone standard in 2032 will be done for the SIP due in 2015. Given the stringent level of the standard, it is expected that on a percentage
PUBLIC REVIEW DRAFT JUNE 27, 2012
13
basis the San Joaquin Valley and South Coast will need a similar magnitude of new reductions.
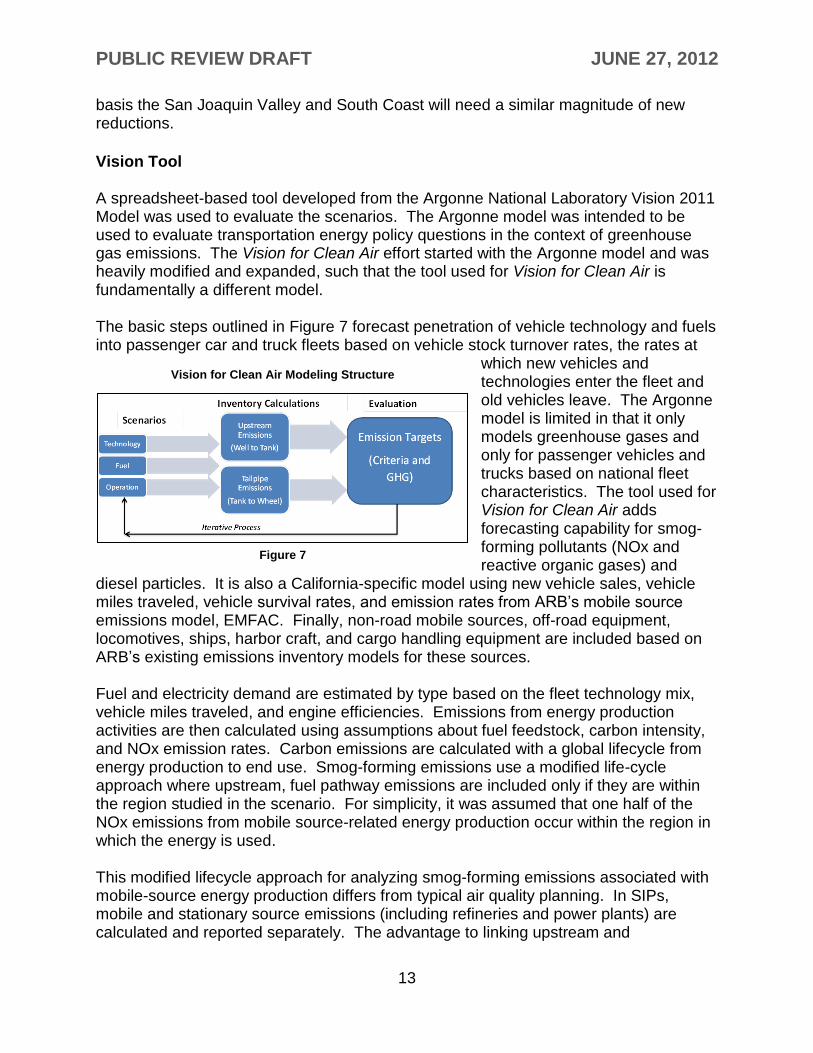
Vision Tool A spreadsheet-based tool developed from the Argonne National Laboratory Vision 2011 Model was used to evaluate the scenarios. The Argonne model was intended to be used to evaluate transportation energy policy questions in the context of greenhouse gas emissions. The Vision for Clean Air effort started with the Argonne model and was heavily modified and expanded, such that the tool used for Vision for Clean Air is fundamentally a different model. The basic steps outlined in Figure 7 forecast penetration of vehicle technology and fuels into passenger car and truck fleets based on vehicle stock turnover rates, the rates at
which new vehicles and technologies enter the fleet and old vehicles leave. The Argonne model is limited in that it only models greenhouse gases and only for passenger vehicles and trucks based on national fleet characteristics. The tool used for Vision for Clean Air adds forecasting capability for smog-forming pollutants (NOx and reactive organic gases) and
diesel particles. It is also a California-specific model using new vehicle sales, vehicle miles traveled, vehicle survival rates, and emission rates from ARB’s mobile source emissions model, EMFAC. Finally, non-road mobile sources, off-road equipment, locomotives, ships, harbor craft, and cargo handling equipment are included based on ARB’s existing emissions inventory models for these sources. Fuel and electricity demand are estimated by type based on the fleet technology mix, vehicle miles traveled, and engine efficiencies. Emissions from energy production activities are then calculated using assumptions about fuel feedstock, carbon intensity, and NOx emission rates. Carbon emissions are calculated with a global lifecycle from energy production to end use. Smog-forming emissions use a modified life-cycle approach where upstream, fuel pathway emissions are included only if they are within the region studied in the scenario. For simplicity, it was assumed that one half of the NOx emissions from mobile source-related energy production occur within the region in which the energy is used. This modified lifecycle approach for analyzing smog-forming emissions associated with mobile-source energy production differs from typical air quality planning. In SIPs, mobile and stationary source emissions (including refineries and power plants) are calculated and reported separately. The advantage to linking upstream and
Vision for Clean Air Modeling Structure
Figure 7
PUBLIC REVIEW DRAFT JUNE 27, 2012
14
downstream NOx emissions in this way is that it provides greater insight into the overall impacts of technology transformation. This is an important new tool for air quality planning since the large scale of the technology transformation in the scenarios requires an equally large upstream energy transition. Because the approach is new, the method and data are preliminary, and as a result, there are embedded assumptions about the relationship between upstream and downstream NOx emissions rates that will need to be revisited during subsequent planning efforts and future scenario analyses. The key sectors included in scenarios are:
Passenger Transportation o Light- and Medium-Duty Vehicles o Aircraft o Passenger Locomotives
Freight Movement o Heavy-Duty Trucks o Freight Locomotives o Cargo Handling Equipment o Commercial Harbor Craft o Commercial Ocean-Going Vessels
Off-Road Vehicles and Equipment o Construction Vehicles o Industrial Equipment
The Vision tool is executed in an iterative manner with subsequently more ambitious assumptions about the availability of cleaner engines and zero-emission technologies, cleaner fuels, and efficiency improvements. The technology and clean fuel assumptions could be realized through a combination of future regulatory actions to establish new tailpipe emission standards and fuel requirements, public and private investment, economic incentives, transportation and energy system efficiency improvements, and other future actions. Further details on the Vision tool and scenario input assumptions will be provided in the public workshop process.

PUBLIC REVIEW DRAFT JUNE 27, 2012
15
Keys Concepts for Achieving California’s Air Quality and Climate Goals Between now and 2050 California’s population is projected to grow from 35 million people today to nearly 60 million in 2050. The rate of growth of vehicle miles traveled (VMT) is expected to slow as regions develop and implement sustainable community strategies, but total VMT will continue to grow as population grows. Truck VMT is projected to grow statewide at about 2.5 percent per year. Commercial shipping is forecast to grow at a very high 5.5 percent per year. With these growth rates the benefits of current technology will not keep pace.
Figures 8 and 9 show this impact on a business as usual (BAU) forecast of greenhouse gas and NOx emissions for the mobile sectors covered in Vision for Clean Air. BAU includes California’s entire adopted motor vehicle program including the Advanced Clean Car program adopted in January 2012, the cleanest diesel standards for on- and off-road engines and the State’s fleet rules to accelerate turnover. For the energy sector, BAU includes the low carbon fuel standard and the 33 percent renewable electricity requirement. With these programs the BAU trajectory shows declining emissions between 2010 and 2030 but progress flattens in the next
decade and begins to reverse itself in the decade following. The BAU forecasts and Vision scenarios include both downstream emissions from vehicles and equipment, as well as upstream emissions that capture emissions from liquid fuel extraction, refining, and transportation to the fuel pump. For mobile sources powered by electricity, upstream emissions include those emissions associated with electricity generation. To simplify the analysis in these scenarios, half of the upstream criteria emissions are assigned in-basin and are included in the scenarios.
South Coast NOx Emission Scenario
(combined mobile sectors)
Figure 9
Statewide CO2 Emission Scenario
(combined mobile sectors)
Figure 8

PUBLIC REVIEW DRAFT JUNE 27, 2012
16
This approach to grouping emissions differs from emission source sectors in SIPs, but is consistent with greenhouse gas plans. In SIPs, the upstream emissions would be categorized under the stationary source heading, and vehicles and equipment would be considered mobile sources. As technological advances result in ever cleaner vehicles, emissions shift from downstream to upstream sources. Strategies will be needed to minimize criteria pollutant and greenhouse gas emissions from local upstream sources such as fuel production and transmission, to ensure timely attainment of air quality standards. The figures also show the combined results of the initial scenarios for all the sectors modeled for Vision for Clean Air. Several scenarios were developed and analyzed, some to look at the impact of single strategies, others to look at a group of approaches. The combined scenario in Figures 8 and 9 assumes the following:
By 2040, all passenger vehicles sold in California are zero-emissions vehicles.
By 2050, for trucks, the average fuel economy doubles and NOx emission standards are 80 percent below the current the cleanest standards.
Nearly all future locomotives operating statewide are zero-emission or near-zero emission such as hybrid-electric.
Future jet engines are 75 percent cleaner in terms of NOx emissions and all burn renewable jet fuel.
By 2050, 40 percent of new commercial ships are fueled by liquefied natural gas (LNG) or are natural gas-conventional fueled hybrids.
By 2050, all liquid fuels are derived from renewable feedstocks.
The electric grid capacity grows to meet new demands, yet is substantially cleaner with heavy reliance on either renewables or carbon capture and storage (CCS).
For greenhouse gases, the combined mobile sector scenario reaches and exceeds slightly the long-term 2050 greenhouse gas target. For NOx emissions, the scenario eventually meets the target levels, but does so more than 10 years later than the federal deadlines. This is illustrated in Figure 9 by the arrows pointing to the SIP attainment years and showing the remaining gap in NOx emission reductions even with the initial scenario assumptions. For mobile sources, the scale and timing of technology change needs to include significant implementation by 2023 well beyond the above assumptions in order to meet the 2023 ozone attainment deadline in the South Coast Air Basin. The next pages describe the individual scenarios for the various mobile sectors assumed in Figures 8 and 9 and expand on the seven key concepts for coordinating air

PUBLIC REVIEW DRAFT JUNE 27, 2012
17
quality and climate solutions. The scenario descriptions are structured around these seven key concepts. Individual sector scenarios are used to illustrate these concepts, which apply across all the sectors. Concept 1. Technology Transformation
Transformation to advanced, zero-and near-zero emission technologies, renewable clean fuels, and greater efficiency that can achieve both federal air
quality standards and climate goals.
Technology transformation will be needed in every sector examined. The passenger vehicle scenario below illustrates how a transformation to multiple advanced technologies, renewable fuels, and greater efficiency can lead to a vehicle and energy system that meets both air quality and climate goals. California first began the push toward zero- and near-zero technologies for passenger vehicles with the Zero Emission Vehicle program over 20 years ago. That effort continues with ARB’s recent adoption of
the Advanced Clean Car program, which sets new requirements through 2025. A passenger vehicle scenario, shown in Figure 10, assumes that transformation continues between 2025 and 2050 on a large scale. This scenario uses market penetration assumptions to explore one mix of technologies that would meet an 80 percent greenhouse gas reduction target for passenger vehicles in 2050 (compared to 1990 levels). Many other scenarios are possible using different assumptions about technology penetration, alternative fuels, energy sources, transportation systems, and travel behavior.
This scenario starts from today’s conditions where conventional gasoline vehicles make up the vast majority of sales in the passenger vehicles fleet. To meet the 2025 Advanced Clean Car requirements, sales are assumed to shift rapidly to gasoline-electric hybrids and to lesser extent flexible fuel vehicles. Gasoline-electric hybrid vehicles (HEVs) combine an internal combustion engine with a battery and electric motor. This combination offers the range and refueling capabilities of a conventional vehicle, while providing improved fuel economy and lower emissions. Manufacturers continue to make more hybrid models each year. Propulsion can come entirely from an electric motor, or the internal combustion engine might provide power to assist the electric motor. A hybrid's efficiency and emissions depend on the particular combination of subsystems, how these subsystems are integrated into a complete system, and the control strategy that integrates the subsystems. Flexible fuel vehicles (FFV) are capable of operating on gasoline, E85 (85 percent ethanol and 15 percent
Auto Sales Scenario
(2040 all zero emission)
Figure 10

PUBLIC REVIEW DRAFT JUNE 27, 2012
18
gasoline), or a mixture of both. There is a wide variety of flexible fuel vehicles available with more expected as the number of fueling stations begins to grow. In the long-term, greater penetration of advanced technologies than required by the Advanced Clean Car program is needed. So starting in the next decade, the scenario assumes that HEV and FFV sales peak and begin to taper off as plug-in hybrids sales grow. Plug-in hybrids (PHEV) are similar to traditional hybrids but are also equipped with larger, more advanced batteries that allow the vehicle to be plugged in and recharged in addition to refueling with gasoline. This larger battery allows PHEVs to offer 10 to 40 miles of all-electric range and behave much like battery electric vehicles until the battery is nearly depleted and the combustion engine starts. Plug-in hybrids are available now with several additional new models coming soon. Plug-in hybrids are a mid-term bridge to true zero-emission tailpipe technologies: battery electric vehicles and hydrogen fuel cell vehicles. Battery electric vehicles (BEVs) run on electricity stored in batteries and have an electric motor rather than a gasoline engine. Over the years, manufacturers have developed different types of BEVs that include neighborhood electric vehicles for short trips around town on roads with speed limits up to 35 mph, and full function BEVs that can travel up to 80 mph with a range of 75+ miles per full charge. Although BEVs are in limited supply now, a variety of models from major automakers are coming to market. Hydrogen fuel cell vehicles are zero emission and run on hydrogen fed into a fuel cell stack that produces electricity to power the vehicle. A fuel cell is used in combination with an electric motor in a similar drivetrain to battery electric vehicles – quietly, powerfully, and cleanly. Most automakers have placed demonstration fuel cell vehicles with customers, and several plan to introduce fuel cell vehicles to the commercial market around 2015. Transit agencies have been operating fuel cell buses and are moving to next-generation technology. Customers have been fueling at private and fleet demonstration stations. A retail-ready network of refueling stations is starting to emerge in California. Figure 11 shows the fleet population by technology, resulting from the assumed sales in Figure 10. In addition to a change in vehicle technology, there are also assumed changes in energy mix and efficiency gains. In this future zero-emission sales scenario, a complete transition from gasoline and diesel fueled vehicles towards vehicles fueled by hydrogen or electricity is assumed. There is also a drop in overall energy use due to
South Coast Passenger Vehicle Population
(zero emission scenario)
Figure 11

PUBLIC REVIEW DRAFT JUNE 27, 2012
19
increased engine efficiencies (and an assumed improvement in transportation system efficiency resulting in less VMT growth). The zero emission scenario’s technology, energy, and efficiency assumptions meet both the long-term air quality and greenhouse gas goals in 2050. In addition, the scenario also achieves the necessary technology, energy, and efficiency mixes to meet the NOx emission targets for the 0.08 ppm and 0.075 ppm ozone standards but not by the SIP deadlines. The technology mixes that would achieve the targets are not reached until 10 years or more past the deadline. The scenario’s corresponding NOx emissions are shown in Figure 12.
This zero emission scenario demonstrates that while a transition to the same advanced technologies and energy can meet both federal air quality standards and California’s climate goals4, the transformation needs to be greatly accelerated to meet the federal air quality standards on time. Concept 2. Early Action
Acceleration of the pace of transformation to meet federal air quality standard deadlines, with early actions to develop and deploy zero- and near-zero
technologies also needed to meet climate goals.
4 It is also possible to develop scenarios that meet just the State’s climate goals and not its air quality
goals and vice versa.
Figure 12
South Coast Passenger Vehicle NOx Emissions
(zero emission scenario)
San Joaquin Valley Passenger Vehicle NOx Emissions
(zero emission scenario)

PUBLIC REVIEW DRAFT JUNE 27, 2012
20
The passenger vehicle scenario showed that a mix of technologies, fuels, and efficiencies can meet the State’s multi-pollutant goals. However, it also showed that the pace of transformation with normal vehicle replacement rates is too slow to meet federal deadlines. The same is true in other sectors as well. Figure 13 shows a truck scenario fleet profile by technology type. (This truck scenario itself is described in the next section on the need for cleaner combustion.) Figure 14 shows the corresponding NOx emissions. Just as for passenger vehicles, the truck scenario does yield technology, energy,
and efficiency mixes that achieve the NOx emissions to meet the federal standards, but much later than the federal deadlines. The rate of technology transition and the years the scenarios meet the emissions targets is a function of two factors. The first is the assumed fraction of new vehicles offered for sale with advanced technologies. In this truck scenario, the sales assumptions are ambitious. For example, for trucks about 60 percent of heavy, heavy-duty and 75 percent of medium heavy-duty of the on-road truck fleet are zero emission by 2050. The second factor governing when the targets are reached is the vehicle turn-over rate, the rate at which new vehicles enter the fleet and old vehicles leave the fleet. The scenario truck turnover rates are based on historical California data. No assumptions about accelerated turnover were included in the scenarios. To increase the penetration of advanced technologies into the operating fleets and achieve the federal standards sooner requires early actions to accelerate turnover. Further, that turnover must be more aggressive than for a strategy to meet greenhouse gas goals alone.
South Coast Heavy Duty Trucks NOx Emissions (advanced technology scenario)
Figure 14
South Coast Heavy Duty Truck Population
(advanced technology scenario)
Figure 13

PUBLIC REVIEW DRAFT JUNE 27, 2012
21
Concept 3. Cleaner Combustion
Advanced technology NOx emissions standards for on- and off-road heavy-duty engines beyond the cleanest available today to meet federal air quality
standards in a timely manner. The truck scenario also indicates a likely need for cleaner conventional combustion in parallel with a long-term transformation of the fleet to advanced technologies. The truck scenario starts with the situation today where conventional vehicles make up nearly all sales in the heavy-duty truck fleet today. Since both diesel and natural gas engines can meet the cleanest 2010 truck standards, conventional sales can be either technology in the scenario. In the longer-term, to meet the greenhouse gas targets, any combustion-based heavy-duty trucks would rely predominantly on efficiency and renewable and biofuel solutions. However, to achieve the air quality standards in the South Coast, a technology transition to zero- and near-zero emission trucks (e.g., electric, fuel cell, or hybrid with all electric range) to reduce NOx emissions is also needed. Figure 15 shows the technology transformation assumed in the scenario for heavy-duty trucks that operate solely in California. Additional assumptions were developed for trucks that operate interstate and for medium heavy-duty trucks. Truck sales are assumed to begin to shift away from conventional technology toward hybrids, battery electric engines for certain applications and hydrogen fuel cell engines by the early 2020s. The nature of the technology transformations is similar to the passenger vehicle sector, albeit on a larger scale. However, for heavy-duty trucks, a fraction of the plug-in hybrid electric trucks were assumed to operate with a catenary electric connection, reducing the on-board battery requirements. Much like hybrid passenger vehicles, hybrid diesel-electric trucks (hybrids) combine a diesel engine with a battery and electric motor to offer the range and refueling capabilities of a conventional diesel engine, while providing improved fuel economy and lower emissions. Hybrids are assumed to act as transition technologies providing significant emission reductions, but in this scenario their sales peak and begin to taper off as zero emission fuel cell and battery electric vehicle sales grow after 2030.
In-state Sales of Heavy Duty Trucks
(advanced technology scenario)
Figure 15

PUBLIC REVIEW DRAFT JUNE 27, 2012
22
In the long term, to meet the NOx target, hydrogen fuel cell trucks are assumed to dominate the market for the long haul, heaviest uses and battery electric engines used for shorter haul trips. Fuel cell vehicles are better suited for longer distances than battery electric vehicles, and can be used on larger platforms. However, they rely on a hydrogen infrastructure that is only beginning to emerge in California. Battery electric trucks could run entirely on battery packs that are charged when the vehicle is plugged into the grid, via regenerative braking, or possibly using an on-board hydrogen fuel cell. In other options, battery electric trucks could receive power from an external power source in the roadway, such as an overhead catenary system or through electromagnetic induction from a contact-less power system embedded in the roadway. The assumed penetration of advanced technologies is slower in the truck scenario than in the passenger vehicle scenario for two reasons. First, the useful life of a truck is longer. But more importantly, advanced technologies are assumed to take longer to penetrate the out-of-state truck fleet. In this scenario, for trucks that operate only in California, conventional technology sales are assumed to end in 2040. But sales of conventional combustion technology for interstate trucks are assumed to still be approximately 25 percent of total national sales in 2025. As a result, even with aggressive technology development, there are still many trucks assumed to be operating in California in 2050 using conventional combustion technology. In the South Coast, the number is nearly 40,000 trucks in 2050. While all of these trucks would meet the current cleanest standard of 0.2 g/bhp-hr, their total NOx emissions would still be substantial. These vehicles are assumed to be using renewable fuels, which will reduce greenhouse gas emissions; however, the combustion of any fuel will continue to generate tailpipe NOx emissions. With this scenario, the truck sector would not meet the 2023 SIP air quality target until after 2040 and not reach the 2035 target even by 2050 with the current cleanest NOx standard. Additional actions will be needed to deploy zero- and near-zero emission trucks and accelerated turnover to the cleanest combustion-based trucks. To further reduce NOx emissions from conventional combustion technologies, a cleaner NOx standard resulting in new trucks being at least 80 percent lower-emitting than today’s new trucks was added to the scenario starting in 2025. The resulting fleet mix is shown in Figure 16 and the total upstream and downstream emissions compared to the scenario without the cleaner standard is shown in Figure 17. The assumed cleaner standard reduces
Figure 16
San Joaquin Valley Heavy Duty Truck Population
(advanced technology scenario)

PUBLIC REVIEW DRAFT JUNE 27, 2012
23
NOx emissions by a factor of two in the long-term and provides important benefits in the 2032 timeframe for the 0.075 ppm federal ozone standard. The results of a similar scenario for off-road equipment indicate that without cleaner engines beyond the current Tier 4 emissions standards, this category will not achieve the 2023 and 2032 targets. Federal emission standards for criteria pollutants from new, off-road diesel engines have been in place for more than a decade, using a tier system based on engine size and model year that becomes increasingly more stringent over time. Plug-in electric vehicles are used widely in some off-road applications today such as airport ground support equipment and industrial vehicles such as forklifts. As an interim technology for this scenario a majority of the vehicles in these categories would become plug-in electric models, which would increase the number of electric vehicles in the off-road fleet to up to 30 percent by 2025.
Another important technology would be diesel-electric hybrid engines that already exist for excavators, dozers, and loaders, and are slowly beginning to penetrate the off-road market. This scenario includes penetration of hybrid vehicles starting in 2020, with 2050 levels reaching close to 50 percent of the off-road fleet. Beginning in the 2025 timeframe, hydrogen fuel cell off-road vehicles (currently an emerging technology) would begin to enter the market in the construction, mining, and industrial sectors reaching a maximum penetration in 2050 around 10 percent.
To help reduce NOx emissions by the levels necessary to meet federal ozone standards, in addition to wide deployment of electric and alternative fuel off-road vehicles, a new, lower NOx standard of at least 60 percent below the current, cleanest technology today was assumed beginning in the 2025. While the assumption of an 80 percent lower standard was made for trucks, off-road engines pose greater technical challenges so an assumption of 60 percent was made for these vehicles. Engines that meet this new NOx standard would be used in off-road applications where it could be impractical or infeasible to use electric or other alternatively fueled off-road vehicles, such as in some remote locations.
South Coast Off-road NOx Emissions
(advanced technology scenario)
Figure 18
San Joaquin Valley Heavy Duty Truck NOX Emissions With and Without New NOX Standard
Figure 17

PUBLIC REVIEW DRAFT JUNE 27, 2012
24
Finally, while there appears to be a need for cleaner combustion technologies, particularly for trucks, efforts need to be made to explore whether equivalent or earlier emission reductions could be achieved through expedited development and deployment of zero- and near-zero emission technologies where feasible. Such ―leap frogging‖ would, if feasible, be desirable from the standpoint of reducing the number of needed technological transitions. Concept 4. Multiple Strategies
A combination of strategies — technology, energy, and efficiency — applied to each sector.
The truck sector was analyzed in more detail to look at the relative impact of single strategies to help understand if individual strategies or narrower groups of strategies would be needed to meet the multi-pollutant goals. These analyses provide the
individual impact in 2050 of each technology, fuels, and efficiency change applied separately as shown in Figure 19. The starting point for Figure 19 is the BAU scenario, which includes adopted air quality and greenhouse gas reduction programs. Between now and 2050, BAU will achieve approximately 50 percent of the emission reductions needed to meet the long-term NOx goals. In contrast, for greenhouse gases, the programs in place today will not offset the growth in the sector and future truck emissions will increase without additional actions.
South Coast Planning for GHG and Criteria Reductions
Heavy Duty Truck Example (2050)
Figure 19

PUBLIC REVIEW DRAFT JUNE 27, 2012
25
Figure 19 shows the incremental impact of individual approaches compared to business-as-usual. Each bar represents an individual strategy. The left, green part of the bar represents the greenhouse gas benefits of the strategy. The right, yellow
portion is the corresponding NOx benefit. In the figure, a bar that reaches 100 percent on the left or right achieves either the greenhouse gas or NOx reduction targets respectively. For example, relying only on a transition to advanced technologies will take both greenhouse gases and NOx emissions about 70 percent of the way from business-as-usual levels to the target emissions levels. None of the strategies applied individually achieve 100 percent of the needed reductions so no single approach is able to meet the State’s multi-pollutants goals. Combinations of strategies were evaluated as well. Because, the strategies overlap in terms of the emissions being reduced, the benefits of the individual approaches in shown in Figure 19 are not additive. For example, increased fuel economy means less greenhouse gas emissions per mile driven. When that approach is combined with an assumption about fewer miles driven, the incremental benefits of the increased fuel economy are reduced. Table 1, shows the reductions achieved from smaller groups of strategies. None meet the overall targets for trucks. In order to achieve all the reductions needed, all five strategies are necessary. In addition to showing that a combination of strategies is needed, the results in Figure 19 also illustrate that an effective mix of technology, energy, and efficiency strategies can ultimately achieve both air quality and climate goals. With one exception, all of the approaches — advanced technologies, operational efficiency gains, renewable fuels, and more fuel-efficient engines — reduce both greenhouse gas and smog-forming
Table 1

PUBLIC REVIEW DRAFT JUNE 27, 2012
26
emissions. The one exception is the assumed cleaner NOx standard that may be necessary to clean-up the combustion technology that remains even with aggressive penetration of zero- and near-zero technologies. Concept 5. Federal Action
Federal actions, in addition to actions by state and local agencies and governments, to help clean-up sources that travel nationally and internationally
such as trucks, ships, locomotives and aircraft. At the State and local levels, actions such as the 1998 Locomotive Memorandum of Understanding, the San Pedro Bay Ports incentives for marine vessel speed reduction, and low sulfur fuel requirements for commercial ships have led to further emission reductions to meet air quality standards. However, new federal actions will be needed given the scale of transformation needed to meet the State’s multi-pollutant goals, the pace dictated by the federal air quality deadlines. While California has taken many steps to reduce emissions from a broad range of sources, it is important that the federal Government take aggressive action to help further progress, particularly for sources that travel nationally and/or internationally such as trucks, ships locomotives and planes. Looking first at trucks, there are about a half a million out-of-state trucks that operate annually in California contributing more than 30 percent of the total heavy heavy-duty truck vehicle miles traveled in the state. In the truck scenario, even cleaner conventional engines start entering the fleet in 2025. At the same time, the scenario assumes that additional advanced technologies will enter the fleet as well. This is necessary both for trucks that operate solely in California and trucks that operate interstate. Because of the shared authority and the large number of interstate trucks in California, parallel federal action is needed as California pursues new technologies and tighter engine standards. Even though California is taking steps to clean up the locomotive fleet operating in
California, the locomotive scenario contemplates another round of national emission standards for locomotives to support California’s independent efforts. Figure 20 shows a locomotive scenario that assumes accelerated introduction of Tier 4 engines beginning in 2015 and resulting in an average statewide 50 percent of the fleet meeting Tier 4 or cleaner (i.e. hybrid or other external source of power) levels by 2025. Acceleration of deployment of Tier 4 locomotives beyond this assumption is technologically feasible. The 2012 South
South Coast Locomotive Energy by Engine Type
(accelerated Tier 4 scenario)
Figure 20

PUBLIC REVIEW DRAFT JUNE 27, 2012
27
Coast Air Quality Management Plan is expected to propose that 95 percent of locomotives operating in the South Coast be Tier 4 by 2023 or an alternative locomotive strategy to achieve equivalent reductions. Currently, locomotive engines are exclusively conventional diesel engines. Manufacturers are required to produce diesel-electric locomotives meeting U.S. EPA’s Tier 4 NOx emission standards by 2015. These locomotives will emit 90 percent less than an uncontrolled locomotive, and represent a 76 percent NOx and 85 percent PM reduction from the Tier 2 emission levels currently being achieved in the South Coast. However, an 80 percent reduction in total fleet emissions by 2023, compared to 2010 fleet emissions, would be needed to meet the SIP target. Use of additional technologies, and acceleration of Tier 4 deployment, offer the opportunity for additional reductions. To get closer to SIP targets for NOx, a new federal Tier 5 emission standard was assumed with deployment starting in 2025 that would introduce hybrid diesel-electric locomotive technology with 75 percent lower NOx emissions from the Tier 4 levels statewide. This may require U.S. EPA action because ARB is generally preempted from setting new locomotive emission standards under the Clean Air Act. The air agencies intend to evaluate whether accelerated deployment of zero or near zero emission locomotives could achieve equivalent or greater emission reductions than new Tier 5 standards. One way that lower emissions could be achieved would be through various technologies to achieve zero-emission track miles between 2023 and 2050. These could include, for example, the use of battery tender cars to provide electricity to existing locomotive traction motors, without operation of on-board diesel-powered generators within nonattainment areas; battery hybrid locomotives with all electric range; the use of wayside power such as overhead catenary to allow locomotives to operate in zero-emission mode with power coming from the electric grid within nonattainment areas; or, potentially, linear synchronous motor technology within such areas. The emission impacts of this combined Tier 5, zero and near zero scenario are shown in Figure 21 for the South Coast.
South Coast Combined NOx Results for Rail and Aviation
Figure 21

PUBLIC REVIEW DRAFT JUNE 27, 2012
28
In the aviation scenario, advanced technologies include lighter weight aircraft, more efficient external fan engines, and operational changes or flight paths that consume less fuel. Most industry observers expect modest gains from these technologies. A more carbon neutral fuel appears to be far more promising than improvements to aircraft in the near or mid-term. Several aircraft have been flown successfully on bio-based fuels and the U.S. military is actively working toward extensive use of biofuels for national security reasons. U.S. EPA has adopted a range of standards over the past few years in conjunction with the International Civil Aviation Organization’s (ICAO) Committee on Aviation Environmental Protection (CAEP) to reduce smog-forming emissions. More central to this scenario, is the recently launched Federal Aviation Administration Continuous Lower Energy, Emissions, and Noise (CLEEN) program to achieve ambitious NOx emission reductions from new aircraft. The precise technologies have yet to be identified, but NOx and greenhouse gas emission reductions are increasingly targeted between 2015 and 2035. Figure 22 shows the introduction of the three levels of emission reductions envisioned in the CLEEN program over the international standard recently adopted by U.S. EPA. CLEEN +1 refers to NOx reductions of an additional 60 percent between 2015 and 2018; CLEEN +2 refers to reductions of 75 percent for new engines in the 2020 to 2025 timeframe; and CLEEN +3 envisions reductions of greater than 75 percent in the 2030 to 2035 time period. Concept 6. Efficiency Gains
Greater system and operational efficiencies to mitigate the impacts of growth, especially in high-growth freight transport sectors and vehicle efficiency gains
to reduce fuel usage and mitigate the cost of new technologies. The assumed penetration of advanced technologies in the passenger vehicle and truck sectors is able to offset the impacts of growth and eventually meet the multi-pollutant targets. However, in other sectors, the more limited options for technology transformation are not able to offset growth impacts. While operations improvements and engine efficiency improvements are part of all the sector scenarios, efficiency improvements are especially critical in these high-growth sectors. For example, commercial ship activity is projected to grow at a rate of 5.5 percent each year through
Statewide Aircraft Energy Consumption by Technology
Figure 22

PUBLIC REVIEW DRAFT JUNE 27, 2012
29
2050. This growth is expected to easily overwhelm the emission reductions achieved by fuel use changes and conversion to shore electric power. Further complicating scenario development for these sectors is the uncertainty in long-term forecasts. While the growth in these sectors is expected to be large, forecasting growth out to 2050 is difficult. To illustrate the potential impacts of efficiency gains or less growth overall, the scenarios for commercial shipping, harbor craft, and cargo handling equipment all included a sensitivity assumption of reducing activity (as opposed to throughput) growth to 3.5 percent per year. The results of this assumption along with technology penetration are shown in Figure 23. In terms of technology changes, today, commercial ship engines are dominated by conventional diesel engines that use cleaner low-sulfur marine fuel within 24 nautical miles of the California coastline and islands. Fuel sulfur levels continue to decline in distillate fuels and are expected to continue to decline in the future. Container ships, refrigerated cargo ships, and passenger ship fleets visiting California’s ports are required to use electric shore power for their auxiliary engines that operate while the ship is at berth; and by 2020, the affected fleets must use shore power for at least 80 percent of their visits and must reduce their emissions by 80 percent while in port. In the future, the commercial ship scenario assumes all new engines meet the North American ECA Tier III NOx standard of 3.4 g/kWh beginning in 2015. Incentive programs at California ports are assumed to result in an additional 30 percent of the remaining vessels visiting California meeting the more stringent Tier III NOx standards. By 2050, nearly 100 percent of the visiting fleet in California is assumed to be Tier III engines with dirtier ship engines replaced by cleaner, Tier III engines, and all ships operating while at berth in California ports are assumed to use electric shore power. As with control assumptions for other source categories, it would be technologically feasible to accelerate full implementation of Tier III and shorepower technologies to earlier dates than assumed in the modeled scenarios. The scenarios for commercial harbor craft and cargo handling equipment are similar since their usage is tied to commercial ship use and will necessitate operational efficiencies to achieve significant emission reductions. Fortunately, commercial harbor craft and cargo handling equipment are also candidates for advanced technologies similar to some of the other categories. For example, battery electric power could be
Commercial Ships, Harbor Craft and Cargo Handling Equipment NOx Scenario
Figure 23

PUBLIC REVIEW DRAFT JUNE 27, 2012
30
used in smaller vessels that travel shorter distances in the safety of a harbor and applications of hybrid technology and shore power can also be used for commercial harbor craft. All-electric yard trucks are currently being produced and tested at the Ports of Los Angeles and Long Beach. They are performing well in large warehouse situations. Small and medium size forklifts are also available in electric versions. Several electric technologies are currently available for rubber tire gantry (RTG) cranes. New electric RTG cranes are available for purchase and technologies are available to electrify in-use cranes. Diesel-electric hybrid RTG cranes are currently being tested at some ports. These systems are being combined with a newer engine that is smaller horsepower than the original engine. Additionally, propane and liquefied natural gas engines have been used in a wide variety of applications. As a compliance option, some cargo handling equipment owners and operators have chosen to replace their diesel yard trucks and forklifts with new versions that have propane engines. Concept 7. Energy Transformation Transformation of the upstream energy sector and its greenhouse gas and smog forming emissions concurrent with the transformation to advanced technologies
downstream. The technology scenarios for each of the mobile sectors work in tandem with transformation of the energy sector.5 The assumed energy scenario reflects the circumstances of today where nearly all transportation fuel is gasoline and diesel derived from petroleum. By 2050, this scenario assumes conventional fuels are fully replaced with alternatives largely relying on renewable sources. Energy for the transportation sector is assumed to move away from a near-complete reliance on one energy source (petroleum) to a portfolio of multiple fuels. Within a fuel type, various feedstocks are used depending on local resources and needs. It is assumed a renewable gasoline drop-in biofuel is commercialized by 2020 and ethanol is phased out.
5 The Vision for Clean Air fuel and electricity energy assumptions draws from previously published
studies. Some of these studies include California’s Energy Future (CCST), A California 80in50 Study (UC Davis), and California Electricity Sector in 2050 (UC Berkeley, Lawrence Berkeley National Laboratory, E3). .
Figure 24
Statewide Energy Consumption Scenario

PUBLIC REVIEW DRAFT JUNE 27, 2012
31
Figure 24 shows the total combined fuel usage assumed by type for all the sectors in Vision for Clean Air. Fuel energy feedstocks are an input assumption. However, fuel usage is an output of the analysis based on fleet efficiency and activity assumptions. Even though total vehicle populations grow, efficiency and activity changes offset the growth and total demand drops. Engine efficiency gains are achieved both through fuel economy improvements in internal combustion engines, but also as a switch to electric drive (both battery and fuel cell systems) which is inherently much more efficient than combustion engines. The rate of activity growth is assumed to slow somewhat through operational improvements, such as better land use planning and logistical advancements. Such a transition by 2050 will require dramatic growth in alternative fuel and renewable electricity production facilities, as well as transmission and distribution installations. As an example, the feedstock assumptions for diesel are shown in Figure 25. By 2050, in these scenarios, fully 100 percent of diesel fuel is assumed to be renewable, predominantly with a mix of forest woody sources and municipal solid waste (MSW) sources (diversion from landfills and industrial facilities). Facilities that produce renewable fuel from municipal solid waste are expected to locate near large urban areas. Conversely, facilities that produce renewable fuel from agricultural waste or forest waste would be expected to locate in rural areas. This is important because when evaluating criteria emissions from upstream fuel production stages, the impact of facility location in nonattainment areas needs to be considered. Specifically, new alternative fuel production facilities will create new NOx emission sources and their emissions need to be taken into account. For Vision for Clean Air, it was assumed that one-half of all upstream NOx emissions from energy production to meet the transportation-related energy demand in a region occur within that region. Over time, for the Vision for Clean Air scenarios much of the transportation sector becomes electrified and California’s electric grid capacity grows. At the same time, to meet climate targets the majority of electric grid supply will need to be decarbonized with a large expansion in either renewables or fossil-based with carbon capture and storage (CCS). Figure 26 shows the assumed change in supply sources for the electric grid. Renewable fuels are the dominant source of near-zero carbon supply assumed in 2050; however, alternate scenarios were modeled that use CCS with either coal or natural gas (not shown here). A future grid with large amounts of renewable fuels also
Diesel Fuel Blend and Feedstocks Assumption
Figure 25

PUBLIC REVIEW DRAFT JUNE 27, 2012
32
requires a zero-emission ―load balancing‖ technology, such as electricity storage, to manage the variable generation characteristics of renewable supply. The electricity grid would need to grow substantially to handle the shift in transportation energy from liquid fuels to electricity. By 2050, transportation electricity demand in this analysis is anticipated to be 61.5 GWh, which is equivalent to 21 percent of today’s California grid (one fifth of the 2010 total generation). It is difficult to predict how this would impact the future grid installed capacity given changes expected in stationary use efficiencies, as well as excess night time capacity for electric vehicle charging. To address the future needs of the electricity system and its impacts, the Air Resources Board, California Energy Commission (CEC), California Public Utility Commission, and California Independent System Operator have formed interagency working groups at both principal and staff levels. These groups have worked together on a number of complex issues; including the South Coast energy needs assessment, the greenhouse gas cap-and-trade system, the CEC’s Integrated Energy Policy Report, long-term procurement planning, transmission planning, and the South Coast Air Quality Management District’s energy policy guiding their Air Quality Management Plan. Electricity generation capacity growth will need to occur at the same time as all electricity generation is becoming cleaner. One study[6] projects a California electric grid that meets the statewide greenhouse gas target with large amounts of electrification in transportation and other sectors, will be twice as large as today’s total grid generation (approximately 600,000 GWh versus 290,000 GWh). This study modeled all sectors, not just transportation, and relied more heavily on electricity compared to hydrogen for mobile applications. Given that the grid needs to become cleaner at the same time, the E3/UCB study’s scenario represents about 10 renewable electricity installations every year between now and 2050, capable of producing 500 megawatts each. There are many fuel choices available, and this scenario only highlights a few. There are large uncertainties as to which energy sources will be cost effective, have low emissions, and be available in large quantities. For example, fossil fuel carbon capture and sequestration and algae based biofuels are two examples. To support a large shift
[6]
Williams, J.H., et al, ―The Technology Path to Deep Greenhouse Gas Emissions Cuts by 2050: The Pivotal Role of Electricity,‖ Science, 1208365, November 24, 2011 (E3, UCB, LBNL)
Electricity Supply Sources/Capacity Growth
Figure 26

PUBLIC REVIEW DRAFT JUNE 27, 2012
33
to sustainable, renewable liquid fuels in cars, trucks, and aircraft, California would need approximately five billion gallons of these biofuels by 2035. Some of this biofuel production may come from outside of California. Nevertheless, under this scenario California’s production of needed biofuels would represent a dramatic shift over the next 20+ years, given there are only about a dozen biofuel facilities today in California.

PUBLIC REVIEW DRAFT JUNE 27, 2012
34
Conclusion and Next Steps California can be successful in meeting air quality and climate goals with a coordinated effort to accelerate the transition to transformational technologies, cleaner energy, and greater system efficiencies. The scale of the transformation needed, as the scenarios illustrate, is very large. To reach the State’s multi-pollutant goals, zero- and near-zero emission technologies must become the norm. Fuels and electrical energy from renewable sources must dominate and efficiency gains are needed to mitigate the impacts of growth. To achieve these goals, collaborative efforts by a wide range of public agencies and private stakeholders will be essential. Government planning for transportation, energy, air quality, and climate must be coordinated to maximize co-benefits from individual investments. An example of coordinated planning is the 2012 update to the Regional Transportation Plan adopted by the Southern California Association of Governments, which includes actions to develop a zero- and near-zero emission freight transport system, including needed infrastructure. While the challenges are substantial, history has shown that, through concerted actions, real technological transformations can occur in timeframes similar to those we now face. In many cases, these transformations have accelerated deployment of low emission vehicles – some using non-traditional fuels -- earlier than required by regulatory programs. Some examples from the South Coast region: San Pedro Bay Ports Clean Trucks Program In 2006, the Ports of Los Angeles and Long Beach adopted a Clean Air Action Plan, which included a measure requiring transition of all of the thousands of drayage trucks serving the Ports to trucks meeting 2007 exhaust emissions standards. Through requirements and innovative incentive programs, the goal was met ahead of schedule. In conjunction with this program, the ports deployed hundreds of LNG trucks. The ports have also adopted incentives to spur use of cleaner Tier 2 and Tier 3 ocean-going vessels, and created a Technology Advancement Program to advance cleaner engine technologies including zero-emission technologies, among many other emission control actions. Transit Agencies Transition to Alternative Fuel Vehicles The Los Angeles County Metropolitan Transportation Authority, Riverside County Transit Authority, and Sunline Transit, three of the major transit agencies in the South Coast Air District, converted all of their transit buses to run on compressed natural gas (CNG) over the last 10 years. In addition, they have participated in research projects that have broadened the use of CNG in larger transit bus applications and have demonstrated cleaner natural gas engines using hydrogen-natural gas blends. Today, the Los Angeles County Metropolitan Transportation Authority operates over 2,000 natural gas transit buses.
PUBLIC REVIEW DRAFT JUNE 27, 2012
35
Alternative Fuel for Waste Hauling and Other Services Waste Management, one of the largest waste collection operators, started using natural gas refuse collection vehicles in the late 1990s and now has over 1,000 natural gas waste collection vehicles in their fleet. The company also sponsored development of a process to produce liquefied natural gas from landfill gas, resulting in a transportation fuel with one of the lowest carbon intensities. In addition, many local governments have adopted policies to use cleaner vehicles (e.g. Riverside, Santa Monica, Long Beach, Pasadena, and Los Angeles); some local governments have required that alternative fueled vehicles be used for waste collection services, and the Colton School District has converted all of its older diesel school buses to natural gas. Zero-Emission Transit Buses Foothill Transit has deployed battery powered transit buses with quick charging at route ends to allow virtually continuous service. In addition, Sunline Transit in Southern California’s Coachella Valley, was one of the first transit agencies to demonstrate a fuel cell transit bus. As part of this effort, Sunline constructed a hydrogen refueling station that serves the fuel cell bus and provides public access. 1998 Railroad Memorandum of Understanding The 1998 Railroad Memorandum of Understanding (MOU) called for a fleet-wide Tier 2 average locomotives to be operating in the South Coast Air Basin by 2010. The MOU has led to the development of cleaner locomotive technologies in order for the Class I railroads operating in the South Coast Air Basin to meet the fleet-wide average. These are just a few examples of actions that go beyond regulatory requirements and have led to deployment of substantial numbers of vehicles using non-traditional fuels and advanced technologies. To facilitate such actions needed to meet future air quality standards and climate goals, the pace of advanced zero- and near-zero technology development must be accelerated. Actions and timeline identified for each of the key emissions sectors are described below and in the Appendix to this document. SIP measures for upcoming air quality plans will build on these concepts following consideration through the public process. Next Steps Vision for Clean Air is just a first step toward more integrated air quality and climate planning and program development. Most importantly, all air quality and climate program and plan development going forward must be viewed through a multi-pollutant lens to support coordinated policy decisions. More specifically, research and technical efforts are needed to strengthen the analytical tools and to provide more robust data for future analyses. Vision for Clean Air is technology focused so issues of cost, environmental impacts, and broader feasibility must be further considered in future
PUBLIC REVIEW DRAFT JUNE 27, 2012
36
analyses and plans. Finally, early actions, many already underway, to develop, demonstrate, and deploy advanced technologies and fuels must continue and expand. Statewide Planning and Program Implementation ARB will be developing a Climate Change Scoping Plan update in 2013. Among other issues the Scoping Plan update will need to tackle the issue of energy and fuel transformations from a multi-pollutant perspective. Freight transport planning will be another focus in 2013. From an air quality perspective, freight transport planning will need to consider both NOx reductions regionally and particulate matter locally to reduce public exposure to diesel particulates. Operational and mode changes to improve efficiencies to mitigate adverse climate and air quality impacts that can come from economic growth will be important as well. In all of these plans, prioritization of strategies will be important. The Vision for Clean Air scenarios illustrated that an effective mix of technology, energy, and efficiency strategies is needed achieve both air quality and climate goals. There are a variety of technologies, cleaner energy, and efficiency strategies than can be used for each sector and analyses and planning is needed to evaluate the trade-offs among the various choices. Trucks offer a good example of what work is needed going forward. The truck scenario indicated that a combination of advanced technologies, cleaner conventional standards, efficiency improvements, and cleaner fuels is needed. The development of policies, regulations, and programs to implement these types of strategies will need to be prioritized based on many factors including technology readiness, economics, infrastructure requirements, funding availability, emissions reduction potential, and other factors. In the immediate future, reauthorization of current incentive programs is an important part of maintaining existing efforts to accelerate deployment of advanced technologies. The current Moyer, AB 923, and AB118 programs fund the type of projects needed for technology and fuel transformation. Those programs are set to sunset and must be reauthorized by the California Legislature if they are to continue to fund the type of projects that the Vision for Clean Air analyses show is needed for California to meet its multi-pollutant, air quality and climate goals. To aid these efforts, academic, public agency, and private sector actions are needed to expand the knowledge and analytical capability needed to effectively coordinate air quality and climate programs. Future areas of study could include:
Better quantification of California-specific criteria emissions from fuel production pathways including both future fuel production facilities and transport stages.
Analysis of the geographic distribution of fuel production facilities and how upstream fuel pathway emissions affect ―in-basin‖ emission inventories.

PUBLIC REVIEW DRAFT JUNE 27, 2012
37
The technological feasibility and limits for cleaner medium- and heavy-duty vehicle technologies.
Better understanding of which portions of the medium-duty and heavy-duty vehicle sector are best suited to particular forms of cleaner conventional technologies, zero- and near zero emission vehicles, and low-carbon fuels.
The feasibility of biomethane/renewable natural gas (RNG) as a large scale, low-carbon substitute.
Understanding of the types of operational efficiencies and mode shift options applicable to California’s freight movement system including an understanding of the economic impacts in the context of its operation within the larger national system.
Analysis of the broad cost, availability, and emission tradeoffs between either a heavy reliance on renewable liquid fuel solutions versus a switch to electric/fuel cell powertrains to meet greenhouse gas targets.
At what time and under what conditions are the following likely to be deployed on a large scale:
Commercial advanced low-carbon biofuel facilities (biochemical and thermochemical)
Battery and fuel applications for medium-duty and heavy-duty vehicles
Carbon capture and sequestration
Renewable natural gas for pipeline injection
Analysis of how future electric grid power facilities will be operated on a daily and seasonal profile based on future changes in average load patterns (e.g. vehicle charging at night, air conditioning, etc.) and the emission profiles of these future patterns.
SIP Development SCAQMD, SJVAPCD, and ARB are currently developing SIPs for the 24-hour federal fine particulate matter standard. Those SIPs are due at the end of 2012 and the attainment deadline is no later than 2019. While the impacts of the technology transformation assumed in the Vision for Clean Air scenarios are most significant well after that, early actions to transform to advanced technologies can provide incremental reductions in the 2019 timeframe. Earlier this month, SCAQMD released a preliminary draft set of early actions for mobile sources as part of its current SIP development efforts. Those draft early actions are intended to increase the penetration of advanced technologies into the operating fleets. SCAQMD draft early actions are arranged into three groups. Two of them, one for on-road sources and one for off-road sources, are primarily the continuation of already-
PUBLIC REVIEW DRAFT JUNE 27, 2012
38
successful incentive program to deploy the cleanest, most-advanced technologies available today. The third group is generally focused on technologies and applications requiring additional development, feasibility studies and other planning, and identification of funding sources before moving further ahead on implementation. The draft SCAQMD early actions draw upon the key concepts of the Vision for Clean Air and will be refined through the SIP development process. SIPs for the 0.075 ppb ozone standard will be due in 2015. These SIPs account for the Vision for Clean Air mid-term 2035 goal. As this analysis points out, the type and scale of transformation illustrated with these scenarios will be central to achieving that standard. Consequently, those plans will need to address the broader issues of technical and economic feasibility and environmental impacts. More importantly, those plans will need to include specific measures for actions to deploy advanced technologies, fuels, and achieve efficiency gains in light of the keys for coordinated planning identified in this report. The results of Vision for Clean Air demonstrate the need for accelerated development and deployment of cleaner engines and zero- and near-zero emission technologies to meet federal air quality deadlines and will serve as an input to the subsequent SIP process. One of the initial steps in SIP development is to identify potential emissions reductions by source category and outline specific actions to achieve those reductions. The next section illustrates how that can be done. Actions for Development, Demonstration and Deployment of Needed Cleaner Engine and Zero- and Near-Zero Emission Technologies Through the public SIP and other related planning processes, the actions and timeframe to bring about cleaner combustion engine and zero- and near-zero emission technologies can be refined. The overall efforts must be a collaboration among the ARB, South Coast Air Quality Management District, San Joaquin Valley Air Pollution Control District, other local air districts, federal government agencies, automobile and engine manufacturers, advanced mobile source technology providers, and other stakeholders. Initial actions include research and development of cleaner engine technologies and zero-emission technologies. In some sectors such as light-duty vehicles, zero-emission technologies are maturing at a rapid rate. However, in other sectors, additional research and development are needed. Typical steps would be laboratory research and development, and field demonstrated for performance. After the demonstration phase, the technologies would be commercialized. As the advanced technologies go through the various phases of development, associated infrastructure needs must be addressed. For some zero-emission technologies to be deployed, infrastructure development is critical. Actions needed for such infrastructure needs must be identified in the timelines. In addition, positive market signals must be made to provide engine manufacturers and advanced control technology developers reasons to justify the additional financial
PUBLIC REVIEW DRAFT JUNE 27, 2012
39
resources needed for the advanced technologies. Such market signals would be a combination of regulatory actions and incentives. As such, funding assistance for research and demonstration must be secured in the near-term. In the longer-term, sustained public funding assistance and other incentives must be identified and implemented. A timeline to develop mechanisms to secure such funding must be developed for each sector. As advanced technologies are commercialized, additional mechanisms must be implemented to accelerate deployment of cleaner engines and zero- and zero-emission technologies. Many of these mechanisms exist today and can be continued and expanded where needed to ensure that all opportunities to accelerate deployment are implemented. The Appendix to this document illustrates these types of actions and the timeframe relative to:
Passenger Transportation o Light- and Medium-Duty Vehicles o Transit/School Buses o Passenger Locomotives o Aircraft
Freight Movement o Heavy-Duty Trucks o Freight Locomotives o Cargo Handling Equipment o Commercial Harbor Craft o Commercial Ocean-Going Vessels
Off-Road Vehicles and Equipment o Construction Vehicles o Industrial Equipment
Agricultural Equipment With Vision for Clean Air having illustrated the needed technology and energy transformation, development of actions and timeframes is the appropriate focus of subsequent SIP development along with companion analyses related to economic and other environmental effects. The South Coast Air Quality Management District and San Joaquin Valley Air Pollution Control District are in the process of developing new SIPs for the 24-hour PM2.5 standard and to update current ozone SIPs. In 2015, both air districts are required to develop SIPs showing that the 0.075 ppm ozone standard will be met by 2032. The 2012 ozone SIP update for the South Coast is expected to include early actions to help accelerate the introduction of cleaner technologies needed

PUBLIC REVIEW DRAFT JUNE 27, 2012
40
for 2023 attainment. By 2015, significant progress is expected to be made on the demonstration and commercialization of advanced technologies need for both 2023 and 2032 federal ozone attainment deadlines. Over the next several years, technology assessments and decisions on the most appropriate strategies will be done as part of the SIP planning process. Vision for Clean Air establishes a framework for the actions needed to enable both regions to develop the specific strategies need to meet the ozone attainment deadline of 2023.

PUBLIC REVIEW DRAFT JUNE 27, 2012
41
The contents of this Appendix are available in a separate electronic file.
Public Review Draft June 27, 2012
Vision for Clean Air: A Framework for Air Quality and Climate Planning
Appendix: Actions for Development, Demonstration, and Deployment of Needed
Advanced Technologies
This document has been prepared by the staffs of the California Air Resources Board,
the South Coast Air Quality Management District and the San Joaquin Valley Unified Air Pollution Control District. Publication does not signify that the contents reflect the views
and policies of the Air Resources Board, the South Coast Air Quality Management District or the San Joaquin Valley Unified Air Pollution Control District. This document will be presented as an informational item at a noticed public meeting scheduled for
June 28, 2012.