Embed Size (px)
Citation preview

INVITED REVIEW
Vision and cricketDavid Regan
Department of Psychology, York University, Toronto, Canada
Citation information: Regan D. Vision and cricket. Ophthalmic Physiol Opt 2012, 32, 257–270. doi: 10.1111/j.1475-1313.2012.00909.x
Keywords: cricket, motion in depth,
spatiotemporal prediction, time to collision
Correspondence: David Regan
E-mail address: [email protected]
Received: 14 January 2012; Accepted: 13
March 2012
Abstract
This review discusses the hypothesis that hitting a cricket ball depends on pre-
dicting the instant that the ball will be located in the volume of space within
which it can be successfully hit, and that this prediction is based on retinal
image correlates of the direction of motion in depth and the time to collision
(or time to passage). The performance of top cricket players allows an estima-
tion of their accuracy in this spatio-temporal prediction. The bowler challenges
the batsman’s skill by (1) causing the ball to change direction in flight and/or
after bouncing and (2) causing linked variations in the speed and trajectory of
the ball. I suggest that the linked variations of speed and trajectory exploit a
visual inadequacy of the batsman, namely poor sensitivity to the instantaneous
absolute distance and speed of the ball. Two alternative hypothese are also dis-
cussed, one based on eye movements, the other based on continuous coupling
between perception and action.
The accuracy of predicting the instant at whichthe ball will arrive at the location where it is tobe hit
From the early 1950s to the early 1960s I was a very
enthusiastic cricketer, and from time to time played
against accomplished batsmen. The superiority of their
batting skills was very evident. One reason was that they
seemed to have more time to play the ball than I did. It
almost seemed that they could see a fraction of a second
into the future. This being a seemingly supernatural
explanation I remained baffled. But starting in the early
1970s my research colleagues and I started to gather evi-
dence that retinal image information exists that, in princi-
ple, could allow batsmen to predict when the ball will
arrive in the region of space where it is to be hit and, as
discussed below, develop the ability to translate this
when/where prediction into motor action. This article dis-
cusses the experimental evidence for this when/where
hypothesis, and compares that hypothesis with two alter-
native hypotheses. Finally I discuss how bowlers attempt
to exploit a batsman’s visual weaknesses so as to achieve
his downfall.
The question whether a batsman can visually detect a
given deviation in the trajectory of the ball become irrele-
vant at some instant during the flight of the ball. After
that instant the batsman’s finite reaction time and the
inertia of the bat preclude any significant modification to
the stroke. We and others have suggested that the reac-
tion time for modifying a highly-practiced movement that
is already in progress might be shorter than 230 ms,1 i.e.
less than the laboratory estimates for the reaction time to
an unpredicted event.2 Our argument was based on the
many instances such as, for example, McCabe’s innings of
187 not out facing the ‘bodyline’ bowling of Larwood and
Voce at Sydney in 1932,3,4 where the batsman has repeat-
edly and successfully hit the fastest and most dangerous
bowlers in the World while wearing no head protection.
The laws of cricket still allow occasional use of the tac-
tic of high-speed deliveries aimed at the batsman’s head
or body, and not until the late 1970s was it socially
acceptable to wear any head protection other than the
negligible protection offered by a soft cap. The fast bow-
ler’s intent is to provoke errors by taxing the speed and
accuracy of the batsman’s reactions, while challenging his
determination and nerve. To add to the batsman’s prob-
lems the two halves of the ball’s leather cover are joined
by prominent external stiching that forms a raised seam,
and by aligning the ball’s raised seam asymmetrically with
respect to the ball’s direction of motion, many fast and
medium-paced bowlers cause the ball to swerve while in
the air. The complex aerodynamics that undrlies this kind
Ophthalmic & Physiological Optics ISSN 0275-5408
Ophthalmic & Physiological Optics 32 (2012) 257–270 ª 2012 The College of Optometrists 257
of ‘swing’ bowling has been analysed both mathemati-
cally, and experimentally including the use of wind tun-
nels.5–10 The title of a book written by a captain of the
England team is telling: ‘I Don’t Bruise Easily’.11
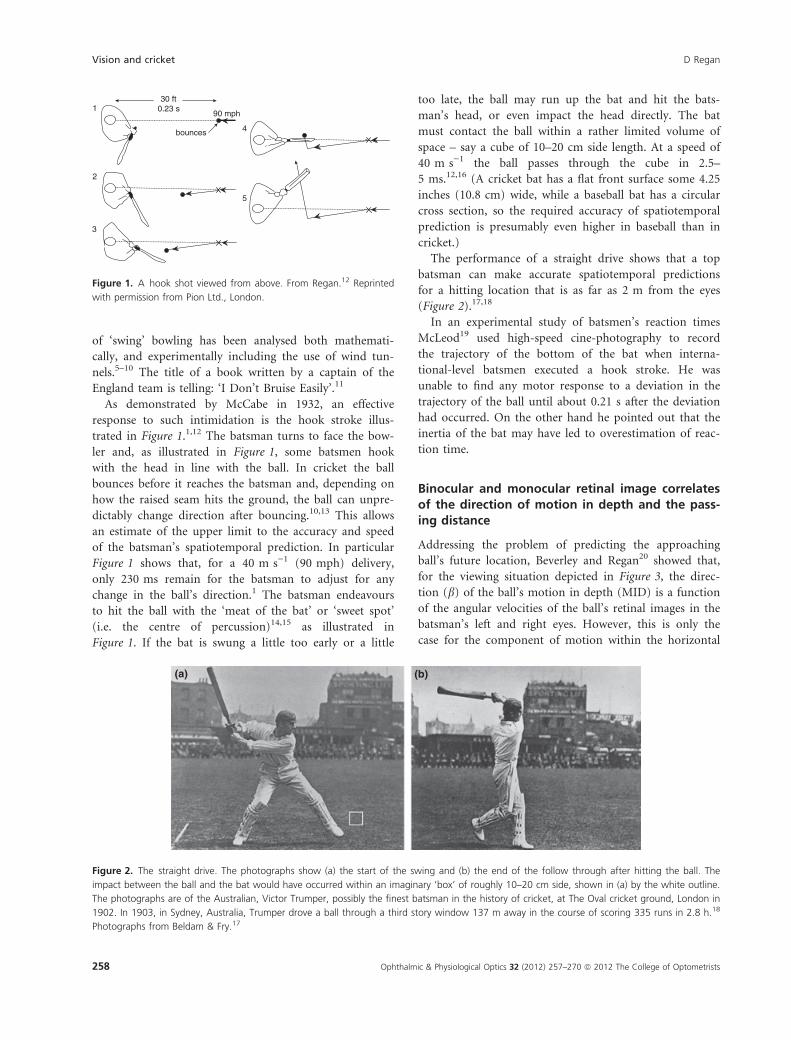
As demonstrated by McCabe in 1932, an effective
response to such intimidation is the hook stroke illus-
trated in Figure 1.1,12 The batsman turns to face the bow-
ler and, as illustrated in Figure 1, some batsmen hook
with the head in line with the ball. In cricket the ball
bounces before it reaches the batsman and, depending on
how the raised seam hits the ground, the ball can unpre-
dictably change direction after bouncing.10,13 This allows
an estimate of the upper limit to the accuracy and speed
of the batsman’s spatiotemporal prediction. In particular
Figure 1 shows that, for a 40 m s)1 (90 mph) delivery,
only 230 ms remain for the batsman to adjust for any
change in the ball’s direction.1 The batsman endeavours
to hit the ball with the ‘meat of the bat’ or ‘sweet spot’
(i.e. the centre of percussion)14,15 as illustrated in
Figure 1. If the bat is swung a little too early or a little
too late, the ball may run up the bat and hit the bats-
man’s head, or even impact the head directly. The bat
must contact the ball within a rather limited volume of
space – say a cube of 10–20 cm side length. At a speed of
40 m s)1 the ball passes through the cube in 2.5–
5 ms.12,16 (A cricket bat has a flat front surface some 4.25
inches (10.8 cm) wide, while a baseball bat has a circular
cross section, so the required accuracy of spatiotemporal
prediction is presumably even higher in baseball than in
cricket.)
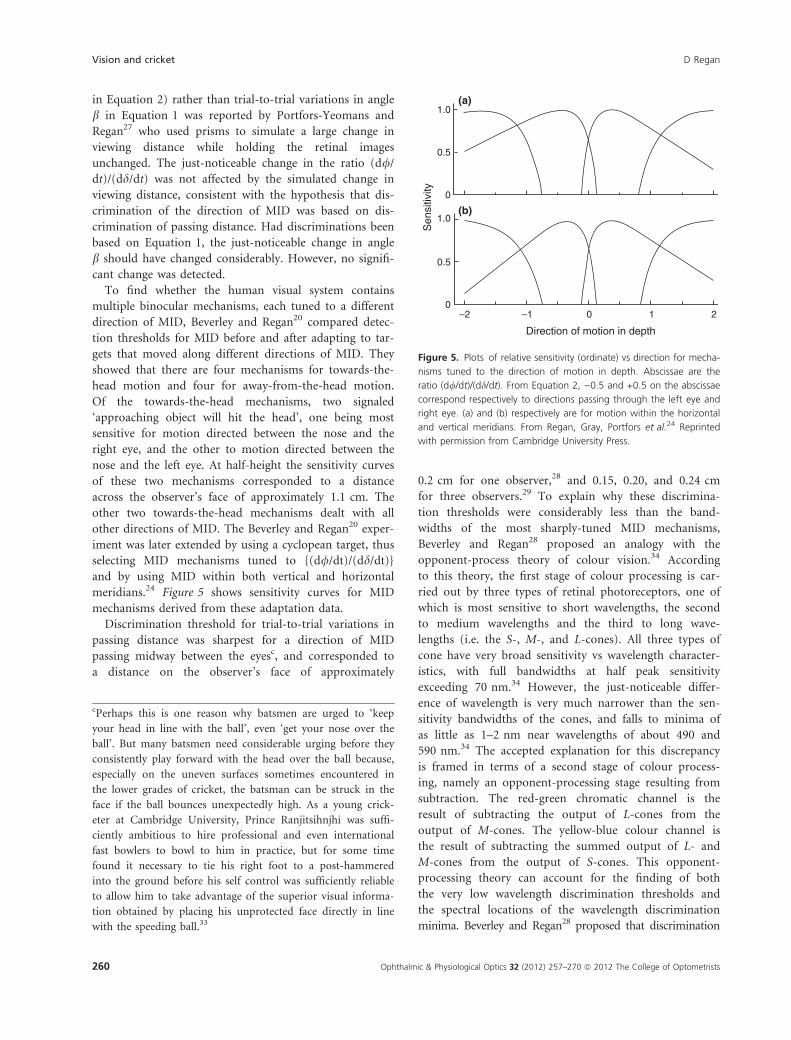
The performance of a straight drive shows that a top
batsman can make accurate spatiotemporal predictions
for a hitting location that is as far as 2 m from the eyes
(Figure 2).17,18
In an experimental study of batsmen’s reaction times
McLeod19 used high-speed cine-photography to record
the trajectory of the bottom of the bat when interna-
tional-level batsmen executed a hook stroke. He was
unable to find any motor response to a deviation in the
trajectory of the ball until about 0.21 s after the deviation
had occurred. On the other hand he pointed out that the
inertia of the bat may have led to overestimation of reac-
tion time.
Binocular and monocular retinal image correlatesof the direction of motion in depth and the pass-ing distance
Addressing the problem of predicting the approaching
ball’s future location, Beverley and Regan20 showed that,
for the viewing situation depicted in Figure 3, the direc-
tion (b) of the ball’s motion in depth (MID) is a function
of the angular velocities of the ball’s retinal images in the
batsman’s left and right eyes. However, this is only the
case for the component of motion within the horizontal
30 ft0.23 s
90 mph
bounces 4
5
3
2
1
Figure 1. A hook shot viewed from above. From Regan.12 Reprinted
with permission from Pion Ltd., London.
(a) (b)
Figure 2. The straight drive. The photographs show (a) the start of the swing and (b) the end of the follow through after hitting the ball. The
impact between the ball and the bat would have occurred within an imaginary ‘box’ of roughly 10–20 cm side, shown in (a) by the white outline.
The photographs are of the Australian, Victor Trumper, possibly the finest batsman in the history of cricket, at The Oval cricket ground, London in
1902. In 1903, in Sydney, Australia, Trumper drove a ball through a third story window 137 m away in the course of scoring 335 runs in 2.8 h.18
Photographs from Beldam & Fry.17
Vision and cricket D Regan
258 Ophthalmic & Physiological Optics 32 (2012) 257–270 ª 2012 The College of Optometrists

meridian21 (see Figure 4a), and does not distinguish
between directions e, f, g and h in Figure 4ba. In contrast,
Equation 1 is valid for motion within both the horizontal
and the vertical meridians (and any other meridian).
tan b ¼ fIðd/=dtÞ=Dðdd=dtÞg ð1Þ
Where d//dt is the angular velocity of the ball’s binocu-
larly-fused retinal image and dd/dt is the rate of change
of the ball’s horizontal relative disparity and D>>I.22
(Note: A rate of change of absolute disparity does not
produce a sensation of of motion in depth23.)
From Equation 1 we have
L ¼ Iðd/=dtÞ=ðdd=dtÞ ð2Þ
where L, the passing distance, is the distance between C in
Figure 3 and the point of arrival of the ball in the vertical
plane containing the eyes.24,25
Laboratory evidence discussed below supports the con-
clusion that, when predicting the ball’s future location,
observers use binocular information to discriminate trial-
to-trial variations of L (Equation 2) rather than trial-to-
trial variations of angle b (Equation 1).
Although not distinguishing between discriminations of
angle b or of L, direct evidence that observers can utilize
either Equation 1 or Equation 2 was provided by the
finding that observers can discriminate trial-to-trial varia-
tions of the direction of MID for a cyclopean target.26,27
Further evidence is that discrimination thresholds for the
direction of MID are closely similar for motion within
the vertical and horizontal meridians (Figure 4a,b) for
both cyclopean and monocularly-visible targetsb.27,29
Evidence that, when discriminating trial-to-trial varia-
tions in the direction of MID, observers are actually dis-
criminating trial-to-trial variations in passing distance (L
Figure 3. Binocular information about the direction of motion in
depth. A point object located at A is moving at constant speed in the
direction indicated by the arrow. A stationary object is located at
point B. The disparity of A relative to B is d. (Note: A rate of change
of the approaching object’s absolute disparity does not produce a
sensation of motion in depth.23) Point C is midway between the left
eye (LE) and right eye (RE), and I is the interpupillary separation. From
Regan.26 Reprinted with permission from Elsevier.
a
b c
d
e
f
g
h
(a) (b)
Figure 4. Motion in depth contained within the horizontal and verti-
cal meridians. (a) Different directions of motion in depth contained
within the horizontal meridian. (b) Different directions of motion in
depth contained within the vertical meridian. From Portfors-Yeomans
CV & Regan.27 Reprinted with permission from Elsevier.
aThe term ‘meridian’ means the angular orientation of a great
circle of the eye containing the line of sight. For brevity, the
coplanar great circle of the left and right eyes will be called the
‘horizontal meridian’ and the perpendicular meridian the ‘ver-
tical meridian’.21
bSeveral previous papers were written with the assumption that
judgments of the direction of MID were based on a function
of the velocities of the ball’s retinal images in the left and right
eyes, and that the visual system is insensitive to the direction
of MID within the vertical meridian (e.g. Ref.12). In the early
1970s static stereopsis was fairly well understood, and neurons
that were tuned to static disparity had been identified. But the
static disparity mechanism seemed to be too sluggish to allow
for a rate of change of static disparity to explain the rapid pro-
cessing of the direction of MID of an approaching ball demon-
strated by batsmen in their predictions of the ball’s future
location. Our proposed explanation was that the direction of
MID is computed directly from the horizontal velocities of the
ball’s two retinal images rather than being derived from the
prior sluggish computation of relative disparity.1,20,28 As dis-
cussed above, it was found – much later – that this assump-
tion was erroneous.27,29 As well, although ‘blindness’ to
binocular MID that spares sensitivity to relative horizontal dis-
parity is not uncommon,30–32 I have been unable to find any
report of ‘blindness’ to static disparity that spares sensitivity to
binocular MID. In hindsight, our failure to carry out experi-
ments in the 1970s on discrimination thresholds for the direc-
tion of MID within the vertical meridian is regrettable.
D Regan Vision and cricket
Ophthalmic & Physiological Optics 32 (2012) 257–270 ª 2012 The College of Optometrists 259
in Equation 2) rather than trial-to-trial variations in angle
b in Equation 1 was reported by Portfors-Yeomans and
Regan27 who used prisms to simulate a large change in
viewing distance while holding the retinal images
unchanged. The just-noticeable change in the ratio (d//
dt)/(dd/dt) was not affected by the simulated change in
viewing distance, consistent with the hypothesis that dis-
crimination of the direction of MID was based on dis-
crimination of passing distance. Had discriminations been
based on Equation 1, the just-noticeable change in angle
b should have changed considerably. However, no signifi-
cant change was detected.
To find whether the human visual system contains
multiple binocular mechanisms, each tuned to a different
direction of MID, Beverley and Regan20 compared detec-
tion thresholds for MID before and after adapting to tar-
gets that moved along different directions of MID. They
showed that there are four mechanisms for towards-the-
head motion and four for away-from-the-head motion.
Of the towards-the-head mechanisms, two signaled
‘approaching object will hit the head’, one being most
sensitive for motion directed between the nose and the
right eye, and the other to motion directed between the
nose and the left eye. At half-height the sensitivity curves
of these two mechanisms corresponded to a distance
across the observer’s face of approximately 1.1 cm. The
other two towards-the-head mechanisms dealt with all
other directions of MID. The Beverley and Regan20 exper-
iment was later extended by using a cyclopean target, thus
selecting MID mechanisms tuned to {(d//dt)/(dd/dt)}
and by using MID within both vertical and horizontal
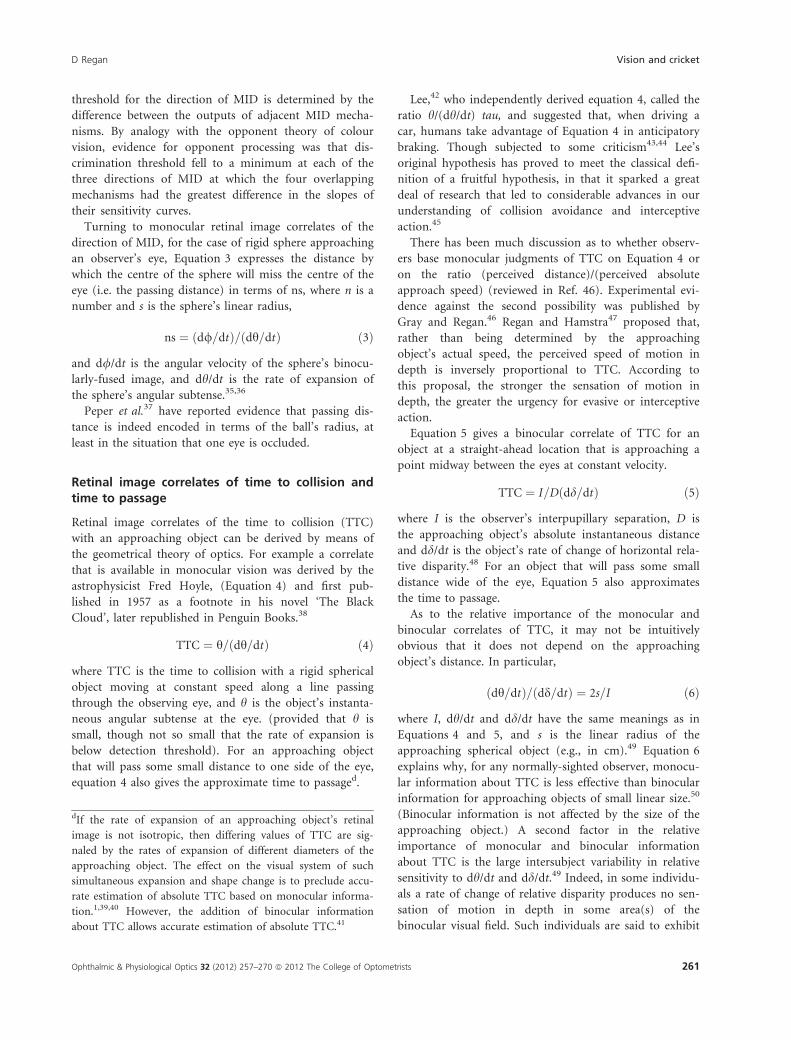
meridians.24 Figure 5 shows sensitivity curves for MID
mechanisms derived from these adaptation data.
Discrimination threshold for trial-to-trial variations in
passing distance was sharpest for a direction of MID
passing midway between the eyesc, and corresponded to
a distance on the observer’s face of approximately
0.2 cm for one observer,28 and 0.15, 0.20, and 0.24 cm
for three observers.29 To explain why these discrimina-
tion thresholds were considerably less than the band-
widths of the most sharply-tuned MID mechanisms,
Beverley and Regan28 proposed an analogy with the
opponent-process theory of colour vision.34 According
to this theory, the first stage of colour processing is car-
ried out by three types of retinal photoreceptors, one of
which is most sensitive to short wavelengths, the second
to medium wavelengths and the third to long wave-
lengths (i.e. the S-, M-, and L-cones). All three types of
cone have very broad sensitivity vs wavelength character-
istics, with full bandwidths at half peak sensitivity
exceeding 70 nm.34 However, the just-noticeable differ-
ence of wavelength is very much narrower than the sen-
sitivity bandwidths of the cones, and falls to minima of
as little as 1–2 nm near wavelengths of about 490 and
590 nm.34 The accepted explanation for this discrepancy
is framed in terms of a second stage of colour process-
ing, namely an opponent-processing stage resulting from
subtraction. The red-green chromatic channel is the
result of subtracting the output of L-cones from the
output of M-cones. The yellow-blue colour channel is
the result of subtracting the summed output of L- and
M-cones from the output of S-cones. This opponent-
processing theory can account for the finding of both
the very low wavelength discrimination thresholds and
the spectral locations of the wavelength discrimination
minima. Beverley and Regan28 proposed that discrimination
1.0(a)
(b)
0.5
0
1.0
0.5
0–2 –1 0 1 2
Sen
sitiv
ity
Direction of motion in depth
Figure 5. Plots of relative sensitivity (ordinate) vs direction for mecha-
nisms tuned to the direction of motion in depth. Abscissae are the
ratio (d//dt)/(dd/dt). From Equation 2, )0.5 and +0.5 on the abscissae
correspond respectively to directions passing through the left eye and
right eye. (a) and (b) respectively are for motion within the horizontal
and vertical meridians. From Regan, Gray, Portfors et al.24 Reprinted
with permission from Cambridge University Press.
cPerhaps this is one reason why batsmen are urged to ‘keep
your head in line with the ball’, even ‘get your nose over the
ball’. But many batsmen need considerable urging before they
consistently play forward with the head over the ball because,
especially on the uneven surfaces sometimes encountered in
the lower grades of cricket, the batsman can be struck in the
face if the ball bounces unexpectedly high. As a young crick-
eter at Cambridge University, Prince Ranjitsihnjhi was suffi-
ciently ambitious to hire professional and even international
fast bowlers to bowl to him in practice, but for some time
found it necessary to tie his right foot to a post-hammered
into the ground before his self control was sufficiently reliable
to allow him to take advantage of the superior visual informa-
tion obtained by placing his unprotected face directly in line
with the speeding ball.33
Vision and cricket D Regan
260 Ophthalmic & Physiological Optics 32 (2012) 257–270 ª 2012 The College of Optometrists
threshold for the direction of MID is determined by the
difference between the outputs of adjacent MID mecha-
nisms. By analogy with the opponent theory of colour
vision, evidence for opponent processing was that dis-
crimination threshold fell to a minimum at each of the
three directions of MID at which the four overlapping
mechanisms had the greatest difference in the slopes of
their sensitivity curves.
Turning to monocular retinal image correlates of the
direction of MID, for the case of rigid sphere approaching
an observer’s eye, Equation 3 expresses the distance by
which the centre of the sphere will miss the centre of the
eye (i.e. the passing distance) in terms of ns, where n is a
number and s is the sphere’s linear radius,
ns ¼ ðd/=dtÞ=ðdh=dtÞ ð3Þ
and d//dt is the angular velocity of the sphere’s binocu-
larly-fused image, and dh/dt is the rate of expansion of
the sphere’s angular subtense.35,36
Peper et al.37 have reported evidence that passing dis-
tance is indeed encoded in terms of the ball’s radius, at
least in the situation that one eye is occluded.
Retinal image correlates of time to collision andtime to passage
Retinal image correlates of the time to collision (TTC)
with an approaching object can be derived by means of
the geometrical theory of optics. For example a correlate
that is available in monocular vision was derived by the
astrophysicist Fred Hoyle, (Equation 4) and first pub-
lished in 1957 as a footnote in his novel ‘The Black
Cloud’, later republished in Penguin Books.38
TTC ¼ h=ðdh=dtÞ ð4Þ
where TTC is the time to collision with a rigid spherical
object moving at constant speed along a line passing
through the observing eye, and h is the object’s instanta-
neous angular subtense at the eye. (provided that h is
small, though not so small that the rate of expansion is
below detection threshold). For an approaching object
that will pass some small distance to one side of the eye,
equation 4 also gives the approximate time to passaged.
Lee,42 who independently derived equation 4, called the
ratio h/(dh/dt) tau, and suggested that, when driving a
car, humans take advantage of Equation 4 in anticipatory
braking. Though subjected to some criticism43,44 Lee’s
original hypothesis has proved to meet the classical defi-
nition of a fruitful hypothesis, in that it sparked a great
deal of research that led to considerable advances in our
understanding of collision avoidance and interceptive
action.45
There has been much discussion as to whether observ-
ers base monocular judgments of TTC on Equation 4 or
on the ratio (perceived distance)/(perceived absolute
approach speed) (reviewed in Ref. 46). Experimental evi-
dence against the second possibility was published by
Gray and Regan.46 Regan and Hamstra47 proposed that,
rather than being determined by the approaching
object’s actual speed, the perceived speed of motion in
depth is inversely proportional to TTC. According to
this proposal, the stronger the sensation of motion in
depth, the greater the urgency for evasive or interceptive
action.
Equation 5 gives a binocular correlate of TTC for an
object at a straight-ahead location that is approaching a
point midway between the eyes at constant velocity.
TTC ¼ I=Dðdd=dtÞ ð5Þ
where I is the observer’s interpupillary separation, D is
the approaching object’s absolute instantaneous distance
and dd/dt is the object’s rate of change of horizontal rela-
tive disparity.48 For an object that will pass some small
distance wide of the eye, Equation 5 also approximates
the time to passage.
As to the relative importance of the monocular and
binocular correlates of TTC, it may not be intuitively
obvious that it does not depend on the approaching
object’s distance. In particular,
ðdh=dtÞ=ðdd=dtÞ ¼ 2s=I ð6Þ
where I, dh/dt and dd/dt have the same meanings as in
Equations 4 and 5, and s is the linear radius of the
approaching spherical object (e.g., in cm).49 Equation 6
explains why, for any normally-sighted observer, monocu-
lar information about TTC is less effective than binocular
information for approaching objects of small linear size.50
(Binocular information is not affected by the size of the
approaching object.) A second factor in the relative
importance of monocular and binocular information
about TTC is the large intersubject variability in relative
sensitivity to dh/dt and dd/dt.49 Indeed, in some individu-
als a rate of change of relative disparity produces no sen-
sation of motion in depth in some area(s) of the
binocular visual field. Such individuals are said to exhibit
dIf the rate of expansion of an approaching object’s retinal
image is not isotropic, then differing values of TTC are sig-
naled by the rates of expansion of different diameters of the
approaching object. The effect on the visual system of such
simultaneous expansion and shape change is to preclude accu-
rate estimation of absolute TTC based on monocular informa-
tion.1,39,40 However, the addition of binocular information
about TTC allows accurate estimation of absolute TTC.41
D Regan Vision and cricket
Ophthalmic & Physiological Optics 32 (2012) 257–270 ª 2012 The College of Optometrists 261
stereomotion blindnesse.30–32 In some observers, visual
field areas that are blind to stereomotion can differ for
approaching and receding motion, and for near and far
disparities.32
Many textbooks include a geometrical proof that the
difference in the distances of two points (DD) required to
produce a small constant difference in their relative hori-
zontal disparity (Dd) increases with the square of the
mean distance (D) of the two points. In particular,
Dd ¼ IDD=D2 ð7Þ
where I is the interpupillary separation and D>>DD.
Turning to the perception of MID caused by a rate of
change of disparity, we have from Equation 7
dd=dt ¼ IV=D2 ð8Þ
where dd/dt is the rate of change of relative disparity for
an object at a straight-ahead location that is approaching
the observer at speed V along a line that passes midway
between the eyes. In principle, sensitivity to dd/dt can
extend to further distances than static stereopsis, because
speed is pitted against D2 in Equation 8. From Equa-
tions 4 and 8 we have
dd=dt ¼ I=ðD�TTCÞ ð9Þ
where TTC is time to collision and the velocity of the
approaching object is constant.25 In words: (1) as distance
D increases, the value of dd/dt for an approaching object
will rise above the fixed detection threshold at progres-
sively shorter values of TTC; (2) for any given value of
TTC, the magnitude of the dd/dt signal falls off linearly
with distance.
Equation 5 leaves us with the problem of how the
visual system might encode D (the instantaneous distance
of the approaching object) with sufficient accuracy to
support estimates of TTC based entirely on binocular
information. One hypothesis might be that, when looking
directly at the object, the angle of ocular convergence (I/
D) is used – at least for distances less than a few metres.
This hypothesis, however, is not consistent with the find-
ing that, for a target of constant angular subtense (h), the
effect of large changes of ocular convergence (0–24 prism
dioptres) on the rate of change of binocular disparity
required to cancel the sensation of motion in depth cre-
ated by a fixed oscillation of h was zero for one observer
and only twofold for another observer.49 It is also incon-
sistent with evidence that large changes in vergence do
not change the perceived distance of objects.23,51 A value
for TTC is also given by Equation 10 which, similarly to
Equation 4, does not involve the approaching object’s dis-
tance.
TTC ¼ 2ðdd=dtÞ=ðd2d=dt2Þ ð10Þ
Equation 10 is valid for an object approaching at con-
stant speed from the straight-ahead position along a
straight line that passes midway between the observer’s
eyes, where d is the approaching object’s instantaneous
binocular relative disparity.52 Equation 10 also gives time
to passage for trajectories of small obliquity.
In a laboratory study it was found that, when only
monocular information was available, observers underesti-
mated TTC, and when only binocular information was
available they overestimated TTC, but when both kinds of
information were available observers were more accurate;
absolute error could be as small as 1.3%.50 The experi-
ment just described did not distinguish between an obser-
ver’s use of Equation 5 vs Equation 10, because, as
mentioned earlier, the instantaneous values of dd/dt and
d2d/dt2 were set so as to correspond to an object
approaching at constant linear velocity.
If we assume that a batsman can use visual information
about TTC up to about 230 ms before the ball is hit, a
1.3% error approaches the performance required to
account for the roughly ±2.5 ms accuracy with which a
top batsman can judge the time of arrival of the ball.
However, it is not self-evident that these laboratory find-
ings can be extrapolated to a batsman’s performance. In
particular, from a batsman’s viewpoint the approaching
ball moves simultaneously in the vertical direction, and
possibly sideways also, whereas the simulated approaching
object traveled in a straight line directly towards the
observer’s eyes. Furthermore, a 40 m s)1 (90 mph) deliv-
ery travels the length of a cricket pitch (22 yards) in
0.5 s, and in the laboratory study the shortest TTC was
1.69 s and the shortest presentation duration 0.7 s,
Finally, at 22 yards a cricket ball subtends 0.19�, while the
smallest starting size in the laboratory study was 0.4�.
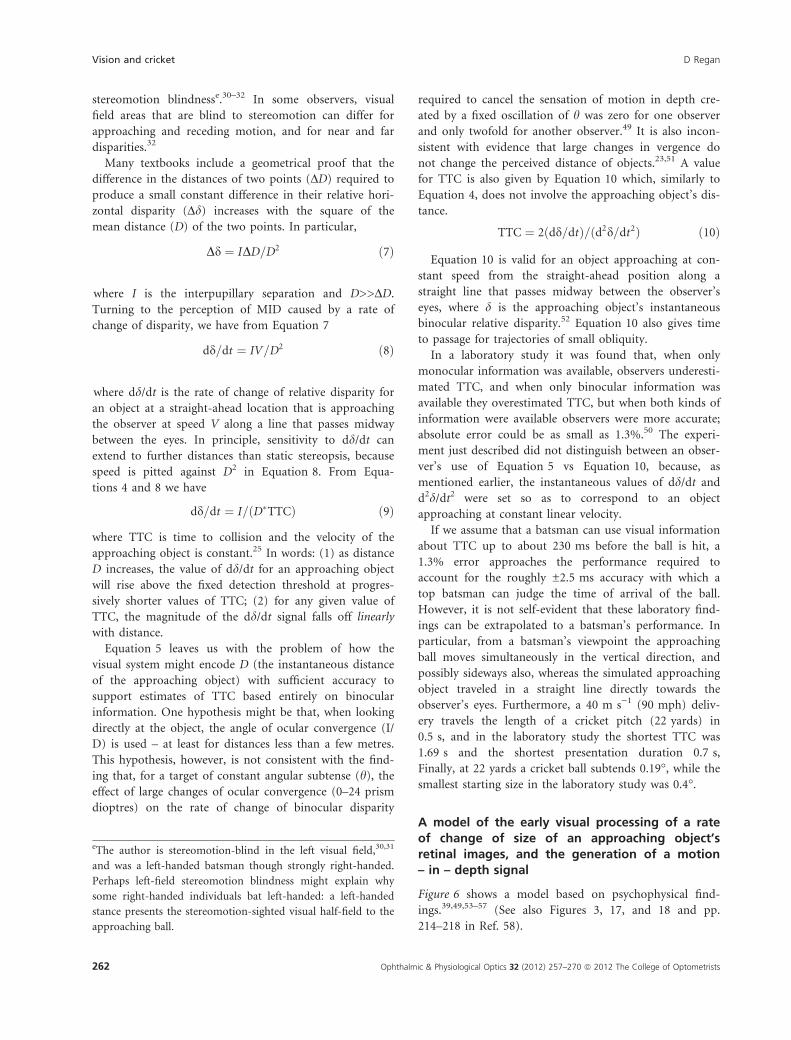
A model of the early visual processing of a rateof change of size of an approaching object’sretinal images, and the generation of a motion– in – depth signal
Figure 6 shows a model based on psychophysical find-
ings.39,49,53–57 (See also Figures 3, 17, and 18 and pp.
214–218 in Ref. 58).
eThe author is stereomotion-blind in the left visual field,30,31
and was a left-handed batsman though strongly right-handed.
Perhaps left-field stereomotion blindness might explain why
some right-handed individuals bat left-handed: a left-handed
stance presents the stereomotion-sighted visual half-field to the
approaching ball.
Vision and cricket D Regan
262 Ophthalmic & Physiological Optics 32 (2012) 257–270 ª 2012 The College of Optometrists

Catching the ball
Cricket’s equivalent of the baseball catcher is called the
wicketkeeper, who, like the catcher, wears padded gloves.
In cricket, however, one or more fielders (called slip field-
ers) stand to one or other side of the wicketkeeper, per-
haps 15 m from the batsman when a fast bowler is
operating. Their role is to catch, with their bare hands,
any ball that has been deflected from the edge of the bat
so as to pass wide of the reach of the wicketkeeper The
key point here is that the ball’s trajectory is not deter-
mined until the instant that the ball leaves the edge of the
bat and, since that event is usually unintentional, the
batsman’s body position gives little, if any, predictive
information, so that the visual cues necessary to catch the
ball do not exist before that instant. When a fast bowler
is in action, the ball’s trajectory after leaving the bat is
almost a straight line and may even be rising: travelling at
36–40 m s)1 (80–90 mph) the ball’s remaining time of
flight may be so short (0.38 s in this case) as to test the
fastest reflexes. The most dramatic catches are made when
the rapidly moving ball passes wide of the slip fielder
who completes the catch with his entire body off the
ground in a horizontal position. The demands facing the
slip fielder are highlighted by the fact that, even at inter-
national level, there is a wide gulf between the great slip
fielders and everyone else. Equation 2 indicates where (in
units of I, the interpupillary separation) a catcher’s hand
should be placed to intercept a ball passing over, under
or to the side of the head.
Peper et al.37 investigated one-handed catching perfor-
mance with a real ball rather than a simulated one. Flight
time was 1.6 s, They concluded that their catchers did
not use retinal image information to predict when the ball
would arrive in the region of space where it is to be
caught, even though such information was available.
Rather, their catchers exploited a relation between visual
information and the required movement, i.e. there was a
continuous coupling between perception and action. In
particular, the catcher guided the velocity of the moving
hand in such a way that it was in the right place at the
right time. According to this hypothesis the ‘right place’
is not known until the hand arrives there. It is not clear,
however, that this analysis would apply to the case of slip
catches made off a fast bowler, as the flight time used in
their experiment (1.6 s) was considerably longer than the
approximately 0.38 s flight time from bat to slip fielder
when a fast bowler is in action.
Catching a high lofted ball in both cricket and base-
ball poses quite different problems from those facing a
slip fielder. The catcher may have to run up to 30 m. It
has been proposed that this kind of catch is also
LMRM
a
b
c
d
k1 (a–b)
k2 (c–d)
Rate ofchange ofdisparity
RM
LM
LM
LMMID
Changing-size
Motionin depth
Signal
Changing-size
Signal
Signal
Figure 6. Schematic of the early visual processing of changing-size, changing-disparity and of the encoding of time to collision with an
approaching object. The dashed line depicts the boundaries of a solid untextured rectangular retinal image. LM: Filters that respond to local
motion along the arrowed line. Their outputs (a, b, c, d) assume a magnitude that is linearly proportional to local speed, and a sign that corre-
sponds to the direction of motion. RM: One-dimensional filters whose outputs signal the speed and sign (i e., expansion vs contraction) of relative
motion along some retinal meridian. MID: Motion in depth stage, comprising a two-dimensional nonlinear filter that is most efficiently excited by
expansion of the retinal image when the expansion is isotropic i.e. provided that (in the case of vertical and horizontal meridians) the same time
to collision is signaled by the rates of expansion of the stimulus rectangle’s horizontal and vertical dimensions, i.e. k1 (a–b) = k2 (c–d), where k1 is
inversely proportional to the height of the retinal image and k2 is inversely proportional to its width. The amplitude of the output of the MID
stage is inversely proportional to the time to collision. If the equality does not hold (nonisotropic expansion) the output of the MID stage does not
reliably signal time to collision.41 The MID stage also receives input from a filter whose output is a function of the rate of change of retinal dispar-
ity. From Gray & Regan.41 Reprinted with permission from Elsevier.
D Regan Vision and cricket
Ophthalmic & Physiological Optics 32 (2012) 257–270 ª 2012 The College of Optometrists 263
achieved by a continuous coupling between perception
and action.Visual cues available to the outfielder and
which might, in principle, be used in practice have been
detailed in a number of theoretical and simulation stud-
ies.59–62 Chapman59 suggested that fielders run along a
path that cancels the acceleration of the ball’s retinal
image. Two limitations of Chapman’s analysis are that it
assumed a parabolic trajectory, and that it required the
fielder to run at constant speed. However, even if rhe
ball’s trajectory deviates somewhat from the parabolic
curve that it would follow in a vacuum, the general
strategy can still work because it is essentially an error-
nulling feedback strategy, in which the changes in the
fielder’s running are driven by the departure of optical
acceleration from zero. Following related lines of
thought, cues that are in practice used by accomplished
outfielders have been investigated in experimental field
studies.63–65
Absolute accuracy of when/where prediction
An assumption in the when/where prediction hypothesis
is that visual perception is accurate. It seems, however,
that this is not necessarily always the case. For example,
estimates of the absolute direction of MID obtained with-
out feedback using a psychophysical technique (button
pressing) showed systematic errors.66 Even with feedback
as to correctness, errors in the perceived direction of
MID remained uncorrected when the observer’s response
was a button-press. But when button pressing was
replaced by a catching task, and feedback was provided,
the absolute accuracy soon improved with practice. This
finding implies that learning was taking place within the
motor system rather than in the perceptual representation
of the direction of MID.
How important is binocular information abouttime to collision and the direction of motion indepth?
Using high speed photography, Alderson et al.67 found
that, when catching a ball with one hand, the temporal
organization of finger flexions occurred only after the ball
was closer than 1.8 m from the hand. These finger flex-
ions are necessary if the ball is to be retained in the
catcher’s grip. They were disrupted when the lights were
switched off 275 ms before the ball arrived. In an intrigu-
ing study, Banister and Blackburn68 ranked 258 Cam-
bridge undergraduates into ‘poor’ and ‘good’ categories
according to their ability at ball games, and found that
the individuals who were ranked ‘good’ had a larger aver-
age interpupillary separation than those who were ranked
‘poor’.
On the other hand it is not necessarily the case that
skilled eye-limb coordination is disrupted when vision in
one eye is lost, even in adulthood. The late Nawab of Pat-
audi was the captain of the Indian cricket team and
scored many centuries in first class and international
cricket before experiencing severe loss of vision in his
right eye as well as double vision following a car accident
in 1961. He found it necessary to counter the double
vision by using the peak of his cap to occlude his right
eye, and continued playing at international level, scoring
many more centuries, and signing off as captain of India
in 1975 by leading his team to victory in two Test
Matches against Clive Lloyd’s very strong West Indies
team.69 It is not clear why (other than some possibly
increased difficulty with slow bowlers) his batting perfor-
mance was so little affected by the loss of binocular
vision. One possible explanation is that there is a very
large intersubject variation in relative sensitivity to chang-
ing-size and changing-disparity49 and the Nawab may
have been much more sensitive to changing-size than to
changing-disparity before his accident.
Colin Milburn, an England international batsman lost
the sight of his left eye in a car accident in 1969. In 1973
and 1974 he returned to first class (County) cricket, but
Wisden found him ‘sadly diminished’-though he did
make 670 runs at an average of 17.2.70 The Nawab of Pat-
audi and Colin Milburn were both right-handed batsmen,
so that losing vision in the left eye might affect perfor-
mance more than losing the use of the right eye. On the
other hand, vision in Milburn’s right eye was also report-
edly affected by his accident.70
Independent visual processing of different kindsof visual information
It has been proposed that the various kinds of visual
information that are important for visually-guided motor
action are processed approximately independently of one
another and approximately independently of all other
kinds of visual information.1,71–73 If the visual system is
organized functionally in this way we can understand
why, once learned, a skill of eye-limb coordination, such
as hitting or catching a ball, transfers readily from one
visual environment to another. A corollary to this
hypothesis is that the degree to which a key kind of infor-
mation is processed independently of other visual infor-
mation would assume greater importance in a complex
visual environment than in a simple one, and might
determine individual differences in task performance in
field conditions such as, for example, piloting high-per-
formance jet aircraft.74,75
Next I describe psychophysical methods for testing
whether a given neural mechanism obeys the ‘independent
Vision and cricket D Regan
264 Ophthalmic & Physiological Optics 32 (2012) 257–270 ª 2012 The College of Optometrists
processing’ requirement. One technique is to render the
visual variables of interest orthogonal within the entire
stimulus set.47 To illustrate this technique consider binoc-
ular information about MID. Players of ballgames who
use Equation 2 to predict the future location of the ball
must be able to process the ratio (d//dt)/(dd/dt) inde-
pendently of simultaneous variations in d//dt and dd/dt.
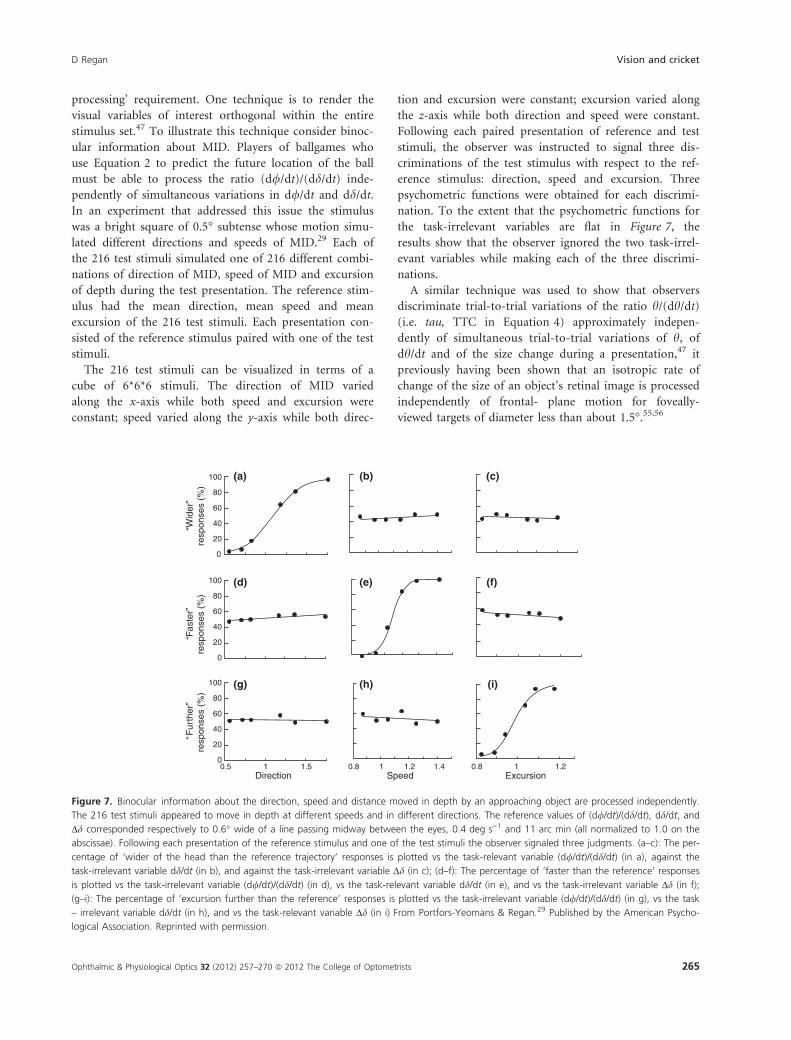
In an experiment that addressed this issue the stimulus
was a bright square of 0.5� subtense whose motion simu-
lated different directions and speeds of MID.29 Each of
the 216 test stimuli simulated one of 216 different combi-
nations of direction of MID, speed of MID and excursion
of depth during the test presentation. The reference stim-
ulus had the mean direction, mean speed and mean
excursion of the 216 test stimuli. Each presentation con-
sisted of the reference stimulus paired with one of the test
stimuli.
The 216 test stimuli can be visualized in terms of a
cube of 6*6*6 stimuli. The direction of MID varied
along the x-axis while both speed and excursion were
constant; speed varied along the y-axis while both direc-
tion and excursion were constant; excursion varied along
the z-axis while both direction and speed were constant.
Following each paired presentation of reference and test
stimuli, the observer was instructed to signal three dis-
criminations of the test stimulus with respect to the ref-
erence stimulus: direction, speed and excursion. Three
psychometric functions were obtained for each discrimi-
nation. To the extent that the psychometric functions for
the task-irrelevant variables are flat in Figure 7, the
results show that the observer ignored the two task-irrel-
evant variables while making each of the three discrimi-
nations.
A similar technique was used to show that observers
discriminate trial-to-trial variations of the ratio h/(dh/dt)
(i.e. tau, TTC in Equation 4) approximately indepen-
dently of simultaneous trial-to-trial variations of h, of
dh/dt and of the size change during a presentation,47 it
previously having been shown that an isotropic rate of
change of the size of an object’s retinal image is processed
independently of frontal- plane motion for foveally-
viewed targets of diameter less than about 1.5�.55,56
100
80
60
40
20
0
(a) (b) (c)
(d) (e) (f)
(g) (h) (i)
“Wid
er”
resp
onse
s (%
)“F
aste
r”re
spon
ses
(%)
“Fur
ther
”re
spon
ses
(%)
100
80
60
40
20
0
100
80
60
40
20
00.5 1 1.5 0.8 1 1.2 0.8 1 1.21.4
Direction Speed Excursion
Figure 7. Binocular information about the direction, speed and distance moved in depth by an approaching object are processed independently.
The 216 test stimuli appeared to move in depth at different speeds and in different directions. The reference values of (d//dt)/(dd/dt), dd/dt, and
Dd corresponded respectively to 0.6� wide of a line passing midway between the eyes, 0.4 deg s)1 and 11 arc min (all normalized to 1.0 on the
abscissae). Following each presentation of the reference stimulus and one of the test stimuli the observer signaled three judgments. (a–c): The per-
centage of ‘wider of the head than the reference trajectory’ responses is plotted vs the task-relevant variable (d//dt)/(dd/dt) (in a), against the
task-irrelevant variable dd/dt (in b), and against the task-irrelevant variable Dd (in c); (d–f): The percentage of ‘faster than the reference’ responses
is plotted vs the task-irrelevant variable (d//dt)/(dd/dt) (in d), vs the task-relevant variable dd/dt (in e), and vs the task-irrelevant variable Dd (in f);
(g–i): The percentage of ‘excursion further than the reference’ responses is plotted vs the task-irrelevant variable (d//dt)/(dd/dt) (in g), vs the task
– irrelevant variable dd/dt (in h), and vs the task-relevant variable Dd (in i) From Portfors-Yeomans & Regan.29 Published by the American Psycho-
logical Association. Reprinted with permission.
D Regan Vision and cricket
Ophthalmic & Physiological Optics 32 (2012) 257–270 ª 2012 The College of Optometrists 265
Observers were able to discriminate trial-to-trial varia-
tions in the ratio (d//dt)/(dh/dt) (Equation 3) approxi-
mately independently of trial-to-trial variations in d//dt
and dh/dt.36
A variant of this technique not only allows more than
three variables to be conveniently assessed, but can also
show whether the observer ignored trial-to-trial variations
in presentation duration and distance moved when dis-
criminating trial-to-trial variations in speed even though
these three variables cannot be rendered orthogonal
within an entire stimulus set.76
The technique just described can also be used to
quantify the amount of crosstalk between responses to
the task-relevant variable and task-irrelevant variables.
This allows the identification of observers whose visual
systems do not obey the ‘independent processing’
requirement.76
Do elite batsmen have superior vision?
I have argued in this paper that sensitivity to the retinal
image variables that allow a batsman to predict when the
ball will arrive in the region of space where it is to be hit,
and the their rapid encoding, are requisites for top class
batting performance. Certainly, cricket coaches emphasize
that a batsman should ‘keep your eye on the ball’ (so as to
monitor the relevant retinal image variables for as long as
possible – though see next section) and should commit to
a stroke as late as possible. However, it does not necessarily
follow that the most successful batsmen will be superior to
the average batsman in these aspects of visual function. For
example, McLeod19 concluded that visual reaction times
for batsmen of international rank are little better than for
casual cricketers, and that the remarkable skill of elite bats-
men lies in their use of visual information to control motor
actions and, in particular, in their ability to minimize the
consequences of finite reaction times. The results of a study
on the flying performance of elite professional pilots flying
telemetry-tracked high-performance jet aircraft is consis-
tent with this conclusion.75 (Batting and piloting may, per-
haps, be comparable in that they both demand rapid and
accurate visual judgments and the translation of visual
information into motor action.) Visual discrimination
thresholds for changing size and for motion correlated with
measures of flying performance. But mean visual thresh-
olds for the pilot group did not significantly differ from the
mean for a group of graduate students who were not pilots,
and were not even particularly athletic.
Eye movements and cricket
Land and McLeod77 monitored the eye movements of
three batsmen playing 25 m s)1 (‘medium paced’ in
professional cricket) deliveries from a bowling machine.
They found that batsmen do not fixate the ball during
much of the period between the instant of delivery and
the ball’s striking the ground a few m from the batsman.
Rather, a batsman fixates the ball at the instant of deliv-
ery and for a short time afterwards, makes a predictive
saccade to the place where he expects it to hit the ground,
waits for it to bounce, and then follows its trajectory for
100–200 ms after the bounce. Land and MacLeod
reported that a short latency for the predictive saccade
distinguished their professional (County cricket) batsman
from the skilled amateur (Minor Counties cricket) and
from the much less skilled club-level batsman. They
showed that this eye movement strategy may allow the
prediction of when the ball will arrive in the region of
space where it is to be hit. They further noted that the
binocular and monocular information about TTC and the
direction of MID discussed earlier in the present review
may be used to refine the prediction during the 100–
200 ms period of tracking the ball after the bounce, and
that their analysis applies more to fast and medium paced
bowling than to slow bowling.
The batsman’s visual weaknesses and theirexploitation by slow bowlers
It is remarkable that some slow bowlers, though they do
not challenge the batsman’s reaction time and nerve, can
be more effective than even the most intimidating of fast
bowler. For example, Rhodes dismissed 4184 batsmen at
a cost of 16.7 runs per-dismissal over his 1898–1930
career in first class cricket.78 Other than A. P. Freeman, C
W. Parker and J. T. Hearne (all slow or medium paced
bowlers) no other bowler has exceeded 3000 wickets.79
No fast bowler has approached such a total, though partly
because the careers of even the most robust are cut short
by physical attrition.
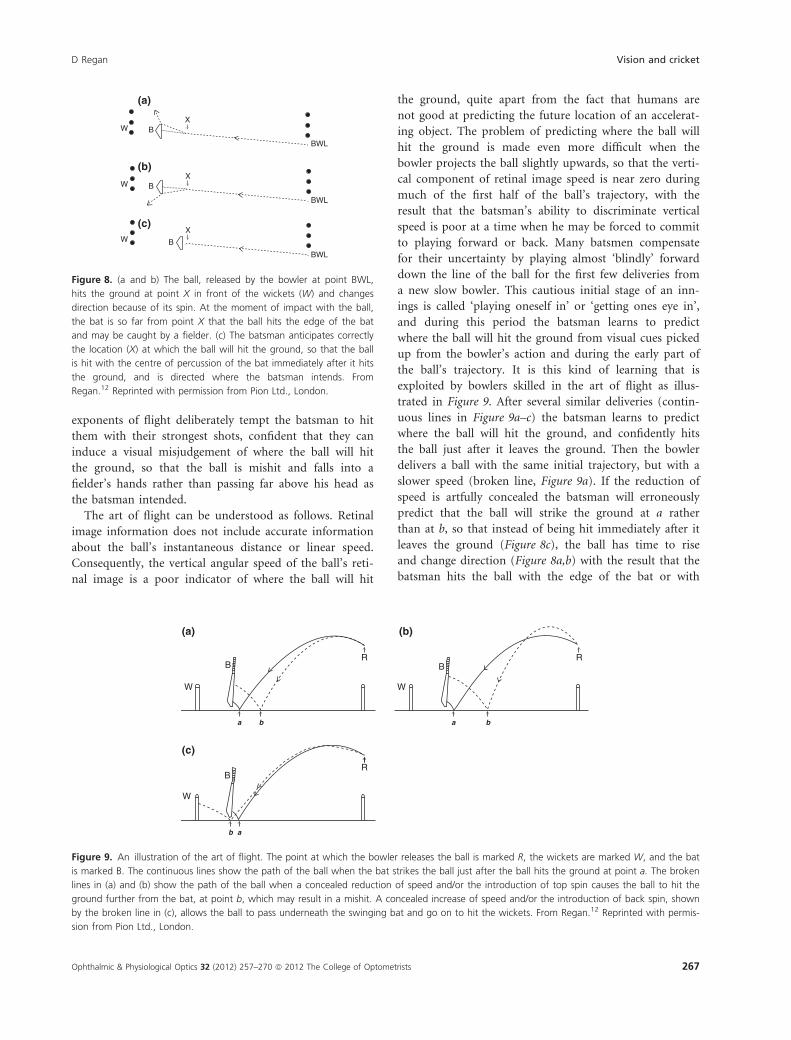
One way in which a slow bowler seeks to remove a
batsman is by spinning the ball, so that on hitting the
ground it changes direction (i.e. ‘breaks’, finds the edge
of the bat, and is caught by one of the fielders. Panel (a)
in Figure 8 depicts an ‘off break’) and panel (b) depicts a
‘leg break’ (see Appendix). A counter to this stratagem is
to hit the ball immediately after hits the ground (Fig-
ure 8c). In this way a slow bowler who relies entirely on
spin can be rendered ineffectual.
To hit the ball as illustrated in Figure 8c, the batsman
must predict where the ball will hit the ground. A bowler
who combines spin with a mastery of the art of flight can
cause the batsman to predict incorrectly where the ball
will hit the ground, so that the batsman’s attempt to
achieve the situation illustrated in Figure 8c finds himself
in the situation illustrated in Figure 8a or 8b. Some skillful
Vision and cricket D Regan
266 Ophthalmic & Physiological Optics 32 (2012) 257–270 ª 2012 The College of Optometrists
exponents of flight deliberately tempt the batsman to hit
them with their strongest shots, confident that they can
induce a visual misjudgement of where the ball will hit
the ground, so that the ball is mishit and falls into a
fielder’s hands rather than passing far above his head as
the batsman intended.
The art of flight can be understood as follows. Retinal
image information does not include accurate information
about the ball’s instantaneous distance or linear speed.
Consequently, the vertical angular speed of the ball’s reti-
nal image is a poor indicator of where the ball will hit
the ground, quite apart from the fact that humans are
not good at predicting the future location of an accelerat-
ing object. The problem of predicting where the ball will
hit the ground is made even more difficult when the
bowler projects the ball slightly upwards, so that the verti-
cal component of retinal image speed is near zero during
much of the first half of the ball’s trajectory, with the
result that the batsman’s ability to discriminate vertical
speed is poor at a time when he may be forced to commit
to playing forward or back. Many batsmen compensate
for their uncertainty by playing almost ‘blindly’ forward
down the line of the ball for the first few deliveries from
a new slow bowler. This cautious initial stage of an inn-
ings is called ‘playing oneself in’ or ‘getting ones eye in’,
and during this period the batsman learns to predict
where the ball will hit the ground from visual cues picked
up from the bowler’s action and during the early part of
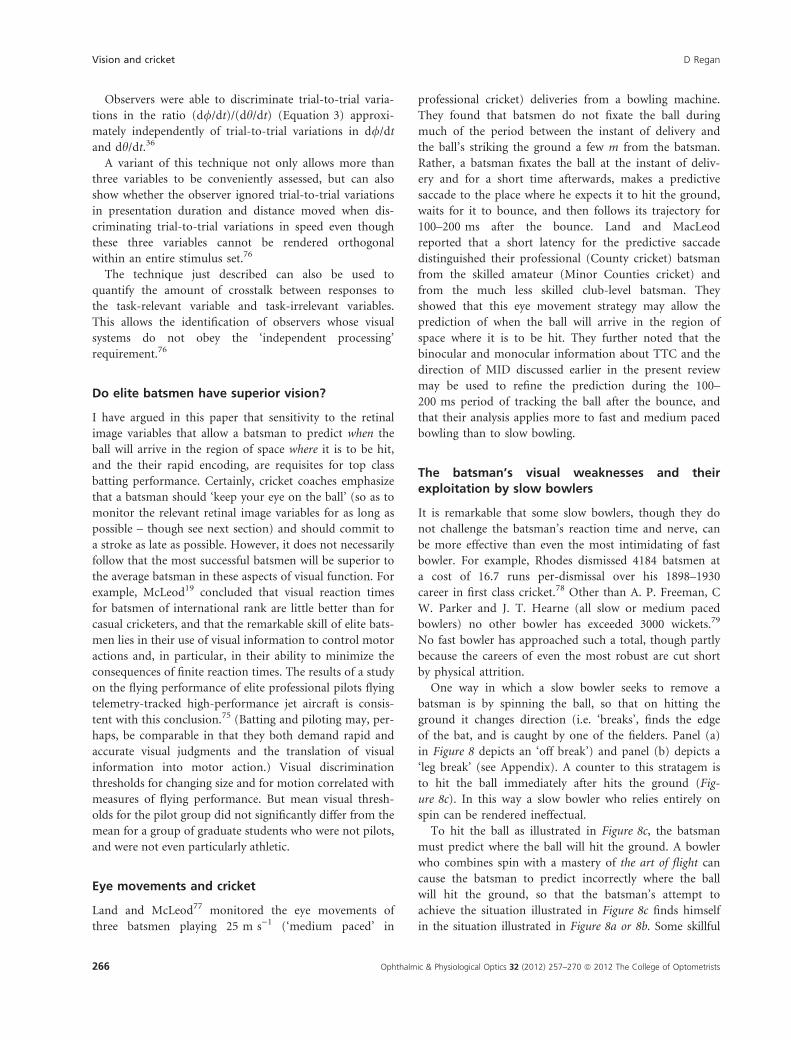
the ball’s trajectory. It is this kind of learning that is
exploited by bowlers skilled in the art of flight as illus-
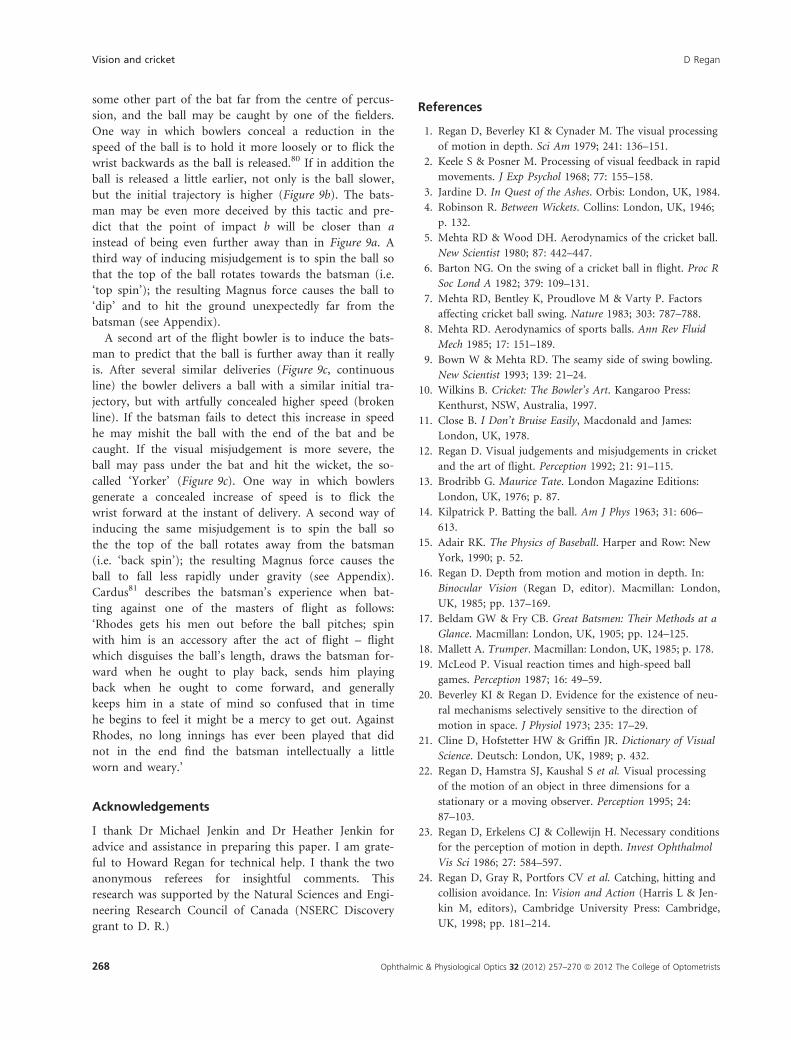
trated in Figure 9. After several similar deliveries (contin-
uous lines in Figure 9a–c) the batsman learns to predict
where the ball will hit the ground, and confidently hits
the ball just after it leaves the ground. Then the bowler
delivers a ball with the same initial trajectory, but with a
slower speed (broken line, Figure 9a). If the reduction of
speed is artfully concealed the batsman will erroneously
predict that the ball will strike the ground at a rather
than at b, so that instead of being hit immediately after it
leaves the ground (Figure 8c), the ball has time to rise
and change direction (Figure 8a,b) with the result that the
batsman hits the ball with the edge of the bat or with
W
B
a b
R
(a) (b)
(c)
W
B
a b
R
W
B
ab
R
Figure 9. An illustration of the art of flight. The point at which the bowler releases the ball is marked R, the wickets are marked W, and the bat
is marked B. The continuous lines show the path of the ball when the bat strikes the ball just after the ball hits the ground at point a. The broken
lines in (a) and (b) show the path of the ball when a concealed reduction of speed and/or the introduction of top spin causes the ball to hit the
ground further from the bat, at point b, which may result in a mishit. A concealed increase of speed and/or the introduction of back spin, shown
by the broken line in (c), allows the ball to pass underneath the swinging bat and go on to hit the wickets. From Regan.12 Reprinted with permis-
sion from Pion Ltd., London.
W
W
W
B
B
B
X
X
X
BWL
BWL
BWL
(a)
(b)
(c)
Figure 8. (a and b) The ball, released by the bowler at point BWL,
hits the ground at point X in front of the wickets (W) and changes
direction because of its spin. At the moment of impact with the ball,
the bat is so far from point X that the ball hits the edge of the bat
and may be caught by a fielder. (c) The batsman anticipates correctly
the location (X) at which the ball will hit the ground, so that the ball
is hit with the centre of percussion of the bat immediately after it hits
the ground, and is directed where the batsman intends. From
Regan.12 Reprinted with permission from Pion Ltd., London.
D Regan Vision and cricket
Ophthalmic & Physiological Optics 32 (2012) 257–270 ª 2012 The College of Optometrists 267
some other part of the bat far from the centre of percus-
sion, and the ball may be caught by one of the fielders.
One way in which bowlers conceal a reduction in the
speed of the ball is to hold it more loosely or to flick the
wrist backwards as the ball is released.80 If in addition the
ball is released a little earlier, not only is the ball slower,
but the initial trajectory is higher (Figure 9b). The bats-
man may be even more deceived by this tactic and pre-
dict that the point of impact b will be closer than a
instead of being even further away than in Figure 9a. A
third way of inducing misjudgement is to spin the ball so
that the top of the ball rotates towards the batsman (i.e.
‘top spin’); the resulting Magnus force causes the ball to
‘dip’ and to hit the ground unexpectedly far from the
batsman (see Appendix).
A second art of the flight bowler is to induce the bats-
man to predict that the ball is further away than it really
is. After several similar deliveries (Figure 9c, continuous
line) the bowler delivers a ball with a similar initial tra-
jectory, but with artfully concealed higher speed (broken
line). If the batsman fails to detect this increase in speed
he may mishit the ball with the end of the bat and be
caught. If the visual misjudgement is more severe, the
ball may pass under the bat and hit the wicket, the so-
called ‘Yorker’ (Figure 9c). One way in which bowlers
generate a concealed increase of speed is to flick the
wrist forward at the instant of delivery. A second way of
inducing the same misjudgement is to spin the ball so
the the top of the ball rotates away from the batsman
(i.e. ‘back spin’); the resulting Magnus force causes the
ball to fall less rapidly under gravity (see Appendix).
Cardus81 describes the batsman’s experience when bat-
ting against one of the masters of flight as follows:
‘Rhodes gets his men out before the ball pitches; spin
with him is an accessory after the act of flight – flight
which disguises the ball’s length, draws the batsman for-
ward when he ought to play back, sends him playing
back when he ought to come forward, and generally
keeps him in a state of mind so confused that in time
he begins to feel it might be a mercy to get out. Against
Rhodes, no long innings has ever been played that did
not in the end find the batsman intellectually a little
worn and weary.’
Acknowledgements
I thank Dr Michael Jenkin and Dr Heather Jenkin for
advice and assistance in preparing this paper. I am grate-
ful to Howard Regan for technical help. I thank the two
anonymous referees for insightful comments. This
research was supported by the Natural Sciences and Engi-
neering Research Council of Canada (NSERC Discovery
grant to D. R.)
References
1. Regan D, Beverley KI & Cynader M. The visual processing
of motion in depth. Sci Am 1979; 241: 136–151.
2. Keele S & Posner M. Processing of visual feedback in rapid
movements. J Exp Psychol 1968; 77: 155–158.
3. Jardine D. In Quest of the Ashes. Orbis: London, UK, 1984.
4. Robinson R. Between Wickets. Collins: London, UK, 1946;
p. 132.
5. Mehta RD & Wood DH. Aerodynamics of the cricket ball.
New Scientist 1980; 87: 442–447.
6. Barton NG. On the swing of a cricket ball in flight. Proc R
Soc Lond A 1982; 379: 109–131.
7. Mehta RD, Bentley K, Proudlove M & Varty P. Factors
affecting cricket ball swing. Nature 1983; 303: 787–788.
8. Mehta RD. Aerodynamics of sports balls. Ann Rev Fluid
Mech 1985; 17: 151–189.
9. Bown W & Mehta RD. The seamy side of swing bowling.
New Scientist 1993; 139: 21–24.
10. Wilkins B. Cricket: The Bowler’s Art. Kangaroo Press:
Kenthurst, NSW, Australia, 1997.
11. Close B. I Don’t Bruise Easily, Macdonald and James:
London, UK, 1978.
12. Regan D. Visual judgements and misjudgements in cricket
and the art of flight. Perception 1992; 21: 91–115.
13. Brodribb G. Maurice Tate. London Magazine Editions:
London, UK, 1976; p. 87.
14. Kilpatrick P. Batting the ball. Am J Phys 1963; 31: 606–
613.
15. Adair RK. The Physics of Baseball. Harper and Row: New
York, 1990; p. 52.
16. Regan D. Depth from motion and motion in depth. In:
Binocular Vision (Regan D, editor). Macmillan: London,
UK, 1985; pp. 137–169.
17. Beldam GW & Fry CB. Great Batsmen: Their Methods at a
Glance. Macmillan: London, UK, 1905; pp. 124–125.
18. Mallett A. Trumper. Macmillan: London, UK, 1985; p. 178.
19. McLeod P. Visual reaction times and high-speed ball
games. Perception 1987; 16: 49–59.
20. Beverley KI & Regan D. Evidence for the existence of neu-
ral mechanisms selectively sensitive to the direction of
motion in space. J Physiol 1973; 235: 17–29.
21. Cline D, Hofstetter HW & Griffin JR. Dictionary of Visual
Science. Deutsch: London, UK, 1989; p. 432.
22. Regan D, Hamstra SJ, Kaushal S et al. Visual processing
of the motion of an object in three dimensions for a
stationary or a moving observer. Perception 1995; 24:
87–103.
23. Regan D, Erkelens CJ & Collewijn H. Necessary conditions
for the perception of motion in depth. Invest Ophthalmol
Vis Sci 1986; 27: 584–597.
24. Regan D, Gray R, Portfors CV et al. Catching, hitting and
collision avoidance. In: Vision and Action (Harris L & Jen-
kin M, editors), Cambridge University Press: Cambridge,
UK, 1998; pp. 181–214.
Vision and cricket D Regan
268 Ophthalmic & Physiological Optics 32 (2012) 257–270 ª 2012 The College of Optometrists

25. Regan D & Gray R. Visually-guided collision avoidance
and collision achievement. Trends Cogn Sci 2000; 4: 99–
107.
26. Regan D. Binocular correlates of the direction of motion
in depth. Vision Res 1993; 33: 2359–2360.
27. Portfors-Yeomans CV & Regan D. Cyclopean discrimina-
tion thresholds for the direction and speed of motion in
depth. Vision Res 1996; 36: 3265–3279.
28. Beverley KI & Regan D. The relation between discrimina-
tion and sensitivity in the perception of motion in depth.
J Physiol 1975; 249: 387–398.
29. Portfors-Yeomans CV & Regan D. Discrimination of the
direction and speed of a monocularly-visible target from
binocular information alone. J Exp Psychol Hum Percept
Perform 1997; 23: 227–243.
30. Richards W & Regan D. A stereo field map with implica-
tions for disparity processing. Invest Ophthalmol 1973; 12:
904–909.
31. Regan D, Erkelens CJ & Collewijn H. Visual field defects
for vergence eye movements and for stereomotion
perception. Invest Ophthalmol Vis Sci 1986; 27:
806–819.
32. Hong X & Regan D. Visual field defects for unidirectional
and oscillatory motion in depth. Vision Res 1989; 29: 809–
819.
33. Ranjitsinji KS. The Jubilee Book of Cricket, 4th edn.
William Blackwood & Sons: Edinburgh, 1897; p. 164.
34. Kaiser PH & Boynton RM. Human Color Vision, 2nd edn.
Optical Society of America: Washington DC, 1996; pp.
251–253, 317.
35. Bootsma RJ. Predictive information and the control of
action: what you see is what you get. Int J Sport Psychol
1991; 22: 271–278.
36. Regan D & Kaushal S. Monocular discrimination of the
direction of motion in depth. Vision Res 1994; 34:
163–177.
37. Peper L, Bootsma RJ, Mestre DR & Bakker FC. Catching
balls: how to get the hand to the right place at the right
time. J Exp Psychol Hum Percept Perform 1994; 20:
591–612.
38. Hoyle F. The Black Cloud. Penguin Books: Harmonds-
worth, UK, 1971; pp. 26–27.
39. Beverley KI & Regan D. Separable after-effects of chang-
ing-size and motion-in-depth: different neural mecha-
nisms? Vision Res 1979; 19: 727–732.
40. Beverley KI & Regan D. Visual sensitivity to the shape and
size of a moving object: implications for models of object
perception. Perception 1980; 9: 151–160.
41. Gray R & Regan D. Estimating the time to collision with a
rotating nonspherical object. Vision Res 2000; 40: 49–63.
42. Lee DN. A theory of visual control of braking based on
information about time-to-collision. Perception 1976; 5:
224–230.
43. Wann JP. Anticipating arrival: is the tau margin a specious
theory? J Exp Psychol Hum Percept Perform 1996; 22:
1031–1048.
44. Tresilian JR. Visually timed action: time-out for tau.
Trends Cogn Sci 1999; 3: 301–310.
45. Lee DN. General tau theory: evolution to date. Perception
2009; 38: 837–850.
46. Gray R & Regan D. Do monocular time to collision esti-
mates necessarily involve perceived distance? Perception
1999; 28: 1257–1264.
47. Regan D & Hamstra S. Dissociation of discrimination
thresholds for time to contact and for rate of angular
expansion. Vision Res 1993; 33: 447–462.
48. Regan D. Spatial orientation in aviation: visual contribu-
tions. J Vestib Res 1995; 5: 455–471.
49. Regan D & Beverley KI. Binocular and monocular stimuli
for motion in depth: changing-disparity and changing-size
feed the same motion-in-depth stage. Vision Res 1979; 19:
1331–1342.
50. Gray R & Regan D. Accuracy of estimating time to colli-
sion using binocular and monocular information. Vision
Res 1998; 38: 499–512.
51. Steinman RM, Levinson JZ, Collewijn H & van der Steen
J. Vision in the presence of known natural retinal-image
motion. J Opt Soc Am A 1985; 2: 226–233.
52. Regan D. Binocular information about time to
collision and time to passage. Vision Res 2002; 42:
2479–2484.
53. Regan D, Kaufman L & Lincoln J. Motion in depth and
visual acceleration. In: Handbook of Perception and Human
Performance (Boff KR, Kaufman L & Thomas JP, editors).
Wiley: New York, 1986; pp. 19-1–19-46.
54. Regan D & Beverley KI. Illusory motion in depth: after-
effect of adaptation to changing size. Vision Res 1978; 18:
209–212.
55. Beverley KI & Regan D. Looming detectors in the human
visual pathway. Vision Res 1978; 18: 415–421.
56. Beverley KI & Regan D. Visual perception of changing-
size: the effect of object size. Vision Res 1979; 19: 1093–
1104.
57. Regan D & Beverley KI. Visual responses to changing size
and to sideways motion for different directions of motion
in depth: linearization of visual responses. J Opt Soc Am
1980; 70: 1289–1296.
58. Regan D & Gray R. A step by step approach to research
on time to contact and time to passage. In: Time to Con-
tact (Hecht H & Savelsburg GJP, editors). Elsevier:
Amsterdam, 2002; pp. 172–228.
59. Chapman S. Catching a baseball. Am J Phys 1968; 36: 868–
870.
60. Todd JT. Visual information about moving
objects. J Exp Psychol Hum Percept Perform 1981; 7:
795–810.
D Regan Vision and cricket
Ophthalmic & Physiological Optics 32 (2012) 257–270 ª 2012 The College of Optometrists 269

61. Saxberg BVH. Projected free fall trajectories: I theory and
simulation. Biol Cybern 1987; 56: 159–175.
62. Saxberg BVH. Projected free fall trajectories: II human
experiments. J Exp Psychol Hum Percept Perform 1987; 56:
177–184.
63. Michaels C & Oudejans RRF. The optics and actions of
catching fly balls: zeroing out optical acceleration. Ecol
Psychol 1992; 4: 199–222.
64. McLeod P & Dienes Z. Running to catch a ball. Nature
1993; 362: 23.
65. McBeath MK, Shaffer DM & Kaiser MK. How baseball
outfielders determine where to run to catch fly balls. Sci-
ence 1995; 268: 569–573.
66. Gray R, Regan D, Castaneda B & Sieffert R. Role of feed-
back in the accuracy of perceived direction of motion-in
depth and control of interceptive action. Vision Res 2006;
46: 1676–1694.
67. Alderson GJK, Sully DJ & Sully HG. An operational
analysis of a one-handed catching task using high-speed
photography. J Mot Behav 1974; 6: 217–226.
68. Banister H & Blackburn JM. An eye factor affecting
proficiency at ball games. Br J Psychol 1931; 21:
382–384.
69. Bose M. A History of Indian Cricket. Deutsch: London,
1990.
70. Peel M. Cricketing Falstaffe A Biography of Colin Milburn.
Deutsch: London, UK, 1998.
71. Regan D. Visual information channeling in normal
and disordered vision. Psychol Rev 1982; 89:
407–444.
72. Regan D. Human Brain Electrophysiology: Evoked Potentials
and Evoked Magnetic Fields in Science and Medicine.
Elsevier: New York, 1989; pp. 184–186.
73. Regan D. Human Perception of Objects: Early Visual
Processing of Spatial Form Defined by Luminance, Color,
Texture, Motion and Binocular Disparity. Sinauer: Sunder-
land, MA, 2000; pp. 30–34.
74. Beverley KI & Regan D. Device for measuring the
precision of eye hand coordination while tracking
changing size. Aviat Space Environ Med 1980; 51:
688–693.
75. Kruk R & Regan D. Visual test results compared with fly-
ing performance in telemetry-tracked aircraft. Aviat Space
Environ Med 1983; 54: 906–911.
76. Kohly R & Regan D. Evidence for a mechanism sensitive
to the speed of of cyclopean form. Vision Res 1999; 39:
1011–1024.
77. Land MF & McLeod P. From eye movements to actions:
how batsmen hit the ball. Nat Neurosci 2000; 3: 1340–
1345.
78. Thomson AA. Hirst and Rhodes. Pavilion Books: London,
1986; p. 205.
79. Frith D. The Slow Men. George Allen & Unwin: London,
1984; pp. 91, 96.
80. Verity H. Bowling ‘Em Out. Hutchinson: London, 1934;
pp. 32–36.
81. Cardus N. The Summer Game. Rupert Hart-Davis:
London, 1949; p. 17.
82. Warner PF. The Book of Cricket. Dent & Sons: London,
1934; pp. 31–40, 44.
David Regan received a BSc in physics from Imperial Col-
lege in 1957 followed by an MSc and PhD, also in physics.
In his PhD thesis he introduced and named the steady-state
evoked potential technique, which is the basis of the sweep
technique and the frequency-tagging technique. He was
awarded a DSc (London) in 1974. He spent 10 years in the
Research Department of Neuroscience at Keele University
before moving to Canada in 1975, where he was I.W. Killam
Research Professor and Professor of Ophthalmology at Dal-
housie University. In 1985 he moved to Toronto where he
was Natural Sciences and Engineering Research Council/
Canadian Aviation Electronics Industrial Research professor
of Vision and Aviation at York University and Professor of
Ophthalmology at the University of Toronto.
David Regan has received several awards including the
Order of Canada, Queen Elizabeth II Medal, Prentice Medal
(American Academy of Optometry), Proctor Medal (ARVO),
Dawson Medal (Royal Society of Canada) and the NSERC
Award of Excellence. He is a Fellow of the Royal Society of
Canada and a Foreign Member of the Netherlands Royal
Academy.
Vision and cricket D Regan
270 Ophthalmic & Physiological Optics 32 (2012) 257–270 ª 2012 The College of Optometrists