Embed Size (px)
Citation preview

V I S I O N 2 0 2 61.0
PUBLIC SURVEY HIGHLIGHTS

As part of the master planning process, a public survey, using Survey Monkey, was developed to gauge stakeholder insights on key issues shaping the future of Old City.
While not a scientific survey, it included 472 respondents and respresents a qualitative snapshot of perspectives, values, and opinions of Old City stakeholders.
The survey was posted on the project webpage (www.oldcitydistrict.org/vision2026) June 12th and closed on July 3rd. It was distributed via the Old City District’s 10,000+
address email database, social media outlets, flyers at institutional partners like the Arch Street Meeting house, by word-of-mouth, and board and steering commitee members.
The survey was further promoted at a public open house held on June 23rd.
The following pages present highlights of the results of the survey. Full results, including all comments submitted, are available on the project webpage (www.oldcitydistrict.
org/vision2026). Together with market research, continued stakeholder input, and best practices, they will inform the development of Vision2026.
August 2015
231 Market Street Philadelphia, PA 19106
215.592.7929www.oldcitydistrict.org
prepared by The RBA Group with Urban Partners + Atkin Olshin Schade Architects
Jonas Maciunas, principal author
V I S I O N 2 0 2 6PUBLIC SURVEY HIGHLIGHTS
V I S I O N 2 0 2 6 F R A M E W O R K 3Public Survey Highlights
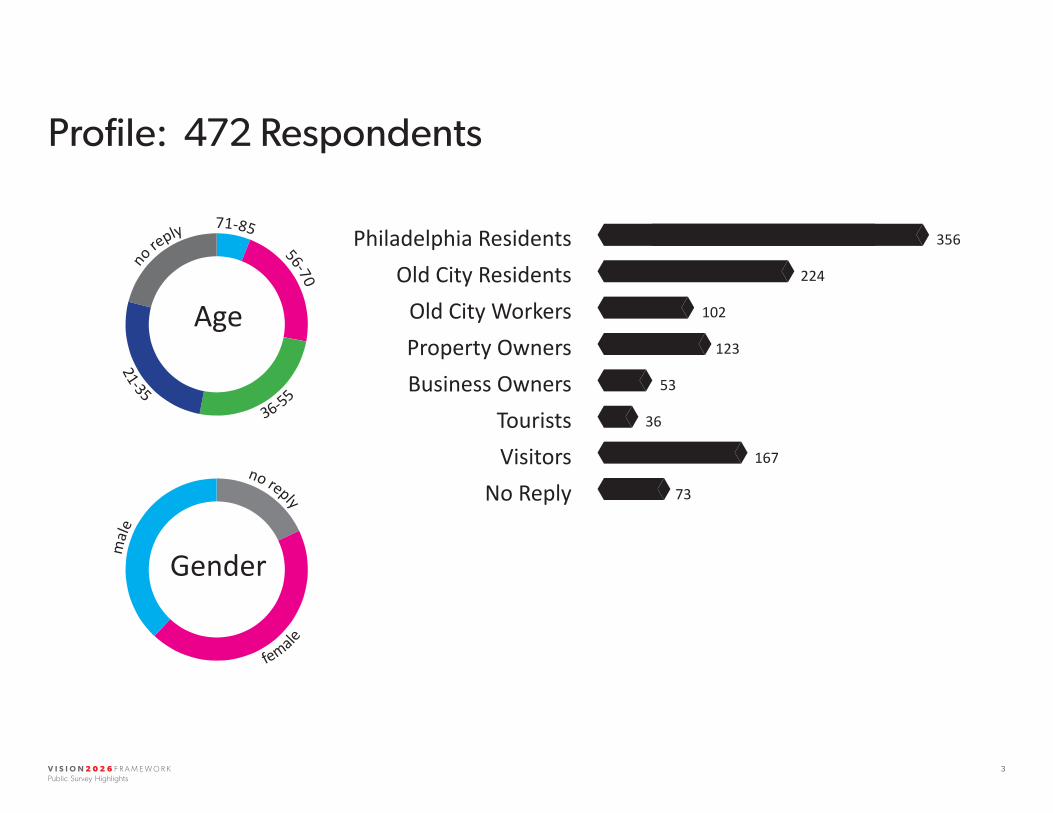
Profile: 472 Respondents
18+44+38+M6+22+25+26+21+M
990=672=306=369=153=102=501=219=
990=
36-55
21-35
no
reply
56-70
71-85
female
mal
e
no reply
Age
Gender
Philadelphia Residents 356
Old City Residents Old City WorkersProperty OwnersBusiness Owners
TouristsVisitors
No Reply
224
102
123
53
36
167
73
V I S I O N 2 0 2 6 F R A M E W O R K 4Public Survey Highlights
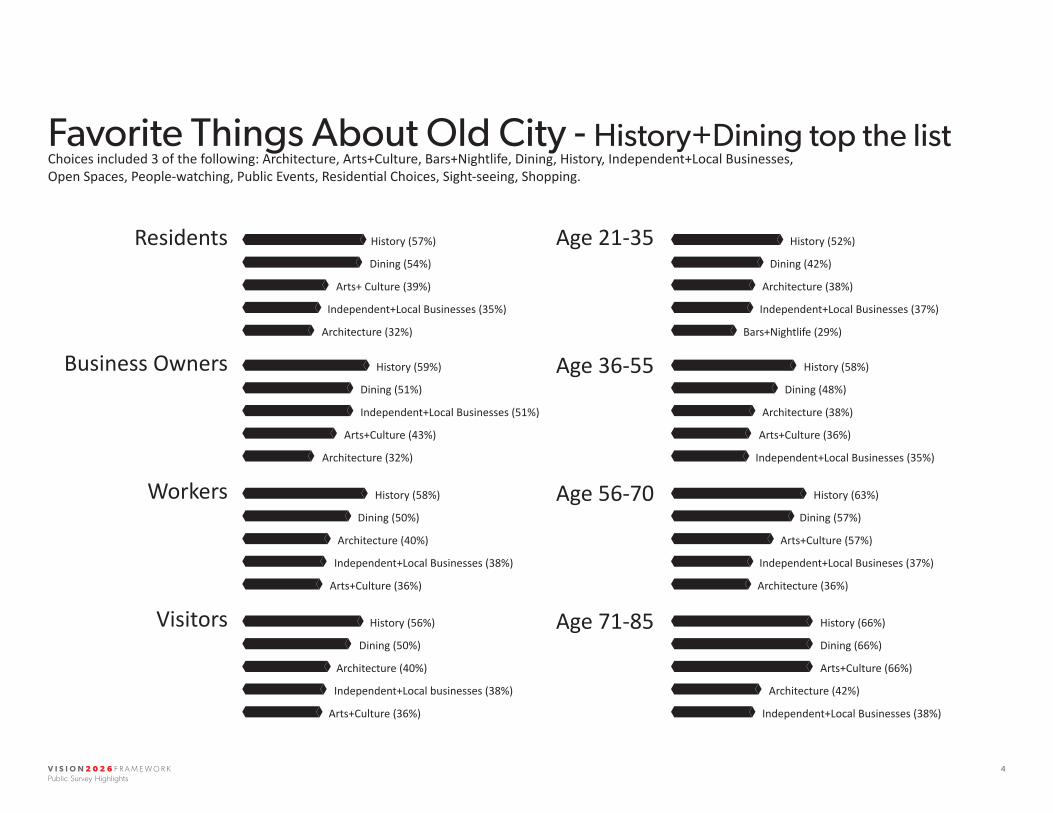
Favorite Things About Old City - History+Dining top the listChoices included 3 of the following: Architecture, Arts+Culture, Bars+Nightlife, Dining, History, Independent+Local Businesses, Open Spaces, People-watching, Public Events, Residential Choices, Sight-seeing, Shopping.
861=830= Dining (54%)
585=531= Independent+Local Businesses (35%)
Arts+ Culture (39%)
480= Architecture (32%)
885=765= Dining (51%)
765=645= Arts+Culture (43%)
Independent+Local Businesses (51%)
480= Architecture (32%)
History (59%)
870=750= Dining (50%)
600=570= Independent+Local Businesses (38%)
Architecture (40%)
540= Arts+Culture (36%)
History (58%)
840=750= Dining (50%)
600=570= Independent+Local businesses (38%)
Architecture (40%)
540= Arts+Culture (36%)
History (56%)
774=630= Dining (42%)
570=555= Independent+Local Businesses (37%)
Architecture (38%)
435= Bars+Nightlife (29%)
870=735= Dining (48%)
570=540= Arts+Culture (36%)
Architecture (38%)
525= Independent+Local Businesses (35%)
History (58%)
945=855= Dining (57%)
705=555= Independent+Local Busineses (37%)
Arts+Culture (57%)
540= Architecture (36%)
History (63%)
990=990= Dining (66%)
990=615= Architecture (42%)
Arts+Culture (66%)
570= Independent+Local Businesses (38%)
History (66%)
History (52%)Residents
Business Owners
Workers
Visitors Age 71-85
Age 21-35
Age 36-55
Age 56-70
History (57%)

V I S I O N 2 0 2 6 F R A M E W O R K 5Public Survey Highlights
Choosing Old City (or not)Neighborhood populations are always turning over. We wanted to get a sense whether respondents are thinking of moving into or out of Old City in the next three years and why. We make particular note of those absolutely not moving in or definitely moving out. Here’s what we heard:
15+41+44M52+42+6MMoving
out
maybe
abso
lutely not
Moving in
defi nitely
maybe
defi nitely
absolutely not
Absolutely not: Most prefer where they live now... others say Old City is too expensive, noisy, has too many tourists, lacking in resident-serving retail, not child-friendly, lacking green space and transit.
Maybe: I love the area. Good transit. Central location. Historic architecture. Low, dense built environment. Vibrancy. Hard to find affordable, “NON-Luxury” homes. Not enough large apartments.
Definitely: No housing for growing families, parking, noisiness, schools, affordability, looking for a yard in the suburbs.
Maybe: High cost of apartments, search for single-family options, parking, lack of a grocery store and other resident-oriented retail, becoming boring with “luxury” units.
V I S I O N 2 0 2 6 F R A M E W O R K 6Public Survey Highlights
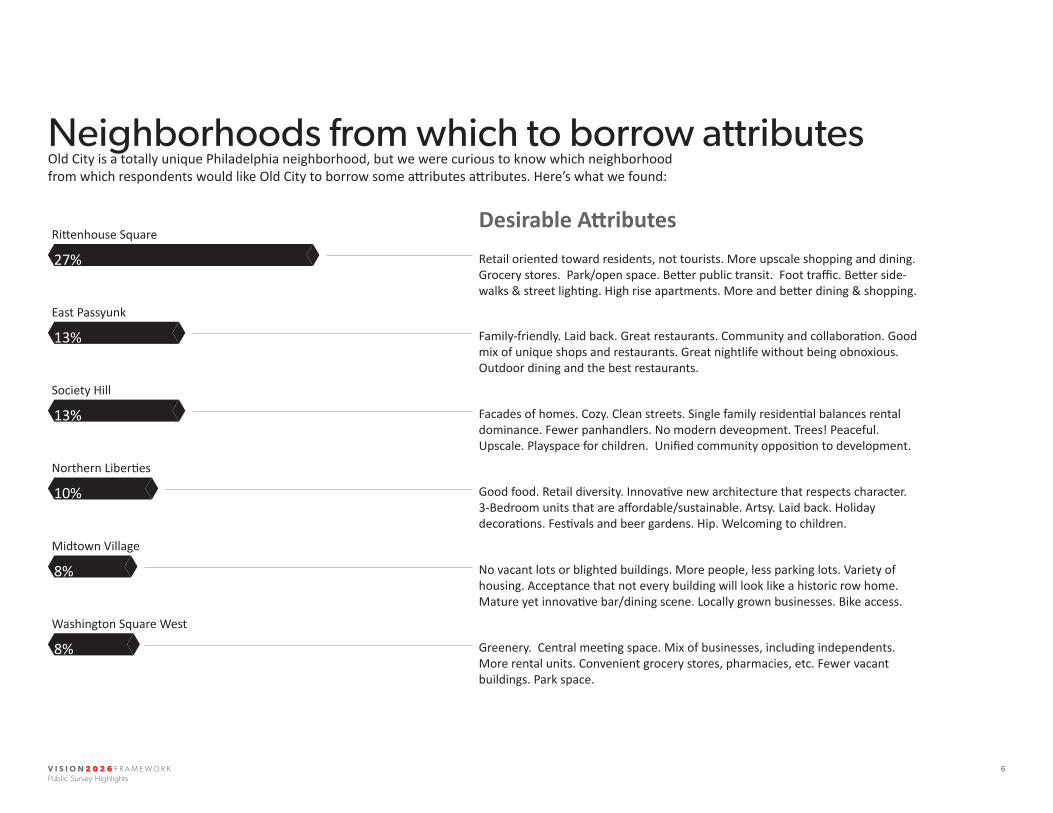
Neighborhoods from which to borrow attributesOld City is a totally unique Philadelphia neighborhood, but we were curious to know which neighborhood from which respondents would like Old City to borrow some attributes attributes. Here’s what we found:
945=Rittenhouse Square
455=East Passyunk
13%
455=Society Hill
13%
356=Northern Liberties
10%
27%
280=Midtown Village
2890=Washington Square West
8%
8%
Retail oriented toward residents, not tourists. More upscale shopping and dining. Grocery stores. Park/open space. Better public transit. Foot traffic. Better side-walks & street lighting. High rise apartments. More and better dining & shopping.
Family-friendly. Laid back. Great restaurants. Community and collaboration. Good mix of unique shops and restaurants. Great nightlife without being obnoxious. Outdoor dining and the best restaurants.
Facades of homes. Cozy. Clean streets. Single family residential balances rental dominance. Fewer panhandlers. No modern deveopment. Trees! Peaceful. Upscale. Playspace for children. Unified community opposition to development.
Good food. Retail diversity. Innovative new architecture that respects character. 3-Bedroom units that are affordable/sustainable. Artsy. Laid back. Holiday decorations. Festivals and beer gardens. Hip. Welcoming to children.
No vacant lots or blighted buildings. More people, less parking lots. Variety of housing. Acceptance that not every building will look like a historic row home. Mature yet innovative bar/dining scene. Locally grown businesses. Bike access.
Greenery. Central meeting space. Mix of businesses, including independents. More rental units. Convenient grocery stores, pharmacies, etc. Fewer vacant buildings. Park space.
Desirable Attributes

V I S I O N 2 0 2 6 F R A M E W O R K 7Public Survey Highlights
Retail Opinions: Fill the Vacancy and Spruce things Up! In many ways, ground floor and retail uses shape how neighborhoods are percieved and experienced. We asked respondents about their perceptions of the state of storefronts in Old City.
Resid
ents
Busin
ess
Ow
ners
Wor
kers
Visit
ors
Everything is OK
5426
Storefront appearances could impove
60626965
There are too many retailers
2431
73Too many storefronts
are vacant
797063
Vacancies should convert to office/residence
9467
There should be more retailers/restaurants
52656159
V I S I O N 2 0 2 6 F R A M E W O R K 8Public Survey Highlights
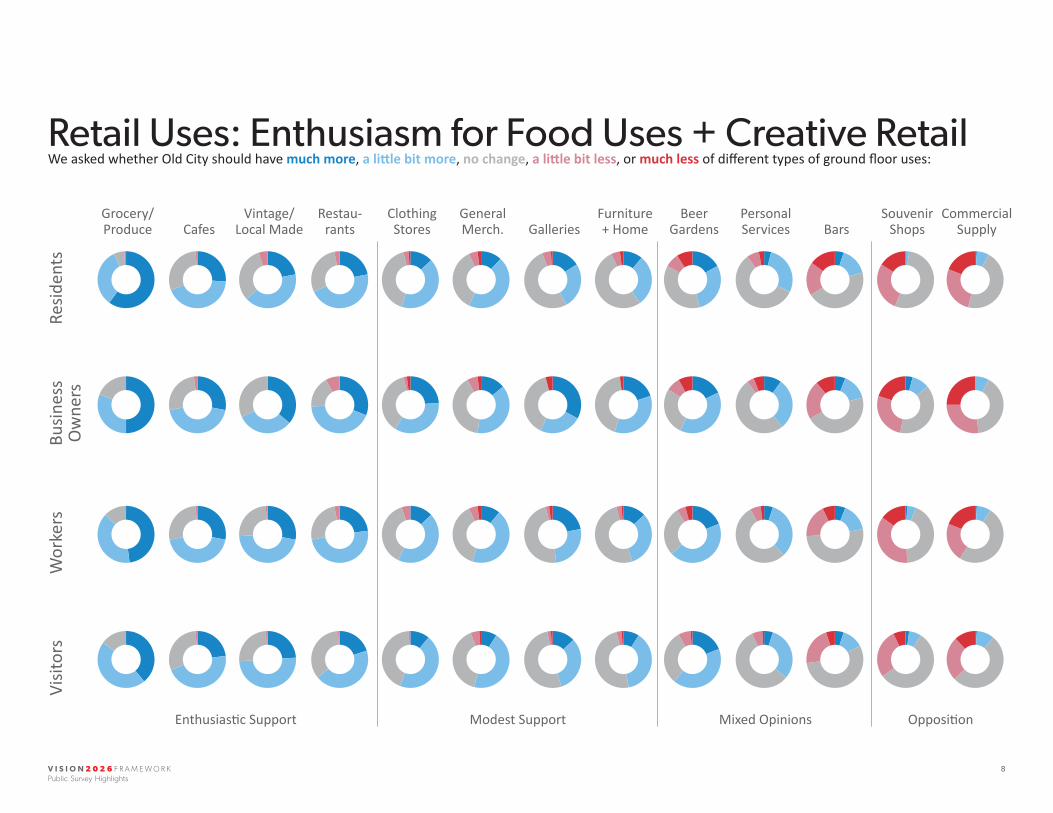
Retail Uses: Enthusiasm for Food Uses + Creative Retail We asked whether Old City should have much more, a little bit more, no change, a little bit less, or much less of different types of ground floor uses:
2+54+28+16z
Resid
ents
Busin
ess
Ow
ners
Wor
kers
Visit
ors
4+10+39+27+20z
1+5+43+36+15z
2+7+56+28+7z
Souvenir Shops
60+33+6+1z
50+31+19z
48+39+13z
39+46+15z
Grocery/Produce
26+43+30+1z
28+44+26+2z
28+44+27+1z
23+46+30+1z
Cafes
1+7+46+27+19z
8+40+27+25z
1+8+50+22+19z
1+10+52+25+12z
Commercial Supply
5+16+45+19+15z
6+15+46+22+11z
6+16+52+19+7z
5+12+56+22+5z
Bars
13+42+41+3+1z
24+35+37+2+2z
13+44+38+5z
11+45+43+1z
Clothing Stores
22+46+29+3z
31+43+18+8z
23+49+25+3z
20+44+35+1z
Restau-rants
22+41+32+5z
36+32+32z
28+46+25+1z
24+50+25+1z
Vintage/Local Made
Enthusiastic Support Modest Support OppositionMixed Opinions
11+29+53+5+2z
20+35+43+2z
13+32+51+3+1z
9+38+49+3+1z
Furniture + Home
16+26+52+5+1z
33+24+39+4z
22+26+48+2+2z
13+32+52+2+1z
Galleries
12+45+36+5+2z
14+38+40+6+2z
11+44+38+5+2z
9+45+40+5+1z
General Merch.
4+28+58+7+3z
10+29+51+4+6z
5+33+54+6+2z
5+31+57+6+1z
Personal Services
17+29+37+8+9z
18+39+27+8+8z
19+44+28+5+4z
19+42+31+7+1z
Beer Gardens
V I S I O N 2 0 2 6 F R A M E W O R K 9Public Survey Highlights
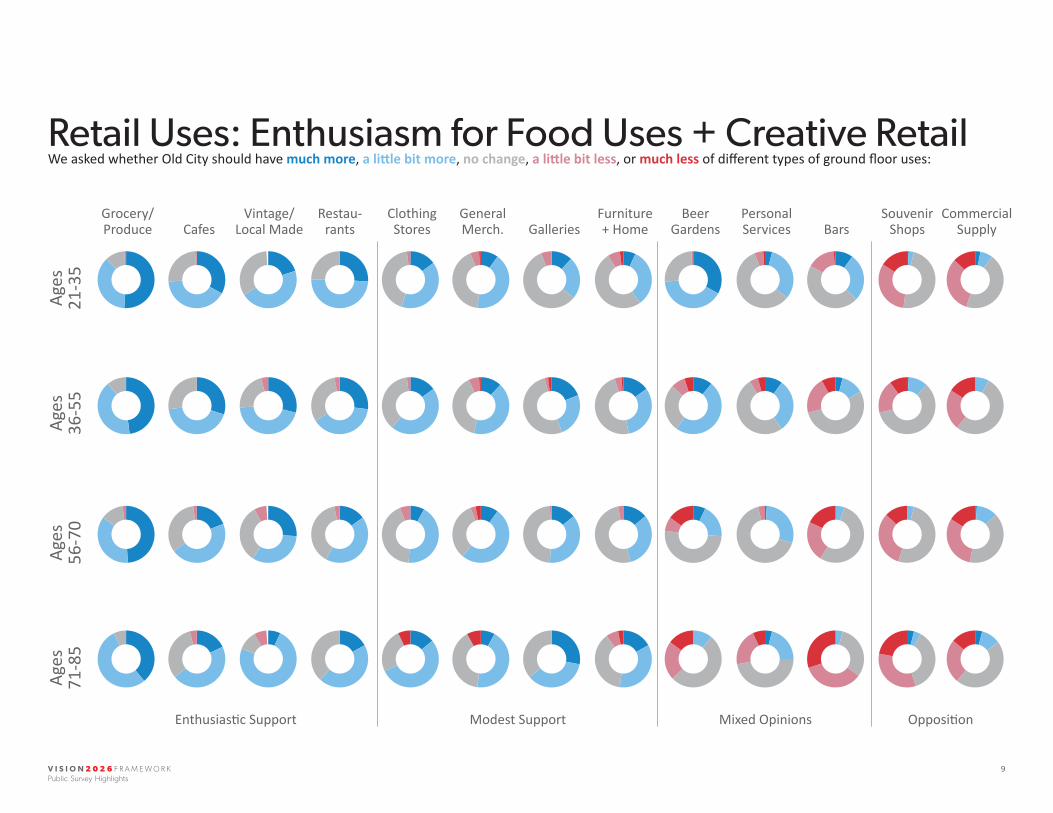
Retail Uses: Enthusiasm for Food Uses + Creative Retail We asked whether Old City should have much more, a little bit more, no change, a little bit less, or much less of different types of ground floor uses:
Souvenir Shops
Grocery/Produce Cafes
Commercial SupplyBars
Clothing Stores
Restau-rants
Vintage/Local Made
Enthusiastic Support Modest Support OppositionMixed Opinions
Furniture + HomeGalleries
General Merch.
Ages
21
-35
Ages
36-5
5Ag
es56
-70
Ages
71-8
5
15+40+43+2z51+37+11+1z33+41+25+1z20+46+330z26+49+25z 10+42+42+5+1z12+24+58+6z7+33+51+7+2z 10+27+46+16+1z1+3+48+32+16z3+7+45+32+13z
15+46+37+2z48+41+11z30+43+27z29+45+22+4z27+39+31+3z 12+42+39+6+1z19+25+52+2+2z15+32+48+4+1z 4+13+54+21+8z1+11+59+19+10z8+53+23+16z
8+43+43+6z49+36+13+2z19+46+33+2z26+33+33+7z15+43+39+3z 10+51+33+3+3z14+37+48+1z14+32+51+3z 5+54+23+18z4+51+32+13z1+12+40+31+16z
14+54+25+7z39+54+7z18+46+32+4z7+74+11+7z17+45+380z 8+44+40+8z28+36+360z17+35+38+7+3z 4+31+35+30z4+4+37+33+22z4+11+46+25+14z
Personal Services
4+32+58+5+1z
10+30+51+5+4z
1+29+66+4z
4+21+47+21+7z
Beer Gardens
33+41+25+1z
11+49+27+8+5z
7+19+51+8+15z
11+52+22+15z
V I S I O N 2 0 2 6 F R A M E W O R K 10Public Survey Highlights
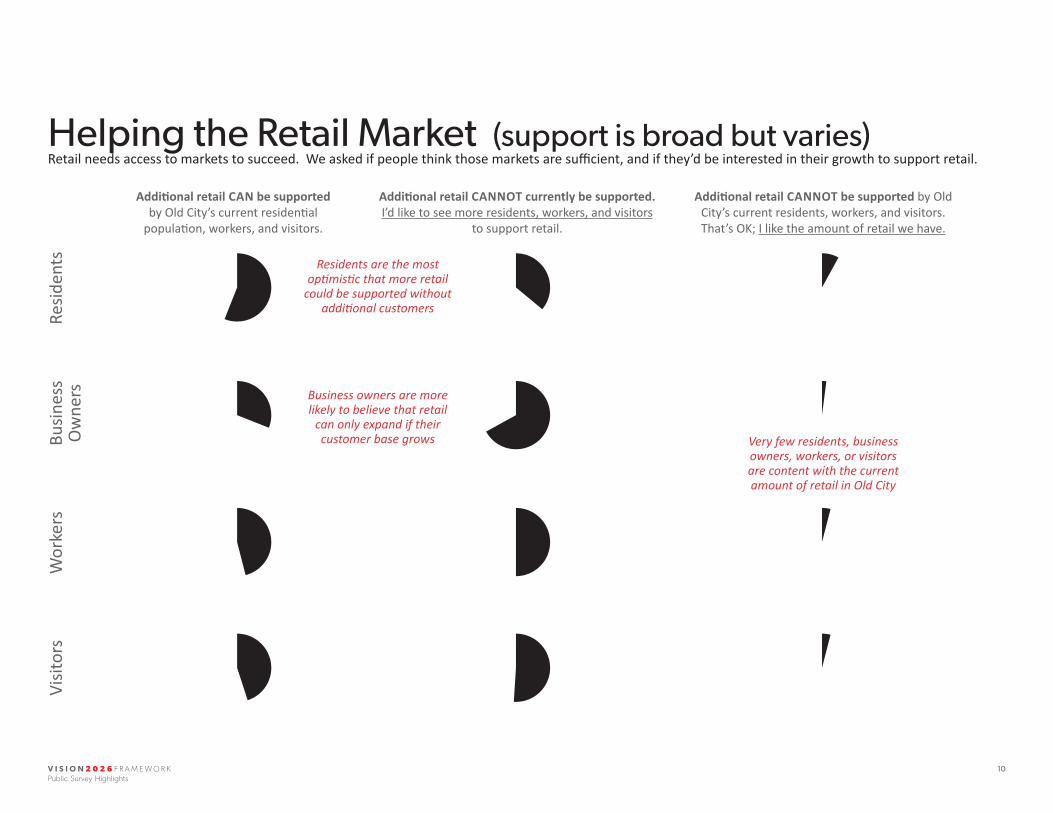
Helping the Retail Market (support is broad but varies)Retail needs access to markets to succeed. We asked if people think those markets are sufficient, and if they’d be interested in their growth to support retail.
Resid
ents
Busin
ess
Ow
ners
Wor
kers
Visit
ors
Additional retail CAN be supported by Old City’s current residential
population, workers, and visitors.
56314645
Additional retail CANNOT be supported by Old City’s current residents, workers, and visitors. That’s OK; I like the amount of retail we have.
8244
Additional retail CANNOT currently be supported. I’d like to see more residents, workers, and visitors
to support retail.
36675051
Residents are the most optimistic that more retail
could be supported without additional customers
Business owners are more likely to believe that retail
can only expand if their customer base grows Very few residents, business
owners, workers, or visitors are content with the current amount of retail in Old City
V I S I O N 2 0 2 6 F R A M E W O R K 11Public Survey Highlights
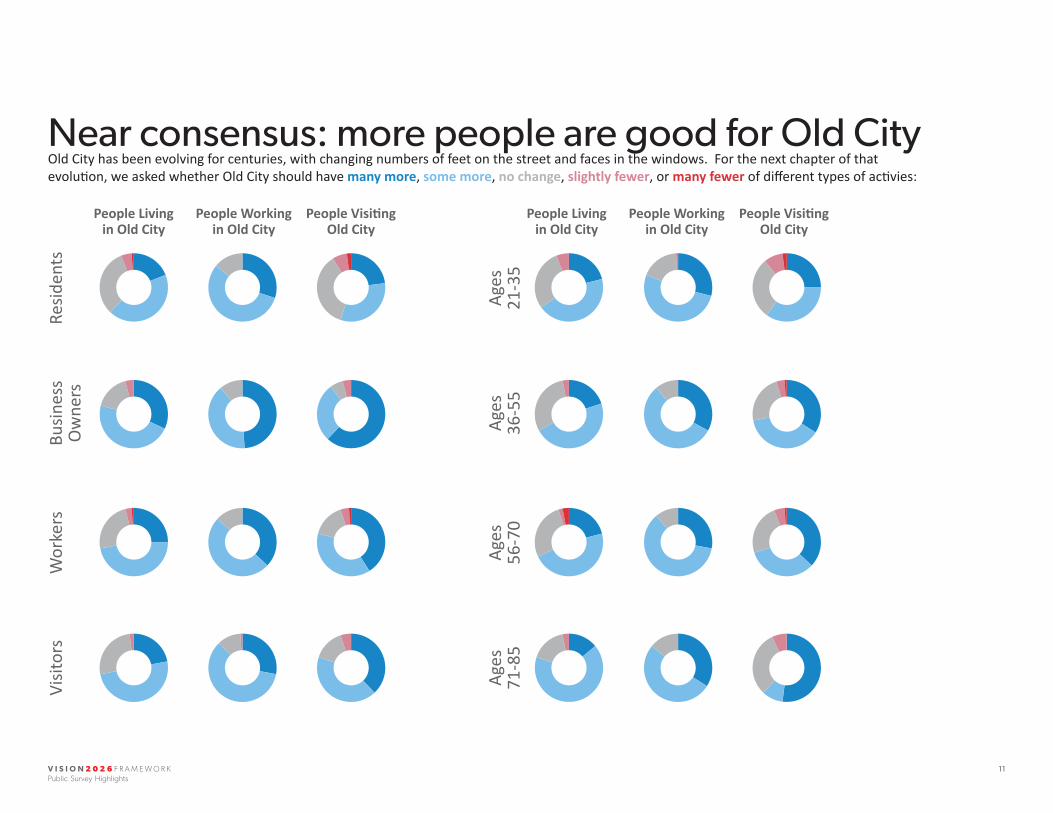
Near consensus: more people are good for Old City Old City has been evolving for centuries, with changing numbers of feet on the street and faces in the windows. For the next chapter of that evolution, we asked whether Old City should have many more, some more, no change, slightly fewer, or many fewer of different types of activies:
19+43+32+5+1z 30+56+14z 23+32+36+7+2z 21+44+29+6z 29+52+18+1z 25+35+29+9+2z32+47+17+4z 49+40+11+z 62+28+6+4z 20+47+30+3z 33+56+11z 34+38+23+4+1z25+47+24+3+1z 37+50+13z 41+38+16+4+1z 21+47+27+2+3z 28+61+11z 37+33+24+5+1z22+50+26+2z 28+60+11+1z 38+42+15+5z 14+66+17+3z 34+52+14z 52+10+31+7z
Resid
ents
Busin
ess
Ow
ners
Wor
kers
Visit
ors
People Living in Old City
People Visiting Old City
People Working in Old City
Ages
21
-35
Ages
36-5
5Ag
es56
-70
Ages
71-8
5
People Living in Old City
People Visiting Old City
People Working in Old City
V I S I O N 2 0 2 6 F R A M E W O R K 12Public Survey Highlights
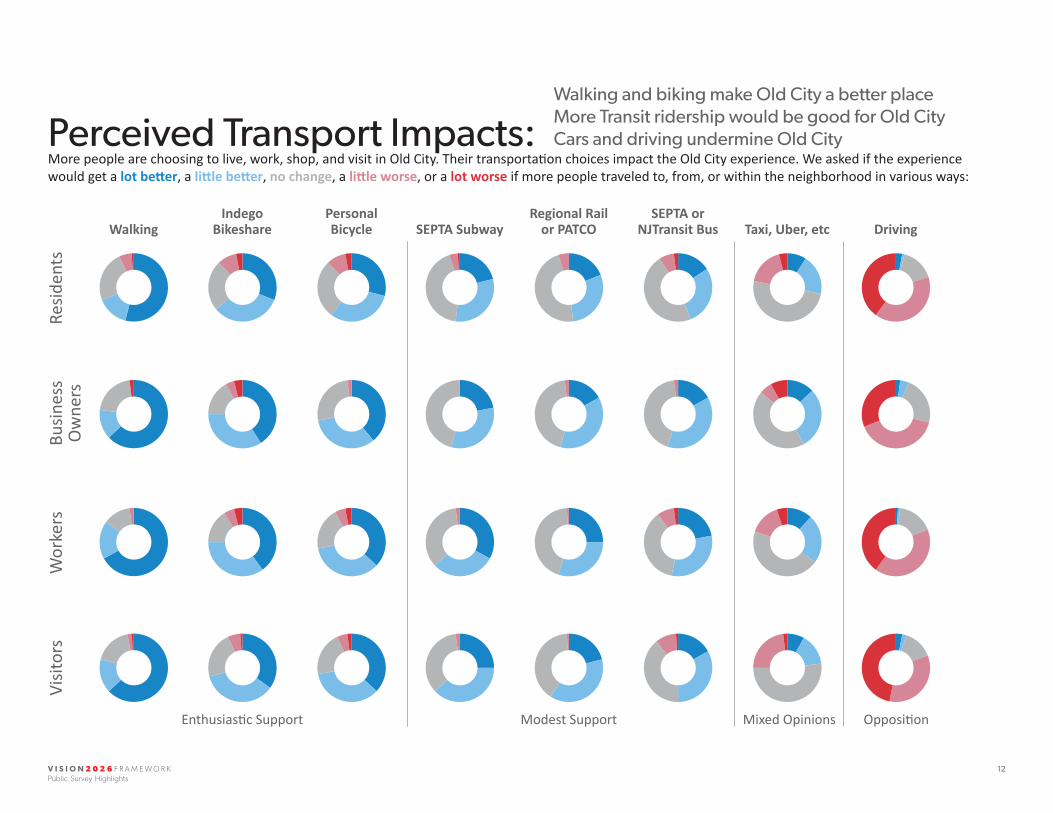
Perceived Transport Impacts: More people are choosing to live, work, shop, and visit in Old City. Their transportation choices impact the Old City experience. We asked if the experience would get a lot better, a little better, no change, a little worse, or a lot worse if more people traveled to, from, or within the neighborhood in various ways:
Resid
ents
Busin
ess
Ow
ners
Wor
kers
Visit
ors
54+15+24+6+1zWalking
63+14+21+2z67+18+13+2z63+16+18+2+1z
31+33+24+9+3zIndego
Bikeshare
29+31+28+9+3zPersonal Bicycle
41+34+17+4+4z 39+33+26+2z40+35+16+5+4z 37+35+20+5+3z35+36+22+6+1z 37+35+21+5+2z
16+28+47+7+2zSEPTA or
NJTransit Bus
17+38+43+2+z22+31+37+8+2z17+33+39+10+1z
9+19+50+18+4zTaxi, Uber, etc
13+29+44+6+8z12+23+45+15+5z8+15+52+23+2z
3+1+16+40+40zDriving
2+4+23+40+31z1+1+17+41+40z3+2+14+34+47z
Enthusiastic Support Modest Support OppositionMixed Opinions
21+31+43+4+1zSEPTA Subway
22+32+46z33+30+35+2z25+38+35+2z
19+29+47+5+0zRegional Rail
or PATCO
17+37+44+2+z25+30+44+1z21+38+40+1z
Walking and biking make Old City a better placeMore Transit ridership would be good for Old CityCars and driving undermine Old City

V I S I O N 2 0 2 6 F R A M E W O R K 13Public Survey Highlights
49+19+24+6+2z60+15+20+4+1z69+15+16z76+3+21z
Ages
21
-35
Ages
36-5
5Ag
es56
-70
Ages
71-8
5
Walking
Enthusiastic Support Modest Support OppositionMixed Opinions
33+40+24+2+1z 32+43+22+2+1z40+31+19+9+1z 41+24+24+10+1z35+31+21+8+5z 37+29+23+7+4z36+40+16+4+4z 36+32+29+3z
Indego Bikeshare
Personal Bicycle
3+1+12+36+48z2+2+17+38+41z6+1+19+37+37z+3+14+52+31z
Driving
4+19+52+19+6z13+17+46+20+4z14+15+50+18+3z14+18+47+14+7z
Taxi, Uber, etc
16+26+44+13+1z23+28+42+5+2z24+32+39+3+2z21+41+31+7z
SEPTA or NJTransit Bus
25+34+36+4+1z29+32+36+3z25+33+40+2z21+46+29+4z
SEPTA Subway
23+32+43+2z26+30+43+1z20+37+41+2z27+35+27+11z
Regional Rail or PATCO
Perceived Transport Impacts: More people are choosing to live, work, shop, and visit in Old City. Their transportation choices impact the Old City experience. We asked if the experience would get a lot better, a little better, no change, a little worse, or a lot worse if more people traveled to, from, or within the neighborhood in various ways:
Walking and biking make Old City a better placeMore Transit ridership would be good for Old CityCars and driving undermine Old City
V I S I O N 2 0 2 6 F R A M E W O R K 14Public Survey Highlights
Walking
Enthusiastic Support Modest Support OppositionMixed Opinions
Indego Bikeshare
Personal Bicycle DrivingTaxi, Uber, etc
SEPTA or NJTransit Bus
19+32+44+4+1zSEPTA Subway
Regional Rail or PATCO
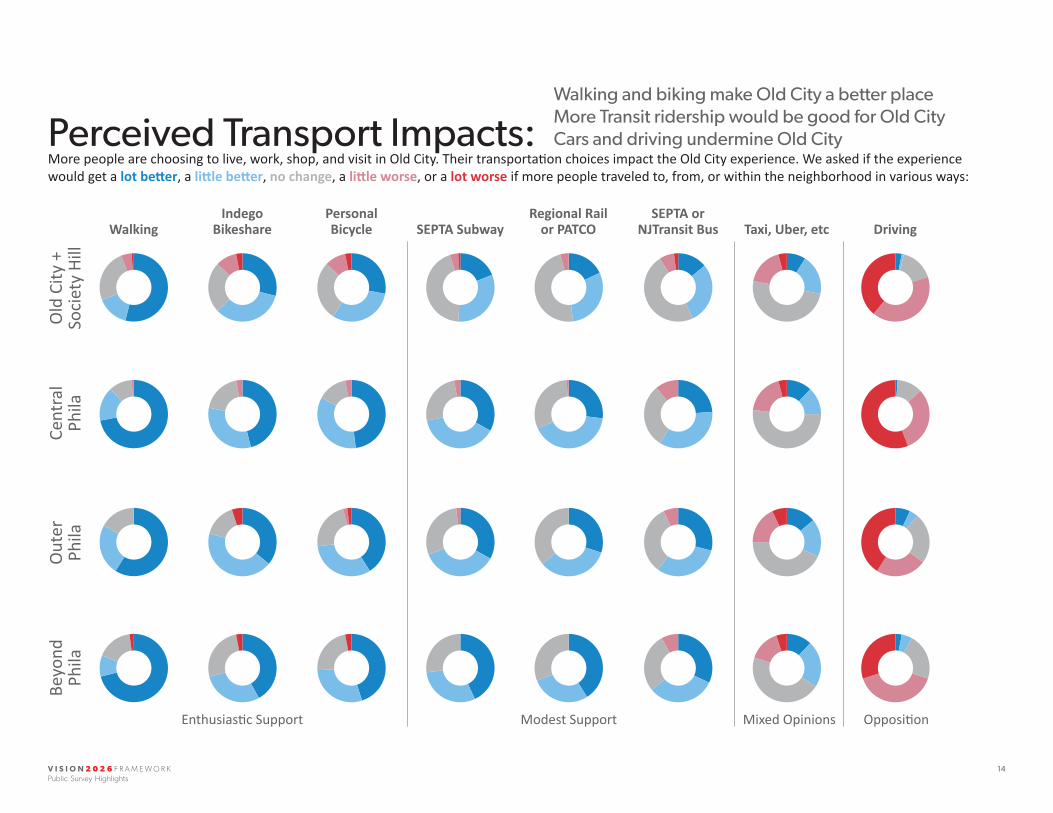
28+31+28+10+3z29+34+24+10+3z54+15+25+5+1z 18+30+48+4z 14+29+48+7+2z 9+19+50+18+4z 3+1+16+41+39z33+39+25+3z48+35+14+3z46+32+19+3z72+16+11+1z 27+41+31+1z 24+35+30+11z 12+13+52+19+4z 1+12+31+56z33+36+29+2+z41+32+23+2+2z36+43+16+5z59+24+170z 30+34+360z 29+31+33+7z 14+18+43+18+7z 7+4+24+24+41z43+30+270z45+29+23+3z42+29+26+3z71+10+17+2z 41+28+310z 32+32+28+8z 12+22+46+15+5z 3+5+22+40+30z
Old
City
+
Soci
ety
Hill
Cent
ral
Phila
Out
er
Phila
Beyo
ndPh
ila
Perceived Transport Impacts: More people are choosing to live, work, shop, and visit in Old City. Their transportation choices impact the Old City experience. We asked if the experience would get a lot better, a little better, no change, a little worse, or a lot worse if more people traveled to, from, or within the neighborhood in various ways:
Walking and biking make Old City a better placeMore Transit ridership would be good for Old CityCars and driving undermine Old City
V I S I O N 2 0 2 6 F R A M E W O R K 15Public Survey Highlights
1910
6Ce
ntra
l Ph
ilaO
uter
Ph
ilaBe
yond
Phila
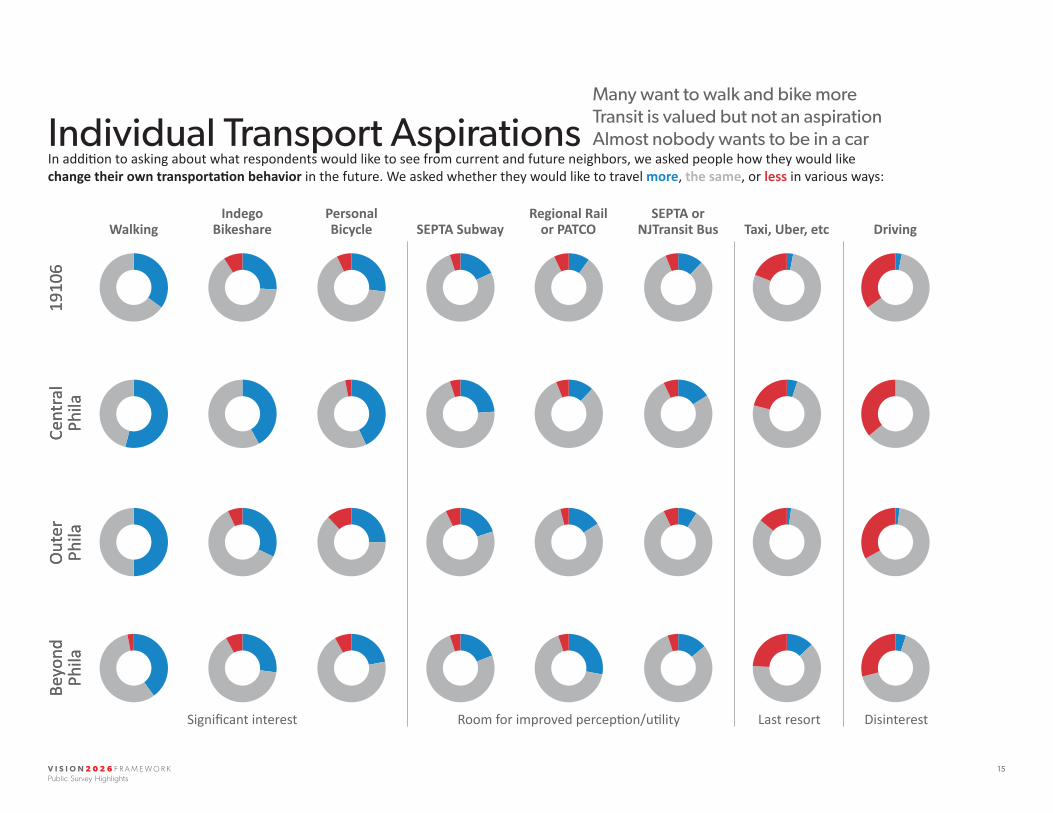
Individual Transport Aspirations In addition to asking about what respondents would like to see from current and future neighbors, we asked people how they would like change their own transportation behavior in the future. We asked whether they would like to travel more, the same, or less in various ways:
Many want to walk and bike moreTransit is valued but not an aspirationAlmost nobody wants to be in a car
WalkingIndego
BikesharePersonal Bicycle DrivingTaxi, Uber, etc
SEPTA or NJTransit BusSEPTA Subway
Regional Rail or PATCO
35+65z1910
6Ce
ntra
l Ph
ilaO
uter
Ph
ilaBe
yond
Phila
26+65+9z 27+66+7z 18+77+5z 10+83+7z 12+82+6z 3+78+19z 3+62+35z54+46z 42+58z 43+54+3z 24+71+5z 12+82+6z 16+77+7z 5+74+21z 64+36z50+50z 32+61+7z 25+63+12z 20+73+7z 16+80+4z 9+84+7z 2+84+14z 2+65+33z40+57+3z 27+65+8z 22+70+8z 19+76+5z 28+67+5z 14+81+5z 13+63+24z 5+66+29z
Significant interest Room for improved perception/utility DisinterestLast resort

V I S I O N 2 0 2 6 F R A M E W O R K 16Public Survey Highlights
Individual Transport Aspirations In addition to asking about what respondents would like to see from current and future neighbors, we asked people how they would like change their own transportation behavior in the future. We asked whether they would like to travel more, the same, or less in various ways:
Resid
ents
Walking
35+65+z
Visit
ors 47+53z
Busin
ess
Ow
ners
Wor
kers
47+53+z40+60z
Driving
3+63+34z
2+65+33z
63+37z63+37z
Indego Bikeshare
27+66+7z
37+58+5z
37+54+9z29+64+7z
Personal Bicycle
27+67+6z
34+59+7z
35+59+6z25+65+10z
Taxi, Uber, etc
2+80+18z
7+72+21z
9+70+21z7+71+22z
SEPTA SubwayRegional Rail
or PATCO
18+78+4z 10+83+7z
21+73+6z 18+76+6z
18+78+4z 7+86+7z13+81+6z 8+82+10z
SEPTA or NJTransit Bus
12+83+5z
16+76+8z
17+75+8z10+81+9z
Significant interest Room for improved perception/utility DisinterestLast resort
Many want to walk and bike moreTransit is valued but not an aspirationAlmost nobody wants to be in a car

V I S I O N 2 0 2 6 F R A M E W O R K 17Public Survey Highlights
Ages
71-8
5Ag
es 2
1-35
Ages
36-
55
50+50z45+54+1z
Ages
56-7
0
Walking
31+69z32+68z
37+62+1z 46+51+3z34+60+6z 26+66+8z
Indego Bikeshare
Personal Bicycle
20+68+12z 14+76+10z18+64+18z 10+71+19z
2+59+39z4+62+34z
Driving
1+66+33z75+25z
6+69+25z5+81+14z
Taxi, Uber, etc
3+77+20z8+77+15z
26+69+5z 17+76+7z20+75+5z 14+80+6z
SEPTA SubwayRegional Rail
or PATCO
16+77+7z 9+84+7z4+92+4z 9+86+5z
14+78+8z16+78+6z
SEPTA or NJTransit Bus
8+86+6z15+78+7z
Room for improved perception/utility DisinterestLast resortSignificant Interest
Many want to walk and bike moreTransit is valued but not an aspirationAlmost nobody wants to be in a carIndividual Transport Aspirations
In addition to asking about what respondents would like to see from current and future neighbors, we asked people how they would like change their own transportation behavior in the future. We asked whether they would like to travel more, the same, or less in various ways:

V I S I O N 2 0 2 6 F R A M E W O R K 18Public Survey Highlights
Infrastructure: Reflecting Values and Shaping Mobility Choices Transportation decisions are shaped by many variables. We asked what changes would increase respondents’ use of various modes. Keeping in mind responses to previous survey questions about personal aspirations and the impact of increased driving, bicycling and transit use on Old City, these responses will help craft a plan that reflects stakeholders’ overall preferences for future neighborhood conditions. Here are the top four responses for each mode:
Driving Bicycling Public Transit
672=More available parking
52%
596=More affordable parking
38%
544=More convenient parking
35%
356=Less traffic
23%
800=Safer bike lanes
724=More bike lanes
556=Less vehicular traffic
508=More available bike parking
688=Physical improvement of facilities
588=More frequent service
412=Clearer understanding of service
344=Faster service
43%
836=Not interested in driving more*
53%
47%
36%
33%
540=Not interested in bicycling more*
35% 540=Not interested in riding more*
35%
45%
37%
27%
23%
* This does not suggest that the rest (47%, 65%, and 65%, respectively), ARE interested in using this mode more, but that they might consider it, if conditions improved

V I S I O N 2 0 2 6 F R A M E W O R K 19Public Survey Highlights
Quantity + frequency of open space: Old City has large parks at its edges and is dotted with open spaces within. We asked about the amount of open space in Old City (way too much, a little too much, just right, not quite enough, and not nearly enough) and how far respondents would ideally like to walk to a park or open space.
14+53+31+1+1z17+47+34+2z17+47+33+3z54+15+24+6+1z
Amount
Resid
ents
Busin
ess
Ow
ners
Wor
kers
Visit
ors
Ideal distance360=918= 3-7 minutes
360=162= 10+ minutes
7-9 minutes
0-3 minutes20%
51%
20%
9%
414=846= 3-7 minutes
360=180= 10+ minutes
7-9 minutes
0-3 minutes23%
47%
20%
10%
360=990= 3-7 minutes
360=108= 10+ minutes
7-9 minutes
0-3 minutes20%
55%
20%
6%
324=846= 3-7 minutes
468=162= 10+ minutes
7-9 minutes
0-3 minutes18%
47%
26%
9%
Selected CommentsI think Independence Park Northwest has huge potential, but it not currently laid out well. I suggest adding more trees, seating, and food truck station (like Love Park).
Should be more European-style pedestrian-only streets and plazas with al fresco restaurants and cafes.
2nd and Market “Christ Church Park” does not feel like a park at all. The walls prohibit use and it is a tragic waste of public space.
There aren’t many options left for green space when developers drive usage.
Programming helps make them engaging. Read your Jane Jacobs on how to fix Washington Square (and Independence Mall, for that matter).
The new dog park at Penns Landing is AMAZING.
More seating--especially moveable chairs so you can choose wheth-er you want to be in the sun or the shade. More activities, like big chess sets (like the Porch at 30th Street station).
Please. Please. Please create dedicated dog parks; but restrict or ban dogs in the human parks!!! Please? I have to dodge all the crap on the sidewalk, give me some green grass to enjoy with none of this stuff in it.
Allow the space under the Ben Franklin Bridge to be used for public events, art shows, street truck festivals, block party...
See Rittenhouse Square: Benches, farmers markets, art exhibits, fountains, flowers.
The Christ Church park is a great location but is under-utilized by the community. Issues are access and layout.
Parks, plazas, and open space compete for real estate with buildings, parking, and roads.
Survey results suggest respondents are interested in more access to high-quality open space, though
not necessarily on each and every block.
V I S I O N 2 0 2 6 F R A M E W O R K 20Public Survey Highlights
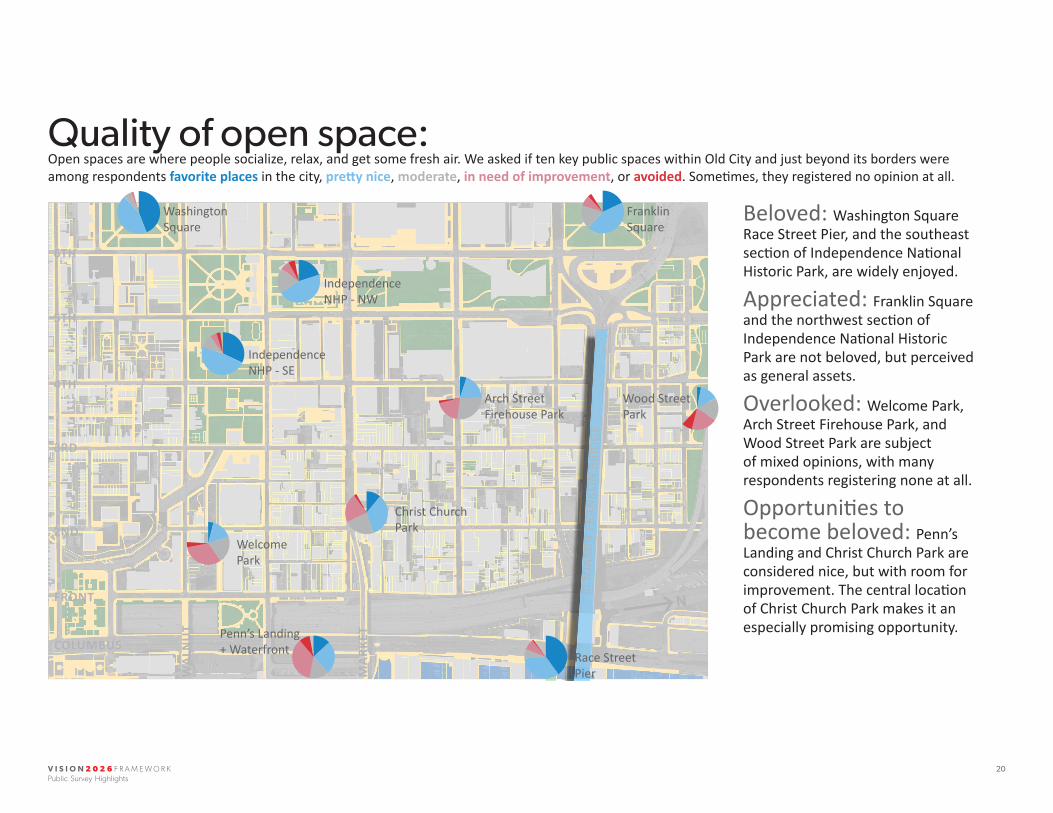
Quality of open space: Open spaces are where people socialize, relax, and get some fresh air. We asked if ten key public spaces within Old City and just beyond its borders were among respondents favorite places in the city, pretty nice, moderate, in need of improvement, or avoided. Sometimes, they registered no opinion at all.
44+44+6+2
5+20+27+19+2
11+34+23+22+24+16+20+32+4
3+14+17+20+832+48+10+5+3
40+34+7+8+113+25+15+36+8
20+46+19+7+518+44+18+8+3Washington
SquareFranklin Square
Independence NHP - NW
Independence NHP - SE
Arch Street Firehouse Park
Christ Church Park
Welcome Park
Penn’s Landing+ Waterfront Race Street
Pier
Wood Street Park
6TH
5TH
4TH
3RD
2ND
FRONT
COLUMBUS
WA
LNU
T
MA
RKET
BEN
JAM
IN F
RAN
KLIN
BRI
DG
EN
Beloved: Washington Square Race Street Pier, and the southeast section of Independence National Historic Park, are widely enjoyed.
Appreciated: Franklin Square and the northwest section of Independence National Historic Park are not beloved, but perceived as general assets.
Overlooked: Welcome Park, Arch Street Firehouse Park, and Wood Street Park are subject of mixed opinions, with many respondents registering none at all.
Opportunities to become beloved: Penn’s Landing and Christ Church Park are considered nice, but with room for improvement. The central location of Christ Church Park makes it an especially promising opportunity.

V I S I O N 2 0 2 6 F R A M E W O R K 21Public Survey Highlights
Activating Open Spaces Some parks are passivlely used; others are more actively programmed. Before considering what might be appropriate where, we wanted to get a sense of which types of activities respondents would be interested in being introduced or expnded. Given eight options, we asked they select up to three.
81 35 33 177 27 28 386 18 19 1275 11 14 7
Ages
21
-35
Ages
36-5
5Ag
es56
-70
Ages
71-8
5
Farmers Markets Dog Parks
Exercise Classes
I’d Prefer no such increases
6652204
Beer Gardens
48434657
Concerts
56392225
Movie Nights
39544160
Arts/Crafts Shows

V I S I O N 2 0 2 6 F R A M E W O R K 22Public Survey Highlights
Resid
ents
Busin
ess
Ow
ners
Wor
kers
Visit
ors
Activating Open Spaces Some parks are passivlely used; others are more actively programmed. Before considering what might be appropriate where, we wanted to get a sense of which types of activities respondents would be interested in being introduced or expnded. Given eight options, we asked they select up to three.
85 34 29 569 23 19 1081 24 27 577 21 23 2
Farmers Markets Dog Parks
Exercise Classes
I’d Prefer no such increases
40425649
Beer Gardens
45445149
Concerts
40334146
Movie Nights
42464554
Arts/Crafts Shows

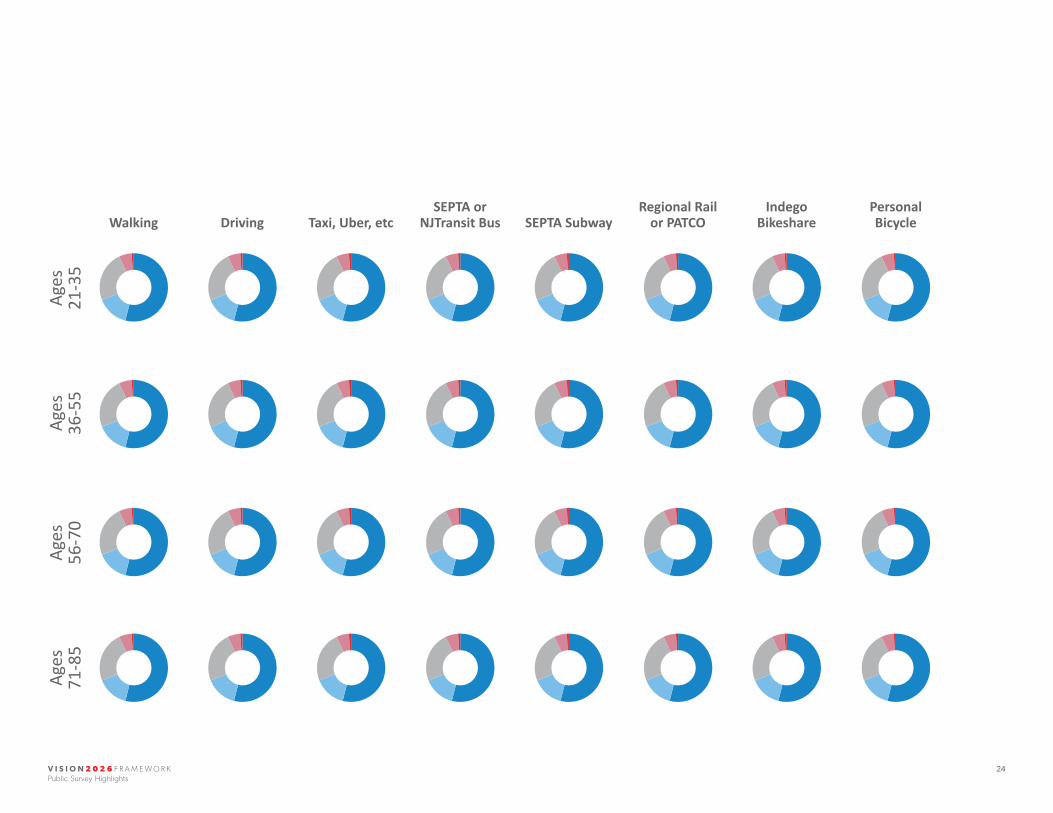
V I S I O N 2 0 2 6 F R A M E W O R K 24Public Survey Highlights
54+15+24+6+1z 54+15+24+6+1z 54+15+24+6+1z 54+15+24+6+1z 54+15+24+6+1z 54+15+24+6+1z 54+15+24+6+1z 54+15+24+6+1z54+15+24+6+1z 54+15+24+6+1z 54+15+24+6+1z 54+15+24+6+1z 54+15+24+6+1z 54+15+24+6+1z 54+15+24+6+1z 54+15+24+6+1z54+15+24+6+1z 54+15+24+6+1z 54+15+24+6+1z 54+15+24+6+1z 54+15+24+6+1z 54+15+24+6+1z 54+15+24+6+1z 54+15+24+6+1z54+15+24+6+1z 54+15+24+6+1z 54+15+24+6+1z 54+15+24+6+1z 54+15+24+6+1z 54+15+24+6+1z 54+15+24+6+1z 54+15+24+6+1z
Ages
21
-35
Ages
36-5
5Ag
es56
-70
Ages
71-8
5
Walking Driving Taxi, Uber, etcSEPTA or
NJTransit Bus SEPTA SubwayRegional Rail
or PATCOIndego
BikesharePersonal Bicycle