Embed Size (px)
Citation preview
Viscosity and density measurements of aqueous amines at high pressures: MDEA-water
and MEA-water mixtures for CO2 capture
Manuel Sobrino, Eduardo I. Concepción, Ángel Gómez-Hernández, M. Carmen Martín, José
J. Segovia*
TERMOCAL Research Group, Escuela de Ingenierías Industriales, Universidad de
Valladolid, Paseo del Cauce 59, 47011 Valladolid, Spain.
*corresponding autor, e-mail: [email protected]
ABSTRACT
Viscosity and density are thermophysical properties crucial to characterizing any kind of fluid
such as aqueous amines. These blends are becoming more and more relevant for their CO2
capture potential, such that having accurate viscosity and density measurements would prove
useful. Densities and viscosities of these mixtures at atmospheric pressure may be found in
the literature although it is more difficult to find values at high pressures, these potentially
proving interesting when seeking to provide a full description of these fluids.
Viscosity and density measurements at high pressures (up to 120 MPa) and at temperatures
between 293.15 and 353.15 K of MDEA + water and MEA + water mixtures (both from 10 %
to 40 % amine mass fraction) are presented in this work. Density measurements were
performed with an Anton Paar DMA HPM densimeter with an expanded uncertainty (k = 2)
less than ± 0.7 kg·m-3
. A falling body technique was used to measure viscosities at high
pressures due to its sturdiness in terms of corrosion. Details of this latter equipment are
presented, including calibration using n-dodecane and uncertainty calculations, which give a
relative expanded uncertainty (k = 2) of less than ± 2.4 % for the highest viscosity and ± 2.9
% for the lowest.

Keywords: Viscosity; Density; Falling body viscometer; High pressure; MDEA; MEA.
1. Introduction
Society is becoming increasingly aware of environmental issues, with the focus on problems
such as the greenhouse effect. In this sense, reducing CO2 emissions is an important goal.
Although there are many substances whose Global Warming Potential (GWP) is higher than
the GWP of CO2, our current way of life, which is mainly based on fossil fuels, forces us to
pay particular attention to CO2 emissions.
There are two main actions which might help to improve this situation. Firstly, an increased
use of renewable sources will reduce CO2 emissions directly, and secondly, CO2 may be
removed from gas streams by using substances such as aqueous amines. In this regard, many
initiatives have been promoted by governments over the last few years in an effort to cut CO2
emissions.
Specifically, alkanolamine solutions are widely used in industry to remove components such
as H2S and CO2 from natural or refinery gases, with the tertiary amine n-
methyldiethanolamine (MDEA) an industrially important one for this purpose [1, 2]. Primary
amine monoethanolamine (MEA) is one of the most effective amines for CO2 absorption,
reaching efficiency rates above 90 % [3] and being catalogued as one of the most promising
amines for these purposes by Aaron et al. [4].
Thermophysical properties such as viscosity and density of aqueous solutions are required for
two main reasons. Firstly, they are crucial for designing treatment equipment [5], and
secondly, knowledge of these properties, even at high pressures, will enable a full
characterization of these fluids.
In this work, viscosity and density measurements of MDEA + H2O and MEA + H2O mixtures
(10 %, 20 %, 30 % and 40 % amine mass fraction) at pressures from 0.1 to 120 MPa and

temperatures of 293.15, 313.15, 333.15 and 353.15 K are presented. Density measurements
were carried out with an Anton Paar DMA HPM densimeter, already introduced [6], and
density measurements were extended up to p = 140 MPa and T = 393.15 K. Viscosity
measurements were performed with a falling body viscometer recently developed at the
TERMOCAL laboratory [7]. Both techniques are able to resist any corrosion effects which
might be caused by amines.
2. Experimental procedure
2.1. Densimeter
An Anton Paar DMA HPM densimeter was employed to perform the density measurements
using water and vacuum for its calibration and following the method shown in [6].
Uncertainty calculations were carried out following the procedure described in JCGM
100:2008 [8] and explained in [6], obtaining an expanded uncertainty (k = 2) of below ± 0.7
kg·m-3
.
2.2 Viscometer
A falling body viscometer was used for the measurements. It is based on the falling time
measurement of a body (a cylinder in our case) when it falls through a vertical pipe containing
the fluid whose viscosity we wish to know. The apparatus is able to measure in wide pressure
ranges, from 0.1 MPa to 140 MPa, and temperature, from 253.15 K to 523.15 K.
The cell, where measurements take place, was designed by the Groupe de Haute Pression,
Laboratoire des Fluides Complexes of the University of Pau [9], and its full experimental
setup was developed and improved at the TERMOCAL laboratory.
Considering that the body reaches its terminal velocity without eccentricity and laminar flow,
equation (1) could theoretically describe the behaviour of this sort of viscometers. This
expression is based on the Stokes' law and Newton's second law:

(1)
The terms of the expression (1) are: η the viscosity, K a calibration constant which depends on
the apparatus and the falling body, Δρ the difference between the density of the body material
and the liquid density, and Δt the time registered between two coils.
In an ideal case, K could be determined without any calibration from the dimensions of the
instrument, the mass of the falling cylinder and its density using a mathematical expression.
However, in practice, this is not advisable because real operation of this instrument differs
from the simplified model given by that mathematical expression in several factors [10,11],
which is why a calibration procedure is always performed in this kind of viscometer. Several
ways of calibration based on equation (1) have been successfully performed [12]: from the
use of a single calibration constant modified by thermal expansion coefficients to using
several calibration constants for each temperature and pressure set.
In our case, the model described by equation (1) fits the range of viscosities considering in
this work (up to 5 mPa·s approximately) quite well. However, adding an independent term
(intercept) to the expression (1) has allowed us to achieve a better approach to the behaviour
of our viscometer. Expression (2) is therefore used in this work:
(2)
Although this expression has already been used by other authors, it is important to highlight
how it is used. As will be shown in the calibration procedure, equation (2) would be applied
regardless temperature and pressure. This offers a substantial advantage since we can measure
at any temperature and pressure condition with a single fitting, as long as measured viscosities
are within its calibration range.
The experimental setup was developed in full at the TERMOCAL laboratory using high
pressure equipment and was described in [13]. The principal elements are the measuring cell,
a rotary valve which allows us to rotate the cell automatically, a thermostatic bath (Julabo

F81-ME), a pressure generator (HiP 50-5.75-30), a digital gauge (Druck DPI 104), a vacuum
pump (Leybold TRIVAC D8B) with a cold trap, and the electronic devices: 16 Ch.
Multifunction Data Acquisition Unit 16 bits (Agilent U2352A), Data Acquisition Unit for the
temperature (Agilent 34970A), Arbitrary Waveform Generator (Agilent, 33220A). In
addition, resistance thermometers attached to the coils were installed to control temperature
and another pressure generator (HiP 50-6-15) linked to an engine was added to control the
pressure automatically.
The measuring cell, which is the core of this viscometer, is presented in Figure 1. It has two
concentric tubes whose length is 400 mm and their diameters are 6.52 mm and 8.1 mm. Both
of them are filled with the pressurized liquid, maintaining the same pressure inside and
outside the inner tube and avoiding any risk of deformation. In addition, four coils, spaced 50
mm apart, are arranged around the tube. Those coils are placed towards the bottom so as to
favour terminal velocity being reached. It has been proved in a previous work [14] that
terminal velocity is reached in all the cases. Thus, in order to avoid signal interferences
between coils, the two intermediate coils are disconnected, and the time from the first to the
fourth coil (separated by 150 mm) is taken. Tubes and coils are surrounded by a thermostatic
fluid which flows from the bath. The falling cylinder (shown in Figure 1) is made of magnetic
stainless steel with a hemispherical end and has a length of 20 mm and a diameter of 6.20
mm. The density of the body (approximately constant) is determined using a pycnometer =
(7.673 ± 0.017) g·cm-3
. The relationship between the diameter of the inner tube and the
diameter of the falling body is 0.951. This value is higher than the critical value of 0.93
established by Chen et al. [15] and also higher than the more conservative value of 0.95
established by Vant and used by Schaschke et al. [16] and Zeng et al. [11]. Working below
those values could cause undesirable eccentricity effects.

Figure 1. Measuring cell with two operating coils.
A time measurement system was designed and described previously [7,17] and allows time to
be measured with an expanded uncertainty ( k = 2) of ± 0.01 s.
A computer program using Agilent VEE Pro software was developed in full at the
TERMOCAL laboratory to record all the parameters involved in our measurements (falling
time, pressure, temperature…). This time measurement system is an important improvement
for such falling body techniques and provide accurate time measurements which implies
accurate viscosities.
2.3 Materials
The materials used in the calibration and the measurements were used without further
purification and their purity was checked by gas chromatography. Table 1 summarizes their
characteristics.

Table 1. Material description.
Compound Source Mass fraction
puritya
Water content (%) Purification
method
n-Dodecane Sigma-Aldrich ≥ 0.99 Máx. 0.01 None
1-Butanol Sigma-Aldrich ≥ 0.995
Máx. 0.1
(157.5 ppm) None
MDEA Aldrich Chemistry ≥ 0.999 Máx. 0.1 None
MEA Sigma-Aldrich ≥ 0.998 Máx. 0.14 None
Water Sigma-Aldrich Conductivity ≤ 2·10-6
ohm-1
·cm-1
None
a As stated by the supplier and checked by gas chromatography.
2.4 Viscometer calibration
Calibration of the falling body viscometer was performed from 0.1 MPa to 120 MPa and from
293.15 K to 353.15 K with n-dodecane as calibration fluid and the correlation proposed by
Caudwell et al. [18] was used. It is important to highlight that Caudwell et al. [18] correlation
begins at 298.15 K, so data for calibration at 293.15 K were also taken from [13], both data
based on vibrating wire viscometer measurements.
Fall time was recorded considering fifteen repetitions for each pressure and temperature.
After that, calibration consists of fitting all points (figure 2) using the model expressed by
equation (2), whose R-squared value indicates that the model defined by the parameters given
in table 2 explains 99.89 % of variability.

Figure 2. Falling body viscometer calibration fitting using n-dodecane as reference fluid.
Table 2. Coefficients of equation (2) obtained for the falling body viscometer calibration with
n-dodecane.
Parameters Standard deviation
a / mPa∙s -4.49383∙10-2
8.7∙10-3
b / mPa∙m3·kg
-1 2.77769∙10
-5 1.1∙10
-7
According to the procedure described, the range of the present calibration is from = 0.630
mPa·s (n-dodecane at T = 353.15 K and p = 0.1 MPa) to = 4.929 mPa·s (n-dodecane at T =
293.15 K and p = 120 MPa).
0.00
1.00
2.00
3.00
4.00
5.00
6.00
0 50 100 150 200
η /
mP
a·s
Δt · (ρs - ρl) · 10-3 /s·kg·m-3

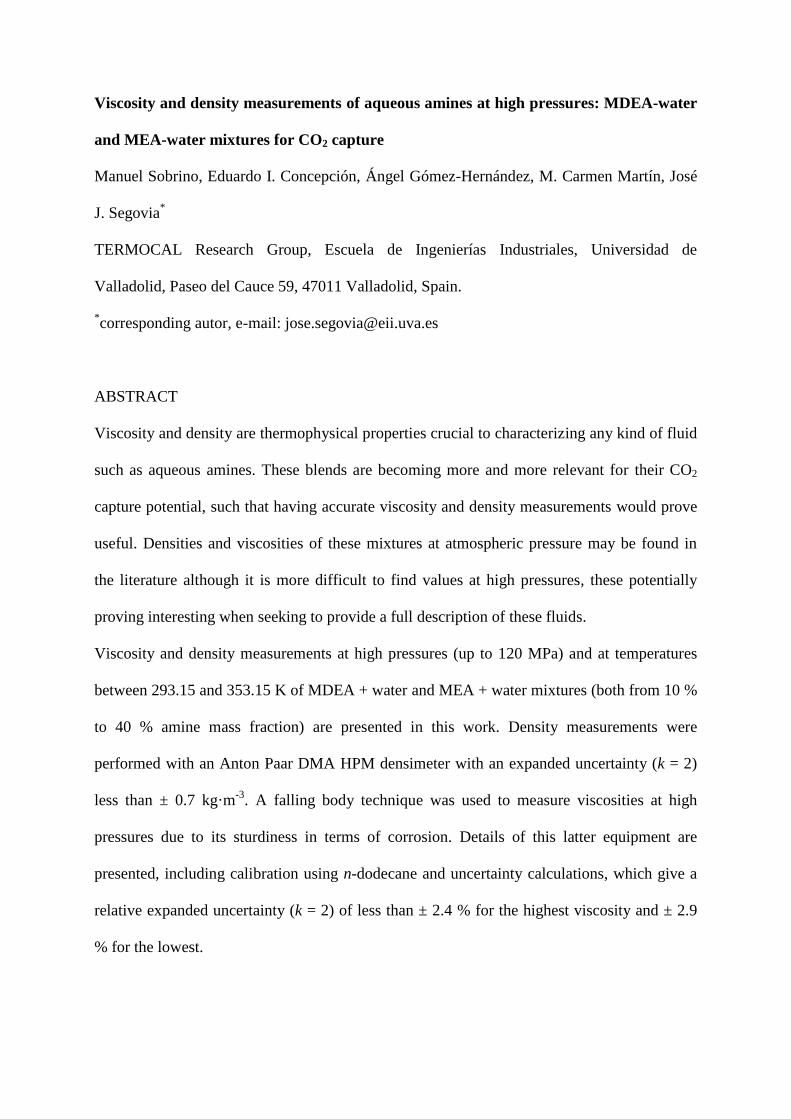
2.5. Uncertainty calculation for viscosity
Uncertainty calculation was carried out following the model expressed by equation (2) and
the procedure described in JCGM 100:2008 [8] and its results are presented in tables 3 and 4
[17]. Uncertainty was evaluated at the limits of the calibration viscosity range for the studied
mixtures, whose results are presented in the next section: the lowest viscosity (0.617 mPa·s,
MDEA 20 % + H2O at T = 353.15 K and p = 0.1 MPa) and the highest viscosity (4.954
mPa·s, MEA 40 % + H2O at T = 293.15 K and p = 120 MPa). It has been considered a normal
distribution with a coverage factor k = 2 (confidence level of 95.45 %), obtaining a relative
expanded uncertainty which varies from ± 2.4 % to ± 2.9 % for the highest and lowest
viscosities, respectively. It is interesting to highlight that the most significant contribution in
both cases is the uncertainty associated to calibration function coefficients.

Table 3. Uncertainty calculation of dynamic viscosity, η, for MEA (1)+ H2O (2) (w1 = 0.4001)
at p = 120 MPa and T = 293.15 K.
Amount Estimate Units
Probability
Distribution
Standard
Uncertainty
Coefficient
of
Sensitivity
Contribution
to
Uncertainty
Xi xi u(xi) ci u(y)
Reference
Fluid
Viscosity 4.954 mPa·s Normal 0.050 1 0.050
Time
Calibration s Normal 0.005 0.19 0.0010
Resolution 27.20 s Rectangular 0.0029 0.19 0.00056
Repeatability s Normal 0.070 0.19 0.014
Temperature
Calibration K Normal 0.010 0.085 0.00085
Resolution 293.15 K Rectangular 0.0029 0.085 0.00025
Uniformity K Rectangular 0.029 0.085 0.0025
Stability K Rectangular 0.014 0.085 0.0012
Pressure
Calibration MPa Normal 0.00001 0.040 0.0000
Resolution 120 MPa Rectangular 0.0029 0.040 0.00012
Stability MPa Rectangular 0.014 0.040 0.00058
Density
Solid 7673 kg·m-3
Normal 17 0.00073 0.012
Fluid 1056.3 kg·m-3
Normal 0.42 0.00073 0.00031
Calibration
function
coefficients
mPa·s Normal 0.030 1 0.030
Standard Uncertainty mPa·s u(y) ± 0.061
Expanded Uncertainty (k=2) mPa·s U(y) ± 0.12
Relative Expanded Uncertainty (k=2) (mPa·s/mPa·s) Ur(y) ± 0.024
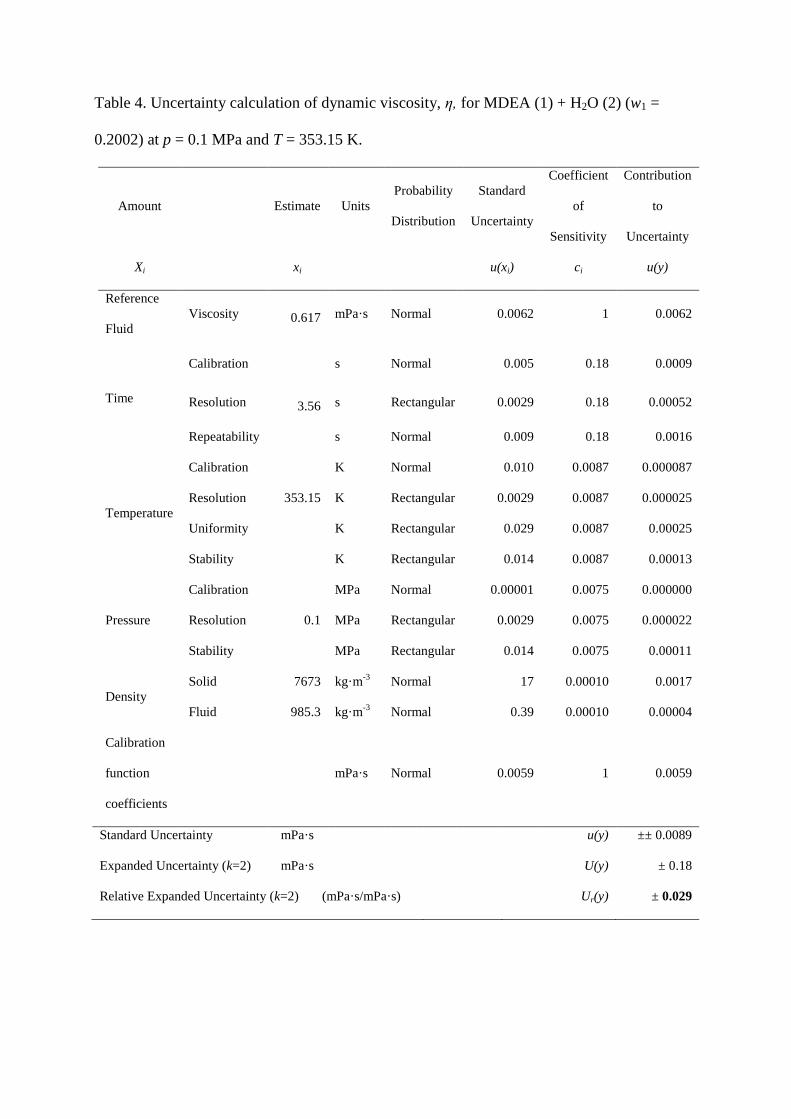
Table 4. Uncertainty calculation of dynamic viscosity, η, for MDEA (1) + H2O (2) (w1 =
0.2002) at p = 0.1 MPa and T = 353.15 K.
Amount Estimate Units
Probability
Distribution
Standard
Uncertainty
Coefficient
of
Sensitivity
Contribution
to
Uncertainty
Xi xi u(xi) ci u(y)
Reference
Fluid
Viscosity 0.617 mPa·s Normal 0.0062 1 0.0062
Time
Calibration s Normal 0.005 0.18 0.0009
Resolution 3.56 s Rectangular 0.0029 0.18 0.00052
Repeatability s Normal 0.009 0.18 0.0016
Temperature
Calibration K Normal 0.010 0.0087 0.000087
Resolution 353.15 K Rectangular 0.0029 0.0087 0.000025
Uniformity K Rectangular 0.029 0.0087 0.00025
Stability K Rectangular 0.014 0.0087 0.00013
Pressure
Calibration MPa Normal 0.00001 0.0075 0.000000
Resolution 0.1 MPa Rectangular 0.0029 0.0075 0.000022
Stability MPa Rectangular 0.014 0.0075 0.00011
Density
Solid 7673 kg·m-3
Normal 17 0.00010 0.0017
Fluid 985.3 kg·m-3
Normal 0.39 0.00010 0.00004
Calibration
function
coefficients
mPa·s Normal 0.0059 1 0.0059
Standard Uncertainty mPa·s u(y) ±± 0.0089
Expanded Uncertainty (k=2) mPa·s U(y) ± 0.18
Relative Expanded Uncertainty (k=2) (mPa·s/mPa·s) Ur(y) ± 0.029

4. Results and discussion
Density measurements of aqueous solutions of methyldiethanolamine (MDEA) and
monoethanolamina (MEA) were performed at pressures from 0.1 to 140 MPa for MDEA and
up to 120 MPa for MEA and six temperatures from 293.15 to 393.15 K for different amine
mass fractions: 0.1, 0.2, 0.3 and 0.4. These experimental results are summarized in table 5 for
MDEA and table 6 for MEA.
Table 5. Experimental densities, ρ, for MDEA (1) + H2O (2) mixtures at different conditions
of temperature, T, pressure, p, and mass fraction, w1.a
ρ/kg·m-3
T/K
p/MPa 293.15 313.15 333.15 353.15 373.15 393.15
w1 = 0.1000
0.1 1007.0 1000.2 990.5 978.6 964.4 948.6
0.5 1007.2 1000.4 990.6 978.7 964.6 949.0
1 1007.4 1000.6 990.8 978.9 964.9 949.2
2 1007.8 1001.0 991.3 979.3 965.3 949.6
5 1009.0 1002.2 992.5 980.6 966.7 951.1
10 1011.1 1004.3 994.6 982.8 969.0 953.6
15 1013.2 1006.3 996.6 984.9 971.2 956.0
20 1015.3 1008.2 998.6 987.0 973.5 958.5
30 1019.4 1012.3 1002.6 991.2 977.9 963.0
40 1023.4 1016.2 1006.7 995.2 982.1 967.6
50 1027.3 1019.9 1010.4 999.1 986.2 971.8
60 1031.1 1023.8 1014.2 1003.1 990.1 976.2
70 1035.0 1027.4 1017.9 1006.9 994.2 980.4
80 1038.5 1031.0 1021.6 1010.5 998.1 984.3

90 1042.2 1034.5 1025.1 1014.0 1001.8 988.3
100 1045.7 1038.2 1028.5 1017.7 1005.3 992.1
110 1049.2 1041.5 1031.9 1021.2 1009.0 995.9
120 1052.7 1044.9 1035.4 1024.6 1012.6 999.6
130 1056.1 1048.1 1038.7 1028.0 1016.0 1003.1
140 1059.5 1051.4 1042.0 1031.2 1019.4 1006.7
w1 = 0.2002
0.1 1016.5 1008.5 997.8 985.3 970.5 954.0
0.5 1016.6 1008.6 998.0 985.3 970.7 954.4
1 1016.8 1008.8 998.2 985.5 970.9 954.6
2 1017.2 1009.2 998.6 985.9 971.4 955.2
5 1018.4 1010.4 999.8 987.2 972.8 956.7
10 1020.3 1012.3 1001.8 989.4 975.0 959.2
15 1022.2 1014.2 1003.8 991.5 977.2 961.6
20 1024.2 1016.1 1005.7 993.5 979.5 964.0
30 1028.0 1019.9 1009.7 997.6 983.9 968.5
40 1031.8 1023.7 1013.6 1001.6 988.2 973.1
50 1035.4 1027.3 1017.2 1005.5 992.1 977.3
60 1039.0 1031.0 1020.9 1009.3 996.1 981.7
70 1042.6 1034.4 1024.4 1012.9 1000.0 985.9
80 1045.9 1037.9 1027.9 1016.6 1003.8 989.8
90 1049.4 1041.2 1031.3 1020.0 1007.4 993.7
100 1052.8 1044.7 1034.7 1023.6 1011.1 997.5
110 1056.0 1047.9 1038.0 1027.0 1014.7 1001.4
120 1059.3 1051.1 1041.4 1030.4 1018.3 1005.0
130 1062.6 1054.3 1044.5 1033.6 1021.5 1008.5
140 1065.6 1057.4 1047.7 1036.8 1025.0 1012.0
w1 = 0.3000

0.1 1026.7 1017.2 1005.4 992.0 976.5 959.6
0.5 1026.9 1017.4 1005.6 992.0 976.6 959.9
1 1027.1 1017.5 1005.7 992.2 976.9 960.1
2 1027.4 1017.9 1006.2 992.7 977.4 960.6
5 1028.6 1019.1 1007.3 993.9 978.7 962.1
10 1030.4 1020.9 1009.3 996.1 981.1 964.7
15 1032.2 1022.8 1011.3 998.2 983.4 967.1
20 1034.1 1024.6 1013.2 1000.3 985.6 969.6
30 1037.7 1028.4 1017.0 1004.3 989.8 974.2
40 1041.2 1032.0 1020.9 1008.1 994.1 978.7
50 1044.6 1035.5 1024.3 1012.0 998.1 983.0
60 1048.0 1039.0 1027.9 1015.9 1002.1 987.4
70 1051.4 1042.3 1031.5 1019.5 1005.9 991.6
80 1054.6 1045.5 1034.9 1023.0 1009.8 995.4
90 1057.9 1048.7 1038.1 1026.4 1013.3 999.4
100 1061.1 1052.0 1041.6 1029.9 1017.0 1003.1
110 1064.1 1055.2 1044.6 1033.3 1020.5 1006.9
120 1067.2 1058.3 1047.9 1036.6 1024.0 1010.6
130 1070.3 1061.3 1051.0 1039.8 1027.4 1014.1
140 1073.2 1064.5 1054.2 1042.9 1030.7 1017.6
w1 = 0.4000
0.1 1036.6 1025.5 1012.4 998.1 981.9 964.2
0.5 1036.8 1025.6 1012.7 998.2 982.1 964.7
1 1036.9 1025.8 1012.8 998.4 982.4 964.8
2 1037.3 1026.2 1013.2 998.8 982.8 965.4
5 1038.3 1027.3 1014.4 1000.1 984.2 966.9
10 1040.1 1029.2 1016.4 1002.3 986.5 969.5

15 1041.9 1031.0 1018.4 1004.4 988.8 972.0
20 1043.6 1032.8 1020.3 1006.5 991.1 974.5
30 1047.1 1036.3 1024.1 1010.5 995.5 979.2
40 1050.4 1040.0 1027.9 1014.4 999.8 983.9
50 1053.8 1043.2 1031.4 1018.2 1003.7 988.1
60 1057.1 1046.6 1035.0 1022.0 1007.7 992.5
70 1060.3 1050.0 1038.4 1025.6 1011.6 996.8
80 1063.3 1053.1 1041.6 1029.1 1015.4 1000.8
90 1066.4 1056.2 1044.9 1032.6 1019.0 1004.6
100 1069.5 1059.5 1048.2 1036.0 1022.6 1008.5
110 1072.4 1062.5 1051.3 1039.3 1026.2 1012.3
120 1075.4 1065.5 1054.5 1042.5 1029.7 1015.9
130 1078.4 1068.4 1057.5 1045.8 1033.0 1019.4
140 1081.1 1071.4 1060.6 1048.9 1036.3 1023.0
a Standard uncertainties u are: u(T) = 0.01 K; ur(p) = 0.0001 (kPa/kPa); u(w) = 0.0001 and
u() = 0.35 kg·m-3
Table 6. Experimental densities, ρ, for MEA (1) + H2O (2) mixtures at different conditions of
temperature, T, pressure, p, and mass fraction, w1.a
ρ/kg·m-3
T/K
p/MPa 293.15 313.15 333.15 353.15 373.15 393.15
w1 = 0.1001
0.1 1002.5 995.9 986.3 974.7 960.8 945.2
0.5 1002.7 996.0 986.5 974.7 961.0 945.6
1 1002.9 996.3 986.7 975.0 961.3 945.8
2 1003.3 996.6 987.1 975.4 961.8 946.3
5 1004.6 997.9 988.4 976.7 963.1 947.8
10 1006.7 1000.0 990.5 978.9 965.5 950.3
15 1008.8 1002.0 992.6 981.1 967.7 952.7
20 1010.9 1004.0 994.6 983.2 969.9 955.2
30 1015.1 1008.1 998.6 987.4 974.4 959.8
40 1019.1 1012.1 1002.7 991.4 978.7 964.4
50 1023.0 1015.9 1006.5 995.4 982.8 968.7
60 1026.9 1019.8 1010.4 999.4 986.8 973.0
70 1030.8 1023.4 1014.1 1003.1 990.8 977.3
80 1034.5 1027.0 1017.7 1006.9 994.8 981.3
90 1038.2 1030.6 1021.3 1010.5 998.5 985.2
100 1041.8 1034.2 1024.8 1014.1 1002.2 989.1
110 1045.2 1037.6 1028.1 1017.7 1005.9 993.0
120 1048.8 1041.1 1031.7 1021.2 1009.6 996.7
w1 = 0.2000
0.1 1006.9 999.1 988.8 976.7 962.5 946.5
0.5 1007.0 999.2 988.9 976.7 962.7 946.9
1 1007.2 999.4 989.1 976.9 962.9 947.0
2 1007.6 999.8 989.5 977.4 963.4 947.5
5 1008.7 1001.0 990.7 978.6 964.7 949.0
10 1010.7 1002.9 992.7 980.8 966.9 951.5
15 1012.6 1004.8 994.7 982.9 969.1 953.8
20 1014.5 1006.7 996.6 984.9 971.3 956.2
30 1018.4 1010.5 1000.5 988.9 975.6 960.7
40 1022.1 1014.3 1004.5 992.9 979.8 965.2
50 1025.8 1017.9 1008.0 996.7 983.7 969.4
60 1029.4 1021.5 1011.7 1000.6 987.7 973.6
70 1033.0 1025.0 1015.2 1004.2 991.5 977.8

80 1036.2 1028.5 1018.7 1007.7 995.4 981.6
90 1039.7 1031.8 1022.1 1011.3 999.0 985.6
100 1043.2 1035.1 1025.5 1014.7 1002.5 989.4
110 1046.4 1038.4 1028.8 1018.2 1006.1 993.0
120 1049.6 1041.8 1032.2 1021.6 1009.6 996.7
w1 = 0.3005
0.1 1012.3 1003.2 992.0 979.2 964.5 948.4
0.5 1012.5 1003.4 992.3 979.4 964.8 948.8
1 1012.7 1003.6 992.4 979.6 965.0 948.9
2 1013.0 1004.0 992.8 980.0 965.5 949.4
5 1014.1 1005.1 994.0 981.2 966.8 950.9
10 1016.0 1007.0 996.0 983.3 969.0 953.3
15 1017.7 1008.8 997.9 985.4 971.2 955.7
20 1019.6 1010.6 999.7 987.4 973.4 958.1
30 1023.2 1014.3 1003.5 991.4 977.6 962.6
40 1026.6 1017.9 1007.3 995.2 981.7 967.0
50 1030.0 1021.3 1010.8 999.0 985.6 971.1
60 1033.5 1024.8 1014.4 1002.7 989.5 975.3
70 1036.9 1028.2 1017.8 1006.2 993.3 979.5
80 1040.0 1031.4 1021.1 1009.8 997.1 983.2
90 1043.3 1034.5 1024.4 1013.1 1000.8 987.1
100 1046.6 1037.9 1027.7 1016.6 1004.2 990.9
110 1049.6 1041.0 1031.0 1020.0 1007.7 994.6
120 1052.6 1044.1 1034.2 1023.3 1011.1 998.2
w1 = 0.4000
0.1 1018.1 1007.5 995.3 981.9 966.6 950.0
0.5 1018.1 1007.7 995.6 982.0 966.9 950.4
1 1018.3 1007.9 995.8 982.2 967.1 950.6

2 1018.6 1008.3 996.2 982.6 967.6 951.1
5 1019.6 1009.3 997.3 983.9 968.9 952.5
10 1021.4 1011.2 999.3 986.0 971.1 955.0
15 1023.1 1012.9 1001.1 988.0 973.3 957.3
20 1024.8 1014.7 1003.0 990.0 975.4 959.7
30 1028.3 1018.2 1006.7 993.9 979.7 964.3
40 1031.6 1021.7 1010.4 997.7 983.8 968.7
50 1034.8 1025.1 1013.8 1001.4 987.6 972.8
60 1038.1 1028.4 1017.3 1005.1 991.6 977.0
70 1041.4 1031.7 1020.7 1008.6 995.2 981.1
80 1044.3 1034.8 1024.0 1012.1 999.1 985.0
90 1047.5 1037.8 1027.1 1015.3 1002.5 988.8
100 1050.4 1041.1 1030.3 1018.7 1006.0 992.5
110 1053.3 1044.0 1033.5 1022.1 1009.5 996.2
120 1056.3 1047.0 1036.7 1025.2 1012.9 999.7
a Standard uncertainties u are: u(T) = 0.01 K; ur(p) = 0.0001 (kPa/kPa); u(w) = 0.0001 and
u() = 0.35 kg·m-3
Density measurements show that densities of aqueous solutions of MDEA are always higher
than the densities of aqueous solutions of MEA for the same conditions of temperature,
pressure and composition. The density of these mixtures increases when the weight fraction of
the amine is higher and this effect is greater for the solutions with MDEA. Thus, the density
differences between MDEA and MEA solutions are higher when the weight fraction of the
amine increases. As is expected, density increases when pressure increases or temperature
decreases, and these effects are similar for both amine solutions.
The experimental values were correlated using a modified Tammann-Tait equation (equation
(3)) for each composition:

MPaTBTBB
pTBTBBC
TATAApT
1.0ln1
,
2
210
2
210
2
210 (3)
These results are given in table 7 which contains the fitting parameters and the standard
deviation. As can be seen, the experimental results correlate quite well using this equation (3).
Although better results are obtained for the mixtures with MDEA, standard deviations are
lower than density uncertainties for both amines.
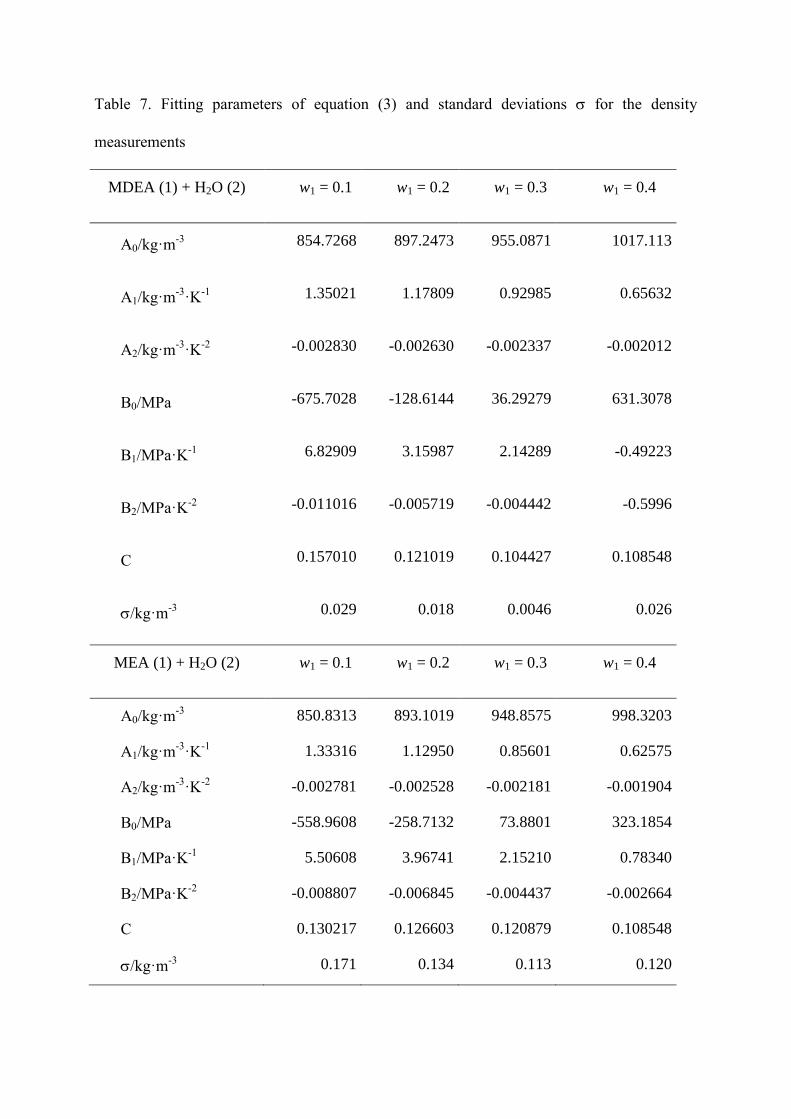
Table 7. Fitting parameters of equation (3) and standard deviations for the density
measurements
MDEA (1) + H2O (2) w1 = 0.1 w1 = 0.2 w1 = 0.3 w1 = 0.4
A0/kg·m-3
854.7268 897.2473 955.0871 1017.113
A1/kg·m-3
·K-1
1.35021 1.17809 0.92985 0.65632
A2/kg·m-3
·K-2
-0.002830 -0.002630 -0.002337 -0.002012
B0/MPa -675.7028 -128.6144 36.29279 631.3078
B1/MPa·K-1
6.82909 3.15987 2.14289 -0.49223
B2/MPa·K-2
-0.011016 -0.005719 -0.004442 -0.5996
C 0.157010 0.121019 0.104427 0.108548
/kg·m-3
0.029 0.018 0.0046 0.026
MEA (1) + H2O (2) w1 = 0.1 w1 = 0.2 w1 = 0.3 w1 = 0.4
A0/kg·m-3
850.8313 893.1019 948.8575 998.3203
A1/kg·m-3
·K-1
1.33316 1.12950 0.85601 0.62575
A2/kg·m-3
·K-2
-0.002781 -0.002528 -0.002181 -0.001904
B0/MPa -558.9608 -258.7132 73.8801 323.1854
B1/MPa·K-1
5.50608 3.96741 2.15210 0.78340
B2/MPa·K-2
-0.008807 -0.006845 -0.004437 -0.002664
C 0.130217 0.126603 0.120879 0.108548
/kg·m-3
0.171 0.134 0.113 0.120
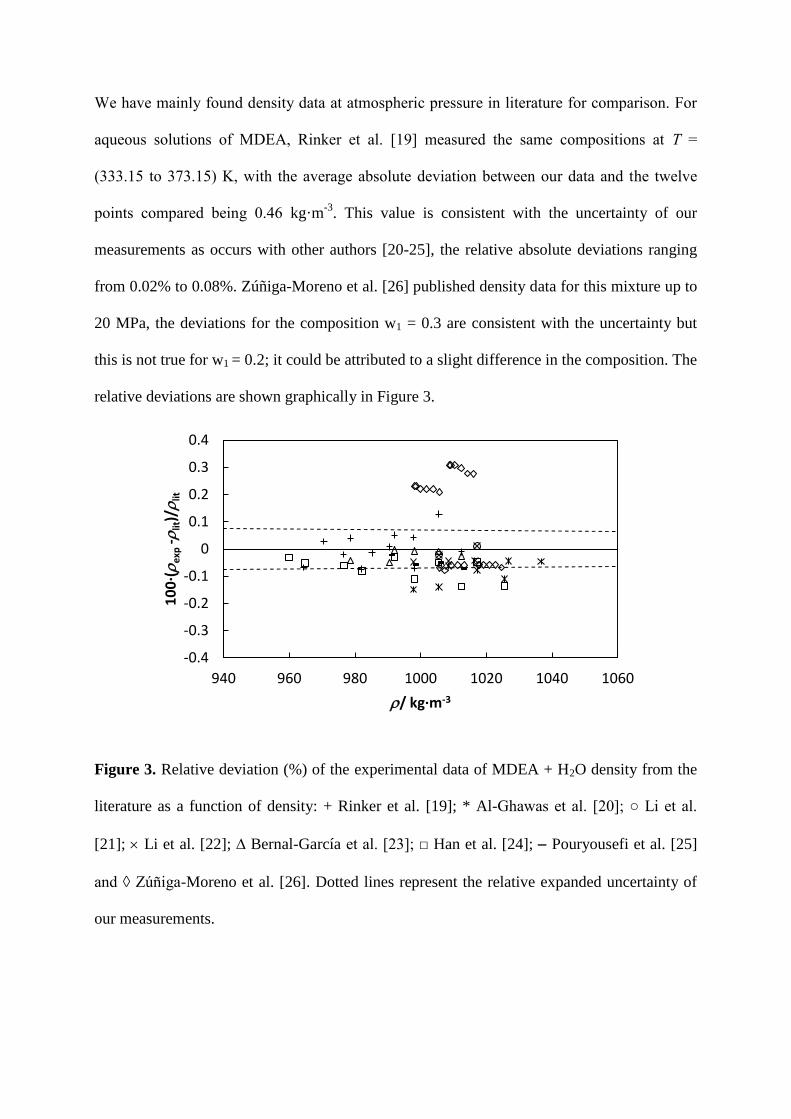
We have mainly found density data at atmospheric pressure in literature for comparison. For
aqueous solutions of MDEA, Rinker et al. [19] measured the same compositions at T =
(333.15 to 373.15) K, with the average absolute deviation between our data and the twelve
points compared being 0.46 kg·m-3
. This value is consistent with the uncertainty of our
measurements as occurs with other authors [20-25], the relative absolute deviations ranging
from 0.02% to 0.08%. Zúñiga-Moreno et al. [26] published density data for this mixture up to
20 MPa, the deviations for the composition w1 = 0.3 are consistent with the uncertainty but
this is not true for w1 = 0.2; it could be attributed to a slight difference in the composition. The
relative deviations are shown graphically in Figure 3.
Figure 3. Relative deviation (%) of the experimental data of MDEA + H2O density from the
literature as a function of density: + Rinker et al. [19]; * Al-Ghawas et al. [20]; Li et al.
[21]; Li et al. [22]; Bernal-García et al. [23]; Han et al. [24]; Pouryousefi et al. [25]
and ◊ Zúñiga-Moreno et al. [26]. Dotted lines represent the relative expanded uncertainty of
our measurements.
-0.4
-0.3
-0.2
-0.1
0
0.1
0.2
0.3
0.4
940 960 980 1000 1020 1040 1060
10
0·(
exp -
lit)/
lit
/ kg·m-3

As regards MEA solutions, the relative absolute deviations, with different literature data, were
0.02% [25], with the same range of compositions and three temperatures at p = 0.1 MPa
(twelve points in common), 0.14% [27] (only two points for comparison) 0.04% [28] (one
point), 0.01% (four points in common) [29] and 0.06% [30] (ten points for comparison).
Figure 4 shows these relative deviations.
Figure 4. Relative deviation (%) of the experimental data of MEA + H2O density from the
literature as a function of density: Pouryousefi et al. [25] ; Paul et al. [27]; ◊ Tseng et al.
[28]; Amundsen et al. [29] and + Han et al. [30]. Dotted lines represent the relative
expanded uncertainty of our measurements.
Viscosity measurements of aqueous solutions of methyldiethanolamine (MDEA) and
monoethanolamina (MEA) were performed for different amine mass fractions: 0.1, 0.2, 0.3
and 0.4, at p = (0.1 to 120) MPa and four temperatures from 293.15 to 353.15 K using the
falling body viscometer. Experimental data are presented in table 8 for MDEA and table 9 for
MEA.
-0.4
-0.3
-0.2
-0.1
0
0.1
0.2
0.3
0.4
940.0 960.0 980.0 1000.0 1020.0 1040.0 1060.0
10
0·(
exp-
lit)/
lit
/ kg·m-3

It is important to remember the limits of the calibration used = (0.630 to 4.929) mPa·s. This
is why viscosities of 10% w MDEA + H2O at T = 353.15 K, of 40% w MDEA + H2O at T =
293.15 K, viscosities of 10% w MEA + H2O at T = 353.15 K or of 20% w MEA + H2O at T =
353.15 K (up to 40 MPa) are not given, since said viscosities were outside the calibration
range and could not thus be measured using this calibration. However, there are certain
viscosity values which are slightly below or above these limits imposed by calibration with n-
dodecane which might be permissible considering their uncertainties.
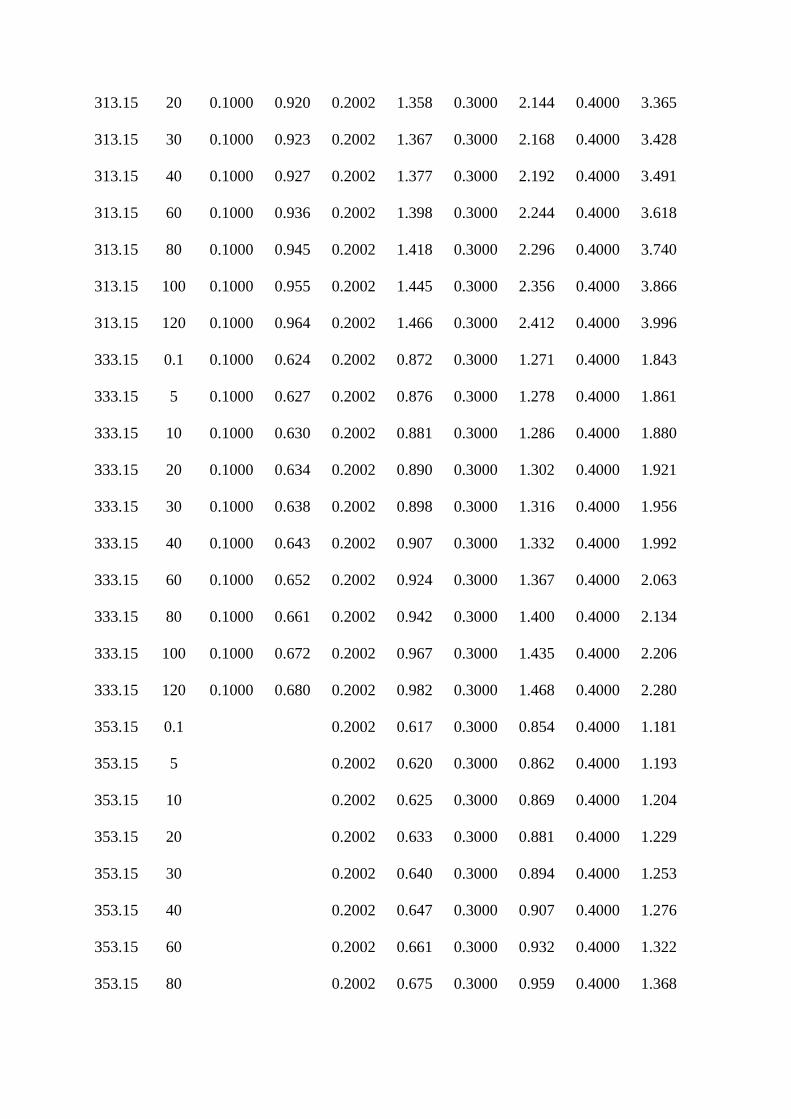
Table 8. Experimental dynamic viscosities , for the MDEA (1) + H2O (2) system at different
conditions of temperature, T, pressure, p, and mass fraction, w1.a
T/K p/MPa w1 /mPa·s w1 /mPa·s w1 /mPa·s w1 /mPa·s
293.15 0.1 0.1000 1.476 0.2002 2.350 0.3000 3.999
293.15 5 0.1000 1.475 0.2002 2.353 0.3000 4.018
293.15 10 0.1000 1.475 0.2002 2.357 0.3000 4.038
293.15 20 0.1000 1.471 0.2002 2.364 0.3000 4.077
293.15 30 0.1000 1.472 0.2002 2.372 0.3000 4.114
293.15 40 0.1000 1.470 0.2002 2.380 0.3000 4.153
293.15 60 0.1000 1.474 0.2002 2.399 0.3000 4.231
293.15 80 0.1000 1.477 0.2002 2.419 0.3000 4.311
293.15 100 0.1000 1.485 0.2002 2.437 0.3000 4.390
293.15 120 0.1000 1.492 0.2002 2.464 0.3000 4.478
313.15 0.1 0.1000 0.912 0.2002 1.345 0.3000 2.095 0.4000 3.238
313.15 5 0.1000 0.914 0.2002 1.347 0.3000 2.106 0.4000 3.270
313.15 10 0.1000 0.915 0.2002 1.349 0.3000 2.118 0.4000 3.302
313.15 20 0.1000 0.920 0.2002 1.358 0.3000 2.144 0.4000 3.365
313.15 30 0.1000 0.923 0.2002 1.367 0.3000 2.168 0.4000 3.428
313.15 40 0.1000 0.927 0.2002 1.377 0.3000 2.192 0.4000 3.491
313.15 60 0.1000 0.936 0.2002 1.398 0.3000 2.244 0.4000 3.618
313.15 80 0.1000 0.945 0.2002 1.418 0.3000 2.296 0.4000 3.740
313.15 100 0.1000 0.955 0.2002 1.445 0.3000 2.356 0.4000 3.866
313.15 120 0.1000 0.964 0.2002 1.466 0.3000 2.412 0.4000 3.996
333.15 0.1 0.1000 0.624 0.2002 0.872 0.3000 1.271 0.4000 1.843
333.15 5 0.1000 0.627 0.2002 0.876 0.3000 1.278 0.4000 1.861
333.15 10 0.1000 0.630 0.2002 0.881 0.3000 1.286 0.4000 1.880
333.15 20 0.1000 0.634 0.2002 0.890 0.3000 1.302 0.4000 1.921
333.15 30 0.1000 0.638 0.2002 0.898 0.3000 1.316 0.4000 1.956
333.15 40 0.1000 0.643 0.2002 0.907 0.3000 1.332 0.4000 1.992
333.15 60 0.1000 0.652 0.2002 0.924 0.3000 1.367 0.4000 2.063
333.15 80 0.1000 0.661 0.2002 0.942 0.3000 1.400 0.4000 2.134
333.15 100 0.1000 0.672 0.2002 0.967 0.3000 1.435 0.4000 2.206
333.15 120 0.1000 0.680 0.2002 0.982 0.3000 1.468 0.4000 2.280
353.15 0.1 0.2002 0.617 0.3000 0.854 0.4000 1.181
353.15 5 0.2002 0.620 0.3000 0.862 0.4000 1.193
353.15 10 0.2002 0.625 0.3000 0.869 0.4000 1.204
353.15 20 0.2002 0.633 0.3000 0.881 0.4000 1.229
353.15 30 0.2002 0.640 0.3000 0.894 0.4000 1.253
353.15 40 0.2002 0.647 0.3000 0.907 0.4000 1.276
353.15 60 0.2002 0.661 0.3000 0.932 0.4000 1.322
353.15 80 0.2002 0.675 0.3000 0.959 0.4000 1.368

353.15 100 0.2002 0.691 0.3000 0.997 0.4000 1.419
353.15 120 0.2002 0.705 0.3000 1.018 0.4000 1.467
a Standard uncertainties u are: u(T) = 0.01 K; ur(p) = 0.0001 (kPa/kPa); u(w) = 0.0001; ur() =
0.015 (mPa·s / mPa·s )
Table 9. Experimental dynamic viscosities , for the MEA (1) + H2O (2) system at different
conditions of temperature, T, pressure, p, and mass fraction, w1.a
T/K p/MPa w1 /mPa·s w1 /mPa·s w1 /mPa·s w1 /mPa·s
293.15 0.1 0.1001 1.435 0.2000 1.968 0.3005 2.913 0.4001 4.315
293.15 5 0.1001 1.435 0.2000 1.970 0.3005 2.921 0.4001 4.340
293.15 10 0.1001 1.434 0.2000 1.969 0.3005 2.930 0.4001 4.368
293.15 20 0.1001 1.430 0.2000 1.973 0.3005 2.952 0.4001 4.426
293.15 30 0.1001 1.430 0.2000 1.977 0.3005 2.972 0.4001 4.475
293.15 40 0.1001 1.429 0.2000 1.983 0.3005 2.990 0.4001 4.528
293.15 60 0.1001 1.431 0.2000 1.994 0.3005 3.032 0.4001 4.628
293.15 80 0.1001 1.434 0.2000 2.009 0.3005 3.076 0.4001 4.739
293.15 100 0.1001 1.432 0.2000 2.026 0.3005 3.120 0.4001 4.845
293.15 120 0.1001 1.443 0.2000 2.046 0.3005 3.162 0.4001 4.954
313.15 0.1 0.1001 0.891 0.2000 1.173 0.3005 1.638 0.4001 2.284
313.15 5 0.1001 0.892 0.2000 1.178 0.3005 1.642 0.4001 2.306
313.15 10 0.1001 0.892 0.2000 1.182 0.3005 1.649 0.4001 2.319
313.15 20 0.1001 0.896 0.2000 1.190 0.3005 1.668 0.4001 2.352
313.15 30 0.1001 0.899 0.2000 1.197 0.3005 1.686 0.4001 2.384
313.15 40 0.1001 0.902 0.2000 1.205 0.3005 1.702 0.4001 2.416
313.15 60 0.1001 0.910 0.2000 1.219 0.3005 1.735 0.4001 2.479

313.15 80 0.1001 0.918 0.2000 1.232 0.3005 1.770 0.4001 2.544
313.15 100 0.1001 0.927 0.2000 1.249 0.3005 1.804 0.4001 2.609
313.15 120 0.1001 0.936 0.2000 1.263 0.3005 1.846 0.4001 2.675
333.15 0.1 0.1001 0.615 0.2000 0.780 0.3005 1.061 0.4001 1.389
333.15 5 0.1001 0.614 0.2000 0.788 0.3005 1.067 0.4001 1.401
333.15 10 0.1001 0.617 0.2000 0.792 0.3005 1.075 0.4001 1.410
333.15 20 0.1001 0.622 0.2000 0.799 0.3005 1.089 0.4001 1.434
333.15 30 0.1001 0.625 0.2000 0.807 0.3005 1.103 0.4001 1.453
333.15 40 0.1001 0.630 0.2000 0.815 0.3005 1.115 0.4001 1.475
333.15 60 0.1001 0.639 0.2000 0.829 0.3005 1.140 0.4001 1.518
333.15 80 0.1001 0.646 0.2000 0.844 0.3005 1.165 0.4001 1.559
333.15 100 0.1001 0.655 0.2000 0.859 0.3005 1.189 0.4001 1.600
333.15 120 0.1001 0.663 0.2000 0.874 0.3005 1.211 0.4001 1.645
353.15 0.1 0.1001 0.2000 0.3005 0.746 0.4001 0.942
353.15 5 0.1001 0.2000 0.3005 0.748 0.4001 0.944
353.15 10 0.1001 0.2000 0.3005 0.755 0.4001 0.957
353.15 20 0.1001 0.2000 0.3005 0.768 0.4001 0.975
353.15 30 0.1001 0.2000 0.3005 0.777 0.4001 0.989
353.15 40 0.1001 0.2000 0.3005 0.787 0.4001 1.006
353.15 60 0.1001 0.2000 0.607 0.3005 0.807 0.4001 1.039
353.15 80 0.1001 0.2000 0.619 0.3005 0.828 0.4001 1.068
353.15 100 0.1001 0.2000 0.632 0.3005 0.847 0.4001 1.097
353.15 120 0.1001 0.2000 0.644 0.3005 0.861 0.4001 1.128
a Standard uncertainties u are: u(T) = 0.01 K; ur(p) = 0.0001 (kPa/kPa); u(w) = 0.0001; ur() =
0.015 (mPa·s / mPa·s )

Viscosities of aqueous solutions of MDEA are always higher than viscosities of aqueous
solutions of MEA under the same conditions of temperature, pressure and composition, as
was also observed for densities. Viscosities of these mixtures increase at greater amine weight
fractions and this effect is slightly higher for solutions with MDEA. Viscosity increases when
pressure increases or temperature decreases, although the effect of temperature is much
greater. These effects are similar for both amine solutions. Moreover, the increase in viscosity
for higher amine weight fractions is more significant at lower temperatures.
Experimental viscosities were correlated using a modified VFT equation proposed by
Comuñas et al. [31]:
)(1.0
)(lnexpexp,
TE
TEpD
CT
BApT (4)
where
2
210)( TETEETE (5)
The results of the correlation, which include the fitting parameters and the standard
deviations, are summarized in table 10. The standard deviations obtained from the fittings are
lower than the uncertainties of the experimental measurements and thus the correlation model
is suitable for describing the viscosity behaviour of this kind of mixtures.
Table 10. Fitting parameters of equation (4) and standard deviation for the viscosity
measurements.
MDEA (1) + H2O (2) w1 = 0.1 w1 = 0.2 w1 = 0.3 w1 = 0.4
A/mPa∙s 0.0015 0.0014 0.0013 0.0018
B/K 1901.9 1903.5 1904.9 1905.1
C/K 17.572 37.900 57.019 59.773
D 1.0238 1.3329 4.9634 0.9208

E0/MPa 2.3741 1.4751 1.4549 -0.1803
E1 /MPa∙K-1
214.85 76.776 72.212 3.5386
E2 /MPa∙K-2
-0.6354 -0.2212 -0.1853 -0.0065
/mPa∙s 0.0080 0.0122 0.0213 0.0190
MEA (1) + H2O (2) w1 = 0.1 w1 = 0.2 w1 = 0.3 w1 = 0.4
A/mPa∙s 0.0015 0.0015 0.0015 0.0014
B/K 1901.8 1902.7 1903.7 1904.8
C/K 15.502 27.922 40.915 55.404
D 0.9940 0.9488 3.0065 0.8551
E0/MPa 3.0884 1.4267 1.4864 -0.7075
E1 /MPa∙K-1
326.09 69.048 79.220 8.8161
E2 /MPa∙K-2
-0.9687 -0.2005 -0.2188 -0.0220
/mPa∙s 0.0078 0.0086 0.0205 0.0219
In order to check the reliability of viscosity data, a comparison was carried out at atmospheric
pressure (due to the lack of these values at high pressures) between viscosities obtained with
our falling body viscometer and the ones obtained using a Stabinger SVM 3000 viscometer
available in our laboratory (table 11).
Table 11. Viscosity comparison between falling body viscometer (FB)a at p = 0.1 MPa and
Stabinger SVM 3000 viscometer (SVM)b at p = 0.093 MPa (atmospheric pressure) for the
mixtures studied.
MDEA (1) + H2O (2) MEA (1) + H2O (2)
w1 T/K ηFB/mPa·s ηSVM/mPa·s % deviation ηFB/mPa·s ηSVM/mPa·s % deviation
0.1 293.15 1.476 1.463 0.9 1.435 1.409 1.8
0.1 313.15 0.912 0.9079 0.4 0.891 0.8932 -0.3
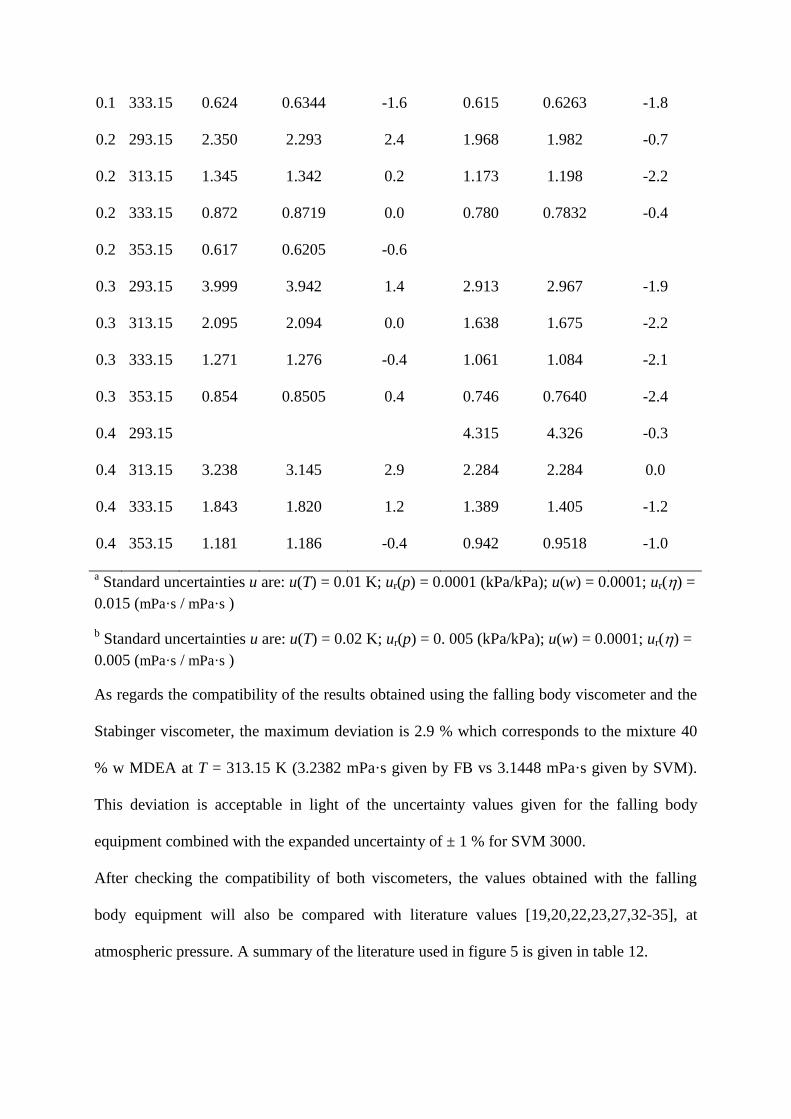
0.1 333.15 0.624 0.6344 -1.6 0.615 0.6263 -1.8
0.2 293.15 2.350 2.293 2.4 1.968 1.982 -0.7
0.2 313.15 1.345 1.342 0.2 1.173 1.198 -2.2
0.2 333.15 0.872 0.8719 0.0 0.780 0.7832 -0.4
0.2 353.15 0.617 0.6205 -0.6
0.3 293.15 3.999 3.942 1.4 2.913 2.967 -1.9
0.3 313.15 2.095 2.094 0.0 1.638 1.675 -2.2
0.3 333.15 1.271 1.276 -0.4 1.061 1.084 -2.1
0.3 353.15 0.854 0.8505 0.4 0.746 0.7640 -2.4
0.4 293.15 4.315 4.326 -0.3
0.4 313.15 3.238 3.145 2.9 2.284 2.284 0.0
0.4 333.15 1.843 1.820 1.2 1.389 1.405 -1.2
0.4 353.15 1.181 1.186 -0.4 0.942 0.9518 -1.0
a Standard uncertainties u are: u(T) = 0.01 K; ur(p) = 0.0001 (kPa/kPa); u(w) = 0.0001; ur() =
0.015 (mPa·s / mPa·s )
b Standard uncertainties u are: u(T) = 0.02 K; ur(p) = 0. 005 (kPa/kPa); u(w) = 0.0001; ur() =
0.005 (mPa·s / mPa·s )
As regards the compatibility of the results obtained using the falling body viscometer and the
Stabinger viscometer, the maximum deviation is 2.9 % which corresponds to the mixture 40
% w MDEA at T = 313.15 K (3.2382 mPa·s given by FB vs 3.1448 mPa·s given by SVM).
This deviation is acceptable in light of the uncertainty values given for the falling body
equipment combined with the expanded uncertainty of ± 1 % for SVM 3000.
After checking the compatibility of both viscometers, the values obtained with the falling
body equipment will also be compared with literature values [19,20,22,23,27,32-35], at
atmospheric pressure. A summary of the literature used in figure 5 is given in table 12.
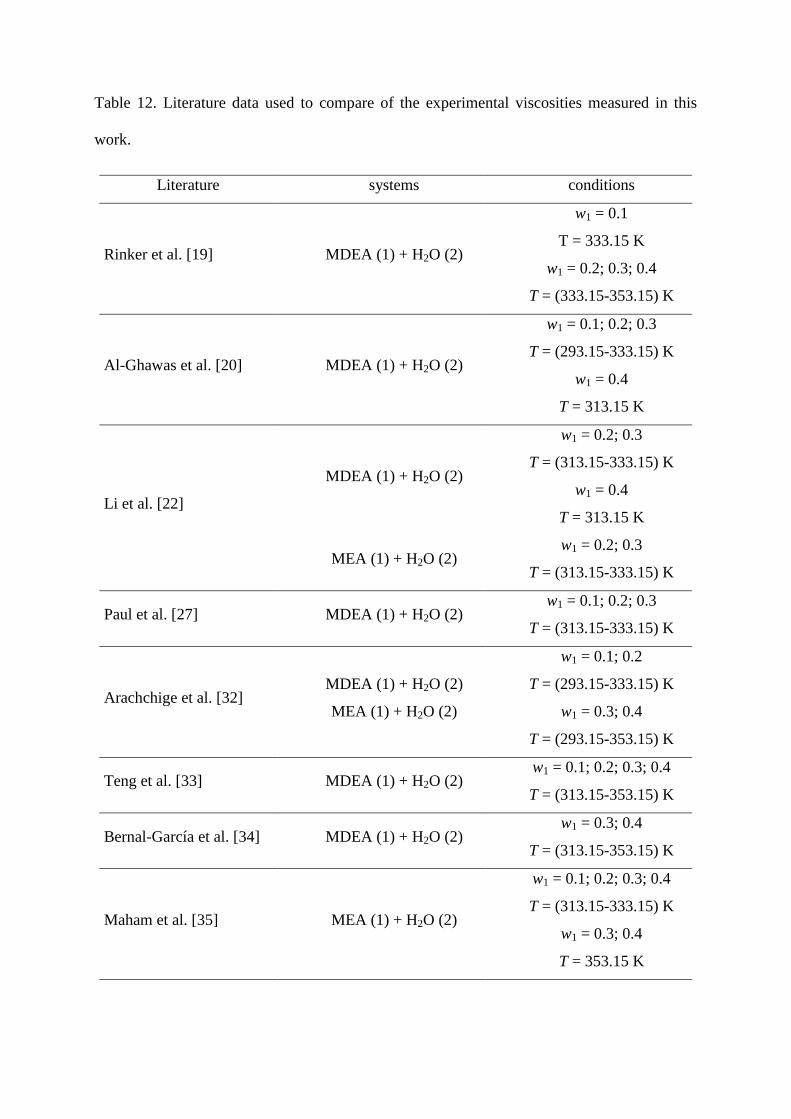
Table 12. Literature data used to compare of the experimental viscosities measured in this
work.
Literature systems conditions
Rinker et al. [19] MDEA (1) + H2O (2)
w1 = 0.1
T = 333.15 K
w1 = 0.2; 0.3; 0.4
T = (333.15-353.15) K
Al-Ghawas et al. [20] MDEA (1) + H2O (2)
w1 = 0.1; 0.2; 0.3
T = (293.15-333.15) K
w1 = 0.4
T = 313.15 K
Li et al. [22]
MDEA (1) + H2O (2)
w1 = 0.2; 0.3
T = (313.15-333.15) K
w1 = 0.4
T = 313.15 K
MEA (1) + H2O (2) w1 = 0.2; 0.3
T = (313.15-333.15) K
Paul et al. [27] MDEA (1) + H2O (2) w1 = 0.1; 0.2; 0.3
T = (313.15-333.15) K
Arachchige et al. [32] MDEA (1) + H2O (2)
MEA (1) + H2O (2)
w1 = 0.1; 0.2
T = (293.15-333.15) K
w1 = 0.3; 0.4
T = (293.15-353.15) K
Teng et al. [33] MDEA (1) + H2O (2) w1 = 0.1; 0.2; 0.3; 0.4
T = (313.15-353.15) K
Bernal-García et al. [34] MDEA (1) + H2O (2) w1 = 0.3; 0.4
T = (313.15-353.15) K
Maham et al. [35] MEA (1) + H2O (2)
w1 = 0.1; 0.2; 0.3; 0.4
T = (313.15-333.15) K
w1 = 0.3; 0.4
T = 353.15 K

Percentage deviations from those reference values are plotted in figure 5 as a function of
viscosity. Uncertainties, which are represented by the two converging lines, are considered to
vary linearly between the values ± 2.4 % and ± 2.9 % shown before.
Figure 5. Relative deviation (%) of the experimental data of MDEA + H2O and MEA + H2O
dynamic viscosity from the literature as a function of viscosity: Stabinger SVM 3000;
Rinker et al. [19]; Al-Ghawas et al. [20]; Li et al. [22]; Paul et al. [27]; Aranchchige
et al. [32]; Teng et al. [33]; ◊ Bernal-García et al. [34] and * Maham et al. [35]. Lines
represent the relative expanded uncertainty of our measurements.
Figure 5 shows a certain scattering among all data, which might be justified due to the
intrinsic difficulty of measuring viscosity. In this sense, it is not possible to analyze
quantitatively the compatibility of our data with others from the literature because most of
literature values do not provide their associated uncertainties according to JCGM guide.
However, knowing the uncertainties of both the falling body and the Stabinger SVM 3000
viscometers has made it possible to evidence the compatibility of their results. For MEA
-12
-10
-8
-6
-4
-2
0
2
4
6
8
10
12
0.50 1.50 2.50 3.50 4.50
10
0·(η
FB-η
ref)
/ η
FB
ηFB /mPa·s

solutions, the best results were obtained in comparison with Maham et al. [30] with an
average relative deviation of 1.3% (ten points for comparison) and these values were 3.4% in
comparison with Al-Ghawas et al. [20] (ten points for comparison) and 3.8% with
Aranchchige et al. [32] (fourteen points), for MDEA solutions.
5. Conclusions
Viscosity and density measurements of MDEA + H2O and MEA + H2O mixtures (10%, 20%,
30% and 40% amine mass fraction), at wide pressure and temperature ranges are presented. A
recently developed falling body viscometer, able to measure viscosities of liquids from 0.1
MPa to 140 MPa and from 253.15 K to 523.15 K, is used in this work. It has been calibrated
with n-dodecane and 1-butanol in a temperature range from 293.15 K to 353.15 K and
pressures up to 120 MPa, obtaining a calibration range = (0.630 to 4.929) mPa·s. A detailed
study of uncertainties was carried out, obtaining relative expanded uncertainties (k = 2)
between ± 2.4% (4.954 mPa·s) and ± 2.9% (0.617 mPa·s).
In order to obtain said viscosities, densities were needed. These were obtained with an Anton
Paar DMA HPM densimeter with an associated expanded uncertainty (k = 2) of ± 0.7 kg/m3.
Density and viscosity measurements were fitted using modified Tamman-Tait and VFT
equations, respectively, obtaining standard deviations better than uncertainty measurements.
Finally, the agreement of viscosity results of the falling body viscometer and Stabinger SVM
3000 at atmospheric pressure has been shown, and is completed with an exhaustive
comparison to literature data. Both properties for MDEA solutions are always higher than for
of MEA solutions under the same conditions. They decrease significantly when temperature
increases and increase with pressure. Changes with temperature and pressure are quite similar
for both amines although changes due to amine composition are more relevant for MDEA
solutions.

Acknowledgments
The authors M.S. and E.I.C. thanks to Education Ministry (Spanish Government) through a
FPU scholarship and to Project for European Latin American Cooperation and Exchange
(PEACE), respectively, for doctoral studies. The work was funded by the Regional
Government of Castilla y León through the Project VA295U14.
References
[1] G.F. Versteeg, W.P.M. Van Swaaij, Chem. Eng. Sci. 43 (1988) 587–591.
[2] R.J. Little, W.P.M. Van Swaaij, G.F. Versteeg, AIChE J. 36 (1990) 1633-1640.
[3] A. Veawab, A. Aroonwilas, P. Tintiwachwuthikul, ACS Division of Fuel Chemistry
Preprints 47 (2002) 49-50.
[4] D. Aaron, C. Tsouris, Separation Sci. & Tech. 40 (2005) 321-348.
[5] C. Hsu, M. Li, J. Chem. Eng. Data 42 (1997) 502–507.
[6] J.J. Segovia, O. Fandiño, E.R. López, L. Lugo, M.C. Martín, J. Fernández, J. Chem.
Thermodyn. 41 (2009) 632–638.
[7] J.R. Zambrano, M. Sobrino, M.C. Martín, M.A. Villamañán, C.R. Chamorro, J.J.
Segovia, J. Chem. Thermodyn. 96 (2016) 104-116.
[8] Evaluation of measurement data - Guide to the expression of uncertainty in measurement.
JCGM 2008.
[9] P. Daugé, A. Baylaucq, L. Marlin, C. Boned, J. Chem. Eng. Data 46 (2001) 823-830.
[10] W.A. Wakeham, A. Nagashima, J.V. Sengers, Experimental Thermodynamics, Vol. III:
Measurement of the Transport Properties of Fluids, Blackwell Scientific Publications,
Oxford, 1991.
[11] M. Zeng, C.J. Schaschke, Int. J. Chem. Eng. (2009) 1-8.

[12] M.J.P. Comuñas, X. Paredes, F.M. Gaciño, J. Fernández, J.P. Bazile, C. Boned, J.L.
Daridon, G. Galliero, J. Pauly, K.R. Harris, J. Chem. Thermodyn. 69 (2014) 201-208.
[13] J.R. Zambrano, M. Sobrino, M.C. Martín, M.A. Villamañán, C.R. Chamorro, J.J.
Segovia, J. Chem. Thermodyn. (2016) http://dx.doi.org/10.1016/j.jct.2015.12.021.
[14] M. Sobrino, J.J. Segovia, Dyna 87 (2012) 438-445.
[15] M.C.S. Chen, J.A. Lescarboura, G.W. Swift, AIChE J. 14 (1968) 123-127.
[16] C.J. Schaschke, S. Allio, E. Holmberg, Food Bioprod. Process. 84 (2006) 173-178.
[17] M. Sobrino, Desarrollo de un viscosímetro para la caracterización a alta presión de
nuevos biocombustibles y mezclas acuosas de aminas para la captura de CO2, PhD
Thesis, University of Valladolid, Spain, 2015.
[18] D.R. Caudwell, J.P. Trusler, V. Vesovic, W.A. Wakeham, International Journal of
Thermophysics 25 (2004) 1339-1352.
[19] E.B. Rinker, D.W. Oelschlager, A.T. Colussi, K.R. Henry, O.C. Sandall, J. Chem. Eng.
Data 39 (1994) 392–395.
[20] H.A. Al-Ghawas, D.P. Hagewlesche, G. Ruiz-Ibanez, O.C. Sandall, J. Chem. Eng. Data
34 (1989) 385–391.
[21] M. Li, K. Shen, J. Chem. Eng. Data 37 (1992) 288-290.
[22] M. Li, Y. Lie, J. Chem. Eng. Data 39 (1994) 444-447.
[23] J.M. Bernal-García, M. Ramos-Estrada, G.A. Iglesias-Silva, K.R. Hall, J. Chem. Eng.
Data 48 (2003) 1442-1445.
[24] J. Han, J. Jing, D.A. Eimer, M.C. Melaaen, J. Chem. Eng. Data 57 (2012) 1843-1850.
[25] F. Pouryousefi, R.O. Idem, Ind. Eng. Chem. Res. 47 (2008) 1268-1276.
[26] A. Zúñiga-Moreno, L.A. Galicia-Luna, J.M. Bernal-García, G.A. Iglesias-Silva, J. Chem.
Eng. Data 52 (2007) 1988-1995.
[27] S. Paul, B. Mandal, J. Chem. Eng. Data 51 (2006) 1808–1810.

[28] Y.M. Tseng, R. Thompson J. Chem. Eng. Data 9 (1964) 264-267.
[29] T.G. Amundsen, L.E. Øi, D.A. Eimer J. Chem. Eng. Data 54 (2009) 3096–3100.
[30] J. Han, J. Jing, D.A. Eimer, M.C. Melaaen, J. Chem. Eng. Data 57 (2012) 1095-1103.
[31] M.J.P.Comuñas, A. Baylaucq, C. Boned, J. Fernández, Int. J. Thermophys. 22 (2001)
749-768.
[32] U.S.P.R. Arachchige, N. Aryal, D.A. Eimer, M.C. Melaaen, Annual Transact. Nordic
Rheology Soc. 21 (2013) 299–306.
[33] T.T. Tseng, Y. Maham, L.G. Hepler, A.E. Mather, J. Chem. Eng. Data 39 (1994) 290-
293.
[34] J.M. Bernal-García, L.A. Galicia-Luna, K.R. Hall, M. Ramos-Estrada, G.A. Iglesias-
Silva, J. Chem. Eng. Data 49 (2004) 864-866.
[35] Y. Maham, C.N. Liew, A.E. Mather, J. Sol. Chem. 31 (2002) 743-756.