Embed Size (px)
Citation preview

Viscoelasticity of thermoreversible gelatin gels from mammalian and piscine collagensPaula M. Gilsenan and Simon B. Ross-Murphy
Citation: Journal of Rheology (1978-present) 44, 871 (2000); doi: 10.1122/1.551118 View online: http://dx.doi.org/10.1122/1.551118 View Table of Contents: http://scitation.aip.org/content/sor/journal/jor2/44/4?ver=pdfcov Published by the The Society of Rheology Articles you may be interested in Viscoelasticity of entangled -phage DNA solutions J. Chem. Phys. 129, 185103 (2008); 10.1063/1.3009249 Viscoelastic properties of aggrecan aggregate solutions: Dependence on aggrecan concentration and ionicstrength J. Rheol. 46, 685 (2002); 10.1122/1.1463419 Categorization of rheological scaling models for particle gels applied to casein gels J. Rheol. 46, 11 (2002); 10.1122/1.1423311 Electrically controlled light scattering from thermoreversible liquid-crystal gels J. Appl. Phys. 88, 161 (2000); 10.1063/1.373636 Relationship between structure and viscoelastic behavior of plasticized starch J. Rheol. 42, 507 (1998); 10.1122/1.550900
Redistribution subject to SOR license or copyright; see http://scitation.aip.org/content/sor/journal/jor2/info/about. Downloaded to IP: 162.129.251.30 On: Thu, 03 Apr 2014
22:08:28

Viscoelasticity of thermoreversible gelatin gelsfrom mammalian and piscine collagensa)
Paula M. Gilsenan and Simon B. Ross-Murphyb)
Division of Life Sciences, King’s College London, Franklin-Wilkins Building,150 Stamford Street, Waterloo, London SE1 8WA, United Kingdom
(Received 29 December 1999; final revision received 22 March 2000)
Synopsis
In this article we describe the characterization of a number of gelatin samples extracted from bothmammalian~bovine and porcine! and fish~cod! collagens using oscillatory shear. The regime forgel formation and characterization is discussed, and subsequent gel melting behavior is consideredin light of both Eldridge–Ferry and Takahashi models for the concentration dependence of themelting temperature. Frequency sweep data for some of the latter samples suggest that, although thejunctions are more complex than simple entanglements, they have some features in common withentanglement networks compared to true gel networks~those with an equilibrium modulus!. Thishas consequences on the longer-term behavior of the gels, and suggests, for example, the possibilityof gel healing. ©2000 The Society of Rheology.@S0148-6055~00!00304-7#
I. INTRODUCTION
Both the structural and mechanical behavior of thermoreversible gels from thepolypeptide gelatin have been widely studied in the past, and the review by te Nijenhuis~1997! summarizes much of the past endeavors. All the work in his review and almost allin the literature as a whole has, however, been performed on traditional mammaliangelatins with very little focus on samples from alternative sources. Here we brieflysummarize the main points of gelatin gelation which are now widely accepted, and thenpresent data on the concentration dependence of melt behavior and of viscoelastic pa-rameters for both traditional mammalian samples and a range of fish gelatins. We alsoconsider the long time behavior of gelatin gels and its possible implications for gelhealing.
A. Molecular structure of gelatin sols and gels
Gelatin is a polypeptide obtained by hydrolytic degradation of the protein collagen, amajor constituent of animal connective tissue. Commercially, both acid and alkalinehydrolysis routes are employed, and most commercial samples are extracted from thecollagen in bovine or porcine bones. Collagen itself is the most abundant protein inmammals, and occurs as the main constituent of connective tissue@Voet, Voet and Pratt~1999!#. It can form insoluble fibers of high tensile strength, where these fibers are madeup of microfibrils of tropocollagen. The basic molecular unit of the latter is a triple helicalrod, and gelatin production involves the hydrolysis of the initial collagen down to theindividual chains making up this tropocollagen triple helix. This consists of threea
a!Dedicated to Professor John D. Ferryb!Corresponding author; electronic mail: [email protected]
© 2000 by The Society of Rheology, Inc.J. Rheol. 44~4!, July/August 2000 8710148-6055/2000/44~4!/871/13/$20.00
Redistribution subject to SOR license or copyright; see http://scitation.aip.org/content/sor/journal/jor2/info/about. Downloaded to IP: 162.129.251.30 On: Thu, 03 Apr 2014
22:08:28

chains arranged in a left-handed axis, while the whole structure is coiled into a right-handed superhelix@Rich and Crick~1958!#. Gelatin gelation then involves transformationof the hydrolyzed ‘‘collagen chains’’ by a mechanism which, at least partly, involvesreformation of triple helical ‘‘junction zones’’~renaturation! separated along any particu-lar chain contour by regions of flexible polypeptide chain. It is now accepted that cold setgelation proceeds via a coil–helix transition induced by cooling a warmed solution ofthese chains.
The properties of resulting gelatins are influenced by the initial collagen and by theprecise treatment process. The precise aminoacid content and sequence vary from onesource to another, but collagen is unusual in that it always consists of large amounts ofthe peptides proline, hydroxyproline, and glycine@Balian and Bowes~1977!#. Moreover,it is well known that an increase in the content of the iminoacid’s proline and hydrox-yproline increases the coil–helix transition temperature. For mammals where this is typi-cally ; 24% it is a few degrees above their body temperature, whereas, for example, forcod, the iminoacid content is around 16% and the melting temperature is typically, 15 °C. The proline content plays a particular role in the stability of gelatin gels since
it promotes formation of the polyproline II helix, which in turn determines the form of thetropocollagen trimer. Above; 40 °C a solution of flexible, random, lightly crosslinkedb andg chains is formed, together with noncovalently linkeda chains. Upon cooling tobelow the coil–helix transition temperature, a transparent, thermoreversible gel is ob-tained, provided the polymer concentration,C, is greater than the critical gelation con-centration, C0 @Clark and Ross-Murphy~1987!#. For gelatinsC0 is typically 0.4–1.0 w/w %.
B. Gelatins from alternative sources
As mentioned above, most commercial gelatins are derived from mammalian sources,and there are many rheological data in the literature. Indeed two years ago a meeting washeld to celebrate 125 years of gelatin usage in the photographic industry. However verylittle work has been done on gelatins from other animal species. There has been interestnevertheless in using alternative sources of gelatins, particularly in the food industryfollowing the recent bovine spongiform encephalopathy~BSE! ~or mad cow disease!crisis in the UK. Just as in the photographic industry, gelatin is still a preferred ingredientin food systems, although here the drive appears to be economic, since gelatin replace-ment by gelling polysaccharides is possible. Nevertheless in minority and ethnic foodproducts~vegetarian, halal, kosher! nonmammalian gelatins have advantages.
What has been known for some years, however, is that the~unhydrolyzed! collagencoil–helix or renaturation temperature depends upon the proportion of the iminoacid’sproline and hydroxyproline@Veis ~1964!#. This is typically ; 24% for mammals and16%–18% for most fish species. The collagen from cold water fish, for example, cod, hasa very low hydroxyproline content. Consequently the gelatin extracted from cod collagenhas a very low gelling and melting temperature. To illustrate this, a typical mammaliangelatin will form a gel at around room temperature, but under equivalent conditions a codgelatin will only just gel at ; 2 °C @Gilsenan and Ross-Murphy~1999!#.
II. EXPERIMENTS
A. Materials and methods
The work described in this article was carried out as part of a collaborative projectfunded by the European Commission. Our partners included commercial concerns in thegelatin business and biochemists expert in the extraction of gelatin samples from fish
872 GILSENAN AND ROSS-MURPHY
Redistribution subject to SOR license or copyright; see http://scitation.aip.org/content/sor/journal/jor2/info/about. Downloaded to IP: 162.129.251.30 On: Thu, 03 Apr 2014
22:08:28

species~see the Acknowledgments!. These partners supplied us with samples whichincluded an alkaline processed ossein gelatin~OC1!, an acid processed pigskin~AP1!,and two cod gelatin samples~2747, IC!. Relevant physico-chemical properties of these,provided by these collaborators, are given in Table I.
Solutions were prepared by soaking the pre-weighed gelatin granules in water for 2–3h at ambient temperature, followed by mechanical stirring for 10–15 min at; 70 °C togive a final range of concentrations between 0.5–25 w/w%. Rheological experimentswere performed using a strain controlled Rheometrics Fluids spectrometer~RFSII, Rheo-metric Scientific Ltd., UK! with 25 mm diam, 0.5 mm gap parallel plate geometry in atemperature controlled~nominally 62 °C! room. Sample temperature was controlled bythe RFSII circulating water bath and the fluid chamber surrounding the bottom geometry.For this reason the thermal cover for the top fixture was also used. With this system ourexperience is that overall temperature control is good, but temperature equilibrationacross the sample is not perfect. Values quoted below reflect the temperature detected bya thermocouple in the bottom plate, and sample temperatures may be up to 1 °C different.
All gel formation experiments were carried out at 4% strain, an oscillatory frequencyof 10 rad s21 and were cooled at the same rate of 0.5 °C/min. During this phaseG8 andG9 were measured every minute. Each sample was left for 60 min at the ‘‘curing tem-perature,’’ 8 °C for the mammalian gelatins, and appropriate frequency and strain sweepscarried out. Since under these conditions no gel was formed, the two cod gelatin sampleswere cooled to 2 °C. Samples were then reheated slowly at 0.2 °C/min to remelt the gel,again monitoringG8 andG9.
III. RESULTS
A. Gelation and gel melting
A typical temperature ramp is illustrated in Fig. 1~a!, which shows the cooling, iso-thermal, and reheating phases. The corresponding responses ofG8 andG9 are given inFig. 1~b!. A very carefully controlled and reproducible thermal history and curing time isessential, since, as established by te Nijenhuis~1979, 1981, 1997! in his now classicalexperiments, the gel formed reflects this thermal history. As expected, bothG8 andG9rise as the temperature is lowered, and then at long times at a fixed temperature, the latterreaches an apparent plateau. Since a temperature ramp was applied, it is difficult to makeany detailed interpretation of the kinetics. However our earlier work on gelatin gelationhas pointed out both the difficulty in determining the precise gelation point@Ross-Murphy ~1991!# and the pseudoequilibrium nature of this isothermal plateau. This isbecause gelatin gelation is a kinetic process, and once started continues, essentially with-out ever going to completion. Replotting the same data against log~time! would showthis @Ross-Murphy~1997!#. Optical rotation~OR!, the conventional way of monitoring
TABLE I. Sample specifications.@Mw 5 weight average molecular weight, determined by HPLC~obtainedfrom other partners in this project! andMw /Mn 5 polydispersity.]
Sample Code Mw Mw /Mn
% iminogroups pIa
Bovine OCI 145 700 1.68 25.3 5.00Porcine AP1 168 500 1.91 25.1 8.74
Cod 2747 60 000 1.33 17.9 7.92Cod IC 120 500 1.93 17.0 8.90
apI 5 the isoelectric point of the gelatin sample~data supplied by the sample providers!.
873THERMOREVERSIBLE GELATIN GELS
Redistribution subject to SOR license or copyright; see http://scitation.aip.org/content/sor/journal/jor2/info/about. Downloaded to IP: 162.129.251.30 On: Thu, 03 Apr 2014
22:08:28

the coil–helix renaturation at a molecular level would also show a log time dependence,as reported by Djabourov and co-workers~1985!.
B. Strain dependence
Figure 2 illustrates the strain dependence of bothG8 andG9 for 10 w/w% bovine at8 °C. Both moduli are reasonably independent of strain rate up to; 25% strain, andsimilar results were obtained for all samples described below. This is consistent with allpublished results on gelatin gels well above the critical gel concentration. At low strains,lack of torque signal generates scattered data forG9. However, bothG8 and G* ~notillustrated but essentially identical toG8 on this scale!, where the latter is usually themost relevant parameter in assessing deviations from linear viscoelastic behavior@Clarkand Ross-Murphy~1987!#, are essentially strain independent. Hence in the cooling and
FIG. 1. ~a! Temperature vs time ramp history employed. Samples were cooled at 0.5 °C/min to 8 °C~bovine,dashed line! and 2 °C~cod, dotted line! and then after 60 min heated at 0.2 °C/min~frequency 10 rad s21; 4%strain!. ~b! Log G8 ~dashed line! andG9 ~dotted line! vs time for 10 w/w% bovine gelatin sample under thesame conditions as~a!.
874 GILSENAN AND ROSS-MURPHY
Redistribution subject to SOR license or copyright; see http://scitation.aip.org/content/sor/journal/jor2/info/about. Downloaded to IP: 162.129.251.30 On: Thu, 03 Apr 2014
22:08:28
melting phases we employed a strain of 4%, a value consistent with Fig. 2, and wellbelow the linear viscoelastic strain for the well-formed gels. However, it may be that alevel lower than this would be required to investigate critical gelation phenomena@Ross-Murphy ~1995!#.
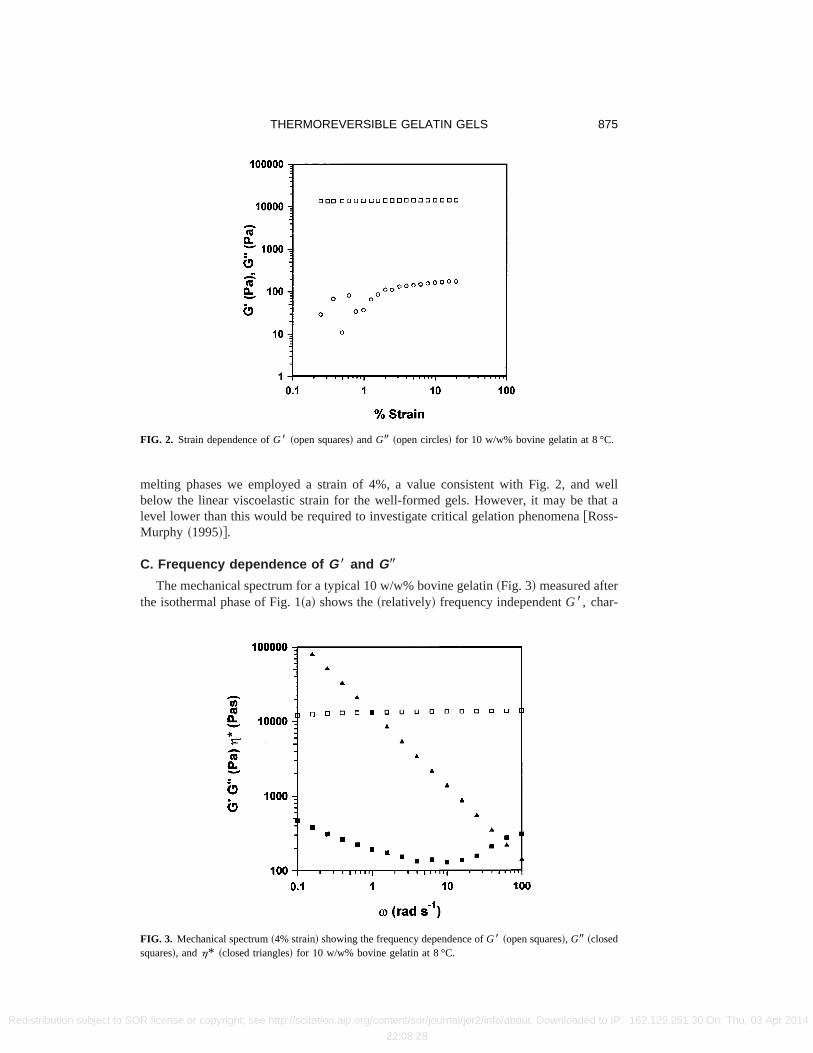
C. Frequency dependence of G8 and G9The mechanical spectrum for a typical 10 w/w% bovine gelatin~Fig. 3! measured after
the isothermal phase of Fig. 1~a! shows the~relatively! frequency independentG8, char-
FIG. 2. Strain dependence ofG8 ~open squares! andG9 ~open circles! for 10 w/w% bovine gelatin at 8 °C.
FIG. 3. Mechanical spectrum~4% strain! showing the frequency dependence ofG8 ~open squares!, G9 ~closedsquares!, andh* ~closed triangles! for 10 w/w% bovine gelatin at 8 °C.
875THERMOREVERSIBLE GELATIN GELS
Redistribution subject to SOR license or copyright; see http://scitation.aip.org/content/sor/journal/jor2/info/about. Downloaded to IP: 162.129.251.30 On: Thu, 03 Apr 2014
22:08:28

acteristic of both chemical and physical gels, and a minimum in the loss modulus,G9centered around a frequency of; 4 rad s21. The latter is characteristic of gelatin and isabsent in most other well formed gels, say, above 2C0 , including those formed fromthermoreversible biopolymer systems such as agarose. It is assumed to be associated withrelaxation processes occurring over much longer time scales@Clark and Ross-Murphy~1987!#.
The frequency dependences ofG8 for the bovine and cod samples over the entirerange of concentrations~1%–10% and 12%–30%! at 8 and 2 °C, respectively, are shownin Figs. 4~a! and 4~b!. The bovine gelatin data show little frequency dependence ofG8over this range of concentrations and frequencies. The concentration dependence ofG8~Fig. 5! follows the behavior expected; in this rangeG8 is typically proportional toC2,where C is the concentration@Clark and Ross-Murphy~1987!#. The data for the codgelatin sample, however, show a slight dependence ofG8 on v in the low frequencyregion, becoming more pronounced as the concentration is reduced. Figure 4~c! showsthe corresponding dependence ofG9 on concentration. Apart from the data at the lowestconcentration~in this case 12%, for this sampleC0 ; 10%) where there is an approxi-mate power law behavior, albeit convoluted with instrumental noise, we again see thevery pronounced minimum, but now there is also a hint of an approach to the lossmaximum at the lowest frequency. In other words the effect of changing species isequivalent to shifting the effective frequency range to higher values~see Sec. IV!.
D. Gel melting temperature
Gel melting temperatures,Tm , were measured from an analysis of behavior in thereheating phase. Normally the decrease inG8, in particular, is so sudden that the actualmelting point can be determined to61 °C just by inspecting the data. Since the sample isbeing heated using a temperature ramp, albeit at 0.2 °C/min at a slow rate, and thiscorresponds to the estimated temperature gradient across the sample,Tm was thus estab-lished without further interpolation.
Nearly 50 years ago, in their pioneering work, Eldridge and Ferry described a simplemodel relating the gel melting temperature for gelatin gels to the concentration,C, andweight average molecular weight,M, @Eldridge and Ferry~1954!; Clark and Ross-Murphy ~1987!#. They found that plots of ln(C) vs 1/Tm and ln(M) vs 1/Tm were almostlinear whenTm is expressed in kelvin. A linear plot of ln(C) vs 1/Tm has a slope relatingto the melting enthalpyDHm
0 , which depends both on the molecular weight and onTm .The Eldridge–Ferry plot is still widely employed for investigation of thermoreversiblegels@te Nijenhuis~1997!# and there are very few systems where the plot is not appropri-ately linear.
Figure 6, however, clearly illustrates how the slope and intercept vary due to thedifferences in melting temperature and molecular weight of the gelatin samples. This plotshows not only our own data for cod and bovine gelatins, but also the original Eldridge–Ferry ~EF! data. It is clear that the slope of the EF plot becomes less negative withdecreasing melting temperature, as can be seen for the cod sample; a low melting tem-perature implies a smaller number of helical structures~howsoever distributed, see be-low! and hence a lower enthalpy value. Similarly, in a simple analysis at least, the lowerthe molecular weight, the greater the number of crosslinks~junction zones! per unitvolume needed to form a gel. Thus low molecular weight gels melt at a lower tempera-ture than high molecular weight ones. The difficulty in this simple model, as in theTakahashi model below, is that it really considers only the total number of residues in
876 GILSENAN AND ROSS-MURPHY
Redistribution subject to SOR license or copyright; see http://scitation.aip.org/content/sor/journal/jor2/info/about. Downloaded to IP: 162.129.251.30 On: Thu, 03 Apr 2014
22:08:28

FIG. 4. ~a! Log G8 vs log frequency~rad s21! for different concentrations of bovine gelatins at 8 °C and 4%strain. 10 w/w%~open squares!; 8 w/w% ~closed squares!; 6.67 w/w%~open circles!; 5 w/w% ~closed circles!;3 w/w% ~open triangles!; 2 w/w% ~closed triangles!; 1 w/w% ~open stars!. ~b! The same as~a!, but for codgelatin at 2 °C and 4% strain. 30 w/w%~open squares!; 25 w/w% ~closed squares!; 20 w/w% ~open circles!;17.5 w/w%~closed circles!; 15 w/w% ~open triangles!; 12 w/w% ~closed triangles!; 10 w/w% ~open stars!. ~c!The same as~b!, but G9 vs v.
877THERMOREVERSIBLE GELATIN GELS
Redistribution subject to SOR license or copyright; see http://scitation.aip.org/content/sor/journal/jor2/info/about. Downloaded to IP: 162.129.251.30 On: Thu, 03 Apr 2014
22:08:28

junction zonesnot the length or distribution of junction zones, which is known fromstructural studies to vary. The latter factors are reflected by the change of propertiesinduced by employing different thermal histories. Nevertheless,DHm
0 values from the EFplots were found to lie in the range of; 260 to 2170 kJ/mol of potential junction
FIG. 5. G8 vs concentration on logarithmic scales for bovine~closed triangles!, porcine~open squares!, andfish gelatin samples: IC cod~open hexagons! and 2747 cod~closed circles!. Mammalian samples were cooledto 8 °C and cod samples were cooled to 2 °C.
FIG. 6. Eldridge–Ferry@log(C) vs 1/Tm] plot for bovine ~closed triangles!, porcine~open squares!, and fishgelatin samples: cod~IC! ~open hexagons! and cod 2747~closed circles!. Data from the original EF plot areshown by broken lines.
878 GILSENAN AND ROSS-MURPHY
Redistribution subject to SOR license or copyright; see http://scitation.aip.org/content/sor/journal/jor2/info/about. Downloaded to IP: 162.129.251.30 On: Thu, 03 Apr 2014
22:08:28

regions~assuming the potential number of crosslinking sites,f 5 4). These comparewell with values tabulated by Eldridge and Ferry~1954!.
The EF model treats gel melting as a first order phase transition allied to a crystallinemelting of the whole chain, following the Flory equation for melting of a crystallinepolymer. Despite its effectiveness, this is a somewhat artificial model for the melting ofa gelatin gel. In 1972 Takahashi derived a different equation based upon a Flory copoly-mer melting equation@Takahashi~1972!#. This is, arguably, a more appropriate approachand seems to work satisfactorily@Figs. 7~a! and 7~b!#. Rather than plotting log(C) vs1/Tm—analogous to a van’t Hoff plot—it uses Flory–Huggins coordinates so that 1/Tmis now the abscissa and the ordinate is ln(v2 x). Herev2 is the usual volume fraction ofthe polymer andx is the degree of polymerization. We assume in this work that the
FIG. 7. ~a! Takahashi (lnv2x vs 1/Tm) plot for bovine ~open squares! and porcine~closed circles! gelatinsamples. The regression line is not fitted through leftmost point.~b! The same as~a!, but for cod 2747~opensquares! and cod~IC! ~closed circles! samples. The two rightmost points are not included in the regression fit.
879THERMOREVERSIBLE GELATIN GELS
Redistribution subject to SOR license or copyright; see http://scitation.aip.org/content/sor/journal/jor2/info/about. Downloaded to IP: 162.129.251.30 On: Thu, 03 Apr 2014
22:08:28

density of the gelatin gel is sufficiently close to unity~1000 kg m23 in SI! that we cansubstitute w/w% for volume fraction. We have also assumed that the residue molecularweight for gelatin is around 110, an approximation widely used by protein chemists@Voet, Voet and Pratt~1999!# so thatx ' M /110.
The relevant Takahashi plots for four different samples, cod and mammalian, usingpresupplied sample molecular weights are given in Figs. 7~a! and 7~b!. Superposition ofboth concentration and molecular weight dependencies is encouraging. Indeed, it is betterthan may at first appear, since this plot now superimposes data for quite differentsamples, since Fig. 7~a! shows data for a bovine and a porcine sample, whereas Fig. 7~b!shows data for cod gelatin samples from different sources produced by different extrac-tion routes.
IV. DISCUSSION
The melting behavior reflects our expectations for these systems, that for the codgelatins being substantially below that for the bovine samples. This does indeed mirrorthe difference in the proportion of the iminoacids proline and hydroxyproline~Table I!,although there are obviously other differences between the samples. The EF plots showthe relationship between the gel melting temperature and the concentration, and thetreatment of gel melting assumes that the fraction of crosslinks formed is a function ofconcentration rather than temperature and that the number of potential junctions stillavailable for crosslinking is independent of temperature.
Any deviation from linearity, particularly in the lower concentration region, may bedue to the fact that the concentration is approachingC0 . A more linear response betweenthe concentration and gel melting temperature is illustrated in the Takahashi [email protected]~a! and 7~b!# for mammalian and cod gelatin samples, respectively. Even here thelinearity is not perfect, and the samples at both the highest and the lowest concentrationsshow some deviation. This most probably reflects two effects. Again asC → C0 themelting temperature is undefined, so the plots cannot always be linear. The concentrationdependence of gelatin gel formation in the critical region has already been consideredelsewhere@te Nijenhuis ~1997!#. There is also always a small amount of hysteresis,mainly due to kinetic factors, between the gel formation and gel melting temperatures,but for gelatin this is minimized at low~but gelling!! concentrations and at low heating/cooling rates.
For the present, the most interesting part of this work is most likely the difference infrequency dependence between the bovine and low temperature gelling cod samples.Technically, the latter are regarded as nongelling samples, because under standard gelatin~so-called Bloom test! conditions they do not form a coherent gel. What is interesting isto decide whether, under conditions prevailing here, a gel has been formed. The evidencefrom the temperature ramp experiments is unequivocal, since there is a very substantialdecrease in modulus at, or just below, the melting temperature. No sensible rheologicaldata can be obtained for these samples and this geometry well above the melting tem-perature, since there is just not enough torque signal. Typically a 10% solution at 40 °Chas a relative viscosity of; 0.1 Pa s. This suggests that, at the least, there is a verysubstantial increase in aggregate molecular weight upon cooling the sample.
However close examination of the cod samples particularly, shows that the frequencyspectra resemble, qualitatively at least, that of any entangled polymer melt even thoughthe apparent plateau modulus is much lower. What this implies is that at longer times thesample must show macroscopic flow, as opposed, say, to relaxation of the sol fraction,and therefore it may not be a gel at all. This actually reproduces an argument used by te
880 GILSENAN AND ROSS-MURPHY
Redistribution subject to SOR license or copyright; see http://scitation.aip.org/content/sor/journal/jor2/info/about. Downloaded to IP: 162.129.251.30 On: Thu, 03 Apr 2014
22:08:28

Nijenhuis~1997! in his examination of the creep data of Higgs and Ross-Murphy~1990!.These latter experiments were performed using a precision stress rheometer and a highmolecular weight alkaline processed gelatin. One of the crucial observations was anapparent flow at long times, with concentration dependent viscosities in the range108– 1011Pa s. In his article te Nijenhuis re-examined his own data in light of these creepmeasurements, and interpreted the typical gelatin minimum inG9 around 1 rad21 s as aprecursor of a lower frequency maximum, prior to terminal flow. This strongly suggeststhat there is no equilibrium modulus in a physical gelatin gel and the system is, in fact,more akin to a polymer glass, with a finite, but extremely high, creep phase viscosity, aswas established previously@Braudoet al. ~1984!; Higgs and Ross-Murphy~1990!#. Nev-ertheless it is important to appreciate that the time scale and the interaction of the gelationmechanism with a coil–helix transition make gelatin far more than just another associa-tive polymer. Indeed, in the absence of microbial proteolysis or water evaporationte Nijenhuis~1997! implies that macroscopic flow will occur on a time scale of 108 s,which is ; 3.2 years. Future work should extend such creep measurements to investigatethe long time behavior of cod gelatin samples. More recently, further creep data byNormand and Ravey~1997! have been collected on gelatin gels. Their slow relaxationtime is similar to, but around a decade faster than that reported in the other work,although their use of a two relaxation time model and a simple mesh size approach,clearly at variance with the underlying physical features, may have influenced this.
The implications of these results are quite profound and may require us to reconsiderexactly what is meant by gelatin gelation. In this context the possibility of gelatin ‘‘heal-ing’’ experiments could be investigated. Such a gel healing experiment would, for ex-ample, be based upon the so-called Johnson–Kendall–Roberts~JKR! contact mechanicstechnique, which measures the time-dependent adhesion energy between a flat substrateand a hemispherical lens of material~R. A. Jones, personal communication! @Jones andRichards~1999!#. This technique is well suited for hydrogels like gelatin@Mowery et al.~1997!# although there could be some complications in dealing with viscoelastic losses.This would not be straightforward, because the experiment would have to be carried outin a very well controlled humidity atmosphere. Simply cutting a gelatin gel on an openbench soon produces a surface ‘‘skin.’’ This is an interface from which some solvent~water! has evaporated leaving, we surmise, a thin layer of gelatin whose concentration issufficiently raised for it to pass throughTg . Clearly this system will not heal. However,provided the experiment is feasible, the mechanism by which any healing would itselftake place is interesting and worthy of extended discussion.
It has been known for some time that the change in optical rotation observed duringthe ‘‘cure’’ of a gelatin system appears to have a logarithmic time phase@Djabourov~1985!#, rather than coming to some limit value. One interpretation of this is that gelatinhelices can unwind and reform over very long times, so helical junction zones are notformed irreversibly. This suggests that they can also form across a cut interface, and thusheal, by a more complex version of the reptation-interpenetration model proposed forpolymer melts by Wool@Kim and Wool~1983!#. The driving force for this process mustbe thermodynamic, although the kinetics may make it difficult, if not impossible, toobserve any healing in practice. What is, nevertheless, interesting is that despite the 125years of research into gelatin and gelatin gels, we still understand far less than we wouldlike, and there is real fascination at the prospect of such developments
V. CONCLUSIONS
Gelatin from cold water fish such as cod display much lower melting behavior thantypical mammalian~bovine! samples and this is mostly due to the lower iminoacid
881THERMOREVERSIBLE GELATIN GELS
Redistribution subject to SOR license or copyright; see http://scitation.aip.org/content/sor/journal/jor2/info/about. Downloaded to IP: 162.129.251.30 On: Thu, 03 Apr 2014
22:08:28

content. The melting behavior fits the Takahashi model for both mammalian and fishsamples. The frequency dependence for the cod and, to a lesser extent, the bovine gelatinsamples do, on closer examination, show some features qualitatively more similar to anentangled melt than those of a cross-linked polymer network with an equilibrium modu-lus. This has potentially profound consequences for our understanding of gelatin gels, andalso suggests the prospect of performing healing experiments on such gels.
ACKNOWLEDGMENTS
The authors are happy to acknowledge the European Commission for funding thiswork under their program FAIR CT97-3055 and our partners including Dr. Magnu´sGudmundsson~IceTec Reykjavik, Iceland!, Professor Madeleine Djabourov~ESPCI,Paris, France!, Dr. Pilar Montero~Instituto del Frio, Madrid, Spain!, and Dr. GeorgesTakerkart ~SKW Biosystems, Paris, France! for providing both samples and insights,without which this article could not have been written. The authors are grateful to Dr. D.S. Field of Croda Colloids, Luton, England, for provision of fish gelatin samples. Thanksare also due to Professor Richard Jones of the University of Sheffield, England, for hisadvice about potential healing experiments. This work was presented at the Society ofRheology Special Symposium dedicated to Professor J. D. Ferry, Madison, WI, October1999.
References
Balian, G. and J. H. Bowes, ‘‘The structure and properties of collagen,’’ inThe Science and Technology ofGelatin, edited by A. G. Ward and A. Courts~Academic, New York, 1977!, pp. 1–27.
Braudo, E. E., I. G. Plaschina, and V. B. Tolstoguzov, ‘‘Structural characterisation of thermoreversible anionicpolysaccharide gels by their elastoviscous properties,’’ Carbohydrate Polym.4, 23–48~1984!.
Clark, A. H. and S. B. Ross-Murphy, ‘‘Structural and mechanical properties of biopolymer gels,’’ Adv. Polym.Sci. 83, 57–192~1987!.
Djabourov, M., J. Maquet, H. Theveneau, J. Leblond, and P. Papon, ‘‘Kinetics of gelation of aqueous gelatinsolutions,’’ Br. Polym J.17, 169–174~1985!.
Eldridge, J. E. and J. D. Ferry, ‘‘Studies of the cross-linking process in gelatin gels. III. Dependence of meltingpoint on concentration and molecular weight,’’ J. Phys. Chem.58, 992–995~1954!.
Gilsenan, P. M. and S. B. Ross-Murphy, ‘‘Structure and rheology of gelatin gels,’’ inThe Wiley PolymerNetworks Review Series, edited by B. T. Stokke and A. Elgsaeter~Wiley, Chichester, UK, 1999!, Vol. 2, pp.363–372.
Higgs, P. G. and S. B. Ross-Murphy, ‘‘Creep measurements on gelatin gels,’’ Int. J. Biol. Macromol.12,233–240~1990!.
Jones, R. A. L. and R. W. Richards,Polymers at Surfaces and Interfaces~Cambridge University Press, Cam-bridge, UK, 1999!.
Kim, Y. H. and R. P. Wool, ‘‘A theory of healing at a polymer polymer interface,’’ Macromolecules7,1115–1120~1983!.
Mowery, C. L., A. J. Crosby, D. Ahn, and K. R. Shull, Langmuir13, 6101–6107~1997!.Normand, V. and J. C. Ravey, ‘‘Dynamic study of gelatin gels by creep measurements,’’ Rheol. Acta36,
610–617~1997!.Rich, A. and F. H. C. Crick, inRecent Advances in Gelatin and Glue Research, edited by G. Stainsby
~Pergamon, London, UK, 1958!, p. 20.Ross-Murphy, S. B., ‘‘Incipient behaviour of gelatin gels,’’ Rheol. Acta30, 401–411~1991!.Ross-Murphy, S. B., ‘‘General discussion,’’ Faraday Discuss.101, 119–120~1995!.Ross-Murphy, S. B., ‘‘Structure and rheology of gelatin gels,’’ Imaging Sci. J.45, 205–209~1997!.Takahashi, A., ‘‘The melting temperature of thermally reversible gel. I. Poly~vinyl chloride! organic solvent
gels,’’ Polym. J.~Tokyo! 3, 207–216~1972!.te Nijenhuis, K., doctoral thesis, Delft, The Netherlands, 1979.te Nijenhuis, K., ‘‘Investigation into the ageing process in gels of gelatin/water systems by the measurement of
their dynamic moduli. Part II. Mechanism of the ageing process,’’ Colloid Polym. Sci.259, 1017–1026~1981!.
882 GILSENAN AND ROSS-MURPHY
Redistribution subject to SOR license or copyright; see http://scitation.aip.org/content/sor/journal/jor2/info/about. Downloaded to IP: 162.129.251.30 On: Thu, 03 Apr 2014
22:08:28

te Nijenhuis, K., ‘‘Thermoreversible networks. Viscoelastic properties and structure of gels,’’ Adv. Polym. Sci.130, 160–193~1997!.
Veis, A., ‘‘Collagen,’’ in The Macromolecular Chemistry of Gelatin~Academic, New York, 1964!, pp. 1–44.Voet, D., J. G. Voet, and C. W. Pratt,Fundamentals of Biochemistry~Wiley, New York, 1999!.
883THERMOREVERSIBLE GELATIN GELS
Redistribution subject to SOR license or copyright; see http://scitation.aip.org/content/sor/journal/jor2/info/about. Downloaded to IP: 162.129.251.30 On: Thu, 03 Apr 2014
22:08:28