Embed Size (px)
Citation preview

Virginia Transportation Research Council, 530 Edgemont Road,Charlottesville, VA 22903-2454, www.vtrc.net, (434) 293 -1900
http://www.virginiadot.org/vtrc/main/online_reports/pdf/09-r9.pdf
Final Report VTRC 09-R9
research reportField Comparison
of the Installation and Costof Placement of Epoxy-Coated and
MMFX 2 Steel Deck Reinforcement:Establishing a Baseline for Future
Deck Monitoring
Virginia Transportation Research Council
STEPHEN R. SHARP, Ph.D., P.E.Research Scientist
AUDREY K. MORUZAAssociate Research Scientist

Standard Title Page—Report on Federally Funded Project 1. Report No.: 2. Government Accession No.: 3. Recipient’s Catalog No.: FHWA/VTRC 09-R9 4. Title and Subtitle: 5. Report Date:
May 2009 6. Performing Organization Code:
Field Comparison of the Installation and Cost of Placement of Epoxy-Coated and MMFX 2 Steel Deck Reinforcement: Establishing a Baseline for Future Deck Monitoring 7. Author(s): Stephen R. Sharp, Ph.D., P.E., and Audrey K. Moruza
8. Performing Organization Report No.: VTRC 09-R9 10. Work Unit No. (TRAIS): 11. Contract or Grant No.:
9. Performing Organization and Address: Virginia Transportation Research Council 530 Edgemont Road Charlottesville, VA 22903 57911 12. Sponsoring Agencies’ Name and Address: 13. Type of Report and Period Covered:
Final 14. Sponsoring Agency Code:
Virginia Department of Transportation 1401 E. Broad Street Richmond, VA 23219
Federal Highway Administration 400 North 8th Street, Room 750 Richmond, VA 23219-4825
15. Supplementary Notes: This project was financed with a federal FHWA Innovative Bridge Grant at an estimated cost of $229,917. 16. Abstract:
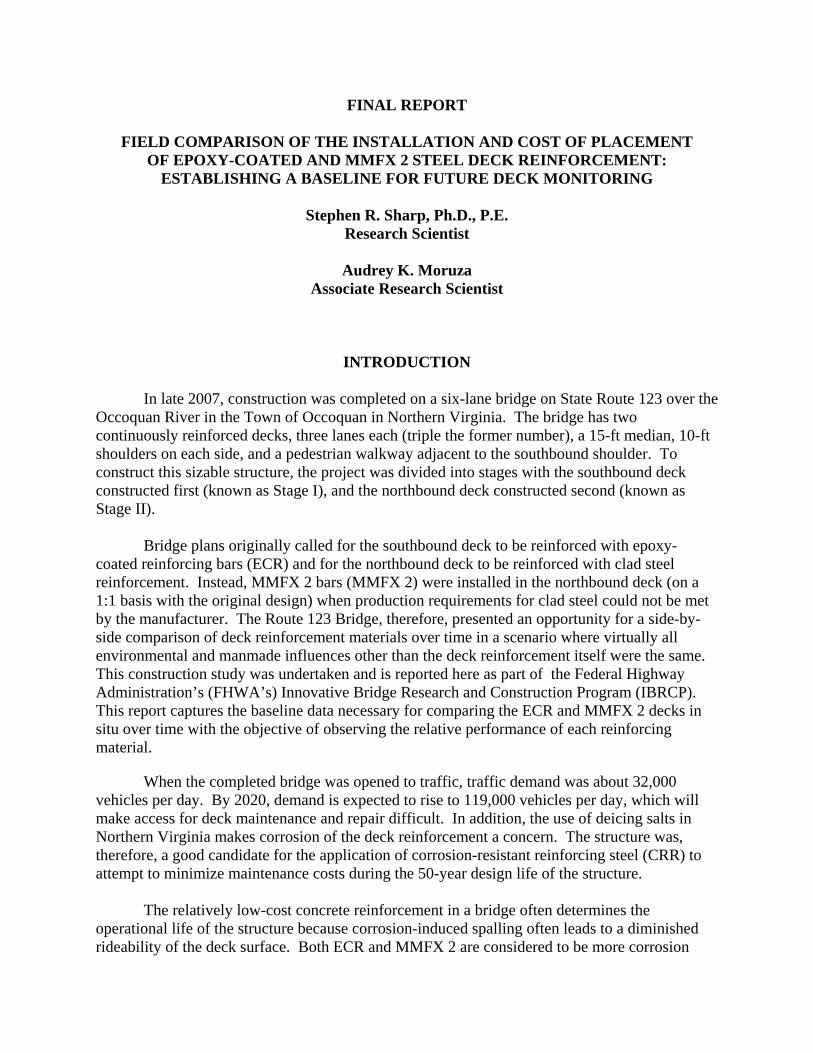
As part of the Innovative Bridge Research and Construction Program (IBRCP), this study was conducted to use the full-scale construction project of the Route 123 Bridge over the Occoquan River in Northern Virginia to identify and compare any differences in the installation practices and comprehensive placement costs of epoxy-coated reinforcing steel (ECR) and MMFX 2. The study also established a baseline of the condition of the bridge upon completion of construction and initial maintenance.
During construction, two separate bridge decks were built and a raised median was used to cover the longitudinal joint
between the two decks. The southbound deck was built using ECR, and the northbound deck was built using corrosion-resistant reinforcing steel (CRR), which in this case was MMFX 2. To construct the two decks required 576,823 lb of ECR and 674,447 lb of MMFX 2. The concrete strength reached 100% of the design strength within 4 days for the northbound deck. The average thickness of the decks was 8.76 in for the southbound deck and 9.15 in for the northbound deck. Stay-in-place forms were used to construct Spans D through G for both decks; Spans A through C were constructed using formwork that was removed to expose the underside of the decks.
Upon completion of construction, an in-depth survey of both decks was conducted. Cracks were present on both decks, and a recent visual analysis of the underside of the decks indicated that moisture is able to penetrate to the bottom of the concrete. Half-cell potential measurements indicated most of the MMFX 2 had reached a passive condition, which presently indicates an insignificant corrosion rate. Resistivity measurements on the northbound deck indicated that if the steel were to become active, it has a low probability of significant corrosion. Chloride analysis indicated salt is penetrating the upper region of the concrete, but the regions closer to the steel have a lower chloride concentration. Based on these findings, the two decks should allow a fair comparison of corrosion susceptibility for the two types of reinforcing steel used.
Inclusion of the labor cost to place ECR in the southbound deck and unanticipated direct costs raised the in-place unit cost of ECR from $0.51/lb to $0.90/lb. Inclusion of the labor cost to place MMFX 2 in the northbound deck raised the in-place unit cost of MMFX 2 from $0.78/lb to $0.87/lb. The cracks in the ECR side were sealed as part of the original construction. By including the indirect labor costs to VDOT and road user costs to the public imposed by a crack sealing operation on the southbound deck, the comprehensive in-place cost of ECR more than quadrupled its unit bid price to a final in-place cost range of $2.34/lb to $2.90/lb, making ECR much less cost-effective in retrospect than it appeared to be at the planning stage of the project. This hidden cost increase for ECR supports the recent decision by VDOT to pursue CRR rather than ECR for future construction and highlights the need to consider at least direct sealing costs when comparing ECR with CRR.
The study recommends that VDOT’s Structure & Bridge Division (1) continue the implementation of the recently approved CRR specification, and (2) be attentive to the possibility that polymer-coated steel bars may be costlier per unit than uncoated bars for reasons of special handling and transport requirements as well as unanticipated preventive maintenance. Further, the Virginia Transportation Research Council should monitor the Route 123 Bridge periodically to assess the relative conditions of the ECR and MMFX 2 reinforcement over time. 17 Key Words: 18. Distribution Statement: Corrosion, reinforcing, steel, concrete, alternative, direct cost, indirect cost, road user cost
No restrictions. This document is available to the public through NTIS, Springfield, VA 22161.
19. Security Classif. (of this report): 20. Security Classif. (of this page): 21. No. of Pages: 22. Price: Unclassified Unclassified 82
Form DOT F 1700.7 (8-72) Reproduction of completed page authorized

FINAL REPORT
FIELD COMPARISON OF THE INSTALLATION AND COST OF PLACEMENT OF EPOXY-COATED AND MMFX 2 STEEL DECK REINFORCEMENT:
ESTABLISHING A BASELINE FOR FUTURE DECK MONITORING
Stephen R. Sharp, Ph.D., P.E. Research Scientist
Audrey K. Moruza
Associate Research Scientist
Virginia Transportation Research Council (A partnership of the Virginia Department of Transportation
and the University of Virginia since 1948)
In Cooperation with the U.S. Department of Transportation Federal Highway Administration
Charlottesville, Virginia
May 2009
VTRC 09-R9

ii
DISCLAIMER
The contents of this report reflect the views of the authors, who are responsible for the facts and the accuracy of the data presented herein. The contents do not necessarily reflect the official views or policies of the Virginia Department of Transportation, the Commonwealth Transportation Board, or the Federal Highway Administration. This report does not constitute a standard, specification, or regulation. Any inclusion of manufacturer names, trade names, or trademarks is for identification purposes only and is not to be considered an endorsement.
Copyright 2009 by the Commonwealth of Virginia.
All rights reserved.

Errata
Field Comparison of the Installation and Cost of Placement of Epoxy-Coated and MMFX 2 Steel Deck Reinforcement: Establishing a Baseline for Future Deck Monitoring
(VTRC 09-R9)
In the time since this report was published in May 2009, additional information about the Virginia Department of Transportation (VDOT) bid costs came to light, requiring an adjustment in the methodology used to estimate the distinct labor and material costs associated with each type of deck reinforcing steel in this project, i.e., epoxy-coated reinforcing steel (ECR) and MMFX 2. Specifically, the new information necessitated that labor cost estimates be deducted from, rather than added to, bid costs, thus leaving an estimate of material costs as the difference. The corrected estimates of final (direct plus indirect) unit costs for each of the two reinforcing steel bars examined in this study remain in the order determined in the original report and the recommendations are unchanged. In this study, unit bid costs of ECR and MMFX 2 listed in internal VDOT construction records were erroneously understood to be material costs only. In fact, VDOT unit bid costs for reinforcing steel consist of the combined costs of materials, fabrication, and installation. Labor estimates for placing each type of reinforcing steel are not affected by this new information, but in the corrected methodology, unit bid costs reduced by estimated unit labor costs produce estimated unit material costs in the difference. The corrected estimates of the final direct unit costs of ECR were about 3% higher than those of MMFX 2. The final estimates of total unit costs of ECR ranged from about 4% to 260% higher than for MMFX 2, depending on the exclusion or inclusion of road user costs (RUCs). The corrected costs appear in the following tables: • On page 39, Table 14 should exemplify the corrected methodology by explicitly showing
labor and materials as components of in-place bid costs for each reinforcing steel, as shown here.
Table 14. Direct Costs of ECR and MMFX 2 Deck Reinforcement
Deck Reinforcement, lb
Material Deck Bolster
Value at Unit Bid Prices, $
Labor, $a,b
Estimated
Material, $a
Southbound Deck Seal, $
Total Direct Cost, $
ECR 572,121 (4,702)c 293,040 54,101 238,939 170,455 463,495 MMFX 2 631,089 43,358d 526,069 59,062 e 467,007 526,069
a Estimated. b Ironworkers only. c Placed in northbound Span A. d Excludes quantity of ECR placed in northbound Span A. e Includes placement of ECR in northbound Span A.

• On page 41, Table 16 should show corrected itemizations of direct and indirect cost estimates, as shown here.
Table 16. Total Costs of ECR and MMFX 2 Deck Reinforcement
Direct Costs, $ Indirect Costs, $a
Material
Labora,b
Materiala
Southbound
Deck Seal
Road User
Costs
VDOT Inspector Overtime
Police
Presence ECR 54,101 238,939 170,455 0.82-1.14 million 2,800 300-1,000
MMFX 2 59,062 467,007 a Estimated. b Ironworkers only.
• On page 41, Table 17 should show corrected, itemized unit cost estimates, as shown here.
Table 17. Incremental Costs of ECR and MMFX 2 Used in Decks by Source Direct Unit Costs,
$/lb Indirect Unit Costs (Deck Seal),
$/lba Total Unit Costs,
$/lb Type
Materiala
Labora,b
Deck Seal
Total Direct Costs
RUCsc
VDOT Inspector Overtime
Police
Presence
Excluding
RUCs
Including
RUCs ECR 0.414 0.094 0.296 0.804 1.43-
2.00 0.0049 0.0005-
0.0017 0.809- 0.811
2.24- 2.81
MMFX 2 0.692 0.088 0.780 0.780 RUCs = road user costs. a Estimated. b Ironworkers only. c Calculated for ECR used in southbound deck only (see Table 14).
iii
ABSTRACT As part of the Innovative Bridge Research and Construction Program (IBRCP), this study was
conducted to use the full-scale construction project of the Route 123 Bridge over the Occoquan River in Northern Virginia to identify and compare any differences in the installation practices and comprehensive placement costs of epoxy-coated reinforcing steel (ECR) and MMFX 2. The study also established a baseline of the condition of the bridge upon completion of construction and initial maintenance.
During construction, two separate bridge decks were built and a raised median was used to cover
the longitudinal joint between the two decks. The southbound deck was built using ECR, and the northbound deck was built using corrosion-resistant reinforcing steel (CRR), which in this case was MMFX 2. To construct the two decks required 576,823 lb of ECR and 674,447 lb of MMFX 2. The concrete strength reached 100% of the design strength within 4 days for the northbound deck. The average thickness of the decks was 8.76 in for the southbound deck and 9.15 in for the northbound deck. Stay-in-place forms were used to construct Spans D through G for both decks; Spans A through C were constructed using formwork that was removed to expose the underside of the decks.
Upon completion of construction, an in-depth survey of both decks was conducted. Cracks were present on both decks, and a recent visual analysis of the underside of the decks indicated that moisture is able to penetrate to the bottom of the concrete. Half-cell potential measurements indicated most of the MMFX 2 had reached a passive condition, which presently indicates an insignificant corrosion rate. Resistivity measurements on the northbound deck indicated that if the steel were to become active, it has a low probability of significant corrosion. Chloride analysis indicated salt is penetrating the upper region of the concrete, but the regions closer to the steel have a lower chloride concentration. Based on these findings, the two decks should allow a fair comparison of corrosion susceptibility for the two types of reinforcing steel used.
Inclusion of the labor cost to place ECR in the southbound deck and unanticipated direct costs raised the in-place unit cost of ECR from $0.51/lb to $0.90/lb. Inclusion of the labor cost to place MMFX 2 in the northbound deck raised the in-place unit cost of MMFX 2 from $0.78/lb to $0.87/lb. The cracks in the ECR side were sealed as part of the original construction. By including the indirect labor costs to VDOT and road user costs to the public imposed by a crack sealing operation on the southbound deck, the comprehensive in-place cost of ECR more than quadrupled its unit bid price to a final in-place cost range of $2.34/lb to $2.90/lb, making ECR much less cost-effective in retrospect than it appeared to be at the planning stage of the project. This hidden cost increase for ECR supports the recent decision by the Virginia Department of Transportation (VDOT) to pursue CRR rather than ECR for future construction and highlights the need to consider at least direct sealing costs when comparing ECR with CRR.
The study recommends that VDOT’s Structure & Bridge Division (1) continue the implementation of the recently approved CRR specification, and (2) be attentive to the possibility that polymer-coated steel bars may be costlier per unit than uncoated bars for reasons of special handling and transport requirements as well as unanticipated preventive maintenance. Further, the Virginia Transportation Research Council should monitor the Route 123 Bridge periodically to assess the relative conditions of the ECR and MMFX 2 reinforcement over time.
FINAL REPORT
FIELD COMPARISON OF THE INSTALLATION AND COST OF PLACEMENT OF EPOXY-COATED AND MMFX 2 STEEL DECK REINFORCEMENT:
ESTABLISHING A BASELINE FOR FUTURE DECK MONITORING
Stephen R. Sharp, Ph.D., P.E. Research Scientist
Audrey K. Moruza
Associate Research Scientist
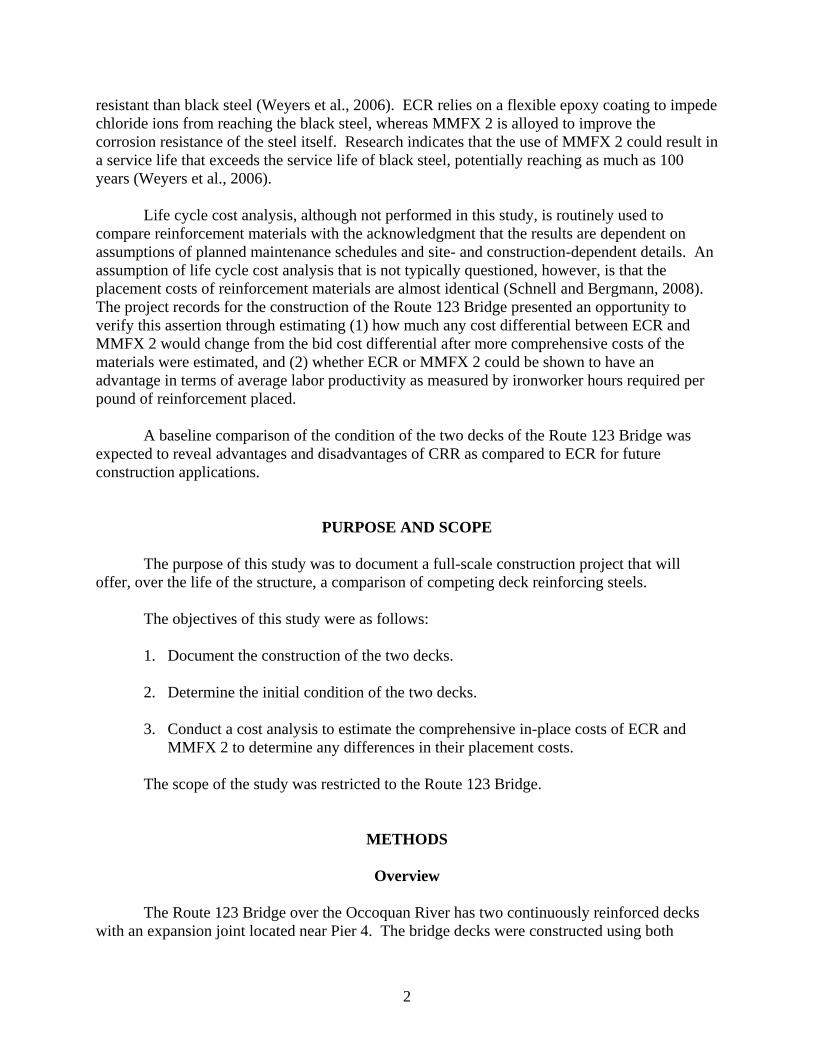
INTRODUCTION In late 2007, construction was completed on a six-lane bridge on State Route 123 over the Occoquan River in the Town of Occoquan in Northern Virginia. The bridge has two continuously reinforced decks, three lanes each (triple the former number), a 15-ft median, 10-ft shoulders on each side, and a pedestrian walkway adjacent to the southbound shoulder. To construct this sizable structure, the project was divided into stages with the southbound deck constructed first (known as Stage I), and the northbound deck constructed second (known as Stage II).
Bridge plans originally called for the southbound deck to be reinforced with epoxy-coated reinforcing bars (ECR) and for the northbound deck to be reinforced with clad steel reinforcement. Instead, MMFX 2 bars (MMFX 2) were installed in the northbound deck (on a 1:1 basis with the original design) when production requirements for clad steel could not be met by the manufacturer. The Route 123 Bridge, therefore, presented an opportunity for a side-by-side comparison of deck reinforcement materials over time in a scenario where virtually all environmental and manmade influences other than the deck reinforcement itself were the same. This construction study was undertaken and is reported here as part of the Federal Highway Administration’s (FHWA’s) Innovative Bridge Research and Construction Program (IBRCP). This report captures the baseline data necessary for comparing the ECR and MMFX 2 decks in situ over time with the objective of observing the relative performance of each reinforcing material.
When the completed bridge was opened to traffic, traffic demand was about 32,000 vehicles per day. By 2020, demand is expected to rise to 119,000 vehicles per day, which will make access for deck maintenance and repair difficult. In addition, the use of deicing salts in Northern Virginia makes corrosion of the deck reinforcement a concern. The structure was, therefore, a good candidate for the application of corrosion-resistant reinforcing steel (CRR) to attempt to minimize maintenance costs during the 50-year design life of the structure.
The relatively low-cost concrete reinforcement in a bridge often determines the
operational life of the structure because corrosion-induced spalling often leads to a diminished rideability of the deck surface. Both ECR and MMFX 2 are considered to be more corrosion
2
resistant than black steel (Weyers et al., 2006). ECR relies on a flexible epoxy coating to impede chloride ions from reaching the black steel, whereas MMFX 2 is alloyed to improve the corrosion resistance of the steel itself. Research indicates that the use of MMFX 2 could result in a service life that exceeds the service life of black steel, potentially reaching as much as 100 years (Weyers et al., 2006).
Life cycle cost analysis, although not performed in this study, is routinely used to
compare reinforcement materials with the acknowledgment that the results are dependent on assumptions of planned maintenance schedules and site- and construction-dependent details. An assumption of life cycle cost analysis that is not typically questioned, however, is that the placement costs of reinforcement materials are almost identical (Schnell and Bergmann, 2008). The project records for the construction of the Route 123 Bridge presented an opportunity to verify this assertion through estimating (1) how much any cost differential between ECR and MMFX 2 would change from the bid cost differential after more comprehensive costs of the materials were estimated, and (2) whether ECR or MMFX 2 could be shown to have an advantage in terms of average labor productivity as measured by ironworker hours required per pound of reinforcement placed.
A baseline comparison of the condition of the two decks of the Route 123 Bridge was expected to reveal advantages and disadvantages of CRR as compared to ECR for future construction applications.
PURPOSE AND SCOPE
The purpose of this study was to document a full-scale construction project that will offer, over the life of the structure, a comparison of competing deck reinforcing steels.
The objectives of this study were as follows: 1. Document the construction of the two decks. 2. Determine the initial condition of the two decks. 3. Conduct a cost analysis to estimate the comprehensive in-place costs of ECR and
MMFX 2 to determine any differences in their placement costs. The scope of the study was restricted to the Route 123 Bridge.
METHODS
Overview
The Route 123 Bridge over the Occoquan River has two continuously reinforced decks
with an expansion joint located near Pier 4. The bridge decks were constructed using both

3
plywood deck forms and stay-in-place (SIP) forms. Spans A, B, and C were constructed using plywood deck forms, and the remaining spans were built using SIP forms. A plan view drawing of the bridge is shown in Figure 1.
The decks were placed on haunched prestressed concrete beams that were spliced using post-tensioning. To construct the decks, 572,121 lb of ECR was used in the southbound deck and 674,447 lb of MMFX 2 was used in the northbound deck; an additional 4,702 lb of ECR was used for the bolster in the northbound Span A deck.
Figure 1. Plan View of Route 123 Bridge. (a) Southbound deck, (b) Northbound deck.

4
To accomplish the objectives of this study, three tasks were performed: 1. Document the construction of the decks.
― Conduct site visits during construction. ― Review the design specifications, construction specifications, and construction
reports and photographs after completion of construction. ― Gather weather data for the construction period.
2. Determine the initial condition of the decks.
― Conduct a visual survey of the finished decks. ― Perform a crack survey of the travel lane and shoulder of each deck. ― Visually locate the cracks on the underside of deck Spans A through C. ― Determine the chloride concentration of concrete samples collected from the
travel lane wheelpath of each deck. ― Conduct a half-cell potential survey of the travel lane and shoulder of the
northbound (MMFX 2) deck to assess corrosion potential. ― Perform resistivity measurements on the shoulder and travel lanes of the
northbound (MMFX 2) deck to determine the risk of corrosion. ― Evaluate embedded bars of ECR and MMFX 2 in “as-received” and “pristine”
conditions to determine the corrosion rate and open circuit potentials (OCP) of the bars as a baseline.
3. Estimate and compare the comprehensive in-place costs of the ECR and MMFX 2
used in the decks.
Documentation of Deck Construction Site Visits Site visits were made during deck construction to document storage and placement of deck reinforcing bars, tying of deck reinforcing bars, preparation for concrete placement, and concrete placement. The majority of these activities occurred simultaneously; therefore, a single visit captured multiple events. Other events such as concrete placement necessitated a specific visit. Since it was not possible to monitor the construction site on a daily basis, construction diaries and reports were used to augment on-site visits. Review of Design Specifications, Construction Specifications, and Construction Reports
General
To document the work required to place the ECR and MMFX 2, design specifications, construction specifications, and construction reports and photographs were reviewed. Key points of interest were special handling requirements, material availability, construction repairs, and any indications of difficulties attributable to the reinforcing steel itself.

5
The design specifications for this project were the 1996 American Association of State Highway and Transportation Officials (AASHTO) Standard Specifications for Highway Bridges (AASHTO, 1996); the AASHTO 1997 and 1998 Interim Revisions (AASHTO, 1997b, 1998); and VDOT Modifications to AASHTO Standard Specifications for Highway Bridges, Sixteenth Edition (1996, Interim 1997 and 1998) (VDOT, various dates).
The construction specifications included VDOT’s 1997 Road and Bridge Specifications
(VDOT, 1997) and VDOT’s 1996 Road and Bridge Standards (VDOT, 1996). The construction reports included site plans, inspection reports, photographs, etc.
Handling and Storage of ECR The handling and storage of the ECR was evaluated in accordance with VDOT’s 1997 Road and Bridge Specifications (VDOT, 1997), AASHTO M 284 (AASHTO, 2006), and ASTM A775/A775M (ASTM International, 2006a). According to ASTM, handling and storage of ECR require padded contact areas, padded bundling bands, and transport by lifting (rather than dragging) in a manner that prevents bar-to-bar abrasion. Further, storage of ECR outdoors for more than 2 months should entail protection from sunlight, salt spray, and general weather exposure and adequate ventilation to prevent condensation under protective sheeting (see Figure 2).
Figure 2. ECR Placement in Southbound Lane

6
The Corrosion Reinforcing Steel Institute (CRSI) (2008) states that power lift equipment should be used (in preference to hand-carrying); sagging should be minimized when the ECR is lifted, carried, or stored; walking on bars should be minimized if necessary at all; and bars should be visually inspected for damage and touch-up patching after placement. CRSI also advises against “blasting” of concrete from a pump through and between bars.
Handling and Storage of MMFX 2 The handling and storage of MMFX 2 were evaluated in accordance with ASTM A1035 (ASTM International, 2004), which specifies that the composition of the steel comply with the requirements listed in Table 1. According to this standard, surface rust or oxide mill scale is not a sufficient reason for rejection of this steel; therefore, the surface condition of the steel was not an area of focus.
Table 1. Chemical Composition for MMFX 2 Steel Element Carbon Chromium Manganese Nitrogen Phosphorus Sulfur Silicon Maximum weight percentage 0.15 8.0-10.0 1.5 0.05 0.035 0.045 0.50
Source: ASTM International, 2004.
Weather Conditions Data concerning weather conditions were collected from two sources: the construction diaries and a weather station located in Manassas, Virginia, at 38 44' 0"N 77 3' 0"W. The station is 13 statute miles from the construction site. Temperature and moisture data were also collected.
Initial Condition Survey Visual Survey of Deck Surfaces
The visual survey was performed by visiting the construction site and observing the construction of the decks. Photographs taken by inspectors were also examined. Chloride Analysis Concrete samples were gathered at five locations along the right wheelpath of the southbound (ECR) deck. The locations were near the midpoints of Spans A, C, D, E, and G. Concrete samples were also gathered at five locations along the right wheelpath of the northbound (MMFX 2) deck. On this deck, concrete samples were collected on Spans A, B, C, E, F, and G on October 22, 2007, and then on Spans A, C, E, F, and G on April 16, 2008. In each location, samples were collected at four depths: 0.0 to 0.5 in, 0.5 to 1.0 in, 1.0 to 1.5 in, and 1.5 to 2.0 in. The total chloride concentration was measured in accordance with AASHTO T 260 (AASHTO, 1997a) for total soluable chloride analysis.

7
Crack Survey of Travel Lane and Shoulder Southbound (ECR) Deck Crack mapping for this deck was performed on Spans D through G using a portable grid system. The grid was constructed using polyvinylchloride (PVC) pipe to create 5 ft by 5 ft boxes that had a marking every 1 ft. A photograph of the PVC grid is shown in Figure 3. An unmagnified crack comparitor was used to aid in the estimation of the crack widths. Crack widths and locations were recorded on data sheets and later entered into a spreadsheet and plotted on grids for analysis.
Figure 3. Crack Survey Grid
Northbound (MMFX 2) Deck Crack mapping for this deck was performed using a Trimble R6 VRS Rover system rather than the traditional method used on the southbound deck. The task of crack mapping the northbound deck presented an opportunity to evaluate the Trimble R6 VRS Rover system.
An unmagnified crack comparitor was used to aid in the estimation of the crack widths.
The crack map data were downloaded from the Rover and processed using the TPO software package, which allowed for annotations to be made on the crack map. The advantage of using the VRS Rover is that it stores the crack sizes and locations (coordinates) electronically, which eliminates the data entry step required when the portable grid system is used. Therefore, the data can be quickly analyzed using the VRS system.

8
Crack Survey of Underside of Decks Efflorescence pattern data on the underside of the two bridge decks were gathered for Spans A through C. This was done two ways: (1) using a Trimble VX Total Station to record visual details on Span B, and (2) using visual analysis (including binoculars) to catalog cracking on the underside of Spans A through C. The task of surveying cracks on the underside of the decks presented an opportunity to evaluate the Trimble VX Total Station. The Trimble VX Total Station was situated on a tripod underneath Span B (Figure 4) to facilitate the scanning of the underside of the deck. The device then created a three-dimensional electronic grid of the area selected. The grid points were then located using global positioning system (GPS) technology, which provided the exact location of the efflorescence underneath the deck. The VX Total Station also captures a photograph of the selected area and overlays it on a grid. The photograph was used to assess visually the length of the efflorescence pattern in Span B using the Trimble Realworks Survey software package. Visual analysis, which included the use of binoculars, was also used to catalog efflorescence patterns underneath Spans A through C. The patterns were classified as longitudinal or transverse, and the location of the efflorescence relative to the span and girder pattern was noted. The legend for the span/girder pattern used to locate each efflorescence pattern is shown in Figure 5.
Figure 4. Gathering Coordinates to Locate Trimble VX System for Under-Bridge Crack Survey

9
Figure 5. Legend Illustrating Span/Girder Pattern
Half-Cell Potential Measurements Half-cell potential measurements were gathered along the northbound (MMFX 2) shoulder and travel lane in accordance with ASTM C876 (ASTM International, 1999). These measurements were made starting from the southern end and continuing to the expansion joint. This was done using a 3 ft by 3 ft grid that was laid out 1 ft from the parapet. This ensured that measurements would include both wheelpaths and the centerline of the travel lane. This measurement was limited to the northbound deck because the ECR on the southbound deck did not provide the continuity required for this test. Resistivity measurements were made in accordance with ASTM G57 (ASTM International, 2006b), which was done using the four-pin probe configuration. An RM MKII concrete resistivity meter Model U95, manufactured by CNS Farnell Limited, was used to make the measurements. Measurements were made on the northbound (MMFX 2) deck at the midpoint between each cold joint in the shoulder and travel lane regions. The location of each set of measurements was recorded relative to Abutment A and the parapet. Resistivity measurements were not made on the southbound deck because of random patches of epoxy on the surface of the deck left by the crack sealing operation. The epoxy residue would interfere with resistivity measurements by interfering with the four-pin probe contact points and would not provide reliable measurements of the concrete. Corrosion Rate and Open Circuit Potential Measurements ECR and MMFX 2 bars were embedded in the northbound deck in both as-received and pristine conditions, which are shown in Figure 6. The ECR in Figure 6(c) was repaired with field-applied epoxy, which has a different color than the factory-applied coating shown in Figure 6(a). The MMFX 2 in Figure 6(b) illustrates the extreme surface rusting found on some of the bars. The degree of surface rust varied from none, as shown in Figure 6(d), to that shown in Figure 6(b).
The corrosion rate and OCP were measured in accordance with ASTM G59 (ASTM International, 2003).

10
Figure 6. Photograph Showing Embedded Test Bars. (a) As-received ECR, (b) As-received MMFX 2,
(c) Pristine ECR, (d) Pristine MMFX 2.
Cost Estimation and Comparison Overview
To compare comprehensive initial costs (including construction and construction-related
maintenance) of the ECR and MMFX 2 used in the bridge, the researchers compiled and compared all associated documented direct and indirect dollar costs reported in inspectors’ construction records for the two materials. Inspectors’ daily work records (DWRs) contain these cost data and also provide accounts of construction activities, crews, and work items. The DWRs were cross-referenced with other reports internally generated by VDOT (VDOT, Scheduling and Contracting Division, unpublished data, 2008).
Inspectors for VDOT and the prime contractor kept systematic daily records of the
subcontractor labor crews engaged in placing deck reinforcement for the bridge, but the lack of systematic records of prime contractor labor expended on handling or placing of deck reinforcement prevented its inclusion in labor-hour reporting. Thus, occasional DWR references to prime contractor labor applied to deck reinforcement tasks were disregarded with regard to the construction of both decks with the exception of crane operator hours, which were carefully documented when the operators were engaged in transporting deck steel.

11
An ironworker hourly rate of $31.20 (U.S. Department of Labor, 2006) was used as reported by the subcontractor, where fringe benefits were declared as paid in cash. Only ironworker reimbursement was considered here: supervisor hours were not cost-extended because of a lack of wage data, and payment for crane operator hours were included in payments to the prime contractor for the project as a whole and were not double-counted in the placement cost.
The cost comparison was reported in terms of both dollar costs and labor-hours to show any differences between the materials not only with regard to money but also with regard to the labor required to place them.
Dollar Cost Comparison The dollar cost comparison quantified or estimated direct and indirect initial costs of the deck reinforcement as comprehensively as project documentation and simple modeling would permit.
Direct costs were defined as bid costs for materials, labor costs for emplacement of deck reinforcement, and unanticipated costs encountered in the course of construction for which the prime contractor billed VDOT. For example, such unanticipated costs included the extra bolster for the northbound (MMFX 2) deck and the deck sealing costs for the southbound (ECR) deck discussed here.
Indirect costs were defined as (1) costs incurred in the course of tasks for which the prime contractor was paid but that were transferred to VDOT, and (2) costs generated by choice of deck reinforcement material that were effectively transferred to the public—i.e., road user costs (RUCs). Labor Comparison VDOT and prime contractor construction records tracked the daily hours and activities of contractors and subcontractors during this project. The subcontractor ironworker hours attributed to placement and tying of deck reinforcing steel in each span were tabulated from these records and summed across spans with the same reinforcement material. In northbound Span A, however, ECR for added bolster was installed along with the planned MMFX 2 by the subcontractor. The intruding ECR amounted by weight to about 6% of the MMFX 2 placed in this span. It follows that the labor-hours calculated to place MMFX 2 in northbound Span A were unavoidably overestimated and the labor-hours spent placing ECR were underestimated for the project as a whole. Based on the final determination that ECR was more labor-intensive by weight to place than MMFX 2, the researchers decided not to attempt to adjust ironworker hours for northbound Span A to account for different deck reinforcing materials since such an adjustment would have been speculative and, more important, would only have reinforced the initial outcome.

12
Unanticipated Costs
Two events related specifically to deck steel reinforcement resulted in unanticipated costs to VDOT and the public.
1. Although the plans called for a 1:1 exchange of MMFX 2 for ECR in the northbound lanes, the bid quantity of MMFX 2 was augmented during construction by the reinforcement of unexpected high bolster above the beams in the northbound lanes. The project engineer first observed a 250-mm gap between the bottom mat of deck reinforcement and the top flange of the beam in Span A during construction of the northbound deck in October 2006. The general construction manager concluded that additional reinforcement was warranted at that site, and the subcontractor retrofitted the bolster with on-site ECR in the space above the Abutment A end closure diaphragm. Later calculations by the project engineer and the prime contractor in May 2007 indicated that the bolster heights at most deflection points along the beams of the northbound spans exceeded 125 mm and would require additional MMFX 2 reinforcement. The reinforcement used for the added bolster in each affected northbound deck span was invoiced separately in “Work Item Information” in the DWR on the days when the deck concrete was placed. Moreover, the additional reinforcement was integrated with the planned deck reinforcement when placed. Since the labor was inseparable in the records, the cost of the additional ECR and MMFX 2 was added to the original planned deck reinforcement quantities in direct cost and labor-hour calculations, as noted previously.
2. The concrete in the southbound (ECR) lanes exhibited cracking soon after the
concrete was placed in late 2005. In November 2006, these lanes were sand blasted, sealed with an epoxy coating, and restriped over the course of two weekends. VDOT typically seals cracks in decks to prevent chlorides and moisture from reaching the reinforcement and causing it to corrode. The epoxy coating on ECR does not provide long-term corrosion protection (Weyers et al., 2006). Similar cracking of the concrete in the northbound (MMFX 2) lanes was untreated because corrosion-resistant reinforcement such as MMFX 2 can arguably provide long-term corrosion protection (Weyers et al., 2006). This operation was billed to VDOT by the prime contractor and was considered a direct cost in the amount of $170,454.69 in this study. In the deck seal operation, VDOT also incurred inspector overtime charges, a police presence was provided in work zones, and traffic was disrupted by lane closures. These costs were considered indirect costs of the ECR placed in the southbound lanes and were estimated and added to the direct costs to estimate the comprehensive initial costs of ECR. The costs to the public of traffic delays caused by lane closures over the two weekends of the deck seal operations were estimated as RUCs, as discussed in the next section. The indirect costs of (1) pollutant emissions caused by travel delays and (2) crashes affiliated with the work zones during the deck sealing operations were excluded from the RUCs estimated here.

13
Road User Costs Lane closures were employed as part of the southbound (ECR) deck seal operation in November 2006. Resulting RUCs were estimated as a function of the value of a vehicle-hour of travel, the travel delay caused by the specific lane closures given the highway capacity, the segment length, the free flow speed and work zone speed, and vehicle operating costs.
Total road user cost = Travel time cost + Vehicle operating cost [Eq. 1] where Travel time cost = total delay*[($/Passenger car-hour)*(Passenger car occupancy rate)*(% Passenger cars in traffic stream) + ($/Truck-hour) *(%Trucks in traffic stream)] [Eq. 2] and
Total delay (vehicle-hours) = Queue delay + Travel delay [Eq. 3]
The estimated total delay to the public from the lane closures is the output of a set of linear and quadratic equations adapted from highway capacity principles by Gillespie (1998, 2007). Queue delay and travel delay were calculated as functions of the queue 1 hr earlier, the current queue, current excess capacity, free flow speed, work zone speed, and segment length of lane closure.
The deck sealing operation occurred during construction of the northbound lanes after the
old bridge had undergone demolition. All traffic had been routed to the southbound deck by then, with two lanes each for northbound and southbound traffic including travel in the shoulder lane. Based on the recommendations in the Highway Capacity Manual for multilane highways (FHWA, 2000), it was assumed that the capacity was 1,400 vehicles per lane per hour, that free flow speed for the four undivided lanes was 45 mph, and that work zone speeds fell to 30 mph during periods of lane closures. Figure 7 shows the general traffic scenario during the deck sealing operation.
To allow placement of the sealer during two weekends, traffic was restricted to two lanes
and the sealer was applied to the other two lanes. Several shortcomings existed in the traffic data used to estimate the cost to the public of the lane closures:
1. Traffic data specifically for the Route 123 Bridge was lacking for the period of bridge
construction (2003-2007), and VDOT’s Traffic Engineering Division had only spotty similar link traffic data. As a consequence, the estimation of travel delay was based on a 48-hr directional traffic volume distribution for a similar link in 2004 (VDOT Traffic Engineering Division, unpublished data, 2008) that was thought to have been more similar to mid-construction traffic in 2006 than post-construction hourly distribution data would have been (with the completed bridge triple the original bridge in size). An estimate of average daily traffic (ADT) by VDOT’s Traffic
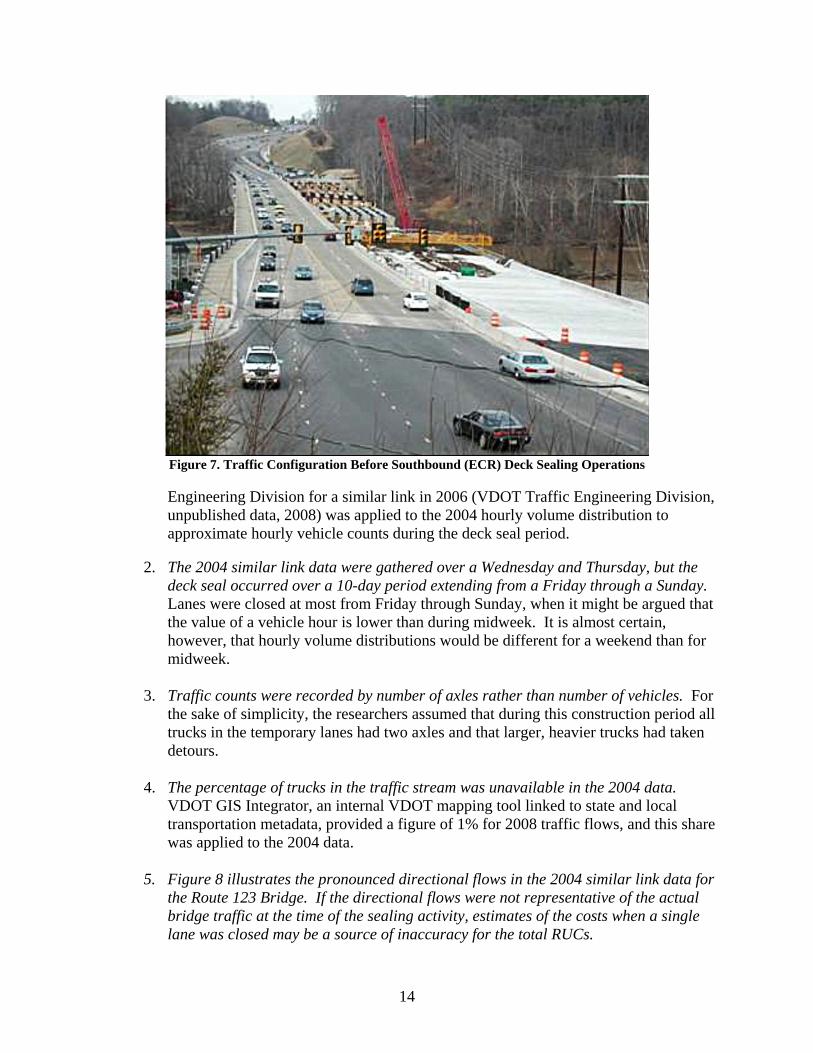
14
Figure 7. Traffic Configuration Before Southbound (ECR) Deck Sealing Operations
Engineering Division for a similar link in 2006 (VDOT Traffic Engineering Division, unpublished data, 2008) was applied to the 2004 hourly volume distribution to approximate hourly vehicle counts during the deck seal period.
2. The 2004 similar link data were gathered over a Wednesday and Thursday, but the
deck seal occurred over a 10-day period extending from a Friday through a Sunday. Lanes were closed at most from Friday through Sunday, when it might be argued that the value of a vehicle hour is lower than during midweek. It is almost certain, however, that hourly volume distributions would be different for a weekend than for midweek.
3. Traffic counts were recorded by number of axles rather than number of vehicles. For
the sake of simplicity, the researchers assumed that during this construction period all trucks in the temporary lanes had two axles and that larger, heavier trucks had taken detours.
4. The percentage of trucks in the traffic stream was unavailable in the 2004 data.
VDOT GIS Integrator, an internal VDOT mapping tool linked to state and local transportation metadata, provided a figure of 1% for 2008 traffic flows, and this share was applied to the 2004 data.
5. Figure 8 illustrates the pronounced directional flows in the 2004 similar link data for
the Route 123 Bridge. If the directional flows were not representative of the actual bridge traffic at the time of the sealing activity, estimates of the costs when a single lane was closed may be a source of inaccuracy for the total RUCs.

15
Figure 8. Directional Traffic Flows for VDOT 2004 Similar Link Data for Route 123 Bridge, 2004
RESULTS AND DISCUSSION
Documentation of Construction Survey of Construction Documents
Concrete Mix Design
The concrete deck design required the use of a VDOT A5 Special (Class 40) low-permeability concrete mix. This mix design has a slump of 3 to 6 in and an air content of 5.5% ± 1.5%. An example of the mixture is provided in Table 2. The mixture is a higher-strength mixture when compared to the standard VDOT A4 mixture commonly used in bridge decks. In as few as 4 days, 100% of the design strength was reached in the northbound (MMFX 2) deck, as shown in Figure 9. DWRs indicated that the slump and air content requirements were met for every load placed in the deck.
Table 2. Typical Mix Design for Route 123 Deck Concrete Description Quantity Source Source Location
Cement (Type II) 375 lb Lehigh Union Bridge, Maryland Pozzolans (NewCem) 375 lb Lafarge Sparrow’s Point, Maryland Course aggregate (No. 57 stone) 1,760 lb Vulcan Occoquan, Virginia Fine aggregate 1,097 lb Maryland Rock Leonardtown, Maryland Water 32 gal Well/City/Pond Lorton, Virginia Air entrainment (Daravair) Varies W.R. Grace Cambridge, Massachusetts Water-reducing (WRDA35) 2-5 oz/cwt W.R. Grace Cambridge, Massachusetts High-range water-reducing (ADVA-140) 8-14 oz/cwt W.R. Grace Cambridge, Massachusetts Retarder (Daratard) 2-5 oz/cwt W.R. Grace Cambridge, Massachusetts
Source: Chua, 2005.

16
Figure 9. Percentage of Design Strength Measurements for Northbound Deck Concrete
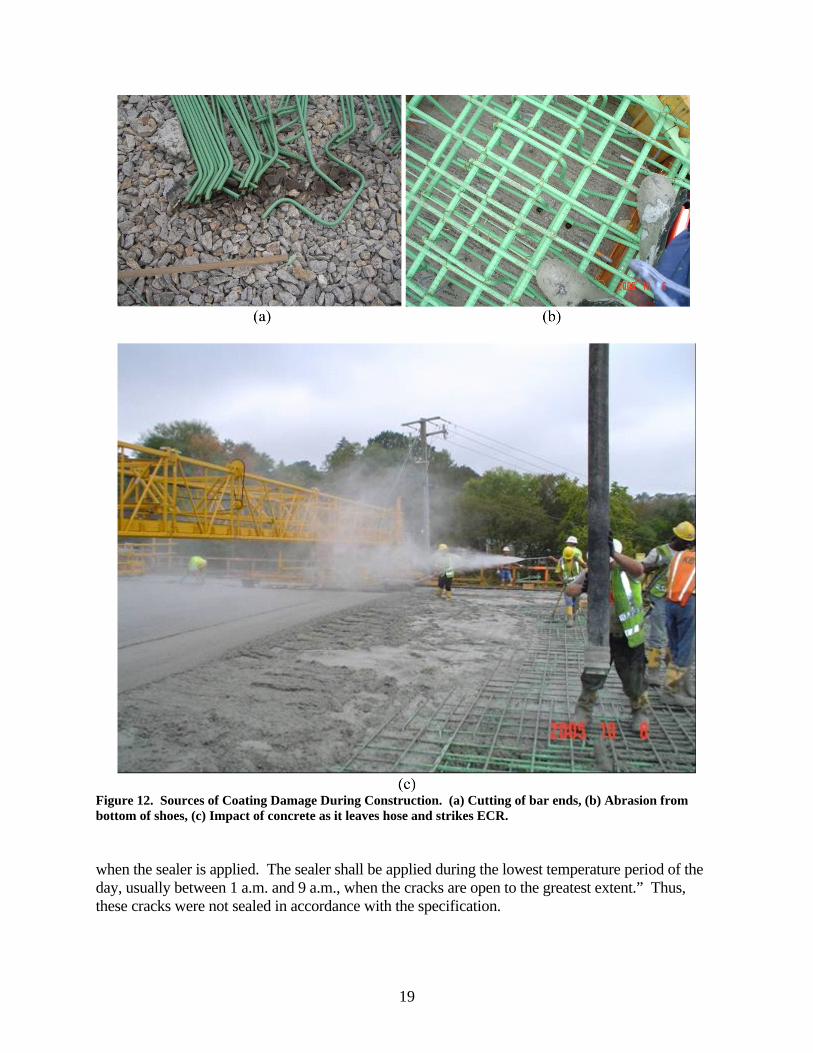
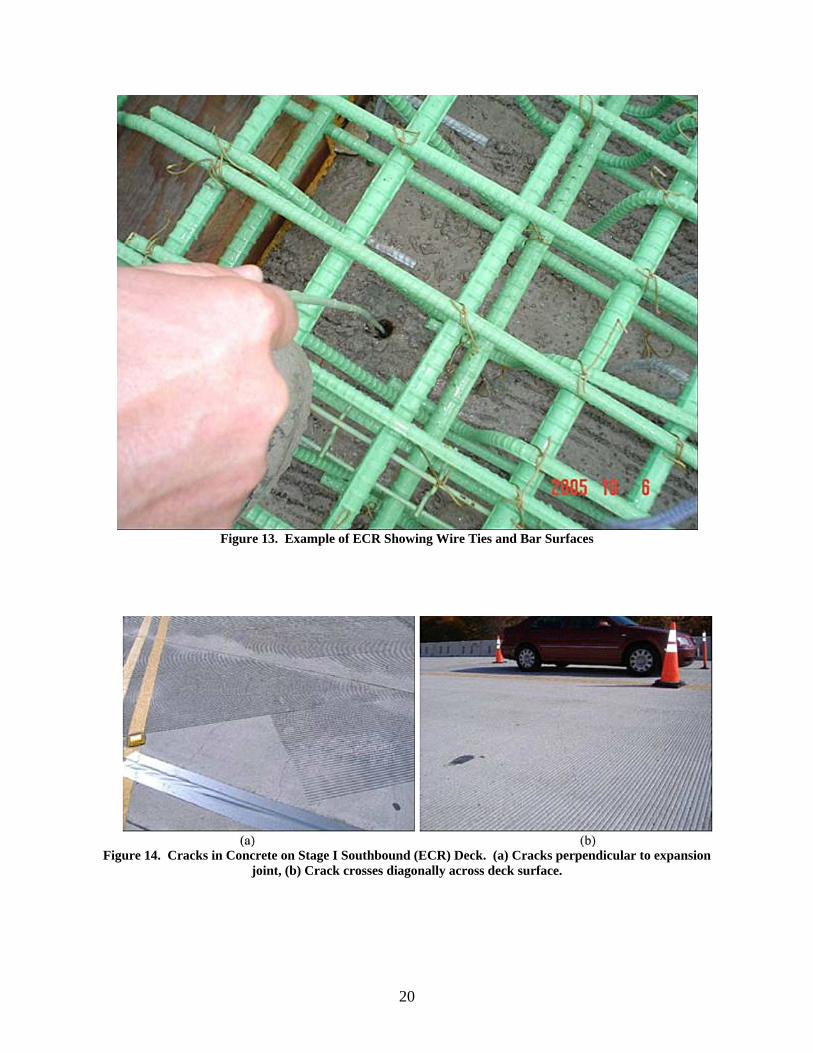
Stage I: Construction of Southbound (ECR) Deck Overview ECR was used as the reinforcement for the southbound deck. The placement of the concrete for the constrution of the Stage I deck began on October 6, 2005, with the placement of the Span A deck concrete. Approximately 3 months passed from the initial placement to the last major placement of the deck concrete. Photographs illustrating the construction of the deck are shown in Figure 10. Upon completion of construction, approximately 572,121 lb of ECR reinforcement had been used to construct the deck. A timeline showing the major casting and crack repair events that occurred during construction is shown in Figure 11. Images collected during construction, shown in Figure 12, demonstrate various possible sources for the coating damage that existed during construction. In Figure 12(a), ECR had been cut and required repair of the end before the concrete could be placed. In Figure 12(b), grit from the bottom of shoes could have abraded the coating. In Figure 12(c), the impact from the concrete aggregate as it left the hose and contacted the ECR mat could have abraded the coating. However, the deck was inspected for proper tying of the steel and repair of coating. As shown in Figure 13, the ECR appeared to be in an acceptable condition and ready for the placement of concrete.

17
Figure 10. Construction of Southbound (ECR) Deck. (a) Substructure under construction, (b) ECR on southern end of deck, (c) Close-up of deck, (d) ECR placement near completion, (e) Placement of concrete in deck, (d) Concrete placement complete.

18
Figure 11. Timeline of Major Deck Casting Events for Construction of Southbound (ECR) Deck
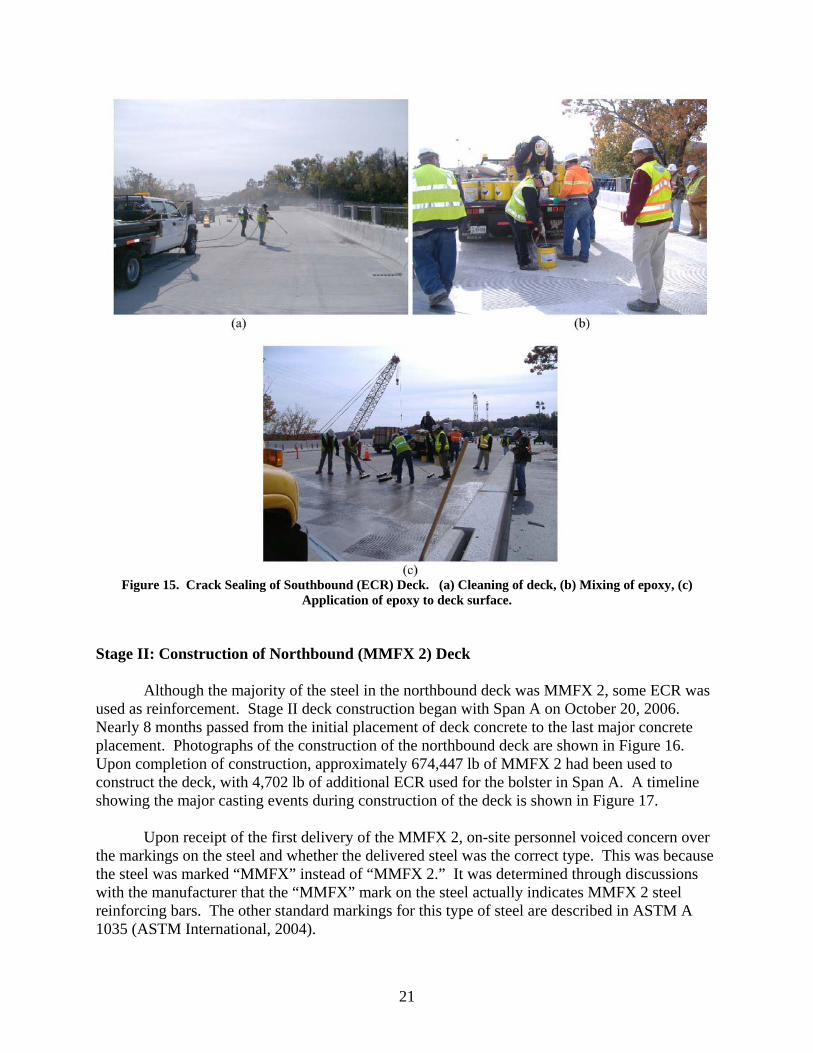
Crack Repair As discussed in the “Methods” section, the deck exhibited cracks that were deemed to be significant enough to warrant repair; examples of the cracks are shown in Figure 14. On November 3, 2006, the contractor began work to repair the cracks on the deck, which is shown in Figure 15. According to DWRs, this material, Sikadur 55 SLV epoxy, has a shelf life of 2 years in the original unopened container and a warranty of 5 years. The estimated set time for this sealant according to the DWRs is 11 hr at 40° F. To perform this operation, the following tasks were done:
1. Shotblast the deck surface. 2. Mix the Sikadur 55 SLV epoxy at a ratio of 1 gal Part A and 0.5 gal Part B epoxy. 3. Apply the epoxy to the deck. 4. Use brushes to spread the epoxy over the deck surface and into the cracks. 5. Allow the epoxy to cure. 6. Reapply traffic markings to the deck.
Initially the crack sealing, particularly the shoulder and travel lanes, was not performed in accordance with VDOT’s Special Provision for Gravity Filled Polymer Crack Sealing (VDOT, 2002) because the work was done during the day and evening and often at temperatures that were too low. The special provision states: “The concrete surface temperature shall not be less than 55°F
19
Figure 12. Sources of Coating Damage During Construction. (a) Cutting of bar ends, (b) Abrasion from bottom of shoes, (c) Impact of concrete as it leaves hose and strikes ECR.
when the sealer is applied. The sealer shall be applied during the lowest temperature period of the day, usually between 1 a.m. and 9 a.m., when the cracks are open to the greatest extent.” Thus, these cracks were not sealed in accordance with the specification.
20
Figure 13. Example of ECR Showing Wire Ties and Bar Surfaces
Figure 14. Cracks in Concrete on Stage I Southbound (ECR) Deck. (a) Cracks perpendicular to expansion
joint, (b) Crack crosses diagonally across deck surface.
21
Figure 15. Crack Sealing of Southbound (ECR) Deck. (a) Cleaning of deck, (b) Mixing of epoxy, (c)
Application of epoxy to deck surface.
Stage II: Construction of Northbound (MMFX 2) Deck Although the majority of the steel in the northbound deck was MMFX 2, some ECR was used as reinforcement. Stage II deck construction began with Span A on October 20, 2006. Nearly 8 months passed from the initial placement of deck concrete to the last major concrete placement. Photographs of the construction of the northbound deck are shown in Figure 16. Upon completion of construction, approximately 674,447 lb of MMFX 2 had been used to construct the deck, with 4,702 lb of additional ECR used for the bolster in Span A. A timeline showing the major casting events during construction of the deck is shown in Figure 17. Upon receipt of the first delivery of the MMFX 2, on-site personnel voiced concern over the markings on the steel and whether the delivered steel was the correct type. This was because the steel was marked “MMFX” instead of “MMFX 2.” It was determined through discussions with the manufacturer that the “MMFX” mark on the steel actually indicates MMFX 2 steel reinforcing bars. The other standard markings for this type of steel are described in ASTM A 1035 (ASTM International, 2004).

22
Figure 16. Construction of Northbound (MMFX 2) Deck. (a) Removal of old bridge and construction of new substructure, (b) Southern end of northbound lane, (c) ECR and MMFX 2 in deck with ECR and galvanized bars in parapet on Span A), (d) Construction continues to move from completed Span A deck toward Span G, (e) Placement of concrete on Span G, (f) Traffic moving freely across new structure.

23
Figure 17. Timeline of Major Deck Casting Events for Construction of Northbound (MMFX 2) Deck
During construction, a question arose over the availability of MMFX 2. On May 11, 2005, an email (Geers, 2005) from MMFX Steel Corporation of America, Inc., provided current inventory levels (B. Geers, unpublished data, 2005). The email also stated that a maximum of 120 days is required to manufacture new material if the material is not in inventory. A subsequent email indicated that supply issues were not related to availability of MMFX 2 (Geers, 2008). Therefore, MMFX Steel Corporation was able to produce a sufficient quantity of MMFX 2 for this project. Finally, although the northbound deck used mostly MMFX 2 steel, a limited amount of ECR was used in the deck, which is visible in Figure 18. The surface of the steel exhibited some surface rusting, but according to ASTM A1035 this was acceptable as long as the “mass, dimensions, cross-sectional area, and tensile properties of a test specimen” met the requirements described in the specification (ASTM International, 2004). Placement of Probes in Northbound Deck During the placement of concrete in Span G, eight sets of reinforcing steel probes were embedded in the concrete, as shown in Figure 19. Each probe was wired directly to a connection panel located inside a junction box embedded in the parapet. A sketch of the connection pannel with labels and one of the plug-in connectors is shown in Figure 20. The connectors are used to maintain electrical continuity between the four bars in a given sensor. Currently, there are eight connectors, all of which are plugged in, so that all sensors shown have a continuous electrical path between each of the four embedded test bars. The embedded box also serves as a reference point to locate each probe, which is shown in Figure 21. Each probe was also located using the

24
(a) (b) Figure 18. Northbound Deck Steel. (a) MMFX 2 exhibits surface rust, (b) Immediately before concrete was placed, a thin layer of moisture attributable to wetting of the formwork existed.
(a) (b)
(c)
Figure 19. (a) Corrosion rate probes placed in future travel lane wheel path, (b) Close-up of probes, (c) Concrete placement and vibration over probes.

25
Figure 20. Identification of Connection Pins For Embedded Sensors
Figure 21. Location of Probes Relative to Reference Point Along Parapet, Which Is at Center of Access Panel

26
Trimble R6 VRS Rover system, and the coordinates are provided in Table 3. The wiring and exposure areas for each probe are provided in Table 4.
Table 3. Location of Corrosion Probes in Northbound Lane
Sensor No. Probe Type Coordinates 1 ECR Clean 38ø41'05.81769"N 77ø15'28.13412"W 2 MMFX 2 Clean 38ø41'05.81281"N 77ø15'28.12320"W 3 ECR Clean 38ø41'05.80813"N 77ø15'28.12434"W 4 MMFX 2 Clean 38ø41'05.82700"N 77ø15'28.13076"W 5 MMFX 2 As Received 38ø41'05.79795"N 77ø15'28.12583"W 6 ECR As Received 38ø41'05.80778"N 77ø15'28.13444"W 7 MMFX 2 As Received 38ø41'05.81321"N 77ø15'28.13237"W 8 ECR As Received 38ø41'05.81816"N 77ø15'28.12297"W ECR Clean = no penetration in coating; MMFX 2 Clean = no rusting present.
Table 4. Probe Wiring Key and Bar Exposure Surface Area
Sensor No.
Bar Type
Bar Condition
Bar Location (Wire Color)
Average Exposure Width, in
Bar Size, No.
Exposure Area, in2
1 ECR Clean Top (Red) 2 5 3.93 1 ECR Clean 2nd (Black) 2.25 5 4.42 1 ECR Clean 3rd (White) 2.125 5 4.17 1 ECR Clean Bottom (Green) 2.125 5 4.17 2 MMFX 2 Clean Top (Red) 2 5 3.93 2 MMFX 2 Clean 2nd (Black) 2 5 3.93 2 MMFX 2 Clean 3rd (White) 2 5 3.93 2 MMFX 2 Clean Bottom (Green) 1.9375 5 3.80 3 ECR Clean Top (Red) 2 5 3.93 3 ECR Clean 2nd (Black) 2 5 3.93 3 ECR Clean 3rd (White) 2 5 3.93 3 ECR Clean Bottom (Green) 1.875 5 3.68 4 MMFX 2 Clean Top (Red) 2.125 5 4.17 4 MMFX 2 Clean 2nd (Black) 2.125 5 4.17 4 MMFX 2 Clean 3rd (White) 1.875 5 3.68 4 MMFX 2 Clean Bottom (Green) 2.25 5 4.42 5 MMFX 2 As Received Top (Red) 2.125 4 3.34 5 MMFX 2 As Received 2nd (Black) 2 4 3.14 5 MMFX 2 As Received 3rd (White) 2 4 3.14 5 MMFX 2 As Received Bottom (Green) 2.0625 4 3.24 6 ECR As Received Top (Red) 2.25 5 4.42 6 ECR As Received 2nd (Black) 2.125 5 4.17 6 ECR As Received 3rd (White) 2.25 5 4.42 6 ECR As Received Bottom (Green) 2.125 5 4.17 7 MMFX 2 As Received Top (Red) 2.25 4 3.53 7 MMFX 2 As Received 2nd (Black) 2.25 4 3.53 7 MMFX 2 As Received 3rd (White) 2.0625 4 3.24 7 MMFX 2 As Received Bottom (Green) 2 4 3.14 8 ECR As Received Top (Red) 2.25 5 4.42 8 ECR As Received 2nd (Black) 2.25 5 4.42 8 ECR As Received 3rd (White) 2.125 5 4.17 8 ECR As Received Bottom (Green) 2.25 5 4.42

27
Initial Condition Survey
Weather Conditions The temperature generally ranged between 10° F and 100° F. The data from September 2005 to September 2007 are provided in Figure 22. This range of dates was selected because it covered the period of concrete placement for the decks. Key placement events shown in the timelines in Figures 11 and 17 are highlighted in Figure 22. During construction, rain and snow events occurred. The precipitation and snow data are provided in Figure 23, which also includes the timeline data from Figures 11 and 17.
Figure 22. Temperature Data from Manassas Weather Station. SBL = southbound lane, NBL = northbound lane. Visual Survey of Finished Decks At the time of this study, the southbound (ECR) deck appeared to be in good condition. The deck had a grooved surface finish, as shown in Figure 24. The epoxy sealant applied to the cracks appeared to be in fair shape. However, it is known that the epoxy did not completely penetrate into the deck based on the visual analysis of the underside of the deck by inspectors in 2008. Further, testing by VDOT on three 3.9-in-long concrete core samples (of 3.9 in in diameter) that were cracked verified that the epoxy penetrated only 1.4 in into the crack. However, after the epoxy sealant was applied, the moisture penetration through the deck that was detected before the sealant was applied had stopped.

28
Figure 23. Precipitation and Snow Data from Manassas Weather Station. SBL = southbound lane, NBL = northbound lane.
Figure 24. Southbound (ECR) Deck Image

29
A visual survey of the northbound (MMFX 2) deck indicated the deck is in fairly good condition, as shown in Figure 25, and had a grooved surface finish. The deck did exhibit some cracking, which is discussed in greater detail later. It should be noted that the presence of SIP forms can justify the sealing of cracks in a deck. Even though this deck exhibited some cracking, it was decided in this case that an epoxy sealant would not be applied because the deck was constructed using CRR.
Figure 25. Northbound (MMFX 2) Raised Median and Deck Image
Crack Mapping Deck Surface A fairly extensive crack survey was performed on the decks. Of the two decks, the southbound (ECR) deck was more difficult to evaluate. This was due to the placement of the epoxy sealant on the deck, which increased the difficulty of evaluating the deck surface. Therefore, it is important to note that cracks on the southbound deck were periodically hidden by the epoxy sealant.
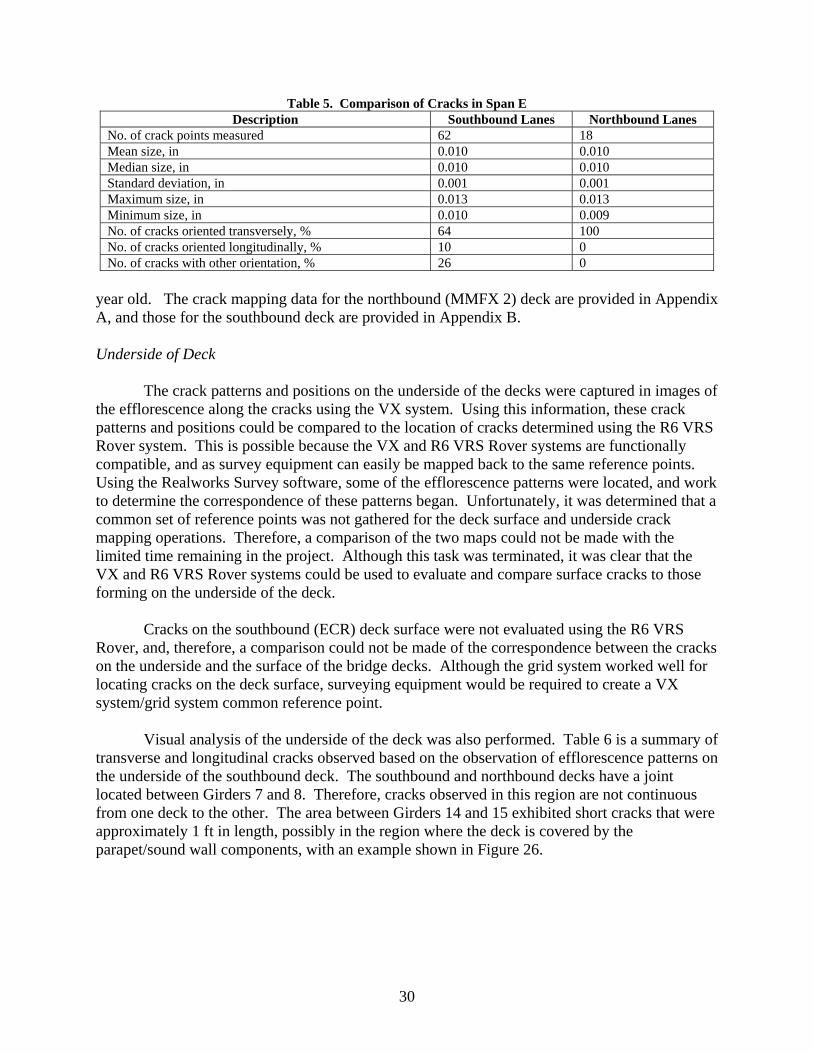
To compare the deck surface cracks, Span E was selected; a summary of the crack data is provided in Table 5. Although the southbound lane had more cracks in this span, the median, mean, standard deviation, maximum, and minimum crack sizes were similar. However, the crack orientation differed for the two decks. At the time of mapping, both decks were at least 1
30
Table 5. Comparison of Cracks in Span E Description Southbound Lanes Northbound Lanes
No. of crack points measured 62 18 Mean size, in 0.010 0.010 Median size, in 0.010 0.010 Standard deviation, in 0.001 0.001 Maximum size, in 0.013 0.013 Minimum size, in 0.010 0.009 No. of cracks oriented transversely, % 64 100 No. of cracks oriented longitudinally, % 10 0 No. of cracks with other orientation, % 26 0
year old. The crack mapping data for the northbound (MMFX 2) deck are provided in Appendix A, and those for the southbound deck are provided in Appendix B. Underside of Deck
The crack patterns and positions on the underside of the decks were captured in images of the efflorescence along the cracks using the VX system. Using this information, these crack patterns and positions could be compared to the location of cracks determined using the R6 VRS Rover system. This is possible because the VX and R6 VRS Rover systems are functionally compatible, and as survey equipment can easily be mapped back to the same reference points. Using the Realworks Survey software, some of the efflorescence patterns were located, and work to determine the correspondence of these patterns began. Unfortunately, it was determined that a common set of reference points was not gathered for the deck surface and underside crack mapping operations. Therefore, a comparison of the two maps could not be made with the limited time remaining in the project. Although this task was terminated, it was clear that the VX and R6 VRS Rover systems could be used to evaluate and compare surface cracks to those forming on the underside of the deck.
Cracks on the southbound (ECR) deck surface were not evaluated using the R6 VRS Rover, and, therefore, a comparison could not be made of the correspondence between the cracks on the underside and the surface of the bridge decks. Although the grid system worked well for locating cracks on the deck surface, surveying equipment would be required to create a VX system/grid system common reference point.
Visual analysis of the underside of the deck was also performed. Table 6 is a summary of transverse and longitudinal cracks observed based on the observation of efflorescence patterns on the underside of the southbound deck. The southbound and northbound decks have a joint located between Girders 7 and 8. Therefore, cracks observed in this region are not continuous from one deck to the other. The area between Girders 14 and 15 exhibited short cracks that were approximately 1 ft in length, possibly in the region where the deck is covered by the parapet/sound wall components, with an example shown in Figure 26.

31
Table 6. Number of Transverse and Longitudinal Efflorescence Patterns Observed on Underside of Southbound (ECR) Deck
Girder Number and Pattern Orientation 7-8a 8-9 9-10 10-11 11-12 12-13 13-14 14-15
Span Tb Lc T L T L T L T L T L T L T L Span A 0 0 2 0 2 0 4 0 4 0 3 0 7 0 29 0 Span B 8 0 8 0 8 0 7 0 11 0 7 0 9 0 11 0 Span C 8 0 11 0 12 0 9 0 13 0 15 0 14 1 Hatch marks indicate indicate no measurements were made since deck location does not exist. a Location of joint between ECR and MMFX 2 decks. b T = transverse efflorescence pattern. c L = longitudinal efflorescence pattern.
Figure 26. Short Efflorescence Pattern Adjacent to Girder on Underside of Southbound Deck
Similar to the southbound deck, the majority of the cracks observed on the underside of the northbound (MMFX 2) deck were oriented in the transverse direction (see Table 7). An example of the crack pattern is shown in Figure 27.
Table 7. Number of Transverse and Longitudinal Efflorescence Patterns Observed on Underside of Northbound (MMFX 2) Deck
Girder Number and Pattern Orientation 1-2 2-3 3-4 4-5 5-6 6-7 7-8 a
Span Tb Lc T L T L T L T L T L T L Span A 9 0 9 0 5 1 7 0 8 0 10 0 3 0 Span B 9 0 10 0 10 0 9 0 7 0 11 0 2 0 Span C 12 0 11 0 12 0 18 0 17 0 11 0 4 0
a Location of joint between ECR and MMFX 2 decks. b T = transverse efflorescence pattern. c L = longitudinal efflorescence pattern.

32
Figure 27. Efflorescence Pattern Between Two Girders on Underside of Northbound (MMFX 2) Deck With Joint for Northbound/Southbound Decks Visible at Right
Immediately following a rainstorm on August 28, 2008, water was evident on the underside of both decks (Seung-Kyoung Lee, personal communication, 2008). This indicates that the cracks are providing a pathway for the water on the surface to penetrate through the structure on both decks. The underside of both decks is shown in Figure 28.
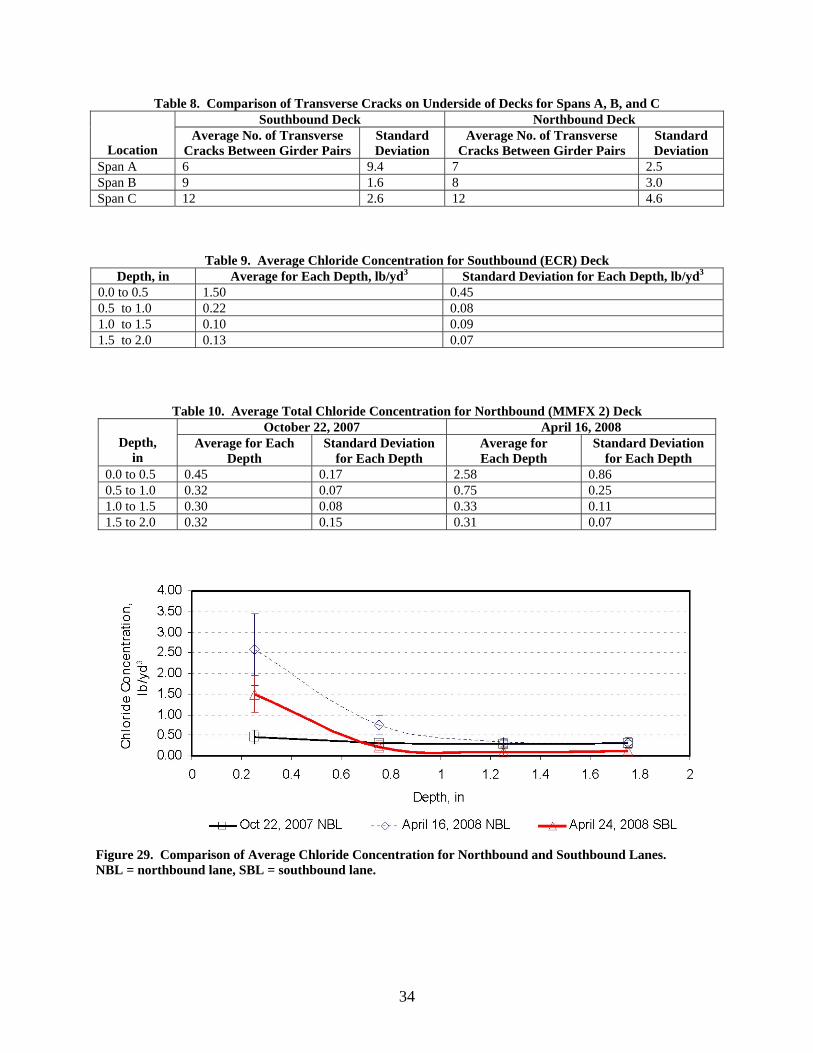
A comparison of the transverse cracking between the two decks is shown in Table 8. Although the average numbers are close, the standard deviations indicate variability in the number of cracks between the girders. Although some of the deck cracks are obscured by the girders, some appear to be continuous along the bottom of the decks. Chloride Analysis The average chloride concentration on the southbound (ECR) deck based on concrete specimens collected on April 24, 2008, is shown in Table 9. Most of the chlorides were located in the upper 0.5 in of concrete. This was expected and will help provide the gradient needed for the diffusional process to ensue. The raw data are provided in Appendix C. The average chloride concentration for the northbound (MMFX 2) deck based on concrete specimens collected on October 22, 2007, and April 16, 2008, is shown in Table 10. The change in chloride concentration is most drastic in the first 0.5 in of concrete, and then in the 0.5 to 1.0 in region. This is expected and will provide the gradient that will promote the diffusion of chloride into the deck. The raw data are provided in Appendix C. According to the chloride concentrations, the northbound (MMFX 2) structure is exhibiting a higher chloride level concentration, which is shown in Figure 29. This was unexpected since the SBL is older than the NBL. One possibility is that the epoxy used to seal the cracks in the southbound deck is keeping the chlorides from penetrating into the concrete. However, comparison of the background level for the NBL, the October 22, 2007, line to the

33
(a)
(b)
Figure 28. Underside of Bridge Decks Following Rain. (a) Southbound deck, (b) Northbound deck. deeper SBL samples, indicates that the NBL appears to have a higher baseline concentration. The amount of deviation in the chloride concentration near the surface for each deck was also larger than the deviation deeper into the concrete.
34
Table 8. Comparison of Transverse Cracks on Underside of Decks for Spans A, B, and C Southbound Deck Northbound Deck
Location Average No. of Transverse
Cracks Between Girder Pairs Standard Deviation
Average No. of Transverse Cracks Between Girder Pairs
Standard Deviation
Span A 6 9.4 7 2.5 Span B 9 1.6 8 3.0 Span C 12 2.6 12 4.6
Table 9. Average Chloride Concentration for Southbound (ECR) Deck Depth, in Average for Each Depth, lb/yd3 Standard Deviation for Each Depth, lb/yd3
0.0 to 0.5 1.50 0.45 0.5 to 1.0 0.22 0.08 1.0 to 1.5 0.10 0.09 1.5 to 2.0 0.13 0.07
Table 10. Average Total Chloride Concentration for Northbound (MMFX 2) Deck October 22, 2007 April 16, 2008
Depth, in
Average for Each Depth
Standard Deviation for Each Depth
Average for Each Depth
Standard Deviation for Each Depth
0.0 to 0.5 0.45 0.17 2.58 0.86 0.5 to 1.0 0.32 0.07 0.75 0.25 1.0 to 1.5 0.30 0.08 0.33 0.11 1.5 to 2.0 0.32 0.15 0.31 0.07
Figure 29. Comparison of Average Chloride Concentration for Northbound and Southbound Lanes. NBL = northbound lane, SBL = southbound lane.
35
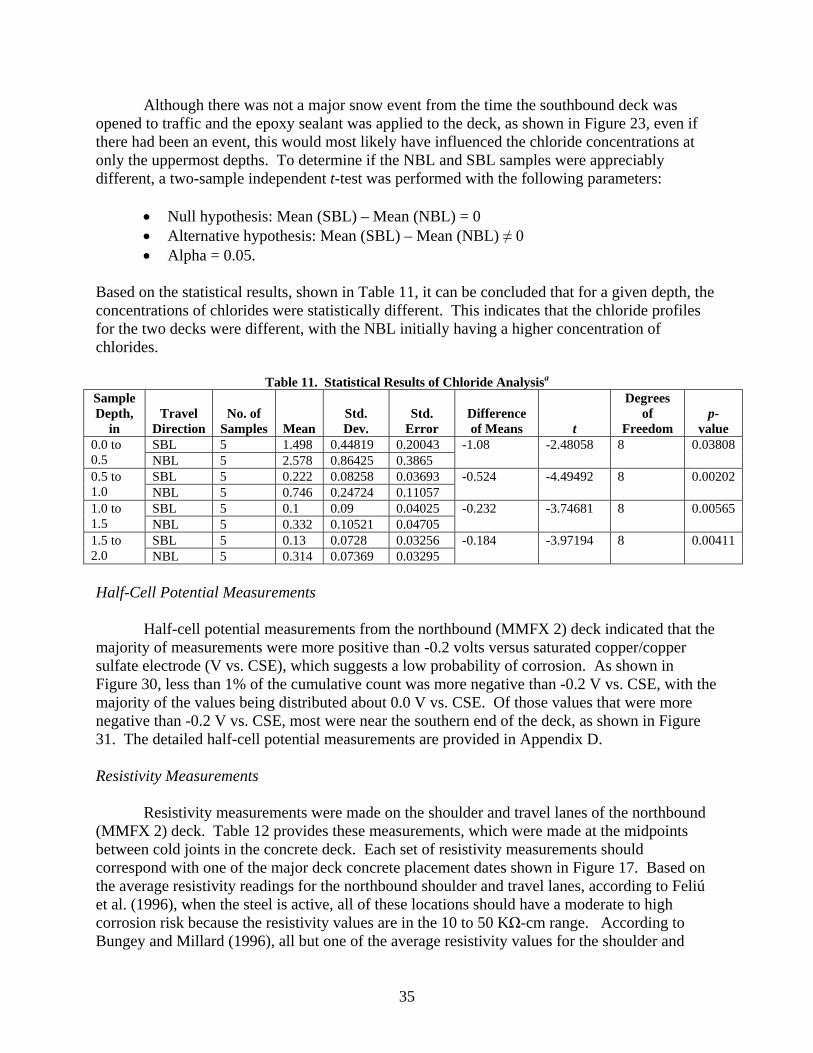
Although there was not a major snow event from the time the southbound deck was opened to traffic and the epoxy sealant was applied to the deck, as shown in Figure 23, even if there had been an event, this would most likely have influenced the chloride concentrations at only the uppermost depths. To determine if the NBL and SBL samples were appreciably different, a two-sample independent t-test was performed with the following parameters:
• Null hypothesis: Mean (SBL) – Mean (NBL) = 0 • Alternative hypothesis: Mean (SBL) – Mean (NBL) ≠ 0 • Alpha = 0.05.
Based on the statistical results, shown in Table 11, it can be concluded that for a given depth, the concentrations of chlorides were statistically different. This indicates that the chloride profiles for the two decks were different, with the NBL initially having a higher concentration of chlorides.
Table 11. Statistical Results of Chloride Analysisa Sample Depth,
in
Travel
Direction
No. of
Samples
Mean
Std. Dev.
Std.
Error
Difference of Means
t
Degrees of
Freedom
p-
value SBL 5 1.498 0.44819 0.20043 0.0 to
0.5 NBL 5 2.578 0.86425 0.3865 -1.08 -2.48058 8 0.03808
SBL 5 0.222 0.08258 0.03693 0.5 to 1.0 NBL 5 0.746 0.24724 0.11057
-0.524 -4.49492 8 0.00202
SBL 5 0.1 0.09 0.04025 1.0 to 1.5 NBL 5 0.332 0.10521 0.04705
-0.232 -3.74681 8 0.00565
SBL 5 0.13 0.0728 0.03256 1.5 to 2.0 NBL 5 0.314 0.07369 0.03295
-0.184 -3.97194 8 0.00411
Half-Cell Potential Measurements Half-cell potential measurements from the northbound (MMFX 2) deck indicated that the majority of measurements were more positive than -0.2 volts versus saturated copper/copper sulfate electrode (V vs. CSE), which suggests a low probability of corrosion. As shown in Figure 30, less than 1% of the cumulative count was more negative than -0.2 V vs. CSE, with the majority of the values being distributed about 0.0 V vs. CSE. Of those values that were more negative than -0.2 V vs. CSE, most were near the southern end of the deck, as shown in Figure 31. The detailed half-cell potential measurements are provided in Appendix D. Resistivity Measurements
Resistivity measurements were made on the shoulder and travel lanes of the northbound (MMFX 2) deck. Table 12 provides these measurements, which were made at the midpoints between cold joints in the concrete deck. Each set of resistivity measurements should correspond with one of the major deck concrete placement dates shown in Figure 17. Based on the average resistivity readings for the northbound shoulder and travel lanes, according to Feliú et al. (1996), when the steel is active, all of these locations should have a moderate to high corrosion risk because the resistivity values are in the 10 to 50 KΩ-cm range. According to Bungey and Millard (1996), all but one of the average resistivity values for the shoulder and

36
Figure 30. Distribution of Half-Cell Potential Measurements Along Northbound Shoulder and Travel Lane
Figure 31. Map Showing Half-Cell Potential Along Northbound Shoulder and Travel Lane

37
Table 12. Northbound Shoulder and Travel Lane Resistivity Measurement Northbound Shoulder Northbound Travel Lane Distance
from Abutment
A, ft
Distance From
Parapet, in
Resistivity, KΩ cm
Average Resistivity,
KΩ cm
Distance From
Parapet, in
Resistivity, KΩ cm
Average Resistivity,
KΩ cm 70 48 18.5 18 24 20.2 144.0 22.0 18.0 26.0 22.0 211 66 30 30 30 30.0 144.0 35.0 25.0 32.0 30.7 351 72 33 35 36 34.7 131.0 33.0 30.0 23.0 28.7 500 48 32 21 39 30.7 135.0 32.0 39.0 27.0 32.7 645 48 35 22 28 28.3 144.0 18.0 30.0 25.0 24.3 760 48 31 35 32 32.7 144.0 31.0 28.0 42.0 33.7 881 48 30 35 28 31.0 144.0 25.0 18.0 29.0 24.0 1001 48 25 29 35 29.7 144.0 33.0 18.0 30.0 27.0 1102 48 37 18 29 28.0 144.0 15.0 17.0 15.0 15.7 travel lanes would indicate a low probability of significant corrosion in unsaturated concrete with active steel because these values are greater than 20 KΩ-cm. The one exception, the 15.7 KΩ-cm value, according to Bungey and Millard (1996), would fall in the middle of the 10 KΩ-cm to 20 KΩ-cm range and should be considered to have a low to moderate probability for significant corrosion. Corrosion Rates and Open Citcuit Potentials in Northbound (MMFX 2) Deck The measured corrosion rates, in mils per year (mpy), and OCPs, in volts versus saturated copper/copper sulfate electrode, for the top bar embedded in the northbound deck are shown in Figure 32. The OCP values are indicative of a steel that has a low probability of corrosion.
Figure 32. Measured Corrosion Rates and Open Circuit Potentials (Seung-Kyoung Lee, unpublished data,
2008)

38
Neither the corrosion rates nor OCP values, however, indicate a significant difference regarding bar type or bar condition.
Cost Estimation and Comparison
Although the Route 123 Bridge was one of seven parts of the total IBRCP project, it
comprised 77.1% of the total project cost at bid. The contract bid prices for ECR and MMFX 2 per pound were $0.51 and $0.78, respectively. Total reinforcement costs formed 3.9% of the project costs at bid, yet planned bridge deck reinforcement costs formed only 4.13% of the bridge portion cost at bid. Ultimately, the total bridge deck reinforcement, including the unanticipated reinforcement of high bolster in the northbound lanes, still accounted at bid for only 4.24% of the bridge portion of the roughly $25 million project. To summarize, then, it appears that in this IBRCP project, a construction material that represented about 4% of total bridge costs at bid may ultimately determine the bridge’s operational life.
As discussed in the “Methods” section, the cost comparison between ECR and MMFX 2 is reported in terms of both dollars and labor-hours. Dollar Costs Direct Dollar Costs
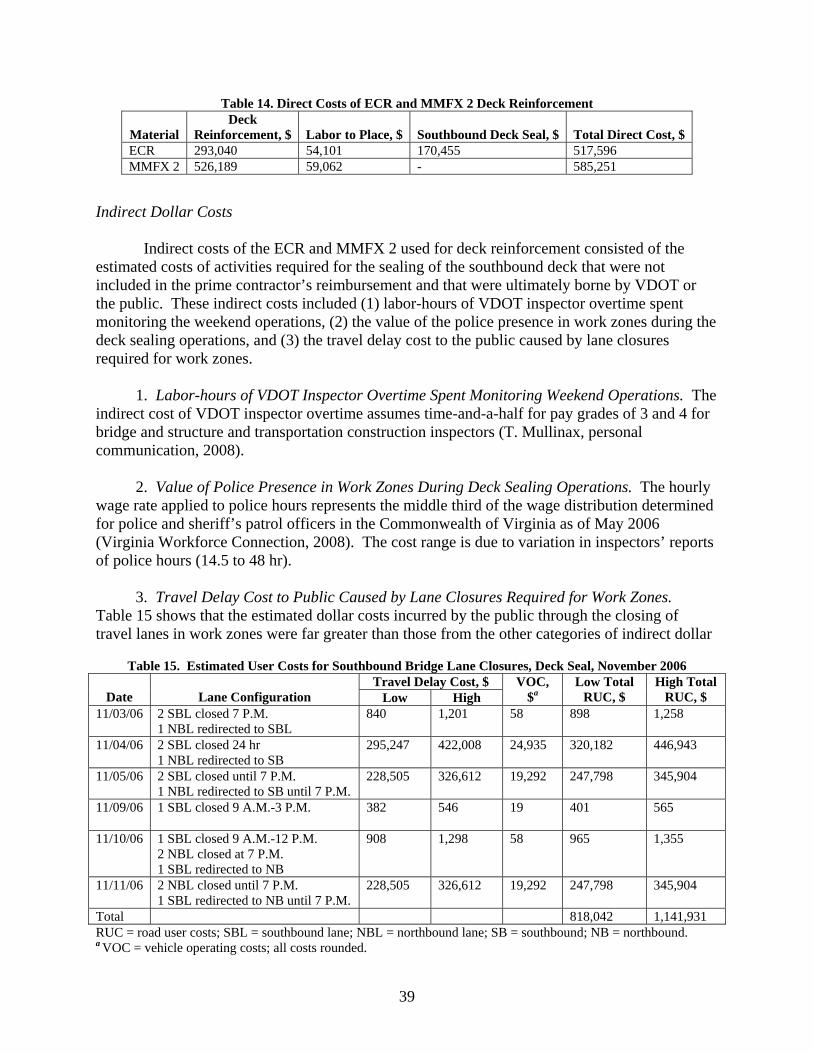
Direct costs, either documented or estimated, consisted of the following: (1) the cost of the deck reinforcing steel placed in the southbound and northbound lanes of the bridge, including that for bolster reinforcement; (2) the cost of the labor to handle, transport, and install the reinforcing steel; and (3) the cost for the southbound deck seal operation, payable to the prime contractor. The deck seal operation was included in the direct cost of ECR reinforcement because the decision to seal only the southbound deck was influenced by the presence of ECR in the southbound lanes. Table 13 shows the quantities of deck reinforcement materials used in the given decks as reported in the DWRs. Table 14 shows total direct costs.
Table 13. Quantities of Reinforcing Steel Placed in Bridge Decks ECR, lb MMFX 2, lb
Span Deck Bolster Deck Bolster A 82,648.8 4,702.0a 76,167.5 B 82,648.8 78,204.6 4,749.2 C 84,172.5 78,204.6 2,535.4 D 70,130.1 78,204.6 - E 84,173.6 64,873.2 4,796.6 F 84,173.6 72,871.6 8,476.8 G 84,173.6 65,254.6 8,278.1 E/F 58,654.0 7,057.6 F/G 58,654.0 7,464.5 Total 572,121.0 4,702.0a 631,088.7 43,358.2 E/F = concrete pour sequence designation for portions of Span E and Span F; F/G = concrete pour sequence designation for portions of Span F and Span G. a Placed in northbound Span A.
39
Table 14. Direct Costs of ECR and MMFX 2 Deck Reinforcement
Material Deck
Reinforcement, $
Labor to Place, $
Southbound Deck Seal, $
Total Direct Cost, $ ECR 293,040 54,101 170,455 517,596 MMFX 2 526,189 59,062 - 585,251
Indirect Dollar Costs
Indirect costs of the ECR and MMFX 2 used for deck reinforcement consisted of the estimated costs of activities required for the sealing of the southbound deck that were not included in the prime contractor’s reimbursement and that were ultimately borne by VDOT or the public. These indirect costs included (1) labor-hours of VDOT inspector overtime spent monitoring the weekend operations, (2) the value of the police presence in work zones during the deck sealing operations, and (3) the travel delay cost to the public caused by lane closures required for work zones.
1. Labor-hours of VDOT Inspector Overtime Spent Monitoring Weekend Operations. The indirect cost of VDOT inspector overtime assumes time-and-a-half for pay grades of 3 and 4 for bridge and structure and transportation construction inspectors (T. Mullinax, personal communication, 2008). 2. Value of Police Presence in Work Zones During Deck Sealing Operations. The hourly wage rate applied to police hours represents the middle third of the wage distribution determined for police and sheriff’s patrol officers in the Commonwealth of Virginia as of May 2006 (Virginia Workforce Connection, 2008). The cost range is due to variation in inspectors’ reports of police hours (14.5 to 48 hr). 3. Travel Delay Cost to Public Caused by Lane Closures Required for Work Zones. Table 15 shows that the estimated dollar costs incurred by the public through the closing of travel lanes in work zones were far greater than those from the other categories of indirect dollar
Table 15. Estimated User Costs for Southbound Bridge Lane Closures, Deck Seal, November 2006
Travel Delay Cost, $ Date
Lane Configuration Low High
VOC, $a
Low Total RUC, $
High Total RUC, $
11/03/06 2 SBL closed 7 P.M. 1 NBL redirected to SBL
840 1,201 58 898 1,258
11/04/06 2 SBL closed 24 hr 1 NBL redirected to SB
295,247 422,008 24,935 320,182
446,943
11/05/06 2 SBL closed until 7 P.M. 1 NBL redirected to SB until 7 P.M.
228,505 326,612 19,292 247,798
345,904
11/09/06 1 SBL closed 9 A.M.-3 P.M. 382 546 19 401
565
11/10/06 1 SBL closed 9 A.M.-12 P.M. 2 NBL closed at 7 P.M. 1 SBL redirected to NB
908 1,298 58 965
1,355
11/11/06 2 NBL closed until 7 P.M. 1 SBL redirected to NB until 7 P.M.
228,505 326,612 19,292 247,798
345,904
Total 818,042 1,141,931 RUC = road user costs; SBL = southbound lane; NBL = northbound lane; SB = southbound; NB = northbound. a VOC = vehicle operating costs; all costs rounded.
40
costs associated with the deck seal operations (see Table 16). The preponderance of assumptions necessary to choose values for traffic parameters that would be realistic in the middle of the bridge construction period may throw the estimates into a speculative light. On the other hand, it is noteworthy that the average annual daily traffic on the bridge was estimated by VDOT’s Traffic Engineering Division (again using a similar neighboring traffic link) to have risen 51% from 2006 to 2007, when both decks (six travel lanes) of the Route 123 Bridge were finished and open to traffic (VDOT, Traffic Engineering Division, unpublished data, 2008). A minimal conclusion is that RUCs as a result of work zone lane closures would be substantially higher today and in the future than they were in 2006, however estimated.
The range of the cost increment attributable to lane closure is due to high and low
assumptions of the dollar value of a passenger car-hour ($/PC-hr) and a truck-hour ($/TR-hr). The lower cost is based on a Consumer Price Index–adjusted FHWA estimate of $10.34/PC-hr (FHWA, 2002) and $34.95/TR-hr (Gillespie, 2007); the upper cost is based on a more recent Texas Transportation Institute estimate of $15.40/PC-hr and $73.32/TR-hr specifically for Virginia (cited in Dougald, 2007). A passenger car occupancy rate of 1.22 was assumed (Bureau of Transportation Statistics, 2003).
Combined 24-hr costs are shown in Table 15, although RUCs were estimated using
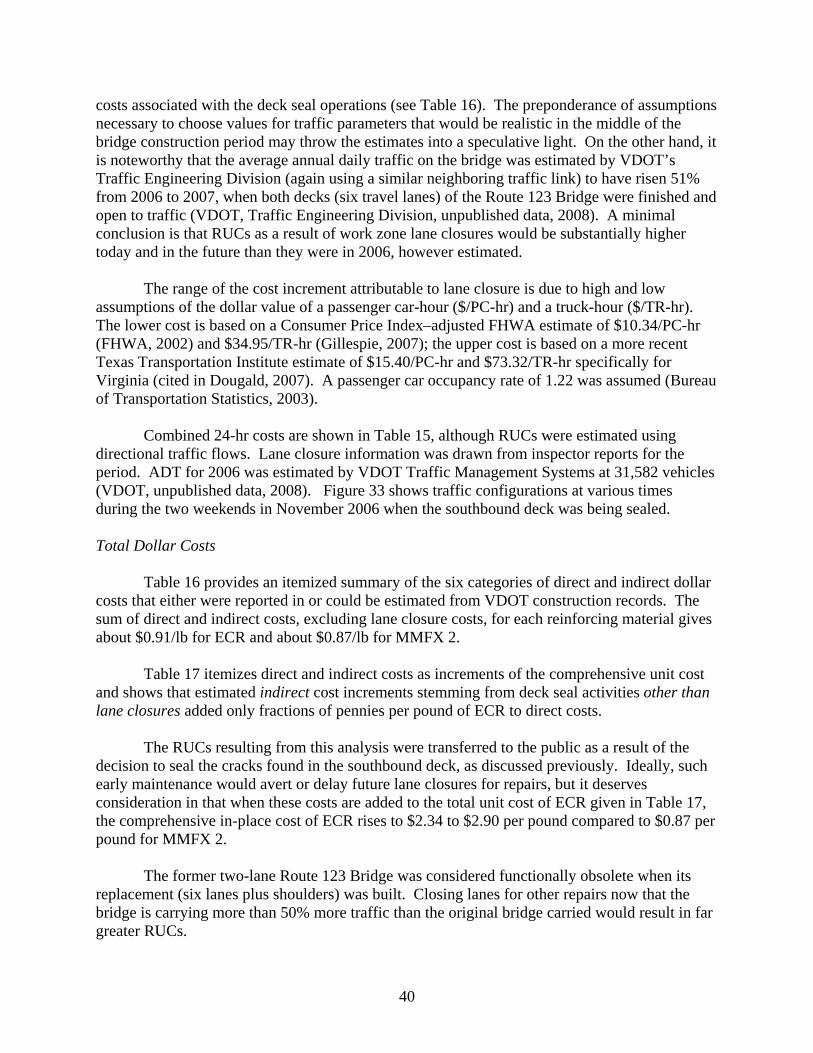
directional traffic flows. Lane closure information was drawn from inspector reports for the period. ADT for 2006 was estimated by VDOT Traffic Management Systems at 31,582 vehicles (VDOT, unpublished data, 2008). Figure 33 shows traffic configurations at various times during the two weekends in November 2006 when the southbound deck was being sealed.
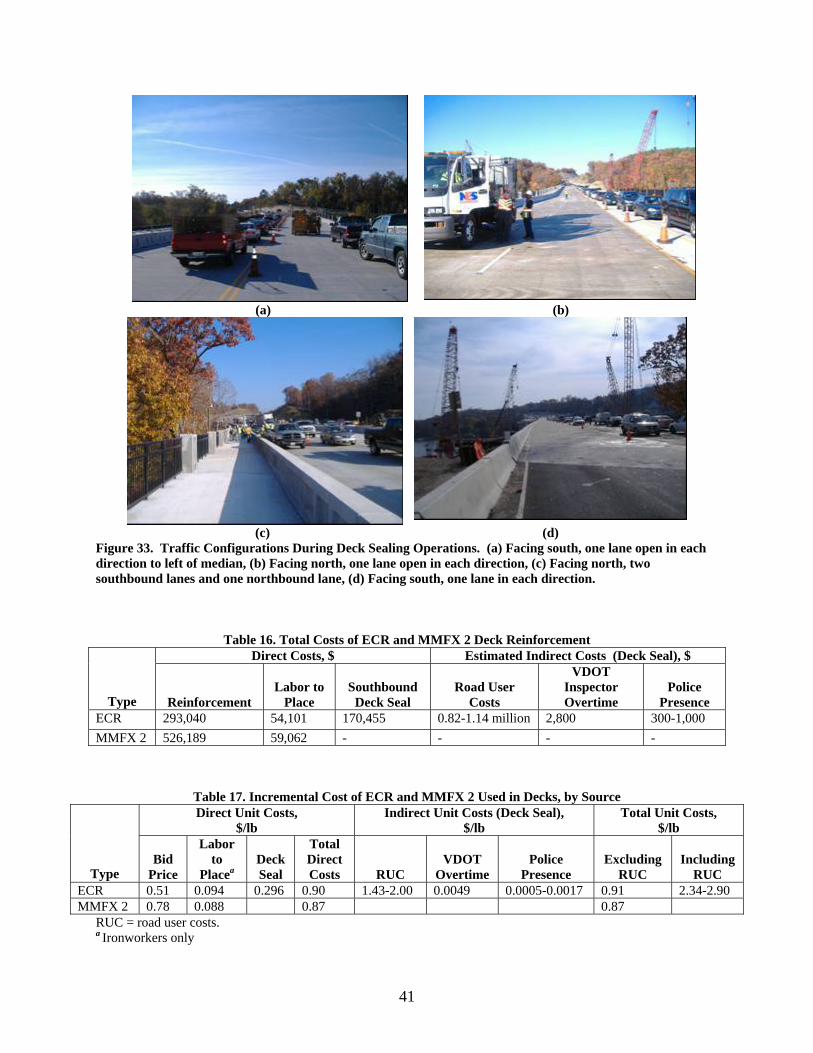
Total Dollar Costs
Table 16 provides an itemized summary of the six categories of direct and indirect dollar costs that either were reported in or could be estimated from VDOT construction records. The sum of direct and indirect costs, excluding lane closure costs, for each reinforcing material gives about $0.91/lb for ECR and about $0.87/lb for MMFX 2.
Table 17 itemizes direct and indirect costs as increments of the comprehensive unit cost and shows that estimated indirect cost increments stemming from deck seal activities other than lane closures added only fractions of pennies per pound of ECR to direct costs.
The RUCs resulting from this analysis were transferred to the public as a result of the
decision to seal the cracks found in the southbound deck, as discussed previously. Ideally, such early maintenance would avert or delay future lane closures for repairs, but it deserves consideration in that when these costs are added to the total unit cost of ECR given in Table 17, the comprehensive in-place cost of ECR rises to $2.34 to $2.90 per pound compared to $0.87 per pound for MMFX 2.
The former two-lane Route 123 Bridge was considered functionally obsolete when its
replacement (six lanes plus shoulders) was built. Closing lanes for other repairs now that the bridge is carrying more than 50% more traffic than the original bridge carried would result in far greater RUCs.
41
(a) (b)
(c) (d)
Figure 33. Traffic Configurations During Deck Sealing Operations. (a) Facing south, one lane open in each direction to left of median, (b) Facing north, one lane open in each direction, (c) Facing north, two southbound lanes and one northbound lane, (d) Facing south, one lane in each direction.
Table 16. Total Costs of ECR and MMFX 2 Deck Reinforcement Direct Costs, $ Estimated Indirect Costs (Deck Seal), $
Type
Reinforcement
Labor to
Place
Southbound
Deck Seal
Road User
Costs
VDOT Inspector Overtime
Police
Presence ECR 293,040 54,101 170,455 0.82-1.14 million 2,800 300-1,000
MMFX 2 526,189 59,062 - - - -
Table 17. Incremental Cost of ECR and MMFX 2 Used in Decks, by Source Direct Unit Costs,
$/lb Indirect Unit Costs (Deck Seal),
$/lb Total Unit Costs,
$/lb
Type
Bid
Price
Labor to
Placea
Deck Seal
Total Direct Costs
RUC
VDOT
Overtime
Police
Presence
Excluding
RUC
Including
RUC ECR 0.51 0.094 0.296 0.90 1.43-2.00 0.0049 0.0005-0.0017 0.91 2.34-2.90 MMFX 2 0.78 0.088 0.87 0.87
RUC = road user costs. a Ironworkers only

42
Labor-Hour Costs Table 18 shows a direct cost comparison of ECR and MMFX 2 in labor-hours.
Categories and quantities of labor involved in placing deck reinforcement steel are given as recorded in inspectors’ DWRs. The results indicate that compared with ECR, almost 11% more MMFX 2 was placed per total labor-hour. This might be due to the less restrictive handling requirements of MMFX 2 relative to ECR, as Figure 34 suggests.
Moreover, the values in Table 18 show that the increment of unit cost attributable to
labor for placement (measured in ironworker hours) was about 8.7% less per pound for MMFX 2 than for ECR. In these terms, it may be said that per nonsupervisor labor-hour, the labor productivity advantage for using MMFX 2 was about 9%.
It should be noted that the labor-hours counted as expended on deck reinforcement in the
northbound deck included labor-hours expended on roughly 4,700 lb of ECR for additional bolster in northbound Span A and about 43,300 lb of MMFX 2 for additional bolster in other northbound spans.
Given the marked emphasis on situations when unsatisfactory handling and storage of
ECR were noted in inspectors’ records during construction of the southbound deck, the special
Table 18. Labor to Supervise, Transport, and Place Deck Reinforcing Steel Quantity Placed,
lb Type
Deck
Bolster
Subcontractor
Supervisor/ Foreman, labor-hr
SubcontractorIronworker,
labor-hr
Prime Contractor
Crane Operator, labor-hr
Lb Material/
Nonsupervisor Labor-hr,
lb/hr
Lb Material/
Total Labor-hr,
lb/hr ECR 572,121 (4,702)a 361 1,734 158 302.4 253.9 MMFX 2 631,089 48,060b 313 1,893 188 326.4 283.7
a This ECR was placed in northbound Span A alongside MMFX 2, but the labor hours to place it were not tracked separately from those to place the MMFX 2 in VDOT or prime contractor records, as noted earlier in this report. b Includes approximately 4,700 lb of ECR placed for added bolster in Span A.
Figure 34. Walkways Not Required Over MMFX 2
43
requirements of ECR, when they were actually practiced, may account for the lower labor productivity in overall placement of deck ECR. It is also worth noting that in the case of ECR, supervisors were reimbursed for 15% more hours for placement of only 90.6% as much rebar by weight as compared to MMFX 2. The discrepancy in crane hours might also be explained by the restrictive handling recommendations for ECR. Uncoated corrosion-resistant reinforcing bars, such as MMFX 2, have few if any restrictive requirements that complicate transport by crane.
SUMMARY OF RESULTS
Construction of Decks
• Concerns over the availability of MMFX 2 were unfounded. • Rolled markings on the surface steel indicated “MMFX” rather than “MMFX 2.” This
resulted in uncertainty over the type of steel that was received; however, it was determined that the surface of MMFX 2 is routinely marked “MMFX.” The other rolled markings were consistent with those specified in ASTM A1035.
• Initially, the crack sealing, particularly the shoulder and travel lanes, was not done in
accordance with the VDOT special provision because the work was done during the day and evening and often at temperatures that were lower than those specified. These cracks were not properly sealed.
Initial Condition of Decks
• Cracks were present on both decks. A recent visual analysis of the underside of the deck indicated that water is able to penetrate the cracks to the bottom of the concrete on both decks.
• Although the crack sealant on the southbound (ECR) deck was warranted for 5 years, water
is penetrating the deck and reaching the underside after only 1.75 years. • Resistivity measurements on the northbound (MMFX 2) deck indicated that if the steel were
to become active, the concrete has a low probability of significant corrosion. • Half-cell measurements indicated that most of the MMFX 2 steel has reached a passive
condition. • In both decks, the chloride analysis indicated that salt is penetrating into the upper region of
the concrete but that the regions closer to the steel have lower chloride concentrations.

44
Cost Comparison of Deck Reinforcement Materials
Dollar Costs • By including the cost of labor to place the ECR deck reinforcement and the cost of the epoxy
seal of the entire southbound deck, the direct in-place cost of ECR increased by about 76% to $0.90/lb. By including the cost of labor to place MMFX 2 in the northbound deck, the direct in-place cost of MMFX 2 increased by about 11% to $0.87/lb.
• By including indirect labor costs to VDOT and RUCs to the public imposed by the
southbound (ECR) deck sealing operations, the comprehensive in-place cost of ECR more than quadrupled the bid price of ECR from $0.51/lb to a final in-place cost range of $2.34 to $2.90/lb. This higher comprehensive unit price for ECR suggests that MMFX 2 deck reinforcement is potentially far more cost-effective primarily if RUC savings are realized from lower maintenance requirements.
Labor-hour Costs • Inspectors’ records indicated that ironworkers placed on average about 329.9 lb/labor-hr of
ECR deck reinforcement and about 358.8 lb/labor-hour of MMFX 2 bolster and deck reinforcement over the course of the bridge project. This suggests that MMFX 2 is associated with an average ironworker productivity edge over ECR of about 9% per labor-hour. Moreover, labor productivity in placing MMFX 2 will probably improve further as familiarity with the material increases.
• Average labor productivity estimates from this study suggested that the handling
requirements of ECR led to additional supervisory costs and additional ironworker costs relative to those associated with uncoated CRR. Inspectors’ records indicated that the subcontractor billed 15% more supervisor hours to place ECR in the southbound deck than to place MMFX 2 in the northbound deck, yet almost 16% less ECR than MMFX 2 was placed by weight.
• When supervisor, crane operator, and ironworker labor-hours were combined, the average
labor productivity (pounds per labor-hour) for placement of MMFX 2 was about 11% greater than for ECR. When ironworker and crane operator (i.e., nonsupervisor) labor-hours were considered, average labor productivity for MMFX 2 was about 8% greater than for ECR.
• The special handling requirements for ECR are a plausible explanation for the lower average
labor productivity in the placement of ECR compared to that for MMFX 2, although the extent is indeterminable from inspectors’ records. Qualitative information found in the records suggests that inspectors were very observant of potential and actual aberrations in the handling and transport of ECR. The practical demands of construction make some of the requirements for ECR difficult to satisfy. By contrast, MMFX 2 does not require the specialized handling and transport that the CRSI recommends for ECR. It is likely,

45
therefore, that labor productivity could improve further over what was found in this study as MMFX 2 is put into wider use.
CONCLUSIONS • Although built separately, the two decks appear similar in condition and should allow a fair
comparison between the southbound ECR deck and the northbound MMFX 2 deck. • Construction and materials staff need to become familiar with surface markings and material
characteristics of CRR. • ECR appears to have been far less cost-effective per unit than MMFX 2 when both
anticipated and unanticipated costs of ECR in this study are estimated. MMFX 2 showed both labor productivity and comprehensive in-place cost advantages over ECR in this application.
• The choice of deck reinforcing steel, the construction component that may determine the
operational life of a structure, should reflect comprehensive initial and early preventive maintenance costs and should ideally include all potential indirect costs incidental to the use of specific reinforcing steel if cost-effectiveness is a design objective.
• The successful use of MMFX 2 in this study shows that VDOT’s Structure & Bridge
Division should continue to move forward with its implementation of CRR.
RECOMMENDATIONS 1. VDOT’s Structure & Bridge Division should commence working with the Knowledge
Management Division to propagate the findings of this study and subsequent field experiences as “best practices” regarding the use of CRR.
2. VTRC should commence close evaluation of the crack patterns under Spans A, B, and C of
the Route 123 Bridge to determine (1) the depth of salt penetration in these cracks, and (2) the location of the cracks relative to surface cracks.
3. VTRC should continue to monitor the condition of the Route 123 Bridge and reevaluate the
southbound and northbound decks in 5 years.
ACKNOWLEDGMENTS The research team acknowledges the valuable comments and suggestions given by Mir Ali, James Gillespie, Jose Gomez, Seung-Kyoung Lee, Doug Legg, Rodolfo Maruri, Wallace

46
McKeel, Theresa Mullinax, Claude Napier, Debra Patterson, Michael Perfater, Michael Sprinkel, Peter Vigliotti, Julius Volgyi, and the staff at Greenman-Pedersen, Inc. The research team also acknowledges the assistance of the Concrete Laboratory and NDE/Corrosion Laboratory staffs, as well as the VTRC Media Team for their valuable editorial efforts that led to the finalization of this report.
REFERENCES American Association of State Highway and Transportation Officials. Standard Specifications
for Highway Bridges. Washington, DC, 1996. American Association of State Highway and Transportation Officials. AASHTO T 260 Standard
Method of Test for Sampling and Testing for Chloride Ion in Concrete and Concrete Raw Materials. Washington, DC, 1997a.
American Association of State Highway and Transportation Officials. 1997 Interim Revisions:
Standard Specifications for Highway Bridges. Washington, DC, 1997b. American Association of State Highway and Transportation Officials. 1998 Interim Revisions:
Standard Specifications for Highway Bridges. Washington, DC, 1998. American Association of State Highway and Transportation Officials. AASHTO M 284 Standard
Specification for Epoxy-Coated Reinforcing Bars: Materials and Coating Requirements. Washington, DC, 2006.
ASTM International. ASTM C876-91 Standard Test Method for Half-Cell Potentials of Uncoated
Reinforcing Steel in Concrete. West Conshohocken, PA, 1999. ASTM International. ASTM G59 Standard Test Method for Conducting Potentiodynamic
Polarization Resistance Measurements. West Conshohocken, PA, 2003. ASTM International. ASTM A1035 Standard Specification for Deformed and Plain, Low-
carbon, Chromium, Steel Bars for Concrete Reinforcement. West Conshohocken, PA, 2004.
ASTM International. ASTM A775 / A775M Standard Specification for Epoxy-Coated Steel
Reinforcing Bars. West Conshohocken, PA, 2006a. ASTM International. ASTM G57 Standard Test Method for Field Measurement of Soil
Resistivity Using the Wenner Four-Electrode Method. West Conshohocken, PA, 2006b. Bungey, J.H., and Millard, S.G. Testing of Concrete in Structures. Blackie Academic &
Professional, London, 1996. Bureau of Transportation Statistics. NHTS 2001 Highlights Report. BTS03-05. Washington,
DC, 2003.

47
http://www.bts.gov/publications/highlights_of_the_2001_national_household_travel_survey/. Accessed July 15, 2008.
Chua, T.L. Form TL-27: Statement of Hydraulic Cement Concrete Mix Design. Florida Rock
Industries, Lorton, VA, 2005. Concrete Reinforcing Steel Institute. Comparison of Standard Epoxy Coating Field
Specifications. www.crsi.org/corrosion/specs_table3.html. Accessed June 4, 2008 Dougald, L.E. A Return on Investment Study of the Hampton Roads Safety Service Patrol
Program. VTRC 07-R33. Virginia Transportation Research Council, Charlottesville, 2007.
Federal Highway Administration. Highway Capacity Manual. Washington, DC, 2000. Federal Highway Administration. Corrosion Cost and Preventive Strategies in the United
States. FHWA-RD-01-156. McLean, VA, 2002. Feliú, S., González, J.A., and Andrade, C. Electrochemical Methods for On-Site Determinations
of Corrosion Rates of Rebar. In Techniques to Assess the Corrosion Activity of Steel Reinforced Concrete Structures, Berke, N.S., Escalante, E., Nmai, C.K., and Whiting, D., eds. ASTM International, West Conshohocken, PA, 1996, pp. 107-118.
Geers, B. Email to Stephen Sharp, May 11, 2005. Geers, B. Email to Stephen Sharp, January15, 2008. Gillespie, J. S. Estimating User Costs as a Basis for Incentive/Disincentive Amounts in Highway
Construction Contracts. VTRC 98-12. Virginia Transportation Research Council, Charlottesville, 1998.
Gillespie, J. S. The Road User Cost Savings of Using Precast Concrete. Internal Memorandum
to M.C. Brown, Virginia Transportation Research Council, Charlottesville, September 2007.
Schnell, R.E., and Bergmann, M.P. Improving Tomorrow’s Infrastructure: Extending the Life of
Concrete Structures with Solid Stainless Steel Reinforcing Bar. 2008 Concrete Bridge Conference, St. Louis, MO, May 4-7, 2008. CD-ROM. National Concrete Bridge Council, Skokie, IL, 2008.
U.S. Department of Labor. Statement of Compliance Form C-56, Employment Standards
Administration, Wage and Hour Division. Form WH-347, Subcontractor Payroll. Project No. 0123-076-F09 (503,B602 (FO) and 0123-029-128, C504. Washington, DC, August 18, 2006.

48
Virginia Department of Transportation. VDOT Modifications to AASHTO Standard Specifications for Highway Bridges, Sixteenth Edition (1996, Interim 1997 and 1998). Richmond, various dates.
Virginia Department of Transportation. VDOT Road and Bridge Standards. Richmond, 1996. Virginia Department of Transportation. VDOT Metric Road and Bridge Specifications.
Richmond, 1997. Virginia Department of Transportation, Scheduling & Contract Division. Special Provision for
Gravity Filled Polymer Crack Sealing. Richmond, 2002. Virginia Workforce Connection. Career Services. Occupation Profile. Richmond. http://www.vawc.virginia.gov/occprofiledata.asp?session=occdetail&geo=5101000000&
emp=. Accessed July 2, 2008. Weyers, R.E., Sprinkel, M.M., and Brown, M.C. Summary Report on the Performance of
Epoxy-Coated Reinforcing Steel in Virginia. VTRC 06-R29. Virginia Transportation Research Council, Charlottesville, 2006.

49
APPENDIX A
NORTHBOUND DECK CRACK DATA

50

51

52

53

54
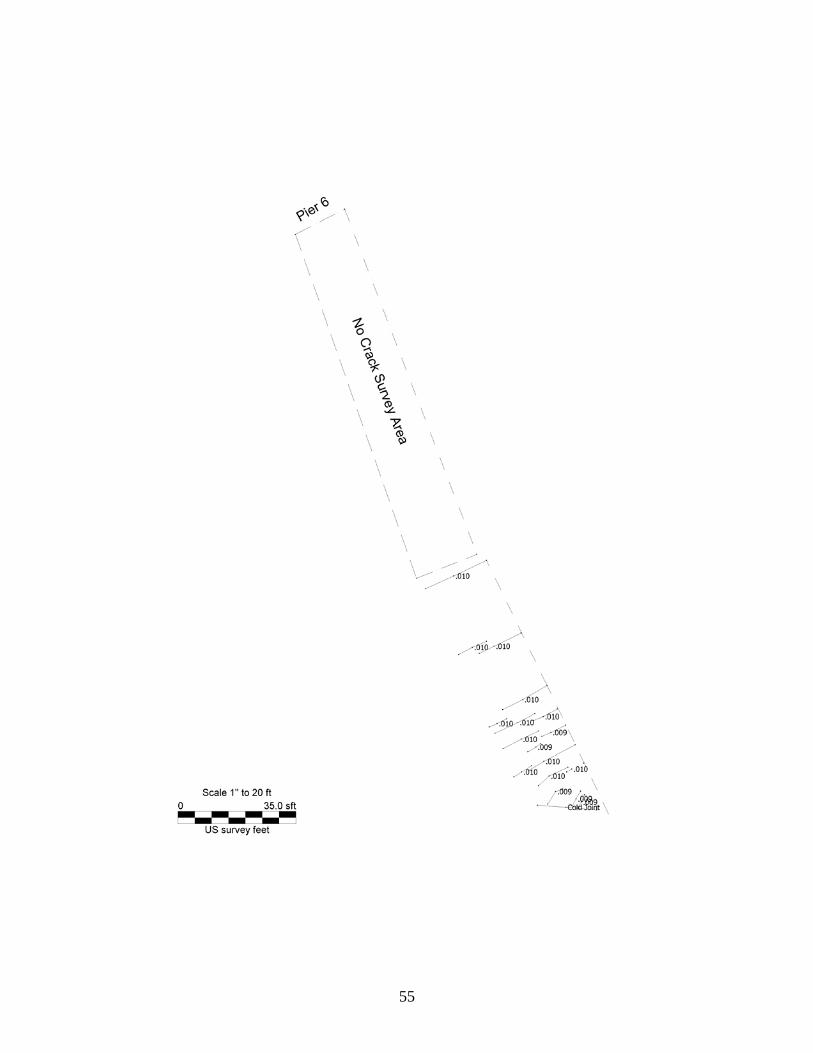
55

56

57
APPENDIX B
SOUTHBOUND DECK CRACK DATA

58

59

60

61

62

63
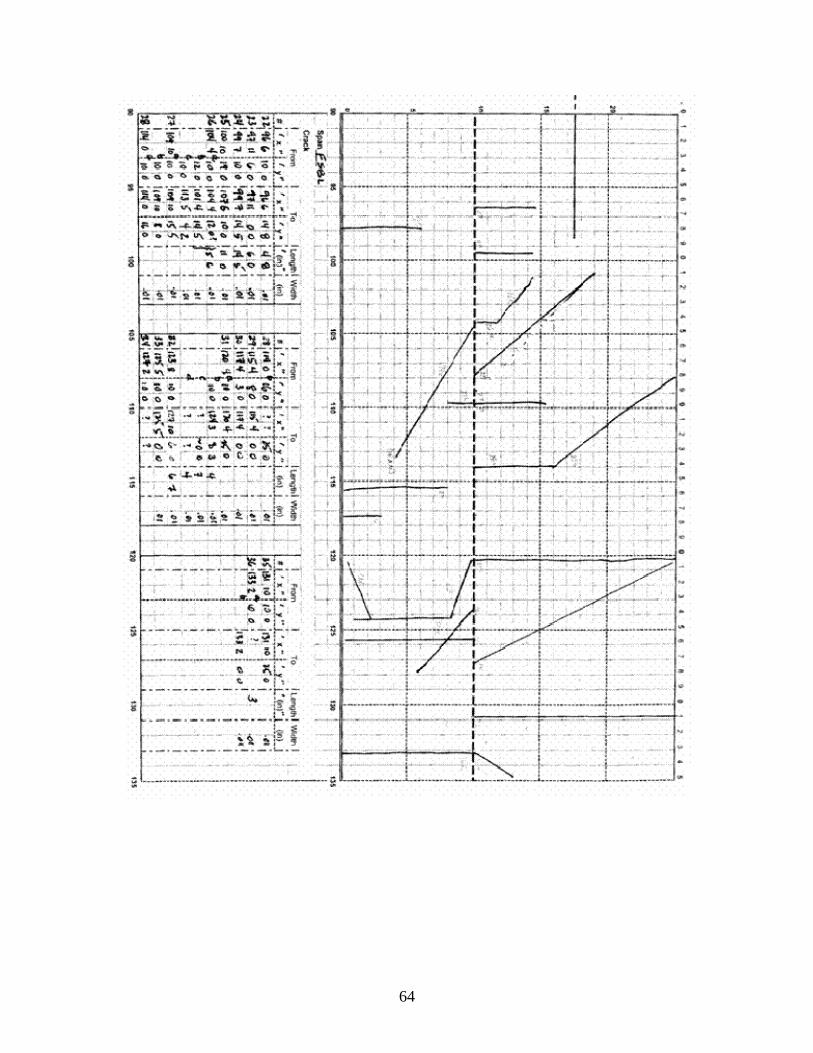
64

65

66

67

68

69

70

71
APPENDIX C CHLORIDE ANALYSES
Oct 22, 2007 NBL
Sample Span
Location Depth Concentration,
lb/yd3
1 A 0.0 to
0.5 0.59
2 A 0.5 to
1.0 0.41
3 A 1.0 to
1.5 0.34
4 A 1.5 to
2.0 0.52
5 B 0.0 to
0.5 0.51
6 B 0.5 to
1.0 0.33
7 B 1.0 to
1.5 0.29
8 B 1.5 to
2.0 0.31
9 C 0.0 to
0.5 0.69
10 C 0.5 to
1.0 0.35
11 C 1.0 to
1.5 0.38
12 C 1.5 to
2.0 0.07
13 E 0.0 to
0.5 0.30
14 E 0.5 to
1.0 0.30
15 E 1.0 to
1.5 0.21
16 E 1.5 to
2.0 0.34
17 F 0.0 to
0.5 0.27
18 F 0.5 to
1.0 0.21
19 F 1.0 to
1.5 0.19
20 F 1.5 to
2.0 0.29
21 G 0.0 to
0.5 0.36
22 G 0.5 to
1.0 0.34
23 G 1.0 to
1.5 0.36
24 G 1.5 to
2.0 0.36

72
April 16, 2008 NBL
Sample Span
Location Depth,
in Concentration,
lb/yd3
1 A 0.0 to
0.5 2.18
2 A 0.5 to
1.0 0.89
3 A 1.0 to
1.5 0.44
4 A 1.5 to
2.0 0.31
5 C 0.0 to
0.5 2.91
6 C 0.5 to
1.0 0.54
7 C 1.0 to
1.5 0.41
8 C 1.5 to
2.0 0.40
9 E 0.0 to
0.5 2.38
10 E 0.5 to
1.0 0.83
11 E 1.0 to
1.5 0.22
12 E 1.5 to
2.0 0.35
13 F 0.0 to
0.5 3.86
14 F 0.5 to
1.0 1.03
15 F 1.0 to
1.5 0.37
16 F 1.5 to
2.0 0.31
17 G 0.0 to
0.5 1.56
18 G 0.5 to
1.0 0.44
19 G 1.0 to
1.5 0.22
20 G 1.5 to
2.0 0.20
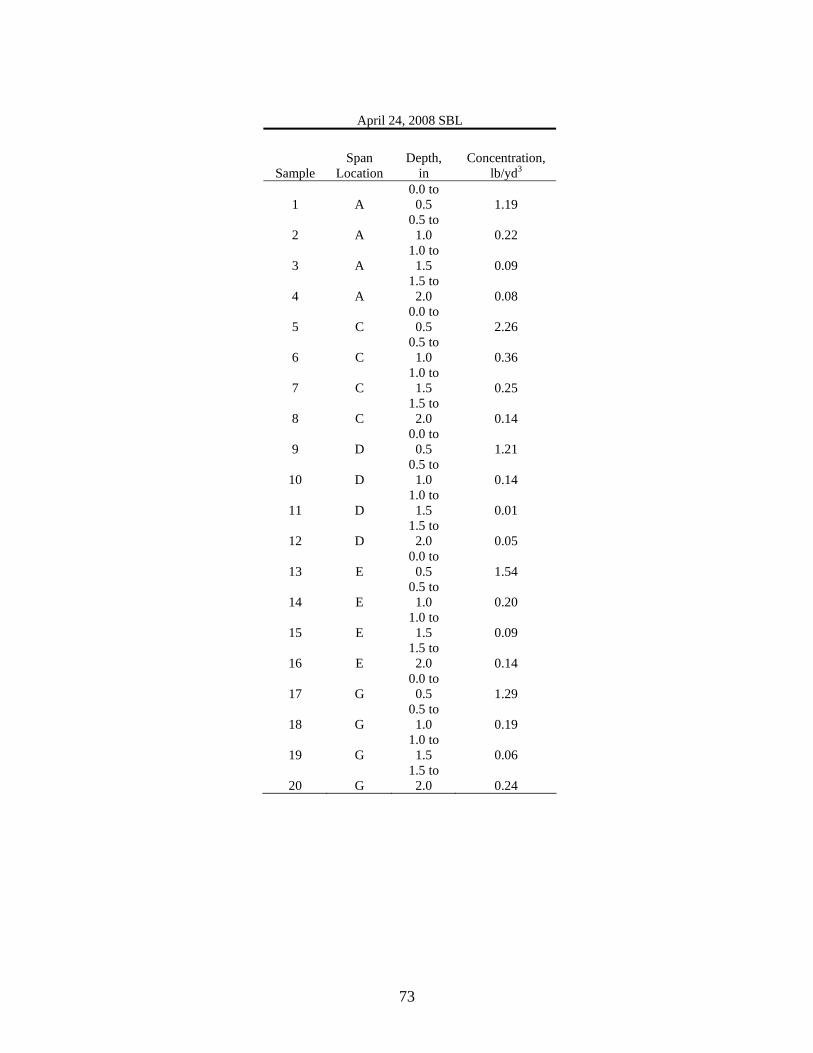
73
April 24, 2008 SBL
Sample Span
Location Depth,
in Concentration,
lb/yd3
1 A 0.0 to
0.5 1.19
2 A 0.5 to
1.0 0.22
3 A 1.0 to
1.5 0.09
4 A 1.5 to
2.0 0.08
5 C 0.0 to
0.5 2.26
6 C 0.5 to
1.0 0.36
7 C 1.0 to
1.5 0.25
8 C 1.5 to
2.0 0.14
9 D 0.0 to
0.5 1.21
10 D 0.5 to
1.0 0.14
11 D 1.0 to
1.5 0.01
12 D 1.5 to
2.0 0.05
13 E 0.0 to
0.5 1.54
14 E 0.5 to
1.0 0.20
15 E 1.0 to
1.5 0.09
16 E 1.5 to
2.0 0.14
17 G 0.0 to
0.5 1.29
18 G 0.5 to
1.0 0.19
19 G 1.0 to
1.5 0.06
20 G 1.5 to
2.0 0.24

74

75
APPENDIX D
HALF-CELL MEASUREMENTS
From Southern End to North End of NBL Shoulder Travel Lane
1' from parapet Wheel Path
Wheel Path
Parapet 1' 4' 7' 10' 13' 16' 19' 21' -9 -0.220 -0.400 -0.210 -6 -0.080 -0.030 0.085 0.135 -3 -0.056 -0.120 0.160 0.280 0.299 -0.210 0 -0.130 -0.136 -0.110 -0.048 0.090 0.117 3 -0.090 -0.010 0.053 -0.140 -0.014 0.027 -0.024 -0.022 6 0.035 -0.025 -0.034 -0.076 -0.024 -0.085 0.013 -0.084 9 0.014 0.034 -0.029 0.056 0.025 0.028 0.037 0.027
12 -0.038 -0.069 -0.031 -0.039 -0.023 -0.320 -0.083 -0.040 15 -0.045 -0.046 -0.022 -0.040 -0.036 -0.041 -0.018 0.041 18 -0.063 -0.061 -0.030 -0.057 0.065 -0.320 -0.230 -0.038 21 -0.078 -0.030 0.019 -0.025 0.024 -0.031 -0.027 -0.048 24 0.087 0.095 -0.065 -0.065 -0.140 -0.109 -0.170 -0.074 27 -0.014 -0.024 -0.061 0.015 -0.029 0.015 0.024 -0.029 30 0.067 -0.065 -0.036 -0.074 -0.123 -0.153 -0.125 -0.074 33 -0.015 0.029 0.021 0.051 0.033 0.060 -0.004 -0.027 36 0.060 0.040 -0.035 -0.033 -0.032 -0.023 -0.023 -0.045 39 0.015 0.015 0.024 -0.005 0.017 0.021 -0.047 -0.088 42 -0.130 -0.190 -0.220 -0.081 -0.077 -0.122 -0.070 0.003 45 -0.018 -0.043 0.087 -0.016 0.043 -0.035 0.041 -0.031 48 0.007 0.038 -0.044 -0.049 -0.033 -0.051 -0.079 -0.074 51 0.063 0.073 -0.058 0.074 0.041 0.052 0.052 -0.034 54 -0.019 0.010 0.012 -0.012 -0.016 -0.030 -0.039 -0.014 57 -0.010 -0.014 -0.033 -0.051 -0.012 -0.016 -0.013 -0.013 60 -0.230 -0.014 -0.017 -0.013 -0.019 -0.080 -0.017 -0.018 63 0.030 -0.004 0.021 -0.017 -0.021 -0.037 0.003 -0.008 66 -0.050 0.010 0.012 -0.006 -0.013 -0.011 -0.015 -0.042 69 0.054 0.024 0.015 0.022 -0.010 -0.003 -0.017 -0.019 72 0.000 -0.003 0.020 -0.003 -0.007 -0.004 0.012 -0.010 75 -0.010 -0.010 -0.014 0.003 -0.003 -0.006 0.003 -0.004 78 -0.027 -0.001 -0.023 -0.002 -0.002 -0.020 -0.002 -0.004 81 -0.015 -0.003 -0.005 -0.030 -0.005 -0.003 -0.003 -0.013 84 -0.020 -0.002 -0.004 -0.009 -0.006 -0.008 -0.014 -0.005 87 0.006 -0.005 -0.023 -0.062 -0.004 -0.006 -0.003 -0.005 90 -0.006 -0.003 -0.013 -0.014 -0.002 -0.013 -0.001 -0.004 93 0.012 0.029 0.035 -0.022 -0.043 -0.120 0.037 -0.019 96 0.007 0.049 0.065 0.062 0.065 -0.013 -0.029 -0.037 99 -0.001 -0.026 -0.019 -0.012 -0.015 -0.002 -0.005
102 -0.015 -0.003 -0.014 0.034 0.016 0.042 0.036 -0.004 105 -0.006 -0.002 -0.002 -0.006 0.027 0.032 0.014 -0.005
1' from parapet Wheel Wheel

76
Path Path
Parapet 1' 4' 7' 10' 13' 16' 19' 21' 108 -0.006 -0.006 -0.020 -0.002 -0.016 0.015 -0.010 -0.017 111 -0.012 -0.004 -0.050 -0.009 -0.004 0.000 -0.036 -0.020 114 -0.004 -0.015 -0.026 -0.006 -0.021 -0.041 -0.024 -0.006 117 0.022 0.042 -0.018 -0.023 0.026 0.061 0.034 0.012 120 0.025 0.005 -0.027 -0.037 0.025 -0.073 0.018 -0.004 123 0.036 -0.035 0.037 0.033 -0.018 -0.024 -0.016 -0.017 126 -0.013 -0.013 0.023 0.034 0.017 -0.042 -0.046 -0.053 129 0.053 0.031 -0.042 -0.021 0.011 0.007 -0.027 -0.036 132 -0.043 0.014 0.040 0.052 -0.060 -0.020 -0.016 -0.020 135 0.000 0.015 -0.050 -0.042 0.022 -0.017 -0.030 -0.005 138 -0.024 -0.014 -0.035 -0.022 -0.010 -0.016 -0.026 -0.014 141 -0.008 0.019 0.036 -0.012 -0.026 0.069 -0.025 -0.016 144 -0.016 -0.013 -0.017 0.028 -0.013 -0.022 -0.015 -0.021 147 0.024 -0.025 -0.025 -0.046 -0.014 -0.014 -0.013 -0.014 SPAN A/B 150 0.023 0.004 -0.026 0.018 0.014 0.028 0.045 -0.010 TRANSITION153 0.024 -0.003 -0.011 -0.032 -0.005 -0.003 -0.002 -0.021 156 -0.011 -0.002 -0.008 0.012 0.009 -0.003 -0.012 -0.027 159 0.012 -0.015 -0.031 0.034 0.021 -0.002 -0.004 -0.026 162 0.023 0.015 0.017 -0.018 0.018 -0.042 -0.092 0.045 165 0.021 0.026 -0.015 0.063 0.027 -0.063 -0.021 -0.020 168 -0.022 -0.007 -0.015 -0.042 -0.031 -0.002 -0.027 -0.020 171 -0.067 -0.040 -0.022 -0.006 -0.031 0.015 -0.020 -0.018 174 -0.025 -0.015 -0.016 0.013 -0.019 -0.008 -0.003 -0.016 177 0.024 -0.058 -0.061 0.035 -0.047 -0.063 -0.017 -0.005 180 -0.012 0.027 -0.016 -0.012 -0.024 -0.007 -0.036 -0.022 183 -0.033 0.030 0.044 0.053 0.046 0.023 0.048 0.013 186 -0.015 -0.014 -0.045 -0.007 -0.014 -0.053 -0.064 -0.066 189 -0.078 -0.012 -0.073 -0.012 0.032 0.054 0.029 0.036 192 -0.049 -0.051 -0.024 -0.074 -0.073 -0.074 -0.057 -0.012 195 -0.037 -0.029 0.079 -0.053 0.043 0.039 0.023 0.051 198 -0.042 -0.023 -0.040 -0.052 0.027 0.043 -0.060 0.027 201 -0.045 0.029 -0.051 -0.043 -0.038 -0.029 0.052 0.048 204 -0.006 -0.087 -0.025 0.061 -0.034 -0.035 -0.051 0.042 207 -0.069 -0.077 -0.086 -0.086 -0.079 -0.063 -0.078 -0.054 210 0.036 -0.016 -0.026 0.020 -0.041 -0.046 -0.035 -0.063 213 -0.049 -0.041 -0.075 -0.030 -0.046 -0.034 -0.029 -0.018 216 0.027 -0.018 -0.047 -0.004 -0.047 -0.054 -0.016 -0.029 219 -0.037 -0.009 0.047 -0.057 0.007 -0.024 -0.040 -0.041 222 0.034 0.047 -0.034 -0.024 -0.037 -0.013 -0.073 -0.057 225 -0.095 -0.013 -0.012 0.028 0.086 0.013 0.014 -0.008 228 -0.004 0.010 0.034 0.061 -0.018 -0.016 -0.024 -0.016 231 0.021 0.038 0.034 -0.005 0.011 -0.013 -0.019 -0.030 234 0.066 0.006 0.021 -0.012 -0.016 -0.015 -0.014 -0.018 237 -0.002 0.054 -0.016 -0.022 0.006 -0.012 0.004 0.011 240 -0.018 -0.013 0.015 -0.024 0.035 -0.042 -0.039 -0.009 243 -0.003 0.025 -0.002 -0.044 -0.024 -0.022 -0.027 -0.018

77
1' from parapet Wheel Path
Wheel Path
Parapet 1' 4' 7' 10' 13' 16' 19' 21' 246 -0.007 -0.002 0.021 0.005 -0.022 -0.036 0.007 -0.052 249 0.014 0.011 -0.005 -0.052 -0.007 -0.013 -0.001 -0.005 252 -0.004 -0.014 -0.021 -0.110 -0.027 -0.003 -0.025 0.000 255 -0.021 -0.013 -0.008 -0.023 -0.025 -0.014 0.013 0.002 258 -0.019 -0.014 0.013 0.017 -0.010 -0.018 -0.017 -0.017 261 0.028 -0.026 -0.007 0.016 -0.023 -0.023 -0.008 0.011 264 -0.031 -0.008 -0.026 -0.016 -0.006 -0.050 -0.049 -0.076 267 -0.006 -0.006 -0.005 -0.045 -0.024 -0.031 -0.013 -0.045 270 -0.011 -0.066 -0.019 -0.023 -0.014 0.054 0.021 -0.033 273 -0.011 -0.053 -0.004 -0.037 -0.019 -0.039 -0.029 -0.006 276 -0.024 -0.020 -0.016 -0.004 -0.011 -0.025 -0.036 -0.021 279 -0.004 -0.021 -0.017 -0.027 -0.005 -0.046 -0.014 -0.029 282 0.028 0.043 0.022 -0.007 -0.015 0.065 -0.022 0.010 285 0.050 -0.023 0.042 0.027 0.016 -0.002 -0.002 -0.015 288 0.015 0.056 0.034 -0.033 -0.025 -0.021 0.013 -0.088 SPAN B/C 291 0.011 0.013 -0.036 0.037 -0.002 0.025 0.025 -0.020 TRANSITION294 0.041 0.039 0.044 0.043 0.035 -0.005 0.024 0.013 297 0.024 -0.013 0.025 0.018 -0.039 -0.010 -0.013 0.012 300 0.021 -0.026 -0.014 0.015 0.011 0.023 0.024 0.025 303 0.006 -0.012 0.009 -0.016 -0.034 -0.012 -0.016 -0.008 306 0.009 -0.010 -0.019 -0.026 -0.099 -0.022 -0.003 -0.016 309 -0.053 0.022 0.007 0.013 -0.019 0.026 0.007 -0.019 312 -0.016 -0.024 -0.034 -0.006 -0.023 0.023 0.005 0.006 315 0.011 0.008 0.016 -0.006 -0.019 -0.029 -0.018 -0.047 318 -0.008 -0.017 0.032 0.010 0.035 -0.028 0.017 -0.016 321 -0.015 -0.004 0.006 -0.012 0.015 0.044 -0.023 -0.015 324 -0.002 -0.013 -0.007 0.015 0.036 0.007 0.020 -0.058 327 -0.014 0.020 0.041 -0.027 0.029 0.016 -0.028 -0.042 330 -0.065 0.045 0.035 0.030 -0.014 -0.014 -0.037 -0.054 333 -0.035 0.028 -0.026 0.027 0.014 0.045 0.017 -0.016 336 0.036 0.018 -0.026 -0.034 -0.027 -0.020 -0.005 -0.024 339 -0.006 -0.022 -0.023 0.013 0.031 0.023 0.005 -0.016 342 0.028 0.028 0.008 0.016 -0.020 -0.024 -0.051 0.008 345 -0.032 -0.054 0.018 0.021 -0.023 -0.023 -0.005 -0.031 348 0.060 0.042 0.037 -0.003 -0.023 -0.028 0.003 -0.033 351 -0.024 0.024 0.019 -0.013 -0.021 -0.013 -0.030 -0.005 354 -0.017 -0.013 -0.014 0.021 0.033 -0.016 -0.013 0.014 357 -0.026 -0.024 -0.006 0.010 0.008 -0.029 -0.010 -0.006 360 -0.019 0.044 0.049 -0.040 0.029 -0.030 0.022 -0.015 363 0.032 0.023 -0.010 -0.027 -0.012 -0.006 -0.012 -0.009 366 0.018 0.038 0.046 0.044 0.022 0.029 0.017 -0.021 369 0.011 -0.023 0.032 0.017 -0.023 0.024 0.013 -0.031 372 -0.006 0.028 -0.016 -0.014 0.037 0.013 0.037 0.011 375 -0.026 -0.010 -0.013 0.047 0.011 0.006 0.021 -0.015 378 -0.013 -0.029 0.016 0.012 0.037 0.016 -0.038 -0.067 381 -0.008 0.027 0.035 -0.009 -0.032 0.009 -0.002 -0.057
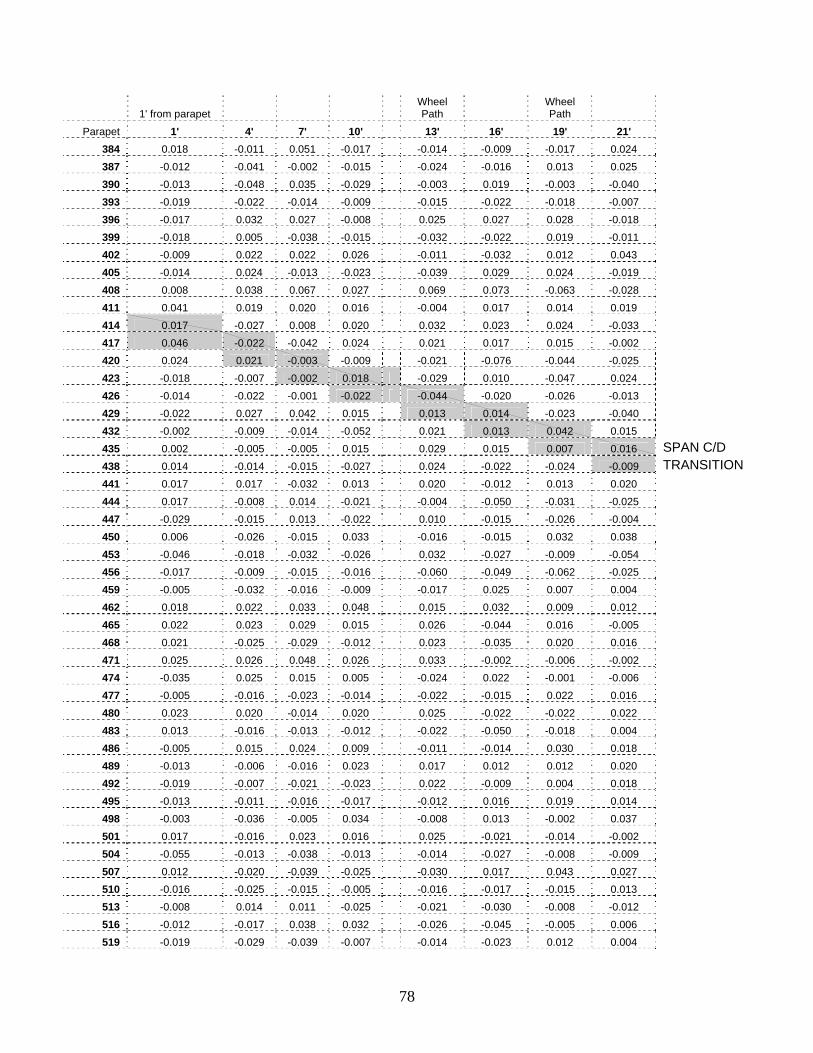
78
1' from parapet Wheel Path
Wheel Path
Parapet 1' 4' 7' 10' 13' 16' 19' 21' 384 0.018 -0.011 0.051 -0.017 -0.014 -0.009 -0.017 0.024 387 -0.012 -0.041 -0.002 -0.015 -0.024 -0.016 0.013 0.025 390 -0.013 -0.048 0.035 -0.029 -0.003 0.019 -0.003 -0.040 393 -0.019 -0.022 -0.014 -0.009 -0.015 -0.022 -0.018 -0.007 396 -0.017 0.032 0.027 -0.008 0.025 0.027 0.028 -0.018 399 -0.018 0.005 -0.038 -0.015 -0.032 -0.022 0.019 -0.011 402 -0.009 0.022 0.022 0.026 -0.011 -0.032 0.012 0.043 405 -0.014 0.024 -0.013 -0.023 -0.039 0.029 0.024 -0.019 408 0.008 0.038 0.067 0.027 0.069 0.073 -0.063 -0.028 411 0.041 0.019 0.020 0.016 -0.004 0.017 0.014 0.019 414 0.017 -0.027 0.008 0.020 0.032 0.023 0.024 -0.033 417 0.046 -0.022 -0.042 0.024 0.021 0.017 0.015 -0.002 420 0.024 0.021 -0.003 -0.009 -0.021 -0.076 -0.044 -0.025 423 -0.018 -0.007 -0.002 0.018 -0.029 0.010 -0.047 0.024 426 -0.014 -0.022 -0.001 -0.022 -0.044 -0.020 -0.026 -0.013 429 -0.022 0.027 0.042 0.015 0.013 0.014 -0.023 -0.040 432 -0.002 -0.009 -0.014 -0.052 0.021 0.013 0.042 0.015 435 0.002 -0.005 -0.005 0.015 0.029 0.015 0.007 0.016 SPAN C/D 438 0.014 -0.014 -0.015 -0.027 0.024 -0.022 -0.024 -0.009 TRANSITION441 0.017 0.017 -0.032 0.013 0.020 -0.012 0.013 0.020 444 0.017 -0.008 0.014 -0.021 -0.004 -0.050 -0.031 -0.025 447 -0.029 -0.015 0.013 -0.022 0.010 -0.015 -0.026 -0.004 450 0.006 -0.026 -0.015 0.033 -0.016 -0.015 0.032 0.038 453 -0.046 -0.018 -0.032 -0.026 0.032 -0.027 -0.009 -0.054 456 -0.017 -0.009 -0.015 -0.016 -0.060 -0.049 -0.062 -0.025 459 -0.005 -0.032 -0.016 -0.009 -0.017 0.025 0.007 0.004 462 0.018 0.022 0.033 0.048 0.015 0.032 0.009 0.012 465 0.022 0.023 0.029 0.015 0.026 -0.044 0.016 -0.005 468 0.021 -0.025 -0.029 -0.012 0.023 -0.035 0.020 0.016 471 0.025 0.026 0.048 0.026 0.033 -0.002 -0.006 -0.002 474 -0.035 0.025 0.015 0.005 -0.024 0.022 -0.001 -0.006 477 -0.005 -0.016 -0.023 -0.014 -0.022 -0.015 0.022 0.016 480 0.023 0.020 -0.014 0.020 0.025 -0.022 -0.022 0.022 483 0.013 -0.016 -0.013 -0.012 -0.022 -0.050 -0.018 0.004 486 -0.005 0.015 0.024 0.009 -0.011 -0.014 0.030 0.018 489 -0.013 -0.006 -0.016 0.023 0.017 0.012 0.012 0.020 492 -0.019 -0.007 -0.021 -0.023 0.022 -0.009 0.004 0.018 495 -0.013 -0.011 -0.016 -0.017 -0.012 0.016 0.019 0.014 498 -0.003 -0.036 -0.005 0.034 -0.008 0.013 -0.002 0.037 501 0.017 -0.016 0.023 0.016 0.025 -0.021 -0.014 -0.002 504 -0.055 -0.013 -0.038 -0.013 -0.014 -0.027 -0.008 -0.009 507 0.012 -0.020 -0.039 -0.025 -0.030 0.017 0.043 0.027 510 -0.016 -0.025 -0.015 -0.005 -0.016 -0.017 -0.015 0.013 513 -0.008 0.014 0.011 -0.025 -0.021 -0.030 -0.008 -0.012 516 -0.012 -0.017 0.038 0.032 -0.026 -0.045 -0.005 0.006 519 -0.019 -0.029 -0.039 -0.007 -0.014 -0.023 0.012 0.004

79
1' from parapet Wheel Path
Wheel Path
Parapet 1' 4' 7' 10' 13' 16' 19' 21' 522 -0.026 -0.014 -0.019 -0.036 -0.034 -0.033 -0.027 -0.004 525 -0.014 -0.032 -0.035 0.014 -0.010 0.012 -0.045 -0.002 528 -0.004 0.300 -0.013 -0.016 -0.006 -0.032 -0.010 0.010 531 -0.011 0.033 0.029 -0.035 -0.024 0.022 0.016 0.023 534 -0.001 0.005 -0.009 0.026 -0.012 -0.037 -0.020 0.018 537 -0.020 -0.012 0.022 -0.020 -0.053 -0.016 -0.090 0.012 540 -0.007 -0.011 -0.022 -0.015 -0.035 -0.021 -0.018 -0.020 543 -0.016 -0.029 -0.049 -0.012 -0.005 -0.009 -0.019 0.019 546 -0.040 -0.040 -0.019 -0.020 -0.014 -0.013 -0.015 -0.029 549 -0.006 -0.026 -0.019 -0.006 -0.022 -0.015 -0.004 0.010 552 -0.020 0.007 -0.012 -0.026 -0.022 -0.019 -0.020 0.021 555 -0.020 -0.013 -0.015 0.022 -0.012 -0.027 -0.013 -0.005 558 -0.016 0.019 -0.010 -0.014 0.003 -0.022 -0.015 0.012 561 -0.010 -0.027 -0.017 -0.020 -0.019 -0.010 -0.013 -0.020 564 -0.025 -0.013 -0.024 -0.019 -0.024 0.009 -0.010 0.020 567 -0.015 -0.019 -0.012 -0.010 -0.004 -0.022 570 0.014 -0.019 -0.001 -0.010 -0.020 573 SPAN D/E 576 TRANSITION


![EPOXY RESINS - Krishna districtkrishna.nic.in/PDFfiles/MSME/Chemical/EPOXY RESINS[1].pdf · EPOXY RESINS CONTENTS SECTION I ... PROJECT COST AND PROFITABILITY PROJECTIONS ... Epoxy](https://img.dokumen.tips/doc/110x75/5aa5b17b7f8b9ab4788d7c0f/epoxy-resins-krishna-resins1pdfepoxy-resins-contents-section-i-project.jpg)