Embed Size (px)
Citation preview

VILLAGE OF OSWEGO, ILLINOIS
COMPREHENSIVE ANNUAL
FINANCIAL REPORT
For the Year Ended
April 30, 2014
Prepared by:
Village of Oswego Finance Department

VILLAGE OF OSWEGO, ILLINOIS
TABLE OF CONTENTS
Page(s)
INTRODUCTORY SECTION
Principal Officials .............................................................................................................. i
Organizational Chart ......................................................................................................... ii
Certificate of Achievement for Excellence in Financial Reporting ................................. iii
Letter of Transmittal .......................................................................................................... iv-vii
FINANCIAL SECTION
INDEPENDENT AUDITOR’S REPORT ....................................................................... 1-3
GENERAL PURPOSE EXTERNAL FINANCIAL STATEMENTS
Management’s Discussion and Analysis ..................................................................... MD&A 1-11
Basic Financial Statements
Government-Wide Financial Statements
Statement of Net Position ................................................................................... 4
Statement of Activities ....................................................................................... 5-6
Fund Financial Statements
Governmental Funds
Balance Sheet ................................................................................................ 7
Reconciliation of Fund Balances of Governmental Funds to
the Governmental Activities in the Statement of Net Position .................. 8
Statement of Revenues, Expenditures and Changes in Fund Balances ....... 9
Reconciliation of the Governmental Funds Statement of Revenues,
Expenditures and Changes in Fund Balances to the Governmental
Activities in the Statement of Activities ..................................................... 10

VILLAGE OF OSWEGO, ILLINOIS
TABLE OF CONTENTS (Continued)
Page(s)
FINANCIAL SECTION (Continued)
GENERAL PURPOSE EXTERNAL FINANCIAL STATEMENTS (Continued)
Basic Financial Statements (Continued)
Fund Financial Statements (Continued)
Proprietary Funds
Statement of Net Position .............................................................................. 11-12
Statement of Revenues, Expenses and Changes in Net Position ................. 13
Statement of Cash Flows ............................................................................... 14-15
Fiduciary Funds
Statement of Fiduciary Net Position ............................................................. 16
Statement of Changes in Fiduciary Net Position .......................................... 17
Notes to Financial Statements ................................................................................. 18-52
Required Supplementary Information
Schedule of Revenues, Expenditures and Changes in
Fund Balance - Budget and Actual - General Fund .............................................. 53
Schedule of Funding Progress
Illinois Municipal Retirement Fund ................................................................... 54
Police Pension Fund ........................................................................................... 55
Other Postemployment Benefit Plan .................................................................. 56
Schedule of Employer Contributions
Illinois Municipal Retirement Fund ................................................................... 57
Police Pension Fund ........................................................................................... 58
Other Postemployment Benefit Plan .................................................................. 59
Notes to Required Supplementary Information .................................................. 60

VILLAGE OF OSWEGO, ILLINOIS TABLE OF CONTENTS (Continued)
Page(s)
FINANCIAL SECTION (Continued) COMBINING AND INDIVIDUAL FUND FINANCIAL STATEMENTS AND SCHEDULES MAJOR GOVERNMENTAL FUNDS Balance Sheet - General Fund ................................................................................. 61 Schedule of Revenues - Budget and Actual - General Fund .................................. 62 Schedule of Detailed Expenditures - Budget and Actual - General Fund .............. 63-65 Balance Sheet - Debt Service Fund ......................................................................... 66 Schedule of Revenues, Expenditures and Changes in Fund Balance - Budget and Actual - Debt Service Fund ...................................... 67 NONMAJOR GOVERNMENTAL FUNDS Combining Balance Sheet ....................................................................................... 68 Combining Statement of Revenues, Expenditures and Changes in Fund Balances................................................................................ 69 Schedule of Revenues, Expenditures and Changes in Fund Balance - Budget and Actual Motor Fuel Tax Fund ......................................................................................... 70 Capital Projects Fund ......................................................................................... 71 MAJOR ENTERPRISE FUNDS Statement of Net Position Water and Sewer Fund ....................................................................................... 72-73 Schedule of Revenues, Expenses and Changes in Net Position - Budget and Actual Water and Sewer Fund ....................................................................................... 74 Statement of Net Position Garbage Fund ..................................................................................................... 75 Schedule of Revenues, Expenses and Changes in Net Position - Budget and Actual Garbage Fund ..................................................................................................... 76 FIDUCIARY FUNDS Police Pension Fund Statement of Net Position ................................................................................... 77 Schedule of Changes in Fiduciary Net Position - Budget and Actual ............................................................................................ 78 Agency Funds Combining Statement of Changes in Assets and Liabilities ............................. 79-80
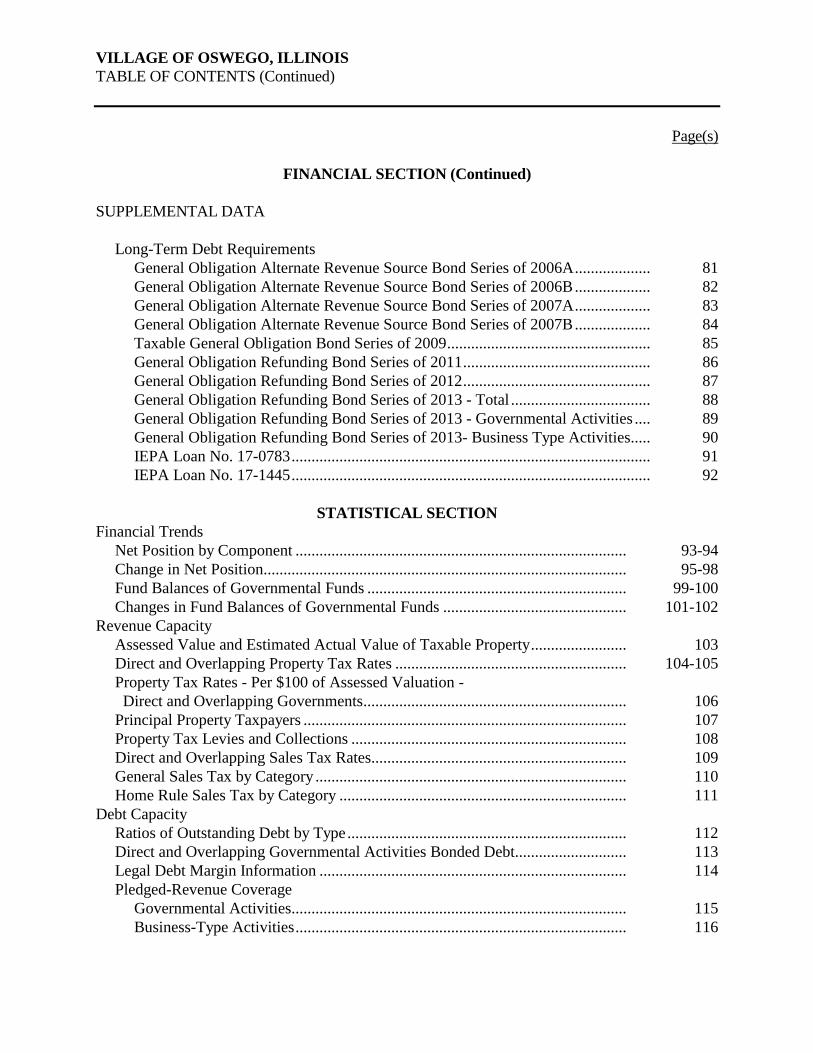
VILLAGE OF OSWEGO, ILLINOIS
TABLE OF CONTENTS (Continued)
Page(s)
FINANCIAL SECTION (Continued)
SUPPLEMENTAL DATA
Long-Term Debt Requirements
General Obligation Alternate Revenue Source Bond Series of 2006A ................... 81
General Obligation Alternate Revenue Source Bond Series of 2006B ................... 82
General Obligation Alternate Revenue Source Bond Series of 2007A ................... 83
General Obligation Alternate Revenue Source Bond Series of 2007B ................... 84
Taxable General Obligation Bond Series of 2009 ................................................... 85
General Obligation Refunding Bond Series of 2011 ............................................... 86
General Obligation Refunding Bond Series of 2012 ............................................... 87
General Obligation Refunding Bond Series of 2013 - Total ................................... 88
General Obligation Refunding Bond Series of 2013 - Governmental Activities .... 89
General Obligation Refunding Bond Series of 2013- Business Type Activities..... 90
IEPA Loan No. 17-0783 .......................................................................................... 91
IEPA Loan No. 17-1445 .......................................................................................... 92
STATISTICAL SECTION
Financial Trends
Net Position by Component ................................................................................... 93-94
Change in Net Position........................................................................................... 95-98
Fund Balances of Governmental Funds ................................................................. 99-100
Changes in Fund Balances of Governmental Funds .............................................. 101-102
Revenue Capacity
Assessed Value and Estimated Actual Value of Taxable Property ........................ 103
Direct and Overlapping Property Tax Rates .......................................................... 104-105
Property Tax Rates - Per $100 of Assessed Valuation -
Direct and Overlapping Governments .................................................................. 106
Principal Property Taxpayers ................................................................................. 107
Property Tax Levies and Collections ..................................................................... 108
Direct and Overlapping Sales Tax Rates................................................................ 109
General Sales Tax by Category .............................................................................. 110
Home Rule Sales Tax by Category ........................................................................ 111
Debt Capacity
Ratios of Outstanding Debt by Type ...................................................................... 112
Direct and Overlapping Governmental Activities Bonded Debt............................ 113
Legal Debt Margin Information ............................................................................. 114
Pledged-Revenue Coverage
Governmental Activities.................................................................................... 115
Business-Type Activities ................................................................................... 116

VILLAGE OF OSWEGO, ILLINOIS
TABLE OF CONTENTS (Continued)
Page(s)
STATISTICAL SECTION (Continued)
Demographic and Economic Information
Demographic and Economic Information .............................................................. 117
Principal Employers ............................................................................................... 118
Operating Information
Full-Time Equivalent Employees ........................................................................... 119
Operating Indicators ............................................................................................... 120
Capital Asset Statistics ........................................................................................... 121

- i -
Principal Officials
VILLAGE PRESIDENT
Brian LeClercq
(Term Expires April 2015)
VILLAGE TRUSTEES
Tony Giles
Pam Parr
(Term Expires April 2015)
(Term Expires April 2017)
Terry Michels
Gail Johnson
(Term Expires April 2015)
(Term Expires April 2015)
Judy Sollinger
Scott Volpe
(Term Expires April 2017)
(Term Expires April 2017)
MANAGEMENT STAFF
Steve Jones Village Administrator
Rod Zenner Community Development Director
Christina Burns Assistant Village Administrator/
Human Resource Director
Vijay Gadde
Economic Development Director
Tina Touchette Village Clerk
Jennifer Hughes Public Works Director
Mark Horton Finance Director/Village Treasurer
Michele Brown Community Relations Manager
Dwight Baird Police Chief
Tom Pahnke Building & Zoning Manager
Officials and Staff may be contacted at:
[email protected] or 630/554-3618

- ii -
Citizens of Oswego
Village President and Board of
Trustees
Committees Village Clerk Village
Administrator
Community Development
Director
Building and Zoning Manager
Finance Director Human Resource
Director Public Works
Director
Economic Development
Director
Community Relations Manager
Police Chief Village Attorney
VILLAGE OF OSWEGO ORGANIZATIONAL CHART

- iii -

Finance Department
100 Parkers Mill • Oswego, IL. 60543 (630) 554-3618 • Fax: (630) 554-3306
Website: http://www.oswegoil.org
September 25, 2014 Residents of the Village of Oswego Village President LeClercq and Board of Trustees The Comprehensive Annual Financial Report of the Village of Oswego, Illinois, for the fiscal year ended April 30, 2014 is hereby presented in compliance with State Statutes. State Statutes require local governments publish within six months of the close of each fiscal year a complete set of financial statements presented in conformity with generally accepted accounting principles (GAAP). These financial statements must also be audited in accordance with accepted auditing standards by a firm of licensed certified public accountants. The financial statements consist of management’s representations regarding the finances of the Village of Oswego. Consequently, management assumes full responsibility for the completeness and reliability of all the information presented in this document. Management has established an internal control framework designed to protect the government’s assets from loss, theft, misuse and to compile sufficient reliable information for preparing the Village’s financial statements in conformity with GAAP. The cost of implementing internal controls should not outweigh their benefits and so the control framework has been designed to provide reasonable assurance rather than absolute assurance that the financial statements will be free from material misstatement. Management believes the data presented in this financial report is complete and reliable in all material respects. The Village of Oswego retained the services of an independent accounting firm, Sikich LLP, Naperville, Illinois, to conduct the April 30, 2014 audit. The independent audit involved examining, on a test basis, evidence supporting the amounts and disclosures in the financial statements; assessing the accounting principles used and significant estimates made by management; and evaluating the overall financial statement presentation. The independent auditor concluded, based upon the audit, that there was a reasonable basis for rendering an unmodified opinion that the Village of Oswego financial statements for the fiscal year ended April 30, 2014 are fairly presented in conformity with GAAP. The independent auditor’s report is presented as the first component of the financial section of this report. GAAP require management provide a narrative introduction, overview, and analysis to accompany the basic financial statements in the form of Management’s Discussion and Analysis (MD&A). This letter of transmittal is designed to complement MD&A and should be read in conjunction with it. The Village of Oswego MD&A can be found immediately following the independent auditor’s report.
iv
v
GOVERNMENT PROFILE
Oswego was first settled in 1833 and formally incorporated in 1852. It is a home rule community as
defined by the Illinois Constitution and as such is empowered to levy a property tax, at the rate it
deems appropriate on all property located within its boundaries. The Village of Oswego is located in
the northeastern section of the State of Illinois, approximately 50 miles southwest of Chicago in the
northeast corner of Kendall County. The Village population reached 30,355 with the 2010 decennial
census. The Village operates under the Trustee/Administrator form of government, as defined in
Illinois state statutes. A Village President and six trustees are elected at large to overlapping 4 year
terms. The Board appointed full-time Village Administrator acts as the Chief Operating Officer of
the Village, managing the day-to-day activities of the Village.
The Village of Oswego has 112 full time equivalent employees providing an array of services for the
residents including; police protection, maintaining the water distribution system, sanitary sewer line
administration, storm water collection, public works operations, road & bridge maintenance,
community development, economic development, building and zoning services, general
administrative services, and tourism.
Generally accepted accounting principles (GAAP) require that the financial reporting entity include
the primary government, organizations for which the primary government is financially responsible
and other organizations for which the nature and significance of their relationship with the primary
government are such that the exclusion would cause the financial reporting entity’s financial
statements to be misleading and incomplete. The criteria used to evaluate the responsibility for
oversight at the Village’s level includes financial independence, election of a governing authority,
designation of management, ability to significantly influence operations and accountability for fiscal
matters. The Village has included the Police Pension Fund as part of the Village. The Village is not
considered to be a component unit of any other governmental unit.
The annual budget serves as the spending authority for the Village. Budgetary control is maintained
at the fund level for all budgeted funds. An annual budget is prepared for the General Fund, the
Capital Projects Fund, the Debt Service Fund, the Motor Fuel Tax Fund, the Police Pension Fund,
the Water and Sewer Fund, and the Garbage Fund. The budget process begins in the fall with the
updating of a five year financial forecast which provides a long term outlook on the Village’s
financial condition and also provides direction for the subsequent fiscal year budget. Department
heads are given instructions for preparing line item budgets for their respective departments and
submitting them to the Budget Officer/Finance Director. All the department submissions are
compiled creating the draft budget which is presented to the Board. A public hearing is required to
be held on the budget before formal adoption by the Board. The annual budget must be adopted
before the beginning of the Village’s fiscal year, which is May 1st.
ECONOMIC CONDITION AND OUTLOOK
Local Economy
The Village’s population increased from 13,326 in calendar year 2000 to the 2010 Census amount of
30,355. Commercial growth has followed the increase in population and is providing retail
shopping for Village residents as well as many non-residents from many surrounding towns. The

vi
Village’s Economic Development department works to retain and attract retail, office, and industrial
businesses to the Village.
The Village is a regional shopping and dining destination as national retailers and restaurants have
located here. The Route 34 corridor is one of the largest commercial centers in the Fox Valley area
now offering over 2.6 million square feet of commercial space. Anchor stores include Best Buy,
Dick’s Sporting Goods, The Home Depot, Kohl’s, Meijer, Target, Wal-Mart and Sears Home
Appliance. Many well-known chain restaurants have also located within the shopping centers.
The Orchard Road Corridor is the second largest commercial area within the Village currently home
to a large chain grocery, financial institutions, a health care facility, restaurants, a senior residential
facility and other retail. Discussions have begun with interested developers for the remaining open
areas within the corridor.
The Village has four business parks providing commercial and industrial development. The 300-
acre Kendall Point Business Center, the 130-acre Stonehill Business Park, the Highland Business
Center and Farmington Lakes Office Campus have all been established providing an abundance of
commercial and manufacturing businesses. Proposed industrial and office development areas in the
Orchard Road corridor covering more than 200 acres will add to the commercial and industrial base
within the community.
All of this development and residential growth has helped the local economy to remain steady and
even grow over the past four years. The Village’s Sales Tax revenue continued to grow beating
budget estimates for the fiscal year and the prior year’s totals. The Village’s proactive reaction to
the economy has helped keep costs down and the Village’s finances on track. The local economy
remains strong and annual housing starts and commercial developments are increasing as the
national economy continues improving.
Long-Term Financial Planning
During Fiscal Year 2014, staff created the Village’s first 20-year Capital Improvement Plan (CIP).
This plan was created to list pending improvement projects and to engage in long term planning
discussions to allow the Village to appropriately schedule and secure the funding needed to ensure
the local infrastructure is maintained at acceptable levels for the residents. The Five Year Financial
Forecast document estimating annual revenues and annual expenditures for long term planning is
also updated annually. Trends in revenue sources and expenditures are identified and reviewed so
quality assumptions may be made for the future fiscal health of the Village. In fiscal year 2012, the
Village Board completed a strategic plan and goal setting session outlining the future direction they
have for the Village. This plan is reviewed and updated to show the status of each goal annually.
All of this information will be utilized in creating a roadmap for Village operations, future capital
improvement projects and creating a financing plan for the Village’s future.
Major Initiatives
Major projects completed in FY 2014 include the annual MFT road program and the completion of
the Route 71 water-main relocation project.


- 2 -
Opinions
In our opinion, the financial statements referred to above present fairly, in all material respects,
the respective financial position of the governmental activities, the business-type activities, each
major fund and the aggregate remaining fund information of the Village of Oswego, Illinois, as
of April 30, 2014, and the respective changes in financial position, and, where applicable, cash
flows thereof for the year then ended in conformity with accounting principles generally accepted
in the United States of America.
Other Matters
Required Supplementary Information
Accounting principles generally accepted in the United States of America require that the
management’s discussion and analysis and other required supplementary information be
presented to supplement the basic financial statements. Such information, although not a part of
the basic financial statements, is required by the Governmental Accounting Standards Board,
who considers it to be an essential part of financial reporting for placing the basic financial
statements in an appropriate operational, economic or historical context. We have applied certain
limited procedures to the required supplementary information in accordance with auditing
standards generally accepted in the United States of America, which consisted of inquiries of
management about the methods of preparing the information and comparing the information for
consistency with management’s responses to our inquiries, the basic financial statements, and
other knowledge we obtained during our audit of the basic financial statements. We do not
express an opinion or provide any assurance on the information because the limited procedures
do not provide us with sufficient evidence to express an opinion or provide any assurance.
Other Information
Our audit was conducted for the purpose of forming opinions on the financial statements that
collectively comprise the Village of Oswego, Illinois’ basic financial statements. The combining
and individual fund financial statements and schedules and supplemental data, introductory and
statistical sections are presented for purposes of additional analysis and are not a required part of
the basic financial statements. The combining and individual fund financial statements and
schedules and supplemental data are the responsibility of management and were derived from
and relate directly to the underlying accounting and other records used to prepare the basic
financial statements. The information has been subjected to the auditing procedures applied in
the audit of the basic financial statements and certain additional procedures, including comparing
and reconciling such information directly to the underlying accounting and other records used to
prepare the basic financial statements or to the basic financial statements themselves, and other
additional procedures in accordance with auditing standards generally accepted in the United
States of America. In our opinion, the information is fairly stated in all material respects in
relation to the basic financial statements as a whole. The introductory and statistical sections
listed in the table of contents were not audited by us and, accordingly, we express no opinion
thereon.
- 2 -

- 3 -
We also have previously audited, in accordance with auditing standards generally accepted in the United States of America, financial statements of the governmental activities, business-type activities, each major fund and the aggregate remaining fund information of the Village of Oswego, Illinois as of and for the year ended April 30, 2013, and we expressed unmodified opinions on those financial statements. That audit was conducted for purposes of forming an opinion on the financial statements as a whole. The schedules of revenues, expenditures (expenses) and changes in fund balance (net assets) - budget and actual for each fund with comparative actual is presented for purposes of additional analysis and is not a required part of the financial statements. Such information is the responsibility of management and was derived from and relates directly to the underlying accounting and other records used to prepare the 2013 financial statements. The information has been subjected to the auditing procedures applied in the audit of those financial statements and certain additional procedures, including comparing and reconciling such information directly to the underlying accounting and other records used to prepare the financial statements or to the financial statements themselves, and other additional procedures in accordance with auditing standards generally accepted in the United States of America. In our opinion, the information is fairly stated in all material respects in relation to the financial statements from which it has been derived. Naperville, Illinois September 25, 2014

GENERAL PURPOSE EXTERNAL FINANCIAL STATEMENTS

VILLAGE OF OSWEGO, ILLINOIS
MANAGEMENT’S DISCUSSION AND ANALYSIS
APRIL 30, 2014
MD&A 1
As management of the Village of Oswego (“Village”), we offer readers of the Village’s financial
statements this narrative overview and analysis of the financial activities of the Village for the fiscal
year ended April 30, 2014. Since Management’s Discussion and Analysis (“MD&A”) is designed to
focus on the current year’s activities, resulting changes and currently known facts, it should be read in
conjunction with the Letter of Transmittal on pages iv through vii and the financial statements beginning
on page 4.
Overview of the Financial Statements
The focus of the financial statements is on the Village as a whole (government–wide) and on the major
individual funds (major fund). Both perspectives (government-wide and major fund) allow the user to
address relevant questions, broaden the basis for comparison (year to year or government to
government) and enhance the Village’s accountability.
This discussion and analysis is intended to serve as an introduction to the Village’s basic financial
statements. The Village’s basic financial statements comprise three components: government-wide
financial statements, fund financial statements, and notes to the financial statements. This report also
contains other supplementary information in addition to the basic financial statements.
Financial Highlights
The Village’s total assets and deferred outflows decreased $0.2 million from $368.1 million to
$367.9 million. Depreciation of governmental activities capital assets was the cause for the
decrease.
The Village’s total liabilities and deferred inflows decreased $1.0 million for the fiscal year.
Current liabilities increased $0.1 million because of a greater amount of developer deposits held
at year end and Long term liabilities decreased $1.1 million due to principal payments made on
outstanding debt.
The Village’s total net position increased $0.8 million for the fiscal year ending April 30, 2014
adding to the unrestricted balances.
Total revenues decreased $1.3 million during the fiscal year. Operating grants/contributions and
capital grants/contributions were $2.0 million less than the prior year.
Total expenses increased $0.4 million compared to the previous fiscal year due to greater
expenses incurred in the governmental funds as compared to last fiscal year.
Government-Wide Financial Statements. The government-wide financial statements are designed to
provide readers with a broad overview of the Village’s finances, in a manner similar to a private-sector
business. The statement of net position presents information on all of the Village’s assets and liabilities,
with the difference between the two reported as net position. Over time, increases or decreases in net
position may serve as a useful indicator of whether the financial position of the Village is improving or
deteriorating.
The statement of activities presents information showing how the Village’s net position changed during
the most recent fiscal year. All changes in net position are reported as soon as the underlying event
giving rise to the change occurs, regardless of the timing of related cash flows. Thus, revenues and
expenses are reported in this statement for some items that will only result in cash flows in future fiscal
periods.

VILLAGE OF OSWEGO, ILLINOIS
MANAGEMENT’S DISCUSSION AND ANALYSIS
APRIL 30, 2014
MD&A 2
The government-wide financial statements distinguish functions of the Village that are primarily
supported by taxes and intergovernmental revenues (governmental activities) from other functions that
are intended to recover all or a significant portion of their costs through user fees and charges (business-
type activities). The governmental activities reflect the Village’s basic services, including
administration, building and zoning, community development, public works and public safety. Sales
taxes, shared state taxes and permit fees finance the majority of these services. The business-type
activities reflect private sector type operations, where the fee for service typically covers all or most of
the cost of operations, including depreciation. The water/sewer operations and the garbage collection
operations are the two business-type activities within the village.
The government-wide financial statements can be found beginning on page 4 of this report.
Fund Financial Statements. A fund is a grouping of related accounts that is used to maintain control
over resources that have been segregated for specific activities or objectives. The Village uses fund
accounting to ensure and demonstrate compliance with finance-related legal requirements. All of the
funds of the Village can be divided into three categories: governmental funds, proprietary funds and
fiduciary funds.
Governmental funds are used to account for essentially the same functions reported as governmental
activities in the government-wide financial statements. However, unlike the government-wide financial
statements, governmental fund financial statements focus on near-term inflows and outflows of
spendable resources, as well as on balances of spendable resources available at the end of the fiscal year.
Because the focus of governmental funds is narrower than that of the government-wide financial
statements, it is useful to compare the information presented for governmental funds with similar
information presented for governmental activities in the government-wide financial statements. By
doing so, readers may better understand the long-term impact of the Village’s near-term financing
decisions. Both the governmental fund balance sheet and the governmental fund statement of revenues,
expenditures and changes in fund balances provide a reconciliation to facilitate this comparison between
governmental funds and governmental activities.
The Village maintains many individual governmental funds. Information is presented separately in the
governmental fund balance sheet and in the governmental fund statement of revenues, expenditures and
changes in fund balances for the General Fund and the Debt Service Fund which are considered to be
major funds. Information from the Village’s other governmental funds is combined into a single column
presentation. Individual fund information for these non-major governmental funds is provided
elsewhere in the report. The basic governmental fund financial statements can be found beginning on
page 7 of this report.
Proprietary Funds maintained by the Village are of only one type; enterprise funds. Enterprise funds
are used to report the same functions presented as business-type activities in the government-wide
financial statements. The Village uses enterprise funds to account for its water and sanitary sewer
operations and its contractually hired garbage collections. Proprietary funds provide the same type of
information as the government-wide financial statements. The proprietary fund financial statements
provide separate information for the Water and Sewer Fund and the Garbage Fund, both of which are
considered to be major funds of the Village. The basic proprietary fund financial statements can be
found beginning on page 11 of this report.

VILLAGE OF OSWEGO, ILLINOIS
MANAGEMENT’S DISCUSSION AND ANALYSIS
APRIL 30, 2014
MD&A 3
Fiduciary funds are used to account for resources held for the benefit of parties outside the Village.
Fiduciary funds are not reflected in the government-wide financial statements because the resources of
those funds are not available to support the Village’s own programs. The accounting used for fiduciary
funds is similar to that used by proprietary funds. The Village maintains one fiduciary trust fund; the
Police Pension fund and two agency funds; one for development fees held for other governmental
agencies and one for developer deposits. The basic fiduciary fund financial statements can be found
beginning on page 16 of this report.
Notes to the Financial Statements. The notes to the financial statements provide additional
information that is essential to a full understanding of the information provided in the government-wide
and fund financial statements. The notes to the financial statements begin on page 18 of this report.
Other Information. In addition to the basic financial statements, this report also includes certain
required supplementary information related to budgetary information and the Village’s progress in
funding its obligation to provide pension benefits to its employees. Non-major fund information can be
found immediately following the required supplementary information.
GOVERNMENT-WIDE FINANCIAL ANALYSIS
Statement of Net Position. A useful indicator of the Village’s financial position may be ascertained by comparing the total Net Position from year to year. The Village’s total assets/deferred outflows decreased as did total liabilities/deferred inflows from 2013 to 2014 resulting in an increase in total Net Position. The increase in total Net Position will allow the Village to budget for additional improvements in subsequent fiscal years. The following chart reflects the condensed Statement of Net Position:

VILLAGE OF OSWEGO, ILLINOIS
MANAGEMENT’S DISCUSSION AND ANALYSIS
APRIL 30, 2014
MD&A 4
Village of Oswego
Statement of Net Position
As of April 30, 2014
Governmental Activities Business-Type Activities Total Primary Government
2013 2014 2013 2014 2013 2014
Assets:
Current & other assets $11,862,844 $13,401,964 $10,371,686 $10,648,010 $22,234,530 $24,049,974
Capital assets 287,546,557 285,208,008 57,906,133 57,151,400 345,452,690 342,359,408
Total assets 299,409,401 298,609,972 68,277,819 67,799,410 367,687,220 366,409,382
Deferred outflows 111,177 1,000,957 331,392 485,208 442,569 1,486,165
Total assets & deferred outflows 299,520,578 299,610,929 68,609,211 68,284,618 368,129,789 367,895,547
Liabilities:
Current liabilities 1,548,270 1,971,973 1,495,915 1,169,661 3,044,185 3,141,634
Long-term liabilities 17,470,525 17,202,153 15,961,344 15,074,282 33,431,869 32,276,435
Total liabilities 19,018,795 19,174,126 17,457,259 16,243,943 36,476,054 35,418,069
Deferred inflows 1,216,083 1,216,099 - - 1,216,083 1,216,099
Total liabilities & deferred inflows 20,234,878 20,390,225 17,457,259 16,243,943 37,692,137 36,634,168
Net Position:
Net invested in capital assets 271,570,611 269,462,285 41,995,957 42,143,249 313,566,568 311,605,534
Restricted 2,888,976 3,136,556 654,000 654,000 3,542,976 3,790,556
Unrestricted 4,826,113 6,621,863 8,501,995 9,243,426 13,328,108 15,865,289
Total Net Position $279,285,700 $279,220,704 $51,151,952 $52,040,675 $330,437,652 $331,261,379
The majority of the Village of Oswego's net position reflects its investment in capital assets (e.g. land,
buildings, machinery & equipment and infrastructure), less any related outstanding debt used to acquire
or construct those assets. The Village of Oswego uses these capital assets to provide services to citizens;
consequently, these assets are not available for future spending. Net investment in capital assets
decreased from fiscal year 2013 by $2.0 million due to the depreciation of the capital assets. The
Restricted net position increased $0.2 million because of the increase in Fund Balances of the Special
Revenue Funds. Of the total restricted net position, 37% is from developers for the completion of
various building projects. Unrestricted net position increased $2.5 million compared to fiscal year 2013.
For more detailed information on net position, refer to the Statement of Net Position on page 4.

VILLAGE OF OSWEGO, ILLINOIS
MANAGEMENT’S DISCUSSION AND ANALYSIS
APRIL 30, 2014
MD&A 5
Changes in Net Position. The following chart summarizes the revenue and expenses of the Village’s
activities.
Village of Oswego
Changes in Net Position
For the Fiscal Year Ended April 30, 2014
Governmental Activities Business-Type Activities Total Primary Government
2013 2014 2013 2014 2013 2014
REVENUES
Program Revenues:
Charges for Services $1,305,358 $1,623,998 $8,727,681 $8,321,154 $10,033,039 $9,945,152
Operating Grants/Contrib. 1,561,809 1,148,407 636,669 99,265 2,198,478 1,247,672
Capital Grants/Contrib. 3,614,701 2,525,807
3,614,701 2,525,807
General Revenues:
Property Taxes 1,344,929 1,326,712 - - 1,344,929 1,326,712
Other Taxes 11,398,855 12,054,686 - - 11,398,855 12,054,686
Other 933,495 1,082,496 59,209 49,208 992,704 1,131,704
Total Revenues 20,159,147 19,762,106 9,423,559 8,469,627 29,582,706 28,231,733
EXPENSES
General Government 2,504,327 2,568,401 - - 2,504,327 2,568,401
Building and Zoning 627,008 638,618 - - 627,008 638,618
Community Development 507,828 707,665 - - 507,828 707,665
Public Safety 7,854,804 8,374,812 - - 7,854,804 8,374,812
Public Works 7,560,190 7,119,256 - - 7,560,190 7,119,256
Interest on Debt 827,319 580,528 - - 827,319 580,528
Water and Sewer - - 5,171,212 5,475,321 5,171,212 5,475,321
Garbage - - 2,069,201 2,105,583 2,069,201 2,105,583
Total Expenses 19,881,476 19,989,280 7,240,413 7,580,904 27,121,889 27,570,184
Change in Net Position before Transfers 277,671 (227,174) 2,183,146 888,723 2,460,817 661,549
Transfers (1,621,000) - 1,621,000 - - -
Change in Net Position (1,343,329) (227,174) 3,804,146 888,723 2,460,817 661,549
Net Position, Beginning of the Year 280,629,029 279,285,700 47,347,806 51,151,952 327,976,835 330,437,652
Prior period adjustment - 162,178 - - - 162,178
Net Position, Beginning of Year Restated 280,629,029 279,447,878 47,347,806 51,151,952 327,976,835 330,599,830
Net Position, End of the Year $279,285,700 $279,220,704 $51,151,952 $52,040,675 $330,437,652 $331,261,379
Change in Net Position in the Governmental Activities. Total revenues for governmental activities
decreased $0.4 million compared to fiscal year 2013. Contributing factors to the decrease were;
Charges for services revenue increased $0.3 million due to increases in Permit revenues.
Operating grants/contrib. category of revenue decreased $0.4 million compared to fiscal year
2013 and Capital grants/contrib. decreased $1.1 million for a total decrease in revenue of $1.5
million.
Other taxes revenue increased $0.6 million compared to the prior fiscal year. Increases in a
number of tax revenue sources account for the increase.

VILLAGE OF OSWEGO, ILLINOIS
MANAGEMENT’S DISCUSSION AND ANALYSIS
APRIL 30, 2014
MD&A 6
Total expenses for governmental activities increased $0.1 million compared with fiscal year 2013.
General government, building and zoning, community development and public safety functions all had
total expenditure increases compared with fiscal year 2013. Public works functions expenses decreased
$0.4 million because of the completion of roadway projects completed during the last fiscal year.
The resulting total change in Net Position was a decrease of $0.1 million leaving an ending Net Position
balance of $279.2 million at April 30, 2014.
Change in Net Position in Business-Type Activities. The total change in Net Position for
business-type activities is an increase of $0.9 million for fiscal year 2014. Total revenues decreased
$1.0 million compared to fiscal year 2013 while total expenses increased $0.3 million.
Charges for services revenue decreased $0.4 million due to lower utility usage charges during the year.
Operating grants/contributions decreased $0.5 million due to less grant revenue received. Total
expenses increased $0.3 million because of increased costs for contractual maintenance and greater
garbage disposal costs.
$0$2,000,000$4,000,000$6,000,000$8,000,000
$10,000,000$12,000,000$14,000,000
Charges forServices
OperatingGrants/Contrib.
CapitalGrants/Contrib.
Property Taxes Other Taxes Other
Governmental Activities Revenues
2013 2014
0
2,000,000
4,000,000
6,000,000
8,000,000
10,000,000
GeneralGovernment
Building andZoning
CommunityDevelopment
Public Safety Public Works Interest on Debt
Governmental Activities Expenses
2013 2014

VILLAGE OF OSWEGO, ILLINOIS
MANAGEMENT’S DISCUSSION AND ANALYSIS
APRIL 30, 2014
MD&A 7
FINANCIAL ANALYSIS OF THE VILLAGE’S FUNDS
Governmental Funds. The focus of the governmental funds is to provide information on near term
inflows, outflows and balances of spendable resources. This information may be helpful in assessing the
Village’s financing requirements. For example, unrestricted-unassigned fund balance serves as a useful
measure of net resources available for spending at the end of the fiscal year. At April 30, 2014, the
governmental funds reported combined ending fund balances of $10.4 million, an increase of $0.9
million compared to the ending restated fund balances at April 30, 2013. Total revenues for
governmental funds exceeded expenditures by $0.9 million.
The General Fund is the primary operating fund of the Village of Oswego. The total fund balance of the
General Fund increased $0.8 million creating an ending balance at April 30, 2014 of $6.7 million. As a
measure of liquidity, it is useful to compare unrestricted fund balance to total expenditures. Unrestricted
fund balance represents 47% of total 2014 General Fund expenditures compared to 45% for Fiscal year
2013.
The Debt Service Fund had expenditures of $1.7 million for principal and interest payments during the
fiscal year. Transfers from the General Fund and Motor Fuel Tax Fund supported the expenditures.
The non-major governmental funds consist of the Motor Fuel Tax Fund, the Public Works Escrow Fund,
the Economic Development Fund, the Public Service Fund and the Capital Projects Fund. Total assets
for all Funds increased $0.3 million compared to last fiscal year. The Motor Fuel Tax Fund assets
increased $0.1 and the Public Works Escrow Fund assets increased $0.2 million. Total fund balances
increased $0.1 million from the fiscal year activity. Total revenues decreased $1.1 million compared to
last fiscal year due to $1.0 million less in Capital Projects Fund Intergovernmental (Grants) revenue
received this fiscal year. Total expenditures decreased $0.9 million compared to Fiscal year 2013 due to
$0.9 million of lower Capital Projects Fund expenditures.
Proprietary Funds. The Village’s proprietary fund statements provide the same type of information
found in the government-wide statements but in greater detail. Water and Sewer Fund total assets and
deferred outflows decreased $0.5 million to a total of $67.6 million. Water and Sewer Fund total
liabilities decreased $1.3 million due to a $0.4 reduction in current liabilities and payments made on
outstanding debt issuances and loans. Water and Sewer Fund Net Position increased $0.9 million
compared to Fiscal Year 2013 due to lower capitalized assets recorded in Fiscal year 2014.
The Garbage Fund total Net Position remained at $0.5 million as of April 30, 2014 which was the same
balance as last fiscal year end. Total assets increased $0.1 million compared to the prior fiscal year.
Total liabilities also increased $0.1 million resulting in no change to the unrestricted net position of the
Fund. The Garbage Fund contracts with a commercial waste hauler passing the entire costs of the
service to the users.
General Fund Budgetary Highlights
Total General Fund Revenues were $0.7 million greater than budget. Three categories of revenue,
(Taxes, Intergovernmental, and Charges for Services) were all $0.1 million greater than their budget.
Other revenue was $0.4 greater than budget due to increased permit revenues and greater Miscellaneous
revenue.

VILLAGE OF OSWEGO, ILLINOIS
MANAGEMENT’S DISCUSSION AND ANALYSIS
APRIL 30, 2014
MD&A 8
Village of Oswego
General Fund Budgetary Highlights
For the Fiscal Year Ended April 30, 2014
Original Final
Actual
Over(under)
Budget Budget Budget
REVENUES
Taxes $9,363,400 $9,363,400 $9,476,192 $112,792
Intergovernmental 2,977,310 2,977,310 3,042,565 65,255
Charges for Services 1,300,200 1,300,200 1,380,156 79,956
Other 1,735,935 1,735,935 2,172,351 436,416
Total revenues 15,376,845 15,376,845 16,071,264 694,419
EXPENDITURES
General Government 2,405,364 2,405,364 2,159,883 (245,481)
Building and Zoning 662,329 662,329 637,964 (24,365)
Community Development 774,941 774,941 698,354 (76,587)
Public Works 1,354,147 1,354,147 1,829,494 475,347
Public Safety 8,645,057 8,645,057 8,466,515 (178,542)
Total expenditures 13,841,838 13,841,838 13,792,210 (49,628)
OTHER FINANCING SOURCES (USES)
Transfer In (Out) (1,535,007) (1,535,007) (1,516,563) (18,444)
Sale of capital assets - - 16,124 16,124
Total other financing sources (uses) (1,535,007) (1,535,007) (1,500,439)
Net Change in Fund Balance $- $- 778,615
Fund Balance, May 1
5,918,460
Fund Balance, April 30
$6,697,075
General Fund Expenditures were slightly less than budget for the fiscal year. General Government was
$0.2 less than budget because the Reserve for Contingency account was not expended and some
technology enhancements were not completed. Building & zoning and Community development
departments were less than budget as a vehicle purchase was not completed and professional services
were less than budget. Public works expenditures were $0.5 over budget. The harsh winter caused
personnel costs, contractual services for snow removal and operating supplies to exceed the budgets.
Public safety costs were less than budget by $0.2 million due to position vacancies during the fiscal year
and their related personnel costs.

VILLAGE OF OSWEGO, ILLINOIS
MANAGEMENT’S DISCUSSION AND ANALYSIS
APRIL 30, 2014
MD&A 9
Capital Asset and Debt Administration. The Village of Oswego's investment in capital assets
decreased $3.1 million (net of accumulated depreciation) as compared to fiscal year 2013. This
investment in capital assets includes property and improvements, equipment, facilities, vehicles and
infrastructure (roadway improvements, water supply lines and sanitary sewer lines). The following table
details the Villages changes in capital assets for governmental activities and business-type activities.
Village of Oswego
Capital Assets
As of April 30, 2014
Governmental Activities Business-Type Activities Total Primary Government
2013 2014 2013 2014 2013 2014
Non-Depreciable Assets:
Land $1,312,153 $1,312,153 $897,871 $897,871 $2,210,024 $2,210,024
Right of Way 101,588,973 102,119,614 - - 101,588,973 102,119,614
CIP - - 2,099,543 - 2,099,543 -
Depreciable Assets
Land improvements 848,229 848,229 - - 848,229 848,229
Buildings 9,515,388 9,515,388 6,618,082 6,618,082 16,133,470 16,133,470
Equipment 709,937 736,537 130,418 130,418 840,355 866,955
Vehicles 1,185,938 1,434,527 1,342,282 1,322,233 2,528,220 2,756,760
Infrastructure 229,928,335 231,698,411 63,878,312 66,786,233 293,806,647 298,484,644
Accumulated Depreciation (57,542,396) (62,456,851) (17,060,375) (18,603,437) (74,602,771) (81,060,288)
Total $287,546,557 $285,208,008 $57,906,133 $57,151,400 $345,452,690 $342,359,408
Governmental activities total capital assets decreased $2.3 million as the change in accumulated
depreciation was greater than the net increase in assets.
Business-type activities total capital assets decreased $0.7 million compared to last fiscal year due to the
annual depreciation of $1.5 million being greater than the net increase in assets.
Additional information on the Village of Oswego's capital assets can be found in Note 7.

VILLAGE OF OSWEGO, ILLINOIS
MANAGEMENT’S DISCUSSION AND ANALYSIS
APRIL 30, 2014
MD&A 10
Long-Term Debt. At April 30, 2014 the Village had total debt outstanding of $32.3 million.
General Obligation Bonds and IEPA notes account for 94% of the Village’s total outstanding debt.
Sales tax, MFT tax and water/sewer revenues are currently pledged to pay the annual debt service on the
bonds and notes.
Village of Oswego
Bonded and Other Indebtedness
As of April 30, 2014
Governmental Activities Business-Type Activities Total Primary Government
2013 2014 2013 2014 2013 2014
General obligation bonds $16,195,000 $15,520,000 $14,635,000 $13,795,000 $30,830,000 $29,315,000
IEPA notes - - 1,127,309 1,006,733 1,127,309 1,006,733
Unamortized premium (discount) 79,534 454,750 147,867 (29,529) 227,401 425,221
Unamortized loss on refunding (35,445) (4,267) - 235,946 (35,445) 231,679
Compensated absences 446,780 455,240 47,541 60,891 494,321 516,131
Retiree termination benefits 59,990 37,913 - - 59,990 37,913
Net pension obligation 671,168 660,423 - - 671,168 660,423
Other post employment benefits 53,498 78,094 3,627 5,241 57,125 83,335
Total $17,470,525 $17,202,153 $15,961,344 $15,074,282 $33,431,869 $32,276,435
As an Illinois home-rule community, the Village is not subject to any debt limitation. The Village’s
debt policy is to limit the amount of outstanding debt to 5% of the equalized assessed valuation (EAV)
of the Village. The latest EAV is $744,930,605 which results in a gross debt to EAV ratio of 4.33% as of
April 30, 2014 and a gross debt per capita of $1,063 using the latest certified Village population of
30,355. The Village’s current credit rating issued by Moody’s Investors Services is Aa2.
Additional information on the Village of Oswego's long-term liabilities can be found in Note 8.
Economic Factors and Next Year’s Budget
Fiscal Year 2014 financial results were better than forecast for the Village when comparing final actual
numbers with final budget numbers. Revenues were better than expected due to greater sales and home-
rule sales tax revenue, greater income tax revenue, greater permit fees collected, and greater connection
fees in the Water and Sewer fund. Total expenditures ended the year less than budget contributing to the
overall positive financial results. New retail development along with an increase in residential home
building provides optimism for the Village.
The Village remained vigilant in preparing the Fiscal Year 2015 Budget. Expenditures were reduced
wherever possible and revenues estimated conservatively to adopt a balanced budget. $3.8 million in
capital expenditures were able to be included within the budget being paid from operating revenues or
reserve balances. Department heads continue to spend only what is necessary attempting to maintain
current service levels over the fiscal year.

VILLAGE OF OSWEGO, ILLINOIS
MANAGEMENT’S DISCUSSION AND ANALYSIS
APRIL 30, 2014
MD&A 11
The Village will monitor revenues and expenses throughout the fiscal year and will take action if
warranted to remain within budget amounts. The Village will continue to be proactive in responding to
any unforeseen events to minimize the impact to Village residents.
CONTACTING THE VILLAGE’S FINANCIAL MANAGEMENT
This financial report is designed to provide our citizens, customers, investors and creditors with a
general overview of the Village’s finances. Questions concerning this report or requests for additional
financial information should be directed to the Finance Director, Village of Oswego, 100 Parkers Mill,
Oswego, Illinois, 60543.

Governmental Business-Type
Activities Activities Total
ASSETS
Cash and investments 8,549,426$ 8,876,436$ 17,425,862$
Restricted cash and investments - 654,000 654,000
Receivables (net where applicable
of allowance for uncollectibles)
Property taxes 1,216,099 - 1,216,099
Accounts 247,313 1,090,337 1,337,650
Intergovernmental 2,719,804 - 2,719,804
Utility taxes 97,934 - 97,934
Notes 210,498 - 210,498
Insurance 184,429 - 184,429
Prepaid expenses 175,164 25,701 200,865
Due from fiduciary funds 1,297 1,536 2,833
Capital assets not being depreciated 103,431,767 897,871 104,329,638
Capital assets being depreciated
(net of accumulated depreciation) 181,776,241 56,253,529 238,029,770
Total assets 298,609,972 67,799,410 366,409,382
DEFERRED OUTFLOWS OF RESOURCES
Unamortized loss on refunding 1,000,957 485,208 1,486,165
Total deferred outflows of resources 1,000,957 485,208 1,486,165
Total assets and deferred outflows of resources 299,610,929 68,284,618 367,895,547
LIABILITIES
Accounts payable 825,285 795,283 1,620,568
Accrued payroll 355,271 33,930 389,201
Retainage payable 24,295 129,273 153,568
Escrow deposits 531,429 - 531,429
Due to fiduciary funds 10,580 - 10,580
Unearned revenue 21,373 - 21,373
Interest payable 203,740 211,175 414,915
Long-term liabilities
Due within one year 1,463,783 1,168,089 2,631,872
Due in more than one year 15,738,370 13,906,193 29,644,563
Total liabilities 19,174,126 16,243,943 35,418,069
DEFERRED INFLOWS OF RESOURCES
Deferred revenue - property taxes 1,216,099 - 1,216,099
Total deferred inflows of resources 1,216,099 - 1,216,099
Total liabilities and deferred inflows of resources 20,390,225 16,243,943 36,634,168
NET POSITION
Net investment in capital assets 269,462,285 42,143,249 311,605,534
Restricted for
Highways and streets 1,278,219 - 1,278,219
Special projects 1,411,604 - 1,411,604
Economic development 421,900 - 421,900
Debt service 24,833 - 24,833
Radium removal - 654,000 654,000
Unrestricted 6,621,863 9,243,426 15,865,289
TOTAL NET POSITION 279,220,704$ 52,040,675$ 331,261,379$
Primary Government
VILLAGE OF OSWEGO, ILLINOIS
STATEMENT OF NET POSITION
April 30, 2014
See accompanying notes to financial statements.- 4 -

Operating Capital
Charges Grants and Grants and
FUNCTIONS/PROGRAMS Expenses for Services Contributions Contributions
PRIMARY GOVERNMENT
Governmental Activities
General government 2,568,401$ 79,360$ -$ -$
Building and zoning 638,618 745,449 256,926 -
Community development 707,665 167,520 - -
Public safety 8,374,812 631,669 73,664 -
Public works 7,119,256 - 817,817 2,525,807
Interest 580,528 - - -
Total governmental activities 19,989,280 1,623,998 1,148,407 2,525,807
Business-Type Activities
Water and sewer 5,475,321 6,223,868 99,265 -
Garbage 2,105,583 2,097,286 - -
Total business-type activities 7,580,904 8,321,154 99,265 -
TOTAL PRIMARY GOVERNMENT 27,570,184$ 9,945,152$ 1,247,672$ 2,525,807$
Program Revenues
VILLAGE OF OSWEGO, ILLINOIS
STATEMENT OF ACTIVITIES
For the Year Ended April 30, 2014
- 5 -

Governmental Business-Type
Activities Activities Total
(2,489,041)$ -$ (2,489,041)$
363,757 - 363,757
(540,145) - (540,145)
(7,669,479) - (7,669,479)
(3,775,632) - (3,775,632)
(580,528) - (580,528)
(14,691,068) - (14,691,068)
- 847,812 847,812
- (8,297) (8,297)
- 839,515 839,515
(14,691,068) 839,515 (13,851,553)
General Revenues
Taxes
Property 1,326,712 - 1,326,712
Sales 6,401,637 - 6,401,637
Telecommunication 934,655 - 934,655
Utility 1,136,668 - 1,136,668
Other 612,825 - 612,825
Intergovernmental - unrestricted
Income tax 2,957,978 - 2,957,978
Personal property replacement tax 10,923 - 10,923
Investment income 35,528 29,551 65,079
Miscellaneous 1,046,968 19,657 1,066,625
Total 14,463,894 49,208 14,513,102
CHANGE IN NET POSITION (227,174) 888,723 661,549
NET POSITION, MAY 1 279,285,700 51,151,952 330,437,652
Prior period adjustment 162,178 - 162,178
NET POSITION, MAY 1, RESTATED 279,447,878 51,151,952 330,599,830
NET POSITION, APRIL 30 279,220,704$ 52,040,675$ 331,261,379$
Primary Government
Net (Expense) Revenue and Change in Net Position
See accompanying notes to financial statements.- 6 -

Nonmajor Total
Debt Governmental Governmental
General Service Funds Funds
Cash and investments 4,511,803$ 24,833$ 4,012,790$ 8,549,426$
Receivables
Property taxes 1,216,099 - - 1,216,099
Accounts 246,951 - 362 247,313
Intergovernmental 2,663,843 - 55,961 2,719,804
Utility tax 97,934 - - 97,934
Notes - - 210,498 210,498
Insurance 184,429 - - 184,429
Prepaid items 158,983 - 16,181 175,164
Due from fiduciary funds 1,297 - - 1,297
TOTAL ASSETS 9,081,339$ 24,833$ 4,295,792$ 13,401,964$
LIABILITIES
Accounts payable 780,941$ -$ 44,344$ 825,285$
Accrued payroll 355,271 - - 355,271
Retainage payable - - 24,295 24,295
Escrow deposits - - 531,429 531,429
Due to fiduciary funds 10,580 - - 10,580
Unearned revenue 21,373 - - 21,373
Total liabilities 1,168,165 - 600,068 1,768,233
DEFERRED INFLOWS OF RESOURCES
Unavailable revenue - property taxes 1,216,099 - - 1,216,099
Total deferred inflows of resources 1,216,099 - - 1,216,099
Totals libailities and deferred inflows of resources 2,384,264 - 600,068 2,984,332
FUND BALANCES
Nonspendable
Notes receivable - - 210,498 210,498
Prepaid items 158,983 - 16,181 175,164
Restricted
Highways and streets - - 1,278,219 1,278,219
Special projects - - 1,395,423 1,395,423
Economic development - - 211,402 211,402
Debt service - 24,833 - 24,833
Unrestricted
Assigned - Fiscal Sustainability 5,358,071 - - 5,358,071
Assigned - Capital Projects - - 584,001 584,001
Unassigned 1,180,021 - - 1,180,021
Total fund balances 6,697,075 24,833 3,695,724 10,417,632
TOTAL LIABILITIES, DEFERRED INFLOWS OF
RESOURCES AND FUND BALANCES 9,081,339$ 24,833$ 4,295,792$ 13,401,964$
RESOURCES AND FUND BALANCES
ASSETS
LIABILITIES, DEFERRED INFLOWS OF
VILLAGE OF OSWEGO, ILLINOIS
BALANCE SHEET
GOVERNMENTAL FUNDS
April 30, 2014
See accompanying notes to financial statements.- 7 -

FUND BALANCES OF GOVERNMENTAL FUNDS 10,417,632$
Amounts reported for governmental activities in the
statement of net position are different because:
Capital assets used in governmental activities are not financial
resources and, therefore, are not reported in the governmental 285,208,008
funds
The loss on refunding of bonds is deferred and
amortized on the statement of net position 1,000,957
Long-term liabilities applicable to the Village's governmental
activities are not due and payable in the current period and,
accordingly, are not reported as fund liabilities. All liabilities,
both current and long-term, are reported in the statement of net
position.
Bonds payable (15,520,000)$
Unamortized discount on bonds payable 4,267
Unamortized premium on bonds payable (454,750)
Compensated absences payable (455,240)
Retiree termination benefit payable (37,913)
Net pension obligation (660,423)
Other postemployment benefit (78,094)
Interest payable (203,740) (17,405,893)
NET POSITION OF GOVERNMENTAL ACTIVITIES 279,220,704$
VILLAGE OF OSWEGO, ILLINOIS
RECONCILIATION OF FUND BALANCES OF GOVERNMENTAL FUNDS TO THE
GOVERNMENTAL ACTIVITIES IN THE STATEMENT OF NET POSITION
April 30, 2014
See accompanying notes to financial statements.- 8 -

VILLAGE OF OSWEGO, ILLINOIS
STATEMENT OF REVENUES, EXPENDITURES
AND CHANGES IN FUND BALANCES
GOVERNMENTAL FUNDS
For the Year Ended April 30, 2014
Nonmajor Total
Debt Governmental Governmental
General Service Funds Funds
REVENUES
Taxes 9,476,192$ -$ -$ 9,476,192$
Licenses and permits 1,048,980 - - 1,048,980
Intergovernmental 3,042,565 - 989,661 4,032,226
Charges for services 1,380,156 - 58,332 1,438,488
Fines and forfeits 354,098 - 55,601 409,699
Investment income 12,033 347 23,148 35,528
Miscellaneous 757,240 3,600 243,312 1,004,152
Total revenues 16,071,264 3,947 1,370,054 17,445,265
EXPENDITURES
Current
General government 2,159,883 - 133,079 2,292,962
Building and zoning 637,964 - - 637,964
Community development 698,354 - - 698,354
Public safety 8,466,515 - 59,598 8,526,113
Public works 1,829,494 - 597,062 2,426,556
Capital outlay - - 187,303 187,303
Debt service
Principal retirement - 1,145,000 - 1,145,000
Interest and fiscal charges - 621,442 - 621,442
Total expenditures 13,792,210 1,766,442 977,042 16,535,694
EXCESS (DEFICIENCY) OF REVENUES
OVER EXPENDITURES 2,279,054 (1,762,495) 393,012 909,571
OTHER FINANCING SOURCES (USES)
Transfers in - 1,779,063 - 1,779,063
Transfers (out) (1,516,563) - (262,500) (1,779,063)
Bonds issued, at par - 6,770,000 - 6,770,000
Premium on bonds issued - 387,715 - 387,715
Payment to escrow agent - (7,170,687) - (7,170,687)
Proceeds from the sale of capital assets 16,124 - - 16,124
Total other financing sources (uses) (1,500,439) 1,766,091 (262,500) 3,152
NET CHANGE IN FUND BALANCES 778,615 3,596 130,512 912,723
FUND BALANCES, MAY 1 5,756,282 21,237 3,565,212 9,342,731
Prior period adjustment 162,178 - - 162,178
FUND BALANCES, MAY 1, RESTATED 5,918,460 21,237 3,565,212 9,504,909
FUND BALANCES, APRIL 30 6,697,075$ 24,833$ 3,695,724$ 10,417,632$
See accompanying notes to financial statements.- 9 -
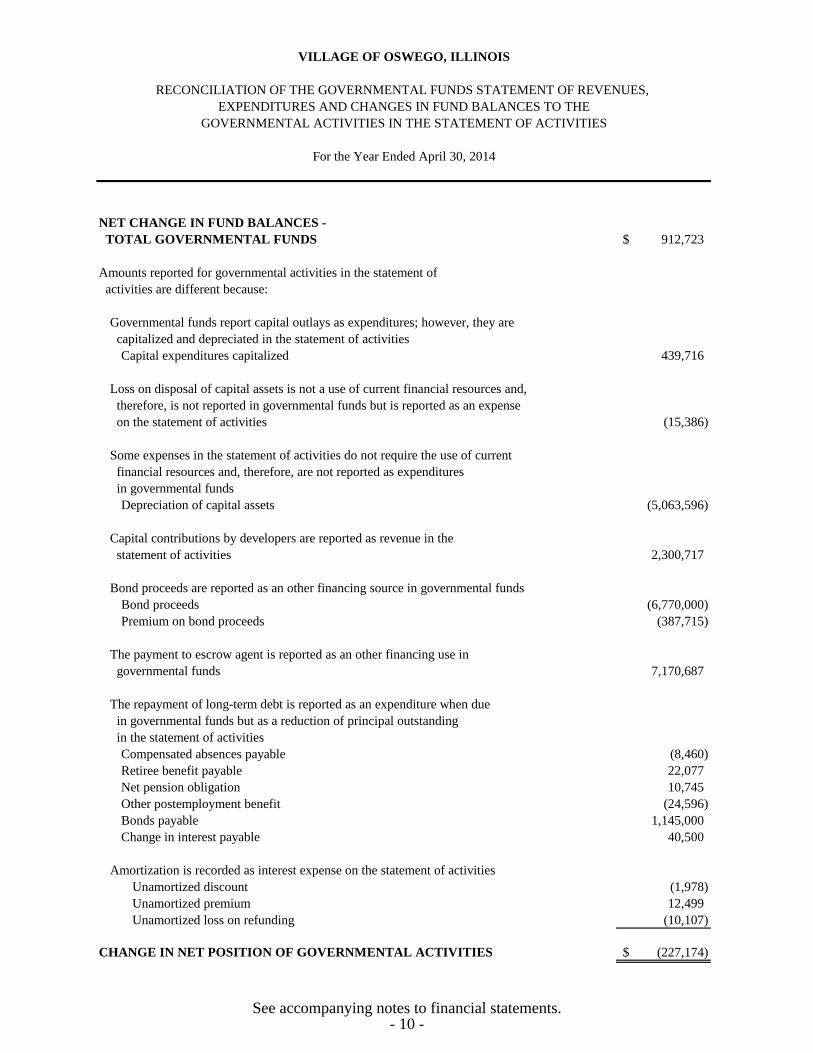
NET CHANGE IN FUND BALANCES -
TOTAL GOVERNMENTAL FUNDS 912,723$
Amounts reported for governmental activities in the statement of
activities are different because:
Governmental funds report capital outlays as expenditures; however, they are
capitalized and depreciated in the statement of activities
Capital expenditures capitalized 439,716
Loss on disposal of capital assets is not a use of current financial resources and,
therefore, is not reported in governmental funds but is reported as an expense
on the statement of activities (15,386)
Some expenses in the statement of activities do not require the use of current
financial resources and, therefore, are not reported as expenditures
in governmental funds
Depreciation of capital assets (5,063,596)
Capital contributions by developers are reported as revenue in the
statement of activities 2,300,717
Bond proceeds are reported as an other financing source in governmental funds
Bond proceeds (6,770,000)
Premium on bond proceeds (387,715)
The payment to escrow agent is reported as an other financing use in
governmental funds 7,170,687
The repayment of long-term debt is reported as an expenditure when due
in governmental funds but as a reduction of principal outstanding
in the statement of activities
Compensated absences payable (8,460)
Retiree benefit payable 22,077
Net pension obligation 10,745
Other postemployment benefit (24,596)
Bonds payable 1,145,000
Change in interest payable 40,500
Amortization is recorded as interest expense on the statement of activities
Unamortized discount (1,978)
Unamortized premium 12,499
Unamortized loss on refunding (10,107)
CHANGE IN NET POSITION OF GOVERNMENTAL ACTIVITIES (227,174)$
For the Year Ended April 30, 2014
VILLAGE OF OSWEGO, ILLINOIS
RECONCILIATION OF THE GOVERNMENTAL FUNDS STATEMENT OF REVENUES,
EXPENDITURES AND CHANGES IN FUND BALANCES TO THE
GOVERNMENTAL ACTIVITIES IN THE STATEMENT OF ACTIVITIES
See accompanying notes to financial statements.- 10 -

Water
and Sewer Garbage Total
CURRENT ASSETS
Cash and investments 8,554,764$ 321,672$ 8,876,436$
Accounts receivable 704,800 385,537 1,090,337
Restricted cash and investments
IEPA restriction 654,000 - 654,000
Prepaid expenses 25,701 - 25,701
Due from fiduciary funds 1,536 - 1,536
Total current assets 9,940,801 707,209 10,648,010
NONCURRENT ASSETS
Capital assets
Capital assets, net of depreciation
Nondepreciable assets 897,871 - 897,871
Depreciable buildings, property and infrastructure 74,856,966 - 74,856,966
Accumulated depreciation (18,603,437) - (18,603,437)
Total capital assets 57,151,400 - 57,151,400
Total noncurrent assets 57,151,400 - 57,151,400
Total assets 67,092,201 707,209 67,799,410
DEFERRED OUTFLOWS OF RESOURCES
Unamortized loss on refunding 485,208 - 485,208
Total deferred outflows of resources 485,208 - 485,208
Total assets and deferred outflows of resources 67,577,409 707,209 68,284,618
VILLAGE OF OSWEGO, ILLINOIS
STATEMENT OF NET POSITION
PROPRIETARY FUNDS
April 30, 2014
Business-Type Activities
(This statement is continued on the following page.)- 11 -

Water
and Sewer Garbage Total
CURRENT LIABILITIES
Accounts payable 618,964$ 176,319$ 795,283$
Accrued payroll 33,930 - 33,930
Retainage payable 129,273 - 129,273
Compensated absences 49,259 - 49,259
Interest payable 211,175 - 211,175
IEPA loans payable 123,830 - 123,830
Bonds payable 995,000 - 995,000
Total current liabilities 2,161,431 176,319 2,337,750
LONG-TERM LIABILITIES
Compensated absences 11,632 - 11,632
Other postemployment benefits 5,241 - 5,241
IEPA loans payable 882,902 - 882,902
Bonds payable, net 13,006,418 - 13,006,418
Total long-term liabilities 13,906,193 - 13,906,193
Total liabilities 16,067,624 176,319 16,243,943
NET POSITION
Net investment in capital assets 42,143,249 - 42,143,249
Restricted for radium removal 654,000 - 654,000
Unrestricted 8,712,536 530,890 9,243,426
TOTAL NET POSITION 51,509,785$ 530,890$ 52,040,675$
Business-Type Activities
VILLAGE OF OSWEGO, ILLINOIS
STATEMENT OF NET POSITION (Continued)
PROPRIETARY FUNDS
April 30, 2014
See accompanying notes to financial statements.- 12 -

Water and
Sewer Garbage Total
OPERATING REVENUES
Charges for services 5,160,783$ 2,097,286$ 7,258,069$
OPERATING EXPENSES
Production 3,326,221 2,105,583 5,431,804
Total operating expenses 3,326,221 2,105,583 5,431,804
OPERATING INCOME (LOSS) BEFORE DEPRECIATION 1,834,562 (8,297) 1,826,265
Depreciation 1,563,112 - 1,563,112
OPERATING INCOME (LOSS) 271,450 (8,297) 263,153
NON-OPERATING REVENUES (EXPENSES)
Connection fees 1,063,085 - 1,063,085
Grant revenue 99,265 - 99,265
Miscellaneous income 19,657 - 19,657
Investment income 28,995 556 29,551
Interest expense (585,988) - (585,988)
Total non-operating revenues (expenses) 625,014 556 625,570
CHANGE IN NET POSITION 896,464 (7,741) 888,723
NET POSITION, MAY 1 50,613,321 538,631 51,151,952
NET POSITION, APRIL 30 51,509,785$ 530,890$ 52,040,675$
Business-Type Activities
VILLAGE OF OSWEGO, ILLINOIS
STATEMENT OF REVENUES, EXPENSES
AND CHANGES IN NET POSITION
PROPRIETARY FUNDS
For the Year Ended April 30, 2014
See accompanying notes to financial statements.- 13 -
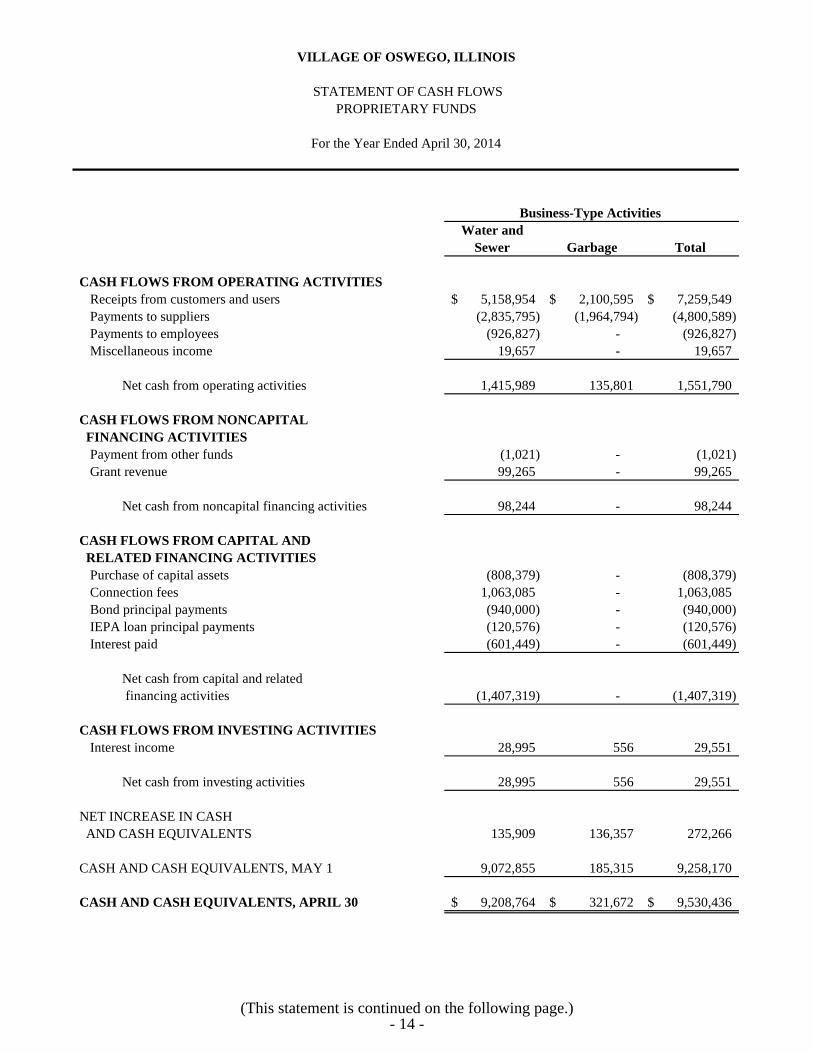
Water and
Sewer Garbage Total
CASH FLOWS FROM OPERATING ACTIVITIES
Receipts from customers and users 5,158,954$ 2,100,595$ 7,259,549$
Payments to suppliers (2,835,795) (1,964,794) (4,800,589)
Payments to employees (926,827) - (926,827)
Miscellaneous income 19,657 - 19,657
Net cash from operating activities 1,415,989 135,801 1,551,790
CASH FLOWS FROM NONCAPITAL
FINANCING ACTIVITIES
Payment from other funds (1,021) - (1,021)
Grant revenue 99,265 - 99,265
Net cash from noncapital financing activities 98,244 - 98,244
CASH FLOWS FROM CAPITAL AND
RELATED FINANCING ACTIVITIES
Purchase of capital assets (808,379) - (808,379)
Connection fees 1,063,085 - 1,063,085
Bond principal payments (940,000) - (940,000)
IEPA loan principal payments (120,576) - (120,576)
Interest paid (601,449) - (601,449)
Net cash from capital and related
financing activities (1,407,319) - (1,407,319)
CASH FLOWS FROM INVESTING ACTIVITIES
Interest income 28,995 556 29,551
Net cash from investing activities 28,995 556 29,551
NET INCREASE IN CASH
AND CASH EQUIVALENTS 135,909 136,357 272,266
CASH AND CASH EQUIVALENTS, MAY 1 9,072,855 185,315 9,258,170
CASH AND CASH EQUIVALENTS, APRIL 30 9,208,764$ 321,672$ 9,530,436$
Business-Type Activities
VILLAGE OF OSWEGO, ILLINOIS
STATEMENT OF CASH FLOWS
PROPRIETARY FUNDS
For the Year Ended April 30, 2014
(This statement is continued on the following page.)- 14 -
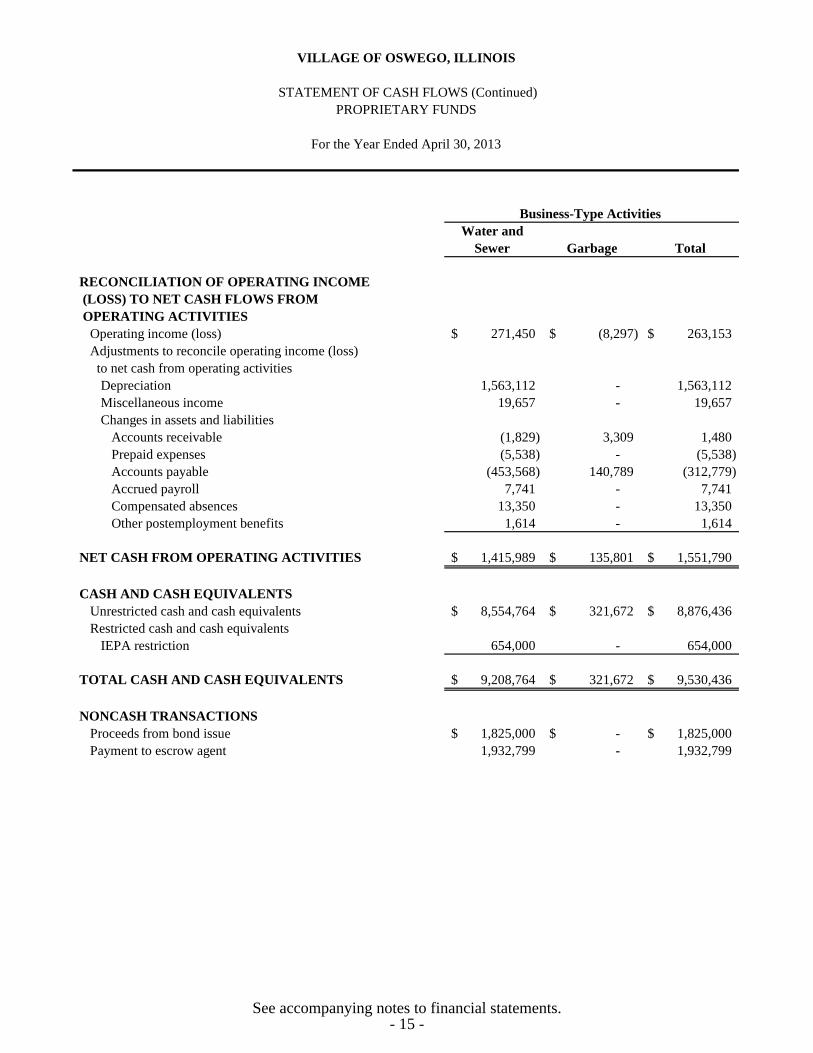
Water and
Sewer Garbage Total
RECONCILIATION OF OPERATING INCOME
(LOSS) TO NET CASH FLOWS FROM
OPERATING ACTIVITIES
Operating income (loss) 271,450$ (8,297)$ 263,153$
Adjustments to reconcile operating income (loss)
to net cash from operating activities
Depreciation 1,563,112 - 1,563,112
Miscellaneous income 19,657 - 19,657
Changes in assets and liabilities
Accounts receivable (1,829) 3,309 1,480
Prepaid expenses (5,538) - (5,538)
Accounts payable (453,568) 140,789 (312,779)
Accrued payroll 7,741 - 7,741
Compensated absences 13,350 - 13,350
Other postemployment benefits 1,614 - 1,614
NET CASH FROM OPERATING ACTIVITIES 1,415,989$ 135,801$ 1,551,790$
CASH AND CASH EQUIVALENTS
Unrestricted cash and cash equivalents 8,554,764$ 321,672$ 8,876,436$
Restricted cash and cash equivalents
IEPA restriction 654,000 - 654,000
TOTAL CASH AND CASH EQUIVALENTS 9,208,764$ 321,672$ 9,530,436$
NONCASH TRANSACTIONS
Proceeds from bond issue 1,825,000$ -$ 1,825,000$
Payment to escrow agent 1,932,799 - 1,932,799
Business-Type Activities
VILLAGE OF OSWEGO, ILLINOIS
STATEMENT OF CASH FLOWS (Continued)
PROPRIETARY FUNDS
For the Year Ended April 30, 2013
See accompanying notes to financial statements.- 15 -

Pension
Trust Agency
ASSETS
Cash and cash equivalents 163,967$ 481,653$
Investments, at fair value
U.S. Government and agency securities 7,465,426 -
Municipal bonds 1,195,014 -
Insurance contracts 2,577,616 -
Equity mutual funds 7,392,852 -
Accounts receivable - 7,309
Due from other funds - 10,580
Accrued interest receivable 49,112 -
Prepaid items 517 -
Total assets 18,844,504 499,542$
LIABILITIES
Accounts payable 5,695 12,493$
Due to others - 484,216
Due to other funds - 2,833
Total liabilities 5,695 499,542$
NET POSITION HELD IN TRUST FOR PENSION BENEFITS 18,838,809$
VILLAGE OF OSWEGO, ILLINOIS
STATEMENT OF FIDUCIARY NET POSITION
April 30, 2014
See accompanying notes to financial statements.- 16 -

STATEMENT OF CHANGES IN FIDUCIARY NET POSITION
PENSION TRUST FUND
For the Year Ended April 30, 2014
ADDITIONS
Contributions
Employer 1,075,000$
Employee 396,282
Total contributions 1,471,282
Investment income
Net appreciation in fair
value of investments 899,387
Interest 399,772
Total investment income 1,299,159
Less investment expense (46,498)
Net investment income 1,252,661
Total additions 2,723,943
DEDUCTIONS
Benefits and refunds 653,446
Administration 22,047
Total deductions 675,493
NET INCREASE 2,048,450
NET POSITION HELD IN TRUST
FOR PENSION BENEFITS
May 1 16,790,359
April 30 $ 18,838,809
VILLAGE OF OSWEGO, ILLINOIS
See accompanying notes to financial statements.- 17 -
- 17 -
VILLAGE OF OSWEGO, ILLINOIS
NOTES TO FINANCIAL STATEMENTS
April 30, 2014
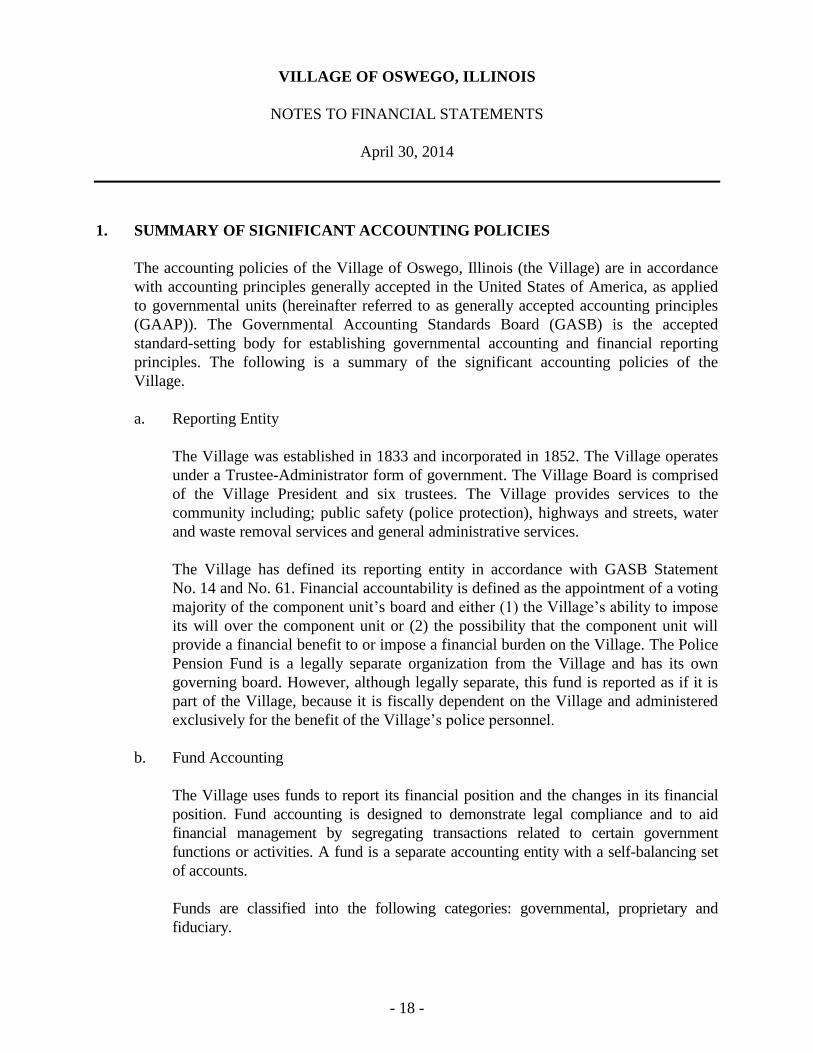
1. SUMMARY OF SIGNIFICANT ACCOUNTING POLICIES
The accounting policies of the Village of Oswego, Illinois (the Village) are in accordance
with accounting principles generally accepted in the United States of America, as applied
to governmental units (hereinafter referred to as generally accepted accounting principles
(GAAP)). The Governmental Accounting Standards Board (GASB) is the accepted
standard-setting body for establishing governmental accounting and financial reporting
principles. The following is a summary of the significant accounting policies of the
Village.
a. Reporting Entity
The Village was established in 1833 and incorporated in 1852. The Village operates
under a Trustee-Administrator form of government. The Village Board is comprised
of the Village President and six trustees. The Village provides services to the
community including; public safety (police protection), highways and streets, water
and waste removal services and general administrative services.
The Village has defined its reporting entity in accordance with GASB Statement
No. 14 and No. 61. Financial accountability is defined as the appointment of a voting
majority of the component unit’s board and either (1) the Village’s ability to impose
its will over the component unit or (2) the possibility that the component unit will
provide a financial benefit to or impose a financial burden on the Village. The Police
Pension Fund is a legally separate organization from the Village and has its own
governing board. However, although legally separate, this fund is reported as if it is
part of the Village, because it is fiscally dependent on the Village and administered
exclusively for the benefit of the Village’s police personnel.
b. Fund Accounting
The Village uses funds to report its financial position and the changes in its financial
position. Fund accounting is designed to demonstrate legal compliance and to aid
financial management by segregating transactions related to certain government
functions or activities. A fund is a separate accounting entity with a self-balancing set
of accounts.
Funds are classified into the following categories: governmental, proprietary and
fiduciary.
- 18 -

VILLAGE OF OSWEGO, ILLINOIS
NOTES TO FINANCIAL STATEMENTS (Continued)
- 18 -
1. SUMMARY OF SIGNIFICANT ACCOUNTING POLICIES (Continued)
b. Fund Accounting (Continued)
Governmental funds are used to account for all or most of a government’s general
activities, including the collection and disbursement of restricted, committed or
assigned funds (special revenue funds), the funds restricted, committed or assigned
for the acquisition or construction of capital assets (capital projects funds) and the
funds restricted, committed or assigned for the servicing of general long-term debt
(debt service funds). The general fund is used to account for all activities of the
general government not accounted for in some other fund.
Proprietary funds are used to account for activities similar to those found in the
private sector, where the determination of net income is necessary or useful for sound
financial administration. Goods or services from such activities can be provided
either to outside parties (enterprise funds) or to other departments or agencies
primarily within the government (internal service funds).
Fiduciary funds are used to account for assets held on behalf of outside parties,
including other governments, or on behalf of other funds within the government. The
Village utilizes a pension trust fund which is generally used to account for assets that
the Village holds in a fiduciary capacity and agency funds to account for assets that
the Village holds in an agent capacity.
c. Government-Wide and Fund Financial Statements
The government-wide financial statements (i.e., the statement of net assets and the
statement of activities) report information on all of the nonfiduciary activities of the
Village. The effect of material interfund activity has been eliminated from these
statements. Interfund services provided and used are not eliminated on these
statements. Governmental activities, which normally are supported by taxes and
intergovernmental revenues, are reported separately from business-type activities,
which rely to a significant extent on fees and charges for support.
The statement of activities demonstrates the degree to which the direct expenses of a
given function, segment or program are offset by program revenues. Direct expenses
are those that are clearly identifiable with a specific function or segment. Program
revenues include (1) charges to customers or applicants who purchase, use or directly
benefit from goods, services or privileges provided by a given function or segment and
(2) grants and standard revenues that are restricted to meeting the operational or capital
requirements of a particular function or segment. Taxes and other items not properly
included among program revenues are reported instead as general revenues.
- 19 -

VILLAGE OF OSWEGO, ILLINOIS
NOTES TO FINANCIAL STATEMENTS (Continued)
- 19 -
1. SUMMARY OF SIGNIFICANT ACCOUNTING POLICIES (Continued)
c. Government-Wide and Fund Financial Statements (Continued)
Separate financial statements are provided for governmental funds, proprietary funds
and fiduciary funds, even though the latter are excluded from the government-wide
financial statements. Major individual governmental funds and major individual
enterprise funds are reported as separate columns in the fund financial statements.
The Village reports the following major governmental funds:
The General Fund is the general operating fund of the Village and is used to
account for all financial resources of the Village unless required to be accounted
for in another fund.
The Debt Service Fund is used to account for the repayment of the Series
2006A, 2007B, a portion of the 2009 general obligation bonds that are being
repaid with property and sales tax, and a portion of the 2011 and 2013 general
obligation refunding bonds.
In addition, the Village reports the following major enterprise funds:
The Water and Sewer Fund is used to account for the revenues and expenses
related to the sale of water and sewer collection services to the Village’s
residents and other customers.
The Garbage Fund accounts for the revenues and expenses related to waste
removal service provided to the Village’s residents and other customers.
The Village reports a pension trust fund as a fiduciary fund to account for the Police
Pension Fund. Agency funds are used to account for the subdivision escrow and agency
funds.
d. Measurement Focus, Basis of Accounting and Financial Statement Presentation
The government-wide financial statements are reported using the economic resources
measurement focus and the accrual basis of accounting, as are the proprietary fund and
fiduciary fund financial statements (except the agency funds which do not have a
measurement focus). Revenues and additions are recorded when earned and expenses
and deductions are recorded when a liability is incurred. Property taxes are recognized
as revenues in the year for which they are levied (i.e., intended to finance). Grants and
similar items are recognized as revenue as soon as all eligibility requirements imposed
by the provider have been met. Operating revenues/expenses include all
revenues/expenses directly related to providing enterprise fund services. Incidental
revenues/expenses are reported as non-operating.
- 20 -

VILLAGE OF OSWEGO, ILLINOIS
NOTES TO FINANCIAL STATEMENTS (Continued)
- 20 -
1. SUMMARY OF SIGNIFICANT ACCOUNTING POLICIES (Continued)
d. Measurement Focus, Basis of Accounting and Financial Statement Presentation
(Continued)
Governmental fund financial statements are reported using the current financial
resources measurement focus and the modified accrual basis of accounting. Revenues
are recognized as soon as they are both measurable and available. Revenues are
considered to be available when they are collectible within the current period or soon
enough thereafter to pay liabilities of the current period. The Village considers
revenues to be available if they are collected within 60 days of the end of the current
fiscal period, except for sales taxes and telecommunication taxes which use a 90-day
period. Expenditures generally are recorded when a fund liability is incurred. However,
debt service expenditures are recorded only when payment is due.
Property taxes, sales and telecommunication taxes owed by the state at year end,
franchise fees, licenses, court fines, charges for services and interest associated with the
current fiscal period are all considered to be susceptible to accrual and are recognized
as revenues of the current fiscal period. Other fines and permit revenue are considered
to be measurable and available only when cash is received by the Village.
In applying the susceptible to accrual concept to intergovernmental revenues (i.e.,
federal and state grants), the legal and contractual requirements of the numerous
individual programs are used as guidance. There are, however, essentially two types
of these revenues. In one, monies must be expended on the specific purpose or
project before any amounts will be paid to the Village; therefore, revenues are
recognized based upon the expenditures/expenses recorded. In the other, monies are
virtually unrestricted as to purpose of expenditure/expense and are generally
revocable only for failure to comply with prescribed eligibility requirements, such as
equal employment opportunity. These resources are reflected as revenues at the time
of receipt or earlier if they meet the availability criterion.
The Village reports unearned/unavailable revenue on its financial statements.
Unearned/unavailable revenues arise when a potential revenue does not meet both
the measurable and available or earned criteria for recognition in the current period.
Unearned/unavailable revenues also arise when resources are received by the Village
before it has a legal claim to them or prior to the provision of services, as when grant
monies are received prior to the incurrence of qualifying expenditures/expenses. In
subsequent periods, when both revenue recognition criteria are met, or when the
Village has a legal claim to the resources, the liability or deferred inflow of resources
for unearned/unavailable revenue is removed from the financial statements and
revenue is recognized.
- 21 -

VILLAGE OF OSWEGO, ILLINOIS
NOTES TO FINANCIAL STATEMENTS (Continued)
- 21 -
1. SUMMARY OF SIGNIFICANT ACCOUNTING POLICIES (Continued)
e. Cash and Cash Equivalents
Cash and cash equivalents are defined as cash on hand and in interest-bearing and
non-interest-bearing checking accounts and cash with paying agent.
f. Investments
Investments of the Village consist of money market accounts, certificates of deposit
with various local financial institutions, various marketable securities, pooled
investments and insurance company annuity contracts. Investments are stated at fair
value, except for non-negotiable certificates and other nonpension fund investments
with a maturity of less than one year at date of purchase which are stated at cost or
amortized cost.
g. Interfund Receivables/Payables
During the course of operations, numerous transactions occur between individual funds
for goods provided or services rendered (interfund services). These receivables and
payables are classified as “due from other funds” or “due to other funds” on the
financial statements as are short-term interfund loans. Long-term interfund loans, if
any, are classified as advances to/from other funds.
h. Prepaid Items/Expenses
Payments made to vendors for services that will benefit periods beyond the date of
this report are recorded as prepaid items/expenses using the consumption method.
i. Deferred Outflows/Inflows of Resources
In addition to assets, the statement of net position will sometimes report a separate
section for deferred outflows of resources. This separate financial statement element,
deferred outflows of resources, represents a consumption of net assets that applies to
a future period(s) and so will not be recognized as an outflow of resources
(expense/expenditure) until then. In addition to liabilities, the statement of financial
position will sometimes report a separate section for deferred inflows of resources.
This separate financial statement element, deferred inflows of resources, represents
an acquisition of net assets that applies to a future period(s) and so will not be
recognized as an inflow of resources (revenue) until that time.
- 22 -

VILLAGE OF OSWEGO, ILLINOIS
NOTES TO FINANCIAL STATEMENTS (Continued)
- 22 -
1. SUMMARY OF SIGNIFICANT ACCOUNTING POLICIES (Continued)
j. Capital Assets
Capital assets, which include property, plant, equipment and infrastructure assets (e.g.,
roads, bridges, storm sewers and similar items), are reported in the applicable
governmental or business-type activities columns in the government-wide financial
statements. Capital assets are defined by the Village as assets with an initial, individual
cost of more than $10,000 and an estimated useful life in excess of one year. Such
assets are recorded at historical cost or estimated historical cost if purchased or
constructed. Donated capital assets are recorded at estimated fair market value at the
date of donation. The Village has reported its retroactive infrastructure assets in these
financial statements for governmental activities. The costs of normal maintenance and
repairs, including street overlays that do not add to the value or service capacity of the
asset or materially extend asset lives, are not capitalized.
Major outlays for capital assets and improvements are capitalized as projects are
constructed. Interest incurred during the construction phase of capital assets of
business-type activities is included as part of the capitalized value of the assets
constructed. Property, plant and equipment are depreciated using the straight-line
method over the following estimated useful lives:
Years
Buildings 40
Vehicles 3-7
Equipment 5-10
Infrastructure 25-75
k. Compensated Absences Vested or accumulated vacation leave related to employees that have retired or
terminated at year end but are not yet paid out is reported as an expenditure and a fund liability of the governmental fund (general fund) that will pay it. Vested and accumulated vacation leave of the proprietary funds and governmental activities is recorded as an expense and liability as the benefits accrue to employees. Sick leave does not vest and, therefore, is not recorded as a liability, except for a few employees with specific employment contracts that specify their unused sick leave can be used to pay health insurance premiums after retirement from the Village. These amounts are recorded as liabilities of the governmental activities.
- 23 -

VILLAGE OF OSWEGO, ILLINOIS
NOTES TO FINANCIAL STATEMENTS (Continued)
- 23 -
1. SUMMARY OF SIGNIFICANT ACCOUNTING POLICIES (Continued)
l. Long-Term Obligations
In the government-wide financial statements and proprietary funds in the fund financial
statements, long-term debt and other long-term obligations are reported as liabilities in
the applicable governmental activities, business-type activities or proprietary fund
financial statements. Bond premiums and discounts are deferred and amortized over the
life of the bonds. Bonds payable are reported net of the applicable bond premium or
discount and any gain or loss on refunding. Bond issuance costs are reported as
expenses.
In the fund financial statements, governmental funds recognize bond premiums and
discounts, as well as bond issuance costs, during the current period. The face amount of
debt issued is reported as other financing sources. Premiums received on debt issuances
are reported as other financing sources while discounts on debt issuances are reported
as other financing uses. Issuance costs, whether or not withheld from the actual debt
proceeds received, are reported as expenditures.
m. Fund Balances/Net Position
In accordance with the Village’s fund balance policy, in the fund financial
statements, governmental funds report nonspendable fund balance for amounts that
are either not in spendable form or legally or contractually required to be maintained
intact. Restrictions of fund balance are reported for amounts constrained by legal
restrictions from outside parties for use for a specific purpose, or externally imposed
by outside entities or from enabling legislation adopted by the Village. Committed
fund balance is constrained by formal actions of the Village’s Board of Trustees,
which is considered the Village’s highest level of decision making authority. Formal
actions include ordinances approved by the Board. Assigned fund balance represents
amounts constrained by the Village’s intent to use them for a specific purpose. The
Village Board has the authority to assign fund balance. The General Fund reports
assigned fund balance of 35% of annual budgeted expenditures. Any residual fund
balance in the General Fund, including fund balance targets and any deficit fund
balance of any other governmental fund is reported as unassigned.
In the government-wide financial statements, restricted net assets are legally restricted
by outside parties for a specific purpose. In the Capital Projects Fund, the restriction of
fund balance for highways and streets is a result of enabling legislation adopted by the
Village. This is also shown as restricted net assets on the statement of net position.
Net investment in capital assets is the book value of the capital assets net of any debt
outstanding that was issued to construct or acquire the capital assets.
- 24 -

VILLAGE OF OSWEGO, ILLINOIS
NOTES TO FINANCIAL STATEMENTS (Continued)
- 24 -
1. SUMMARY OF SIGNIFICANT ACCOUNTING POLICIES (Continued)
m. Fund Balances/Net Position (Continued)
The Village’s flow of funds assumption prescribes that the funds with the highest
level of constraint are expended first. If restricted or unrestricted funds are available
for spending, the restricted funds are spent first. Additionally, if different levels of
unrestricted funds are available for spending, the Village considers committed funds
to be expended first followed by assigned funds and then unassigned funds.
n. Interfund Transactions
Interfund services are accounted for as revenues, expenditures or expenses in the
effected funds. Transactions that constitute reimbursements to a fund for
expenditures/expenses initially made from it that are properly applicable to another
fund, are recorded as expenditures/expenses in the reimbursing fund and as reductions
of expenditures/expenses in the fund that is reimbursed. All other interfund transactions
are reported as transfers.
o. Accounting Estimates
The preparation of financial statements in conformity with generally accepted
accounting principles requires management to make estimates and assumptions that
affect the reported amounts of assets and liabilities and disclosure of contingent assets
and liabilities at the date of the financial statements and the reported amount of
revenues and expenditures/expenses during the reporting period. Actual results could
differ form those estimates.
2. CASH AND INVESTMENTS
The Village’s investment policy authorizes the Village to make deposits/invest in insured
commercial banks, savings and loan institutions, obligations of the U.S. Treasury and U.S.
agencies, insured credit union shares, money market mutual funds with portfolios of
securities issued or guaranteed by the United States or agreements to repurchase these same
obligations, repurchase agreements, short-term commercial paper rated within the three
highest classifications by at least two standard rating services and Illinois Funds.
The Police Pension Fund can invest in the same securities as the Village, plus the
following: certain non-U.S. obligations (investment grade corporate debt securities),
Illinois municipal corporations tax anticipation warrants, veteran’s loans, obligations of the
State of Illinois and its political divisions, Illinois insurance company general and separate
accounts (not to exceed 10% of the portfolio), mutual funds and common and preferred
stocks (limited to 55% of the Police Pension Fund’s net present assets effective July 1,
2012).
- 25 -
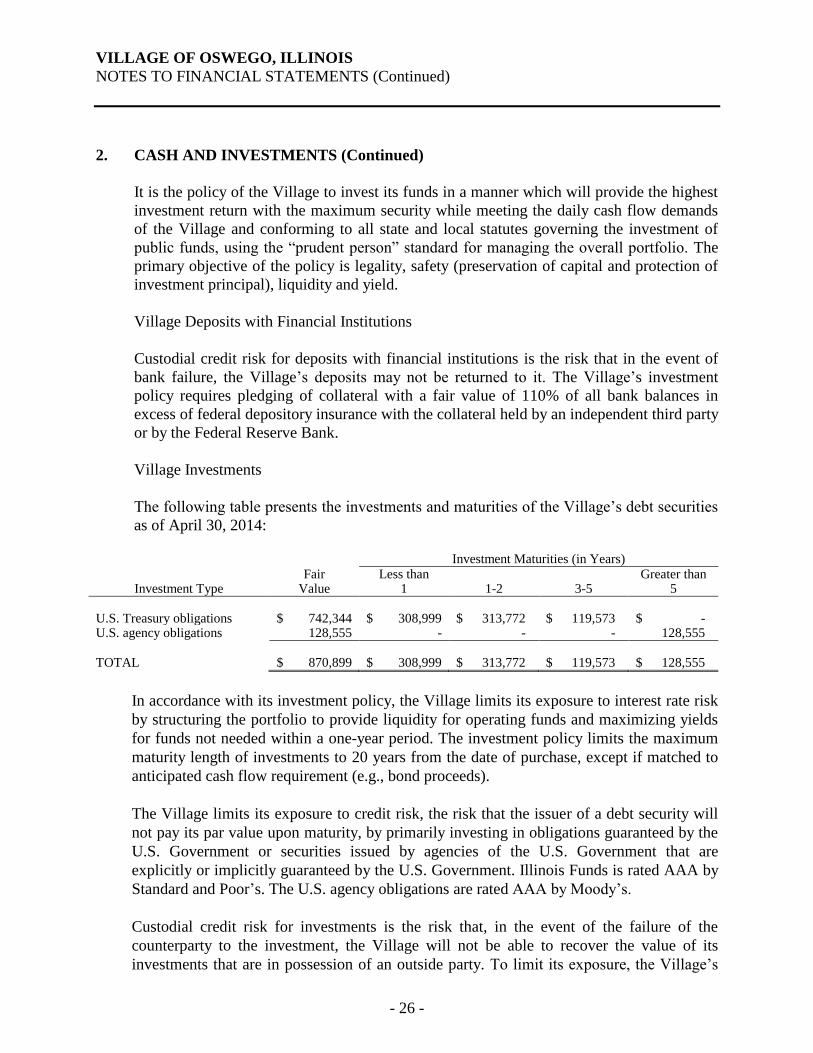
VILLAGE OF OSWEGO, ILLINOIS
NOTES TO FINANCIAL STATEMENTS (Continued)
- 25 -
2. CASH AND INVESTMENTS (Continued)
It is the policy of the Village to invest its funds in a manner which will provide the highest
investment return with the maximum security while meeting the daily cash flow demands
of the Village and conforming to all state and local statutes governing the investment of
public funds, using the “prudent person” standard for managing the overall portfolio. The
primary objective of the policy is legality, safety (preservation of capital and protection of
investment principal), liquidity and yield.
Village Deposits with Financial Institutions
Custodial credit risk for deposits with financial institutions is the risk that in the event of
bank failure, the Village’s deposits may not be returned to it. The Village’s investment
policy requires pledging of collateral with a fair value of 110% of all bank balances in
excess of federal depository insurance with the collateral held by an independent third party
or by the Federal Reserve Bank.
Village Investments
The following table presents the investments and maturities of the Village’s debt securities
as of April 30, 2014:
Investment Maturities (in Years)
Investment Type
Fair Value
Less than 1
1-2
3-5
Greater than 5
U.S. Treasury obligations $ 742,344 $ 308,999 $ 313,772 $ 119,573 $ - U.S. agency obligations 128,555 - - - 128,555
TOTAL $ 870,899 $ 308,999 $ 313,772 $ 119,573 $ 128,555
In accordance with its investment policy, the Village limits its exposure to interest rate risk
by structuring the portfolio to provide liquidity for operating funds and maximizing yields
for funds not needed within a one-year period. The investment policy limits the maximum
maturity length of investments to 20 years from the date of purchase, except if matched to
anticipated cash flow requirement (e.g., bond proceeds).
The Village limits its exposure to credit risk, the risk that the issuer of a debt security will
not pay its par value upon maturity, by primarily investing in obligations guaranteed by the
U.S. Government or securities issued by agencies of the U.S. Government that are
explicitly or implicitly guaranteed by the U.S. Government. Illinois Funds is rated AAA by
Standard and Poor’s. The U.S. agency obligations are rated AAA by Moody’s.
Custodial credit risk for investments is the risk that, in the event of the failure of the
counterparty to the investment, the Village will not be able to recover the value of its
investments that are in possession of an outside party. To limit its exposure, the Village’s
- 26 -

VILLAGE OF OSWEGO, ILLINOIS
NOTES TO FINANCIAL STATEMENTS (Continued)
- 26 -
2. CASH AND INVESTMENTS (Continued)
Village Investments (Continued)
investment policy requires all security transactions that are exposed to custodial credit risk
to be processed on a delivery versus payment (DVP) basis with the underlying investments
held by a third party acting as the Village’s agent separate from where the investment was
purchased in the Village’s name. Illinois Funds are not subject to custodial credit risk.
Illinois Funds is an investment pool managed by the State of Illinois, Office of the
Treasurer, which allows governments within the State to pool their funds for investment
purposes. Illinois Funds is not registered with the SEC as an investment company but does
operate in a manner consistent with Rule 2a7 of the Investment Company Act of 1940.
Investments in Illinois Funds are valued at Illinois Funds’ share price, the price for which
the investment could be sold.
Concentration of credit risk - The Village’s investment policy does not limit the amount of
the portfolio that can be invested in any one investment vehicle but does require reasonable
diversification of the portfolio.
Police Pension Fund Deposits with Financial Institutions
Custodial credit risk for deposits with financial institutions is the risk that in the event of
bank failure, the Police Pension Fund’s deposits may not be returned to them. The Police
Pension Fund’s investment policies require that bank balances in excess of federal
depository insurance or guarantee limits must be collateralized.
Police Pension Fund Investments
The following table presents the investments and maturities of the Police Pension Fund’s
debt securities as of April 30, 2014:
Investment Maturities (in Years)
Investment Type
Fair
Value
Less than
1
1-5
6-10
Greater than
10
U.S. Treasury
obligations
$ 1,496,317
$ -
$ 1,186,567
$ 309,750
$ -
U.S. agency obligations 5,969,109 127,018 2,447,756 2,201,783 1,192,552
Municipal bonds 1,195,014 106,984 459,009 575,498 53,523
TOTAL $ 8,660,440 $ 234,002 $ 4,093,332 $ 3,087,031 $ 1,246,075
In accordance with its investment policy, the Police Pension Fund limits its exposure to
interest rate risk by structuring the portfolio to provide liquidity for operating funds while
maximizing yields for funds.
- 27 -

VILLAGE OF OSWEGO, ILLINOIS
NOTES TO FINANCIAL STATEMENTS (Continued)
- 27 -
2. CASH AND INVESTMENTS (Continued)
Police Pension Fund Investments (Continued)
The Police Pension Fund limits its exposure to credit risk, the risk that the issuer of a debt
security will not pay its par value upon maturity, by primarily investing in obligations
guaranteed by the U.S. Government or securities issued by agencies of the U.S.
Government that are explicitly or implicitly guaranteed by the U.S. Government. The U.S.
agency securities are rated at least Aaa by Moody’s or are small issues that are unrated. The
municipal bonds are rated between Aaa - A2 by Moody’s. The money market mutual funds
are rated AAA.
Custodial credit risk for investments is the risk that, in the event of the failure of the
counterparty to the investment, the Police Pension Fund will not be able to recover the
value of its investments that are in possession of an outside party. The Police Pension
Fund’s investment policy does not address custodial credit risk. However, all security
transactions exposed to custodial credit risk are processed on a delivery versus payment
(DVP) basis with the underlying investments held by an independent third party custodian
and evidenced by safekeeping receipts. The money market mutual funds are not subject to
custodial credit risk.
Concentration of credit risk - The Police Pension Fund’s investment policy establishes the
following limits of investments of the portfolio:
Investment Type
Normal
Allocation
Range of
Allocation
U.S. Treasury bills/notes/bonds 30% 0-100%
U.S. Government agency securities (non-MBS) 35% 0-70%
U.S. Government agency securities (callable) 20% 0-30%
U.S. Government agency securities (MBS) 5% 0-10%
Taxable municipal securities 10% 0-20%
Certificates of deposit 0% 0-20%
Investment grade corporate bonds 0% 0-30%
U.S. large company stocks 70% 40-100%
U.S. small company stocks 20% 0-40%
International stocks 10% 0-20%
At April 30, 2014, the Village had four mutual funds and one annuity contract that were
each valued at greater than 5.00% of the total plan net position for the Police Pension Fund.
- 28 -

VILLAGE OF OSWEGO, ILLINOIS
NOTES TO FINANCIAL STATEMENTS (Continued)
- 28 -
2. CASH AND INVESTMENTS (Continued)
Police Pension Fund Investments (Continued)
The Police Pension Fund’s investment policy prohibits investment in derivatives, short
selling, purchase of securities on margin, transactions involving futures or options contracts, reverse repurchase agreements and securities lending and borrowing transactions.
3. RECEIVABLE - TAXES Property taxes for 2013 attach as an enforceable lien on January 1, 2013, on property
values assessed as of the same date. Taxes are levied by December of the subsequent fiscal year (by passage of a tax levy ordinance). Tax bills are prepared by the County and issued on or about May 1, 2014, and are payable in two installments, on or about June 1, 2014 and September 1, 2014. The County collects such taxes and remits them periodically. Because the 2013 levy is intended to finance the fiscal year ending April 30, 2015, it has been offset by unavailable/unearned revenue at April 30, 2014. The 2014 tax levy, which attached as an enforceable lien on property as of January 1, 2014, has not been recorded as a receivable as of April 30, 2014, as the tax has not yet been levied by the Village and will not be levied until December 2014 and, therefore, the levy is not measurable at April 30, 2014.
4. NOTES RECEIVABLE - ECONOMIC DEVELOPMENT The Village established the Economic Development Fund to account for funds which are to
be loaned to new or expanding local business ventures which enhance economic development of the Village. Proceeds (principal and interest) received from such economic development loans made by the Village are to be used to capitalize a revolving economic development loan fund. The following represents the outstanding balances as of April 30, 2014:
During the fiscal year 2009, the Village entered into an installment note with the
Oswego Tap House in the amount of $249,241. The note is payable in monthly installments of $2,897 through October 2016, which includes 3% interest on the unpaid balance. The outstanding balance of this note as of April 30, 2014 was $78,243.
During the fiscal year 2009, the Village entered into a second installment note with
the Oswego Tap House in the amount of $60,000. The note is payable in monthly installments of $579 through July 2018, which includes 3% interest on the unpaid balance. The outstanding balance of this note as of April 30, 2014 was $27,709.
During the fiscal year 2013, the Village entered into a installment note with the
Firehouse Pizza & Pub, LLC in the amount of $130,000. The note is payable in monthly installments of $1,260 through February 2022, which includes 3% interest on the unpaid balance. The outstanding balance of this note as of April 30, 2014 was $104,546.
- 29 -

VILLAGE OF OSWEGO, ILLINOIS
NOTES TO FINANCIAL STATEMENTS (Continued)
- 29 -
4. NOTES RECEIVABLE - ECONOMIC DEVELOPMENT (Continued) Principal and interest maturities of these notes receivable for future periods are as follows:
Year Ending April 30,
Amount
2015 $ 56,834 2016 56,834 2017 33,660 2018 22,072 2019 16,859 2020 15,120 2021 15,120 2022 11,271
Total principal and interest 227,770 Interest (17,272)
TOTAL PRINCIPAL $ 210,498
5. DUE FROM OTHER GOVERNMENTS The following receivables are included in intergovernmental receivable on the statement of
net position:
GOVERNMENTAL ACTIVITIES Sales tax $ 1,387,778 Home rule tax 461,045 Use tax 125,885 Income tax 464,673 Telecommunications tax 220,941 Motor fuel tax 55,961 Grants 3,521
TOTAL GOVERNMENTAL ACTIVITIES $ 2,719,804
6. INDIVIDUAL FUND DISCLOSURES
a. Interfund receivable/payables at April 30, 2014 are as follows:
Receivable Fund Payable Fund Amount
Water and Sewer Fiduciary $ 1,536 General Fiduciary 1,297 Fiduciary General 10,580
TOTAL $ 13,413
All amounts will be repaid within one year.
- 30 -

VILLAGE OF OSWEGO, ILLINOIS
NOTES TO FINANCIAL STATEMENTS (Continued)
- 30 -
6. INDIVIDUAL FUND DISCLOSURES (Continued)
b. Transfers between funds at April 30, 2014 consist of the following:
Significant interfund transfers are as follows:
$1,516,563 transferred from the General Fund to the Debt Service Fund is for
the repayment of principal and interest of the Series 2004A, 2007B and 2009
bonds.
$262,500 transferred from the Motor Fuel Tax Fund to Debt Service Fund is for
the repayment of principal and interest of the Series 2007B bonds.
None of the transfers will be repaid.
7. CAPITAL ASSETS
The following is a summary of capital asset activity during the fiscal year:
Beginning
Balances
Increases
Decreases
Ending
Balances
GOVERNMENTAL ACTIVITIES
Capital assets not being depreciated
Land $ 1,312,153 $ - $ - $ 1,312,153
Right of way 101,588,973 530,641 - 102,119,614
Total capital assets not being depreciated 102,901,126 530,641 - 103,431,767
Capital assets being depreciated
Land improvements 848,229 - - 848,229
Buildings 9,515,388 - - 9,515,388
Equipment 709,937 26,600 - 736,537
Vehicles 1,185,938 413,116 164,527 1,434,527
Infrastructure 229,928,335 1,770,076 - 231,698,411
Total capital assets being depreciated 242,187,827 2,209,792 164,527 244,233,092
Transfers In Transfers Out
General $ - $ 1,516,563
Debt Service 1,779,063 -
Nonmajor Governmental
Motor Fuel Tax - 262,500
TOTAL $ 1,779,063 $ 1,779,063
- 31 -

VILLAGE OF OSWEGO, ILLINOIS
NOTES TO FINANCIAL STATEMENTS (Continued)
- 31 -
7. CAPITAL ASSETS (Continued)
Beginning
Balances
Increases
Decreases
Ending
Balances
GOVERNMENTAL ACTIVITIES (Continued)
Less accumulated depreciation for
Land improvements $ 130,767 $ 42,411 $ - $ 173,178
Buildings 2,022,721 237,838 - 2,260,559
Equipment 601,926 31,010 - 632,936
Vehicles 901,356 148,067 149,141 900,282
Infrastructure 53,885,626 4,604,270 - 58,489,896
Total accumulated depreciated 57,542,396 5,063,596 149,141 62,456,851
Total capital assets being depreciated, net 184,645,431 (2,853,804) 15,386 181,776,241
GOVERNMENTAL ACTIVITIES
CAPITAL ASSETS, NET $ 287,546,557 $ (2,323,163) $ 15,386 $ 285,208,008
Beginning
Balances
Increases
Decreases
Ending
Balances
BUSINESS-TYPE ACTIVITIES
Capital assets not being depreciated
Land $ 897,871 $ - $ - $ 897,871
Construction in progress 2,099,543 808,378 2,907,921 -
Total capital assets not being depreciated 2,997,414 808,378 2,907,921 897,871
Capital assets being depreciated
Buildings 6,618,082 - - 6,618,082
Equipment 130,418 - - 130,418
Vehicles 1,342,282 - 20,049 1,322,233
Infrastructure 63,878,312 2,907,921 - 66,786,233
Total capital assets being depreciated 71,969,094 2,907,921 20,049 74,856,966
Less accumulated depreciation for
Buildings 1,271,751 165,028 - 1,436,779
Equipment 104,940 8,736 - 113,676
Vehicles 1,114,754 117,186 20,049 1,211,891
Infrastructure 14,568,930 1,272,161 - 15,841,091
Total accumulated depreciation 17,060,375 1,563,111 20,049 18,603,437
Total capital assets being depreciated, net 54,908,719 1,344,810 - 56,253,529
BUSINESS-TYPE ACTIVITIES
CAPITAL ASSETS, NET $ 57,906,133 $ 2,153,188 $ - $ 57,151,400
- 32 -

VILLAGE OF OSWEGO, ILLINOIS
NOTES TO FINANCIAL STATEMENTS (Continued)
- 32 -
7. CAPITAL ASSETS
Depreciation expense was charged to the governmental activities functions/programs as follows:
GOVERNMENTAL ACTIVITIES
General government $ 229,365
Public safety 170,878
Public works 4,663,353
TOTAL DEPRECIATION EXPENSE - GOVERNMENTAL
ACTIVITIES
$ 5,063,596
8. LONG-TERM DEBT
a. General Obligation Bonds
The Village issues general obligation bonds to provide funds for the acquisition and
construction of major capital facilities, refunding prior issuances and providing
working capital for the Village.
General obligation bonds are direct obligations and pledge the full faith and credit of
the Village and are payable from governmental activities/funds and business-type
activities/enterprise funds. General obligation bonds currently outstanding are as
follows:
Governmental Activities
Issue
Fund Debt
Retired by
Purpose
Balances
May 1
Issuances
Retirements/
Refundings
Balances
April 30
Current
Portion
$9,970,000 General Obligation Alternate Revenue Source Bonds, Series 2006A, dated May 15, 2006, due in annual installments of $375,000 to $700,000 through December 15, 2025, interest at 4.125% to 4.5% payable each June 15 and December 15 from sales tax revenues
Debt Service
New Village Hall Facility
and Town Center
Renovation Project
$ 7,525,000
$ -
$ 3,800,000
$ 3,725,000
$ 475,000
- 33 -

VILLAGE OF OSWEGO, ILLINOIS
NOTES TO FINANCIAL STATEMENTS (Continued)
- 33 -
8. LONG-TERM DEBT (Continued)
a. General Obligation Bonds (Continued)
Governmental Activities (Continued)
Issue
Fund Debt
Retired by
Purpose
Balances
May 1
Issuances
Retirements/
Refundings
Balances
April 30
Current
Portion
$6,000,000 General Obligation Alternate Revenue Source Bonds, Series 2007B, dated December 15, 2007, due in annual installments of $210,000 to $425,000 through December 15, 2027, interest at 3.75% to 4% payable each June 15 and December 15 from sales tax and motor fuel tax revenues
Debt Service
Douglas Road
Reconstruct
$ 4,885,000
$ -
$ 3,200,000
$ 1,685,000
$ 250,000
$9,015,000 Taxable General Obligation Bonds, Series 2009, dated September 2, 2009, due in annual installments of $240,000 to $620,000 through December 15, 2029, interest at 2.125% to 5.5% payable each June 15 and December 15 from sales tax and motor fuel revenues*
Debt Service
Douglas Road
Reconstruct
1,495,000
-
285,000
1,210,000
295,000
$4,055,000 General Obligation Refunding Bonds, Series 2011, dated December 20, 2011, due in annual installments of $20,000 to $390,000 through December 15, 2024, interest at 2% to 3.5% payable each June 15 and December 15 from sales tax revenues**
Debt Service
Refund 2004A &
2004B Bonds
2,290,000
-
160,000
2,130,000
160,000
- 34 -

VILLAGE OF OSWEGO, ILLINOIS
NOTES TO FINANCIAL STATEMENTS (Continued)
- 34 -
8. LONG-TERM DEBT (Continued) a. General Obligation Bonds (Continued) Governmental Activities (Continued)
Issue
Fund Debt Retired by
Purpose
Balances May 1
Issuances
Retirements/ Refundings
Balances April 30
Current Portion
$8,595,000 General Obligation Refunding Bonds, Series 2013, dated May 17, 2013, due in annual installments of $45,000 to $1,095,000 through December 15, 2028, interest at 2% to 3% payable each June 15 and December 15 ***
Debt Service
Refund 2006A &
2007B Bonds
$ -
$ 6,770,000
$ -
$ 6,770,000
$ 45,000
TOTAL GOVERNMENTAL ACTIVITIES
$ 16,195,000
$ 6,770,000
$ 7,445,000
$ 15,520,000
$ 1,225,000
* The portion of the Series 2009 bonds allocated to governmental activities was $1,495,000. Pursuant to the American Recovery and Reinvestment Act, the Village is eligible to receive a rebate of 35% of the interest paid each year from the U.S. Treasury Department. The net interest rate for these Build America Bonds, after rebate, is 1.38% to 3.58%. ** The portion of the original Series 2011 bonds allocated to governmental activities was $2,300,000. *** The portion of the original Series 2013 bonds allocated to governmental activities was $6,770,000. Business-Type Activities
Issue
Fund Debt Retired by
Purpose
Balances May 1
Issuances
Retirements
Balances April 30
Current Portion
$1,585,000 General Obligation Alternate Revenue Source Bonds, Series 2006B, dated May 15, 2006, due in annual installments of $100,000 to $145,000 through December 15, 2020, interest at 4.25% to 4.375% payable each June 15 and December 15 from water and sewer fund revenues
Water and Sewer
Town Center Water and
Sewer Renovation
Project
$ 985,000
$ -
$ 100,000
$ 885,000
$ 115,000
- 35 -

VILLAGE OF OSWEGO, ILLINOIS
NOTES TO FINANCIAL STATEMENTS (Continued)
- 35 -
8. LONG-TERM DEBT (Continued) a. General Obligation Bonds (Continued) Business-Type Activities (Continued)
Issue
Fund Debt Retired by
Purpose
Balances May 1
Issuances
Retirements
Balances April 30
Current Portion
$3,500,000 General Obligation Alternate Revenue Source Bonds, Series 2007A, dated December 15, 2007, due in annual installments of $125,000 to $245,000 through December 15, 2027, interest at 4% to 4.25% payable each June 15 and December 15 from water and sewer fund revenues
Water and Sewer
Village Hall Facility
$ 2,850,000
$ -
$ 1,875,000
$ 975,000
$ 150,000
$9,015,000 Taxable General Obligation Bonds, Series 2009, dated September 2, 2009, due in annual installments of $240,000 to $620,000 through December 15, 2029, interest at 2.125% to 5.5% payable each June 15 and December 15 from water and sewer fund revenues*
Water and
Sewer
Improve Water and Sewerage System
6,730,000
-
265,000
6,465,000
275,000
$4,055,000 General Obligation Refunding Bonds, Series 2011, dated December 20, 2011, due in annual installments of $20,000 to $390,000 through December 15, 2024, interest at 2% to 3.5% payable each June 15 and December 15 from sales tax revenues**
Water and Sewer
Refund 2004A &
2004B Bonds
1,745,000
-
125,000
1,620,000
130,000
- 36 -

VILLAGE OF OSWEGO, ILLINOIS
NOTES TO FINANCIAL STATEMENTS (Continued)
- 36 -
8. LONG-TERM DEBT (Continued) a. General Obligation Bonds (Continued) Business-Type Activities (Continued)
Issue
Fund Debt Retired by
Purpose
Balances May 1
Issuances
Retirements
Balances April 30
Current Portion
$2,325,000 General Obligation Refunding Bonds, Series 2012, dated October 11, 2012, due in annual installments of $300,000 to $365,000 through December 30, 2019, interest at 2% to 3% payable each June 30 and December 30 from sales tax revenues
Water and Sewer
Refund 2004
Bonds
$ 2,325,000
$ -
$ 300,000
$ 2,025,000
$ 315,000
$8,595,000 General Obligation Refunding Bonds, Series 2013, dated May 17, 2013, due in annual installments of $45,000 to $1,095,000 through December 15, 2028, interest at 2% to 3% payable each June 15 and December 15 ***
Water and Sewer
Refund 2007A Bonds
-
1,825,000
-
1,825,000
10,000
TOTAL BUSINESS- TYPE ACTIVITIES
$ 14,635,000
$ 1,825,000
$ 2,665,000
$ 13,795,000
$ 995,000
* The portion of the Series 2009 bonds allocated to business-type activities was $6,730,000.
Pursuant to the American Recovery and Reinvestment Act, the Village is eligible to receive a
rebate at 35% of the interest paid each year from the U.S. Treasury. The net interest rate for these
Build America Bonds, after rebate, is 1.38% to 3.58%.
** The original portion of the Series 2011 bonds allocated to business-type activities was
$1,755,000.
*** The original portion of the Series 2013 bonds allocated to business-type activities was
$1,825,000.
- 37 -

VILLAGE OF OSWEGO, ILLINOIS
NOTES TO FINANCIAL STATEMENTS (Continued)
- 37 -
8. LONG-TERM DEBT (Continued) b. IEPA Loans The Village, through the Illinois Environmental Protection Agency (IEPA), received
low interest loans for the construction of sewerage collection and treatment facilities payable from water and sewer revenues. IEPA loans currently outstanding are as follows:
Issue Fund Debt Retired by
Purpose
Balances May 1
Issuances
Retirements
Balances April 30
Current Portion
$907,735 loan agreement with the IEPA, IEPA-SRF Loan No. 17-0783, dated November 1, 1999, due semiannually on April 27 and October 27 through April 27, 2017, with interest at 2.89%
Water and Sewer
Convert sewage
treatment facility to a
pump station
$ 233,241
$ -
$ 55,825
$ 177,416
$ 57,450
$1,346,766 loan agreement with the IEPA, IEPA-SRF Loan No. 17-1445, issued April 1, 2004, due semiannually on January 15 and July 15 through January 15, 2025, with interest at 2.5%
Water and Sewer
Installation of radium removal
equipment at five existing
well sites
894,068
-
64,751
829,317
66,380
TOTAL IEPA LOANS
$ 1,127,309
$ -
$ 120,576
$ 1,006,733
$ 123,830
c. Debt Service Requirements to Maturity Annual debt service requirements to maturity are as follows:
Fiscal
Governmental Activities General Obligation Bonds
Business-Type Activities General Obligation Bonds
Business-Type Activities IEPA Loans
Year Principal Interest Principal Interest Principal Interest
2015 $ 1,225,000 $ 543,305 $ 995,000 $ 552,939 $ 123,830 $ 25,036 2016 1,290,000 499,082 1,020,000 523,325 127,172 21,693 2017 1,320,000 450,020 1,055,000 490,825 130,606 18,260 2018 1,320,000 399,106 1,080,000 453,111 71,516 15,184 2019 1,075,000 346,362 1,135,000 413,337 73,316 13,384 2020 1,130,000 304,000 1,165,000 371,301 75,161 11,539 2021 1,180,000 258,550 850,000 326,823 77,051 9,649 2022 1,210,000 213,750 740,000 292,459 78,989 7,711 2023 1,260,000 176,400 775,000 262,669 80,977 5,723
- 38 -

VILLAGE OF OSWEGO, ILLINOIS
NOTES TO FINANCIAL STATEMENTS (Continued)
- 38 -
8. LONG-TERM DEBT (Continued)
c. Debt Service Requirements to Maturity (Continued)
Fiscal
Governmental Activities
General Obligation Bonds
Business-Type Activities
General Obligation Bonds
Business-Type Activities
IEPA Loans
Year Principal Interest Principal Interest Principal Interest
2024 $ 1,285,000 $ 137,500 $ 805,000 $ 230,994 $ 83,014 $ 3,686
2025 1,310,000 97,850 845,000 197,594 85,101 1,599
2026 1,095,000 57,450 700,000 162,494 - -
2027 400,000 24,600 730,000 131,506 - -
2028 420,000 12,600 760,000 97,850 - -
2029 - - 555,000 62,700 - -
2030 - - 585,000 32,174 - -
TOTAL $ 15,520,000 $ 3,520,575 $ 13,795,000 $ 4,602,101 $ 1,006,733 $ 133,464
d. Changes in Long-Term Liabilities
During the fiscal year, the following changes occurred in long-term liabilities for
governmental activities:
Balances
May 1
Issuances
Retirements/
Refundings
Balances
April 30
Current
Portion
General obligation bonds payable $ 16,195,000 $ 6,770,000 $ 7,445,000 $ 15,520,000 $ 1,225,000
Unamortized premium
on bonds payable 79,534 387,715 12,499 454,750 -
Unamortized (discount)
on bonds payable
(35,445)
-
(31,178)
(4,267)
-
Compensated absences payable 446,780 234,858 226,398 455,240 233,677
Retiree termination benefit payable 59,990 - 22,077 37,913 5,106
Net pension obligation 671,168 - 10,745 660,423 -
Other postemployment benefit 53,498 24,596 - 78,094 -
TOTAL $ 17,470,525 $ 7,417,169 $ 7,685,541 $ 17,202,153 $ 1,463,783
The retiree termination benefit, compensated absences and other postemployment
benefit payables are normally liquidated by the General Fund.
- 39 -

VILLAGE OF OSWEGO, ILLINOIS
NOTES TO FINANCIAL STATEMENTS (Continued)
- 39 -
8. LONG-TERM DEBT (Continued)
d. Changes in Long-Term Liabilities (Continued)
During the fiscal year, the following changes occurred in long-term liabilities for
business-type activities:
Balances
May 1
Issuances
Retirements/
Refundings
Balances
April 30
Current
Portion
General obligation bonds payable $ 14,635,000 $ 1,825,000 $ 2,665,000 $ 13,795,000 $ 995,000
Unamortized discount on
bonds payable
(32,535)
-
(3,006)
(29,529)
-
Unamortized premium on
bonds payable
180,402
104,309
48,765
235,946
-
IEPA loans payable 1,127,309 - 120,576 1,006,733 123,830
Compensated absences payable 47,541 49,017 35,667 60,891 49,259
Other postemployment benefit 3,627 1,614 - 5,241 -
TOTAL $ 15,961,344 $ 1,979,940 $ 2,867,002 $ 15,074,282 $ 1,168,089
e. Legal Debt Margin
The Village is a home rule municipality. Chapter 65, Section 5/8-5-1 of the
Illinois Compiled Statutes governs computation of the legal debt margin.
“The General Assembly may limit by law the amount and require referendum
approval of debt to be incurred by home rule municipalities, payable from ad
valorem property tax receipts, only in excess of the following percentages of the
assessed value of its taxable property...(2) if its population is more than 25,000
and less than 500,000 an aggregate of one percent:...indebtedness which is
outstanding on the effective date (July 1, 1971) of this constitution or which is
thereafter approved by referendum...shall not be included in the foregoing
percentage amounts.”
To date the General Assembly has set no limits for home rule municipalities.
f. Refunding
On May 17, 2013, the Village issued $8,595,000 General Obligation Refunding
Bonds, Series 2013, to advance refund, through an in-substance defeasance,
$3,350,000 of the Series 2006A General Obligation Bonds, $1,725,000 of the
Series 2007A General Obligation Bonds and $2,950,000 of the Series 2007B
General Obligation Bonds. The bonds will be paid from escrow on December 15,
2015 and December 15, 2016. Through the refunding, the Village reduced its debt
service by $388,084 and achieved an economic gain of $340,230. The amount of
bonds outstanding to be paid from escrow at April 30, 2014 was $8,025,000.
- 40 -

VILLAGE OF OSWEGO, ILLINOIS
NOTES TO FINANCIAL STATEMENTS (Continued)
- 40 -
8. LONG-TERM DEBT (Continued)
g. Pledged Revenues
The Village has pledged a portion of future sales tax revenues, motor fuel tax
revenues and water and sewer fund revenues to repay the principal and interest on the
General Obligation Alternate Revenue Source Bonds Series 2006A, 2006B, 2007A
and 2007B; the Taxable General Obligation Bonds Series 2009, and the General
Obligation Refunding Bonds Series 2011 and 2012. Proceeds from the bonds
provided financing for certain capital improvements in the Village. The pledged
revenues are projected to be sufficient to meet debt service requirements over the life
of the bonds. For the current year, principal and interest paid totaled $3,008,599,
while total sales tax was $7,363,275, total motor fuel tax was $943,807 and total
water and sewer operating income was $273,064.
9. RISK MANAGEMENT
The Village is exposed to various risks of loss related to torts; theft of, damage to and
destruction of assets; errors and omissions; natural disasters; employee health; and injuries
to the Village’s employees. Through December 31, 2013, the Village provided workers
compensation, property and liability insurance coverages through third party indemnity
policies. The Village paid an annual premium to the insurance company for its coverage.
Settled claims have not exceeded the coverages in the current or preceding two fiscal years.
For its health insurance coverages, the Village participates in the Intergovernmental
Personnel Benefit Cooperative (IPBC). IPBC is a public entity risk pool established in
1979 by certain units of local government in Illinois to administer some or all of the
personnel benefit programs (primarily medical, dental and life insurance coverage) offered
by these members to their officers and employees and to the officers and employees of
certain other governmental, quasi-governmental and nonprofit public service entities.
Management consists of a Board of Directors comprised of one appointed representative
from each member. The officers of IPBC are chosen by the Board of Directors from among
their membership. The Village does not exercise any control over the activities of IPBC
beyond its representation on the Board of Directors.
IPBC acts as an administrative agency to receive, process and pay such claims as may
come within the benefit program of each member. Through IPBC, the Village offers both a
PPO plan and an HMO plan. For those employees enrolled in the PPO plan, the Village is
responsible for the first $35,000 in claims for each individual employee participant every
claim year. The members of IPBC share claims (for each individual employee) between
$35,000 and $125,000. IPBC maintains stop-loss insurance to cover claims in excess of
$125,000. Approximately 32% of the Village’s employees and retirees are PPO
participants.
- 41 -

VILLAGE OF OSWEGO, ILLINOIS
NOTES TO FINANCIAL STATEMENTS (Continued)
- 41 -
9. RISK MANAGEMENT (Continued)
The HMO plan is also self-insured through a special arrangement. Members of IPBC pay
for fixed costs of capitation and administration and then fund for claims not covered under
the capitation fee. This plan is fully pooled and the Village is not individually rated based
on claims experience. All members of the IPBC pay the same rates based on plan design
choices. Approximately 68% of the Village’s employees and retirees are HMO
participants.
The Village makes payments to IPBC monthly based on its participation in the plan. The
rates per individual participant are determined annually based on each member’s prior
experience within the pool and projected future claims. This rate also includes a provision
for the cost of excess insurance purchased by IPBC. The Village also makes monthly
payments to IPBC for administration of the plan.
Beginning January 1, 2014, the Village participates in the Illinois Municipal Insurance
Cooperative (IMIC). IMIC is an organization of municipalities in Northeastern Illinois
which have formed an association under the Illinois Intergovernmental Cooperations
Statute to pool its risk management needs. The agency administers a mix of self-insurance
and commercial property/casualty insurance coverages.
The Village’s payments to IMIC are displayed on the financial statements as
expenditures/expenses in appropriate funds. Each member assumes the first $1,000 of each
occurrence, and IMIC has a mix of self-insurance and commercial insurance at various
amounts above that level. The Village pays annual premiums to IMIC for its general
liability and property coverage.
Each member appoints one delegate, along with an alternate delegate, to represent the
member on the Board of Directors. The Village does not exercise any control over the
activities of IMIC beyond its representation on the Board of Directors.
The Village, along with IMIC’s other members, have a contractual obligation to fund any
deficit of IMIC attributable to a membership year during which they were a member.
Supplemental contributions may be required to fund these deficits. The Village is not
aware of any additional amounts owed to IMIC for the 2014 claims year as of April 30,
2014.
Also, beginning January 1, 2011, the Village participates in the Illinois Public Risk Fund
(the Fund). The Fund is a self-funded workers’ compensation pool for public entities. The
purpose of the Fund is to provide for the defense and payment when due of all
compensation and other benefits under the Illinois Workers’ Compensation and
Occupational Diseases Laws on behalf of fire protection districts, public entities and
agencies and other units of state and local government within the State of Illinois. There
are approximately 500 members. A Board of Trustees oversees the operation of the Fund
and governs it in accordance with State of Illinois Regulations.
- 42 -

VILLAGE OF OSWEGO, ILLINOIS
NOTES TO FINANCIAL STATEMENTS (Continued)
- 42 -
9. RISK MANAGEMENT (Continued)
Members’ cost is proportional, based on contributions developed by payroll audits. Rates
and any discounts approved by the Board of Trustees are used to determine standard
premiums for each member. Each member’s experience modifications are used. Members
also participate in policyholder dividends based on the Fund’s and individual member’s
experience. Members can also be assessed if the assets of the Fund are less than the
reserves required to be maintained. The Village is not aware of any additional amounts due
to the Fund at April 30, 2014.
10. COMMITMENTS AND CONTINGENCIES
a. Economic Incentive
The Village has entered into economic development agreements with companies to
provide sales tax rebates. As of April 30, 2014, four agreements have been executed
for stores that have opened. The agreements require the Village to rebate to the
companies different amounts of additional sales tax generated by the facilities. For
the first agreement, a maximum of $1,000,000 is to be paid or until ten years elapses,
whichever occurs first. For the second agreement, repayments will occur until
$3,011,371 is repaid. The third agreement requires $3,789,640 to be repaid through
fiscal year 2027, whichever comes first. The fourth agreement requires a maximum
of $850,000 to be repaid with no time limit. The amount paid/accrued for the fiscal
year ended April 30, 2014 was $961,638. The total expenditures incurred to date
(reported as a reduction of sales tax revenue) in rebates as of April 30, 2014 was
$10,059,976.
b. Litigation
The Village is a defendant in various lawsuits. Although the outcome of these
lawsuits is not presently determinable, in the opinion of the Village’s attorney, the
resolution of these matters will not have a material adverse effect on the financial
condition of the Village.
c. Grants
Amounts received or receivable from grantor agencies are subject to audit and
adjustment by grantor agencies, principally the federal government. Any disallowed
claims, including amounts already collected, may constitute a liability of the
applicable funds. The amount, if any, of expenditures which may be disallowed by
the grantor cannot be determined at this time although the Village expects such
amounts, if any, to be immaterial.
- 43 -

VILLAGE OF OSWEGO, ILLINOIS
NOTES TO FINANCIAL STATEMENTS (Continued)
- 43 -
11. EMPLOYEE RETIREMENT SYSTEMS
The Village contributes to two defined benefit pension plans, the Illinois Municipal
Retirement Fund (IMRF), an agent multiple-employer public employee retirement system
and the Police Pension Plan which is a single-employer pension plan. The benefits, benefit
levels, employee contributions and employer contributions for plans are governed by
Illinois Compiled Statutes (ILCS) and can only be amended by the Illinois General
Assembly. Neither of the pension plans issue separate reports on the pension plans.
However, IMRF does issue a publicly available report that includes financial statements
and supplementary information for the plan as a whole, but not for individual employers.
That report can be obtained from IMRF, 2211 York Road, Suite 500, Oak Brook, Illinois
60523. a. Plan Descriptions Illinois Municipal Retirement Fund (IMRF) All employees (other than those covered by the Police Pension Plan) hired in
positions that meet or exceed the prescribed annual hourly standard must be enrolled in IMRF as participating members. IMRF provides two tiers of pension benefits. Employees hired prior to January 1, 2011, are eligible for Tier 1 benefits. For Tier 1 employees, pension benefits vest after eight years of service. Participating members who retire at age 55 (reduced benefits) or after age 60 (full benefits) with eight years of credited service are entitled to an annual retirement benefit, payable monthly for life, in an amount equal to 1 2/3% of their final rate of earnings, for each year of credited service up to 15 years, and 2% for each year thereafter.
Employees hired on or after January 1, 2011, are eligible for Tier 2 benefits. For Tier
2 employees, pension benefits vest after ten years of service. Participating members who retire at age 62 (reduced benefits) or after age 67 (full benefits) with ten years of credited service are entitled to an annual retirement benefit, payable monthly for life, in an amount equal to 1 2/3% of their final rate of earnings, for each year of credited service up to 15 years, and 2% for each year thereafter.
IMRF also provides death and disability benefits. These benefit provisions and all
other requirements are established by state statute. Participating members are required to contribute 4.5% of their annual salary to IMRF. The Village is required to contribute the remaining amounts necessary to fund IMRF as specified by statute. The employer contribution for the calendar years 2014 and 2013 was 11.41% and 11.63% of covered payroll, respectively.
- 44 -

VILLAGE OF OSWEGO, ILLINOIS
NOTES TO FINANCIAL STATEMENTS (Continued)
- 44 -
11. EMPLOYEE RETIREMENT SYSTEMS (Continued)
Police Pension Plan
Police sworn personnel are covered by the Police Pension Plan. Although this is a
single-employer pension plan, the defined benefits and employee and employer
contribution levels are governed by Illinois Compiled Statutes (40 ILCS 5/3-1) and
may be amended only by the Illinois legislature. The Village accounts for the plan as
a Pension Trust Fund. At April 30, 2014, the Police Pension Plan membership
consisted of:
Retirees and beneficiaries currently receiving benefits 8
Terminated employees entitled to benefits but not
yet receiving them 2
Current employees
Vested 35
Nonvested 14
TOTAL 59
The Police Pension Plan provides retirement benefits through two tiers of benefits as
well as death and disability benefits. Tier 1 employees (those hired prior to January 1,
2011) attaining the age of 50 or older with 20 or more years of creditable service are
entitled to receive an annual retirement benefit equal to one-half of the salary
attached to the rank held on the last day of service, or for one year prior to the last
day, whichever is greater. The annual benefit shall be increased by 2.5% of such
salary for each additional year of service over 20 years up to 30 years to a maximum
of 75% of such salary. Employees with at least eight years but less than 20 years of
credited service may retire at or after age 60 and receive a reduced benefit. The
monthly benefit of a police officer who retired with 20 or more years of service after
January 1, 1977 shall be increased annually, following the first anniversary date of
retirement and be paid upon reaching the age of at least 55 years, by 3% of the
original pension and 3% compounded annually thereafter.
Tier 2 employees (those hired on or after January 1, 2011) attaining the age of 55 or
older with ten or more years of creditable service are entitled to receive an annual
retirement benefit equal to the average monthly salary obtained by dividing the total
salary of the police officer during the 96 consecutive months of service within the
last 120 months of service in which the total salary was the highest by the number of
months of service in that period. Police officers’ salary for pension purposes is
capped at $106,800, plus the lesser of ½ of the annual change in the Consumer Price
Index or 3% compounded. The annual benefit shall be increased by 2.5% of such
salary for each additional year of service over 20 years up to 30 years to a maximum
of 75% of such salary. Employees with at least ten years may retire at or after age 50
- 45 -

VILLAGE OF OSWEGO, ILLINOIS
NOTES TO FINANCIAL STATEMENTS (Continued)
- 45 -
11. EMPLOYEE RETIREMENT SYSTEMS (Continued)
a. Plan Descriptions (Continued)
Police Pension Plan (Continued)
and receive a reduced benefit (i.e., ½% for each month under 55). The monthly
benefit of a Tier 2 police officer shall be increased annually at age 60 on the January
1st after the police officer retires, or the first anniversary of the pension starting date,
whichever is later. Noncompounding increases occur annually, each January
thereafter. The increase is the lesser of 3% or ½ of the change in the Consumer Price
Index for the proceeding calendar year.
Employees are required by ILCS to contribute 9.91% of their base salary to the
Police Pension Plan. If an employee leaves covered employment with less than 20
years of service, accumulated employee contributions may be refunded without
accumulated interest. Benefits and refunds are recognized when due and payable in
accordance with the terms of the Police Pension Plan. The costs of administering the
Police Pension Plan are financed through investment earnings. The Village is
required to contribute the remaining amounts necessary to finance the plan, including
the costs of administering the plan, as actuarially determined by an enrolled actuary.
Effective January 1, 2012, the Village has until the year 2040 to fully fund 90% of
the past service cost for the Police Pension Plan. For the year ended April 30, 2014,
the Village’s contribution was 25.78% of covered payroll.
b. Significant Investments
Significant investments are defined as investments in any one organization that
represent 5% or more of plan net position for the Police Pension Plan (other than
U.S. Government guaranteed obligations). At April 30, 2014, the Police Pension Plan
had one separate annuity contract and four mutual funds that were valued at 5.16%,
5.09%, 5.55%, 7.31% and 7.66% of the total plan net position. Information for IMRF
is not available.
c. Annual Pension Costs
The annual pension costs (APC) and the net pension obligation (asset) (NPO) as of
April 30, 2014 were derived from the actuarial valuations performed as of the dates
and using the assumptions noted below:
- 46 -
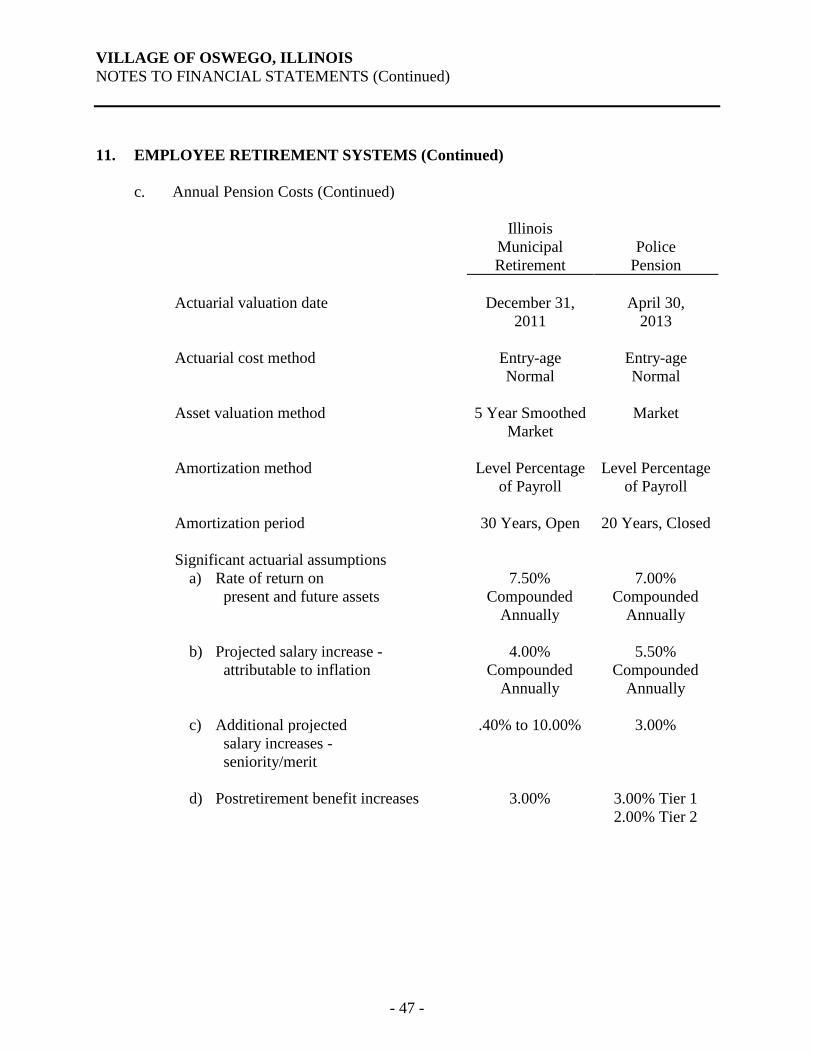
VILLAGE OF OSWEGO, ILLINOIS
NOTES TO FINANCIAL STATEMENTS (Continued)
- 46 -
11. EMPLOYEE RETIREMENT SYSTEMS (Continued)
c. Annual Pension Costs (Continued)
Illinois
Municipal
Retirement
Police
Pension
Actuarial valuation date December 31,
2011
April 30,
2013
Actuarial cost method Entry-age
Normal
Entry-age
Normal
Asset valuation method 5 Year Smoothed
Market
Market
Amortization method Level Percentage
of Payroll
Level Percentage
of Payroll
Amortization period 30 Years, Open 20 Years, Closed
Significant actuarial assumptions
a) Rate of return on 7.50% 7.00%
present and future assets Compounded Compounded
Annually Annually
b) Projected salary increase - 4.00% 5.50%
attributable to inflation Compounded Compounded
Annually Annually
c) Additional projected .40% to 10.00% 3.00%
salary increases -
seniority/merit
d) Postretirement benefit increases 3.00% 3.00% Tier 1
2.00% Tier 2
- 47 -

VILLAGE OF OSWEGO, ILLINOIS
NOTES TO FINANCIAL STATEMENTS (Continued)
- 47 -
11. EMPLOYEE RETIREMENT SYSTEMS (Continued)
c. Annual Pension Costs (Continued)
Employer annual pension cost (APC), actual contributions and the net pension
obligation (asset) (NPO) are as follows. The NPO (asset) is the cumulative difference
between the APC and the contributions actually made.
Fiscal
Year
Illinois
Municipal
Retirement
Police
Pension
Annual pension cost 2012 $ 329,892 $ 1,015,731
(APC) 2013 363,708 1,017,882
2014 393,783 1,064,255
Actual contribution 2012 $ 329,892 $ 1,015,000
2013 363,708 1,025,000
2014 393,783 1,075,000
Percentage of APC contributed 2012 100.00% 99.9%
2013 100.00% 100.7%
2014 100.00% 101.0%
NPO (asset) 2012 $ - $ 678,286
2013 - 671,168
2014 - 660,423
The NPO (asset) has been calculated as follows as of April 30, 2014:
Police
Pension
Annual required contribution $ 1,056,065
Interest on net pension obligation 46,982
Adjustment to annual required contribution (38,792)
Annual pension cost 1,064,255
Contributions made 1,075,000
Increase in net pension obligation (10,745)
Net pension obligation, May 1 671,168
NET PENSION OBLIGATION, APRIL 30 $ 660,423
- 48 -
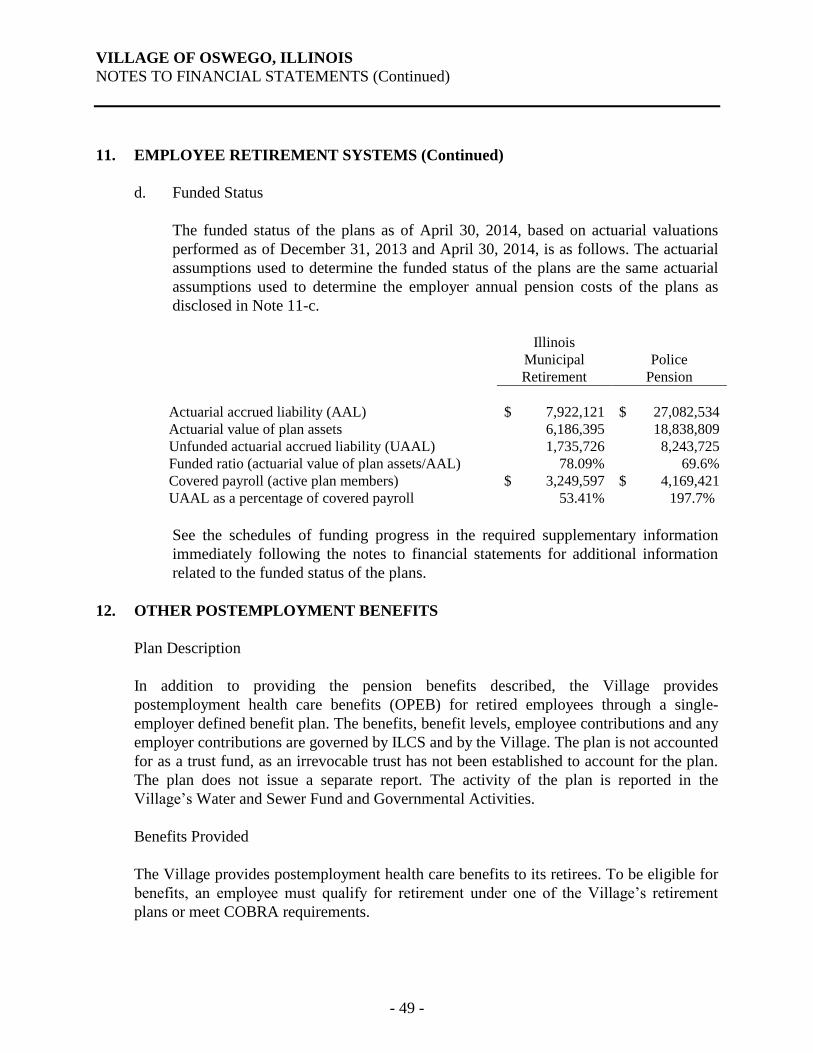
VILLAGE OF OSWEGO, ILLINOIS
NOTES TO FINANCIAL STATEMENTS (Continued)
- 48 -
11. EMPLOYEE RETIREMENT SYSTEMS (Continued)
d. Funded Status
The funded status of the plans as of April 30, 2014, based on actuarial valuations
performed as of December 31, 2013 and April 30, 2014, is as follows. The actuarial
assumptions used to determine the funded status of the plans are the same actuarial
assumptions used to determine the employer annual pension costs of the plans as
disclosed in Note 11-c.
Illinois
Municipal
Retirement
Police
Pension
Actuarial accrued liability (AAL) $ 7,922,121 $ 27,082,534
Actuarial value of plan assets 6,186,395 18,838,809
Unfunded actuarial accrued liability (UAAL) 1,735,726 8,243,725
Funded ratio (actuarial value of plan assets/AAL) 78.09% 69.6%
Covered payroll (active plan members) $ 3,249,597 $ 4,169,421
UAAL as a percentage of covered payroll 53.41% 197.7%
See the schedules of funding progress in the required supplementary information
immediately following the notes to financial statements for additional information
related to the funded status of the plans.
12. OTHER POSTEMPLOYMENT BENEFITS
Plan Description
In addition to providing the pension benefits described, the Village provides
postemployment health care benefits (OPEB) for retired employees through a single-
employer defined benefit plan. The benefits, benefit levels, employee contributions and any
employer contributions are governed by ILCS and by the Village. The plan is not accounted
for as a trust fund, as an irrevocable trust has not been established to account for the plan.
The plan does not issue a separate report. The activity of the plan is reported in the
Village’s Water and Sewer Fund and Governmental Activities.
Benefits Provided
The Village provides postemployment health care benefits to its retirees. To be eligible for
benefits, an employee must qualify for retirement under one of the Village’s retirement
plans or meet COBRA requirements.
- 49 -

VILLAGE OF OSWEGO, ILLINOIS
NOTES TO FINANCIAL STATEMENTS (Continued)
- 49 -
12. OTHER POSTEMPLOYMENT BENEFITS (Continued)
Benefits Provided (Continued)
All health care benefits are provided through the Village’s third party indemnity health
plan. The benefit levels are the same as those afforded to active employees. Benefits
include general inpatient and outpatient medical services; mental, nervous and substance
abuse care; vision care; dental care; and prescriptions. Eligibility in village sponsored
health care plans may be continued at a separate premium upon eligibility for federally
sponsored health care benefits.
Membership
At April 30, 2014, membership consisted of:
Retirees and beneficiaries currently receiving benefits 6
Terminated employees entitled to benefits but
not yet receiving them -
Active plan members - vested 77
Active plan members - nonvested 43
TOTAL 126
Participating employers 1
Funding Policy
The Village provides the contribution percentages between the Village and employees
through the union contracts and personnel policy. All retirees contribute 100% of the
premium to the plan to cover the cost of providing the benefits to the retirees via the plan
(pay as you go) which results in an implicit subsidy to the Village as defined by the GASB
Statement No. 45. For the fiscal year ended April 30, 2014, the Village contributed
$22,684. The Village is not required to and currently does not advance fund the cost of
benefits that will become due and payable in the future. Active employees do not
contribute to the plan until retirement.
- 50 -

VILLAGE OF OSWEGO, ILLINOIS
NOTES TO FINANCIAL STATEMENTS (Continued)
- 50 -
12. OTHER POSTEMPLOYMENT BENEFITS (Continued)
Annual OPEB Costs and Net OPEB Obligation
The Village’s annual OPEB cost, the percentage of annual OPEB cost contributed to the
plan and the net OPEB obligation for the last three years was as follows:
Fiscal
Year
Ended
Annual
OPEB
Cost
Employer
Contributions
Percentage of
Annual OPEB
Cost Contributed
Net OPEB
Obligation
April 30, 2012 $ 32,679 $ 18,197 55.7% $ 42,830
April 30, 2013 32,492 18,197 56.0% 57,125
April 30, 2014 48,894 22,684 46.4% 83,335
The net OPEB obligation (NOPEBO) as of April 30, 2014 was calculated as follows:
Annual required contribution $ 48,513
Interest on net OPEB obligation 2,285
Adjustment to annual required contribution (1,904)
Annual OPEB cost 48,894
Contributions made 22,684
Increase in net OPEB obligation 26,210
Net OPEB obligation, beginning of year 57,125
NET OPEB OBLIGATION, END OF YEAR $ 83,335
Funded Status and Funding Progress. The funded status of the plan as of April 30, 2013
was as follows:
Actuarial accrued liability (AAL) $ 538,394
Actuarial value of plan assets -
Unfunded actuarial accrued liability (UAAL) 538,394
Funded ratio (actuarial value of plan assets/AAL) 0.0%
Covered payroll (active plan members) $ 7,999,757
UAAL as a percentage of covered payroll 6.7%
- 51 -

VILLAGE OF OSWEGO, ILLINOIS
NOTES TO FINANCIAL STATEMENTS (Continued)
- 51 -
12. OTHER POSTEMPLOYMENT BENEFITS (Continued)
Annual OPEB Costs and Net OPEB Obligation (Continued)
Actuarial valuations of an ongoing plan involve estimates of the value of reported amounts
and assumptions about the probability of occurrence of events far into the future. Examples
include assumptions about future employment, mortality and the healthcare cost trend.
Amounts determined regarding the funded status of the plan and the annual required
contributions of the employer are subject to continual revision as actual results are
compared with past expectations and new estimates are made about the future. The
schedule of funding progress, presented as required supplementary information following
the notes to financial statements, presents multi-year trend information that shows whether
the actuarial value of plan assets is increasing or decreasing over time relative to the
actuarial accrued liabilities for benefits.
Actuarial Methods and Assumptions. Projections of benefits for financial reporting
purposes are based on the substantive plan (the plan as understood by the employer and
plan members) and include the types of benefits provided at the time of each valuation and
the historical pattern of sharing of benefit costs between the employer and plan members to
that point. The actuarial methods and assumptions used include techniques that are
designed to reduce short-term volatility in actuarial accrued liabilities and the actuarial
value of assets, consistent with the long-term perspective of the calculations.
In the April 30, 2014 actuarial valuation, the entry-age actuarial cost method was used. The
actuarial assumptions included a 5% investment rate of return (net of administrative
expenses), 5% salary increase and an initial annual healthcare cost trend rate of 8% with an
ultimate rate of 6%, which include a 3% inflation assumption. The actuarial value of assets
was not determined as the Village has not advance funded its obligation. The plan’s
unfunded actuarial accrued liability is being amortized as a level percentage of projected
payroll on an open basis. The remaining amortization period at April 30, 2010 was 30
years.
13. PRIOR PERIOD ADJUSTMENT
The Village increased the net position of governmental activities and the fund balance of
the General Fund as of May 1, 2013 by $162,178 to correctly record the IPBC terminal
reserve receivable.
- 52 -

REQUIRED SUPPLEMENTARY INFORMATION

Original Final 2013
Budget Budget Actual Actual
REVENUES
Taxes 9,363,400$ 9,363,400$ 9,476,192$ 9,038,711$
Licenses and permits 734,675 734,675 1,048,980 917,933
Intergovernmental 2,977,310 2,977,310 3,042,565 2,950,340
Charges for services 1,300,200 1,300,200 1,380,156 1,353,105
Fines and forfeits 366,560 366,560 354,098 365,675
Investment income 24,000 24,000 12,033 21,903
Miscellaneous 610,700 610,700 757,240 627,078
Total revenues 15,376,845 15,376,845 16,071,264 15,274,745
EXPENDITURES
Current
General government 2,405,364 2,405,364 2,159,883 1,949,298
Building and zoning 662,329 662,329 637,964 616,216
Community development 774,941 774,941 698,354 489,809
Public works 1,354,147 1,354,147 1,829,494 1,462,158
Public safety 8,645,057 8,645,057 8,466,515 7,913,809
Total expenditures 13,841,838 13,841,838 13,792,210 12,431,290
EXCESS (DEFICIENCY) OF REVENUES
OVER EXPENDITURES 1,535,007 1,535,007 2,279,054 2,843,455
OTHER FINANCING SOURCES (USES)
Transfers in - - - 72,691
Transfers (out) (1,535,007) (1,535,007) (1,516,563) (3,187,103)
Proceeds from the sale of capital assets - - 16,124 25,757
Total other financing sources (uses) (1,535,007) (1,535,007) (1,500,439) (3,088,655)
NET CHANGE IN FUND BALANCE -$ -$ 778,615 (245,200)
FUND BALANCE, MAY 1 5,756,282 6,001,482
Prior period adjustment 162,178 -
FUND BALANCE, MAY 1, RESTATED 5,918,460 6,001,482
FUND BALANCE, APRIL 30 6,697,075$ 5,756,282$
VILLAGE OF OSWEGO, ILLINOIS
SCHEDULE OF REVENUES, EXPENDITURES
AND CHANGES IN FUND BALANCE - BUDGET AND ACTUAL
GENERAL FUND
For the Year Ended April 30, 2014
2014
(with comparative actual)
(See independent auditor's report.)- 53 -

(2) UAAL
Actuarial (4) as a
Actuarial (1) Accrued (3) Unfunded Percentage
Valuation Actuarial Liability Funded AAL (5) of Covered
Date Value of (AAL) Ratio (UAAL) Covered Payroll
December 31, Assets Entry-Age (1) / (2) (2) - (1) Payroll (4) / (5)
2008 4,039,923$ 5,094,827$ 79.29% 1,054,904$ 3,551,455$ 29.70%
2009 4,398,752 5,902,682 74.52% 1,503,930 3,545,482 42.42%
2010 4,940,793 6,624,843 74.58% 1,684,050 3,256,272 51.72%
2011 5,117,962 6,749,795 75.82% 1,631,833 3,064,080 53.26%
2012 5,867,921 7,557,407 77.64% 1,689,486 3,125,615 54.05%
2013 6,186,395 7,922,121 78.09% 1,735,726 3,249,597 53.41%
April 30, 2014
VILLAGE OF OSWEGO, ILLINOIS
SCHEDULE OF FUNDING PROGRESS
ILLINOIS MUNICIPAL RETIREMENT FUND
(See independent auditor's report.)- 54 -

(2) UAAL
Actuarial (4) as a
Actuarial (1) Accrued (3) Unfunded Percentage
Valuation Actuarial Liability Funded AAL (5) of Covered
Date Value of (AAL) Ratio (UAAL) Covered Payroll
April 30, Assets Entry-Age (1) / (2) (2) - (1) Payroll (4) / (5)
2009 7,990,525$ 15,480,858$ 51.62% 7,490,333$ 3,678,626$ 203.62%
2010 10,528,232 17,828,835 59.05% 7,300,603 3,717,257 196.40%
2011 13,027,639 20,096,454 64.83% 7,068,815 3,815,936 185.24%
2012 14,638,061 22,066,568 66.34% 7,428,507 3,962,251 187.48%
2013 16,790,359 24,793,566 67.72% 8,003,207 4,062,393 197.01%
2014 18,838,809 27,082,534 69.56% 8,243,725 4,169,421 197.72%
April 30, 2014
VILLAGE OF OSWEGO, ILLINOIS
SCHEDULE OF FUNDING PROGRESS
POLICE PENSION FUND
(See independent auditor's report.)- 55 -
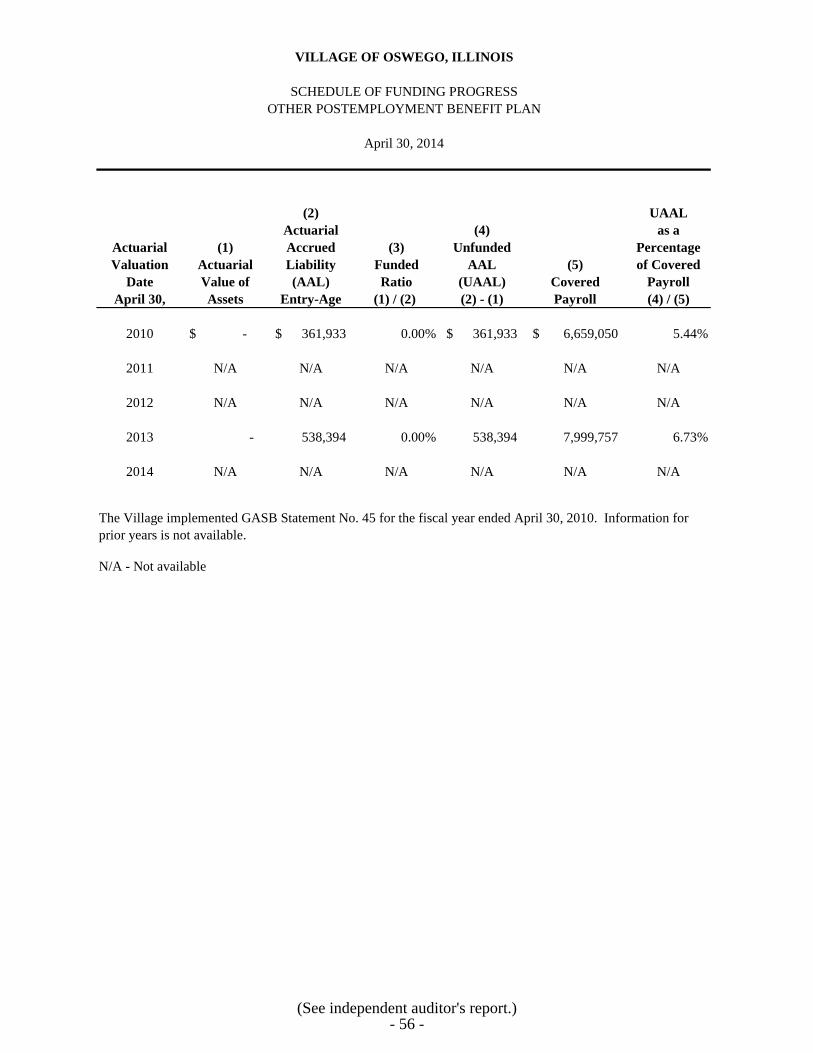
(2) UAAL
Actuarial (4) as a
Actuarial (1) Accrued (3) Unfunded Percentage
Valuation Actuarial Liability Funded AAL (5) of Covered
Date Value of (AAL) Ratio (UAAL) Covered Payroll
April 30, Assets Entry-Age (1) / (2) (2) - (1) Payroll (4) / (5)
2010 -$ 361,933$ 0.00% 361,933$ 6,659,050$ 5.44%
2011 N/A N/A N/A N/A N/A N/A
2012 N/A N/A N/A N/A N/A N/A
2013 - 538,394 0.00% 538,394 7,999,757 6.73%
2014 N/A N/A N/A N/A N/A N/A
The Village implemented GASB Statement No. 45 for the fiscal year ended April 30, 2010. Information for
prior years is not available.
VILLAGE OF OSWEGO, ILLINOIS
SCHEDULE OF FUNDING PROGRESS
OTHER POSTEMPLOYMENT BENEFIT PLAN
April 30, 2014
N/A - Not available
(See independent auditor's report.)- 56 -
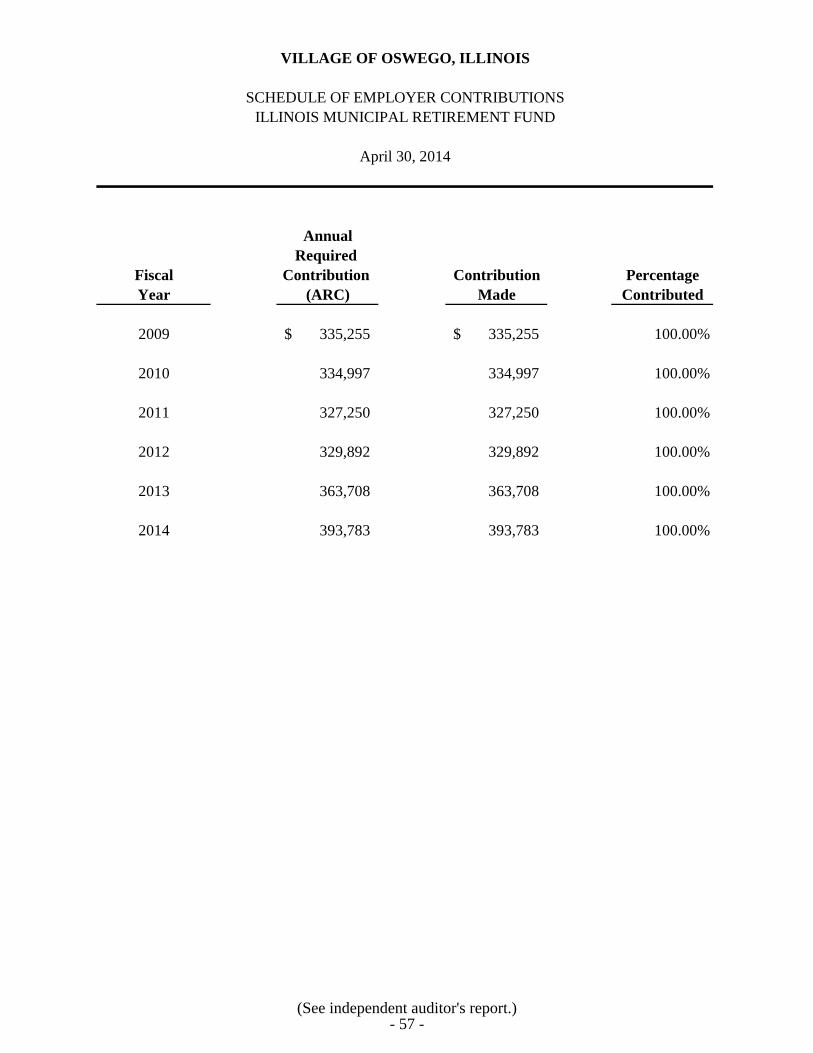
Annual
Required
Fiscal Contribution Contribution Percentage
Year (ARC) Made Contributed
2009 335,255$ 335,255$ 100.00%
2010 334,997 334,997 100.00%
2011 327,250 327,250 100.00%
2012 329,892 329,892 100.00%
2013 363,708 363,708 100.00%
2014 393,783 393,783 100.00%
April 30, 2014
VILLAGE OF OSWEGO, ILLINOIS
SCHEDULE OF EMPLOYER CONTRIBUTIONS
ILLINOIS MUNICIPAL RETIREMENT FUND
(See independent auditor's report.)- 57 -

Annual
Required Net
Fiscal Contribution Contribution Percentage Pension
Year (ARC) Made Contributed Obligation
2009 752,163$ 752,748$ 100.08% 651,726$
2010 890,070 890,070 100.00% 665,105
2011 990,649 990,650 100.00% 677,555
2012 1,003,047 1,015,000 101.19% 678,286
2013 1,007,990 1,025,000 101.69% 671,168
2014 1,056,065 1,075,000 101.79% 660,423
April 30, 2014
VILLAGE OF OSWEGO, ILLINOIS
SCHEDULE OF EMPLOYER CONTRIBUTIONS
POLICE PENSION FUND
(See independent auditor's report.)- 58 -
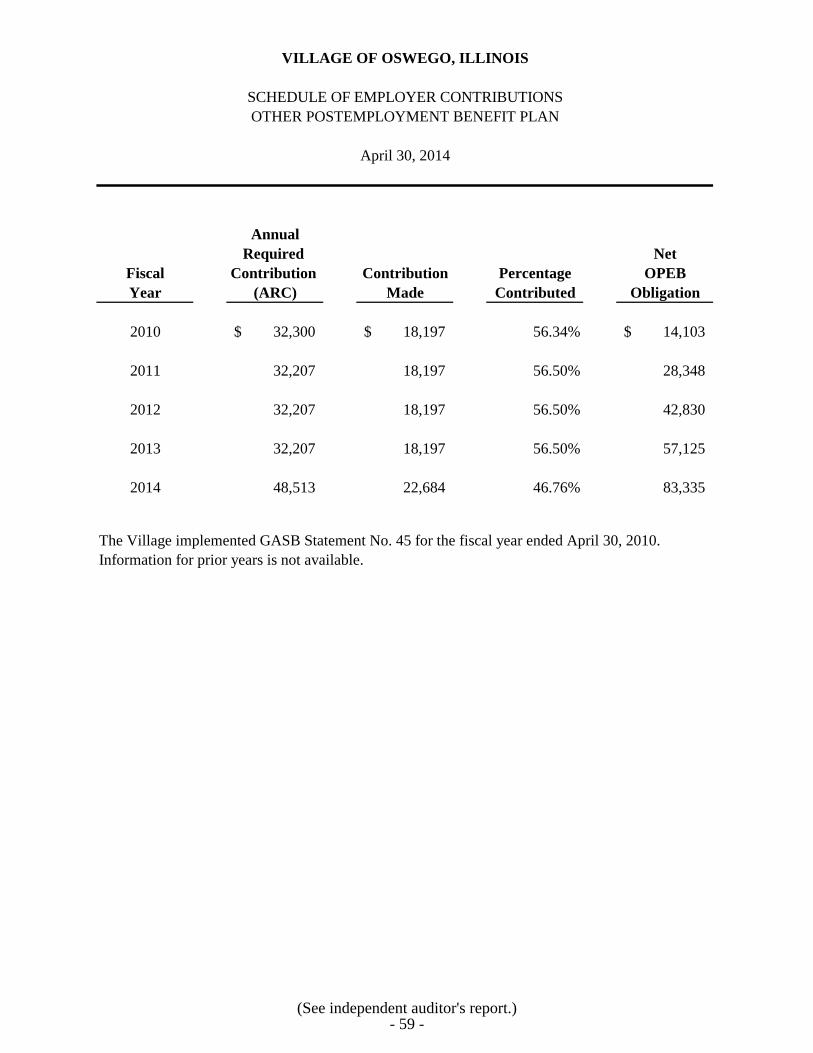
Annual
Required Net
Fiscal Contribution Contribution Percentage OPEB
Year (ARC) Made Contributed Obligation
2010 32,300$ 18,197$ 56.34% 14,103$
2011 32,207 18,197 56.50% 28,348
2012 32,207 18,197 56.50% 42,830
2013 32,207 18,197 56.50% 57,125
2014 48,513 22,684 46.76% 83,335
VILLAGE OF OSWEGO, ILLINOIS
SCHEDULE OF EMPLOYER CONTRIBUTIONS
OTHER POSTEMPLOYMENT BENEFIT PLAN
April 30, 2014
The Village implemented GASB Statement No. 45 for the fiscal year ended April 30, 2010.
Information for prior years is not available.
(See independent auditor's report.)- 59 -

- 55 -
VILLAGE OF OSWEGO, ILLINOIS
NOTES TO REQUIRED SUPPLEMENTARY INFORMATION
April 30, 2014
BUDGETS
Annual budgets are adopted on a basis consistent with generally accepted accounting principles
for all governmental and proprietary funds (except for the Public Works Escrow, Economic
Development and Public Service Funds). All annual appropriations lapse at fiscal year end.
All departments submit requests for appropriation to the Budget Officer who compiles all the
data and prepares a budget. The budget is prepared by fund, function and activity and includes
information on the past year, current year estimates and requested appropriations for the
subsequent year.
The proposed budget is presented to the Village Board for review. The Village Board holds
public hearings on the proposed budget and may add to, subtract or change requested
appropriations. The Village Treasurer is authorized to transfer budget amounts between functions
and activities. However, transfers between funds and increases to total fund expenditures must be
approved by the Village Board. The legal level of budgetary control (level at which expenditures
may not exceed appropriations) is at the fund level.
Budget amendments were adopted during the fiscal year and are included in these financial
statements.
- 60 -

COMBINING AND INDIVIDUAL FUND
FINANCIAL STATEMENTS AND SCHEDULES

MAJOR GOVERNMENTAL FUNDS
GENERAL FUND
General Fund - the general operating fund of the Village and is used to account for all financial
resources of the Village unless accounted for in another fund.
DEBT SERVICE FUND
Debt Service Fund - the debt service fund is used to account for the repayment of the Series
2006A, 2007B and a portion of the 2009, 2011 and 2013 general obligation bonds that are being
repaid with property and sales taxes.

2014 2013
Cash and investments 4,511,803$ 3,575,340$
Receivables
Property taxes 1,216,099 1,216,083
Accounts 246,951 209,394
Intergovernmental 2,663,843 2,626,264
Utility tax 97,934 81,858
Insurance 184,429 -
Prepaid items 158,983 128,249
Due from fiduciary funds 1,297 2,695
TOTAL ASSETS 9,081,339$ 7,839,883$
LIABILITIES
Accounts payable 780,941$ 630,662$
Accrued payroll 355,271 229,985
Due to fiduciary funds 10,580 1,887
Unearned revenue 21,373 4,984
Total liabilities 1,168,165 867,518
DEFERRED INFLOWS OF RESOURCES
Unavailable revenue - property taxes 1,216,099 1,216,083
Total deferred inflows of resources 1,216,099 1,216,083
Total liabilities and deferred inflows of resources 2,384,264 2,083,601
FUND BALANCE
Nonspendable - prepaid items 158,983 128,249
Unrestricted
Assigned - Fiscal Sustainability 5,358,071 5,021,748
Unassigned 1,180,021 606,285
Total fund balance 6,697,075 5,756,282
TOTAL LIABILITIES AND
FUND BALANCE 9,081,339$ 7,839,883$
RESOURCES AND FUND BALANCE
VILLAGE OF OSWEGO, ILLINOIS
BALANCE SHEET
GENERAL FUND
April 30, 2014
ASSETS
LIABILITIES, DEFERRED INFLOWS OF
(with comparative prior year)
(See independent auditor's report.)- 61 -
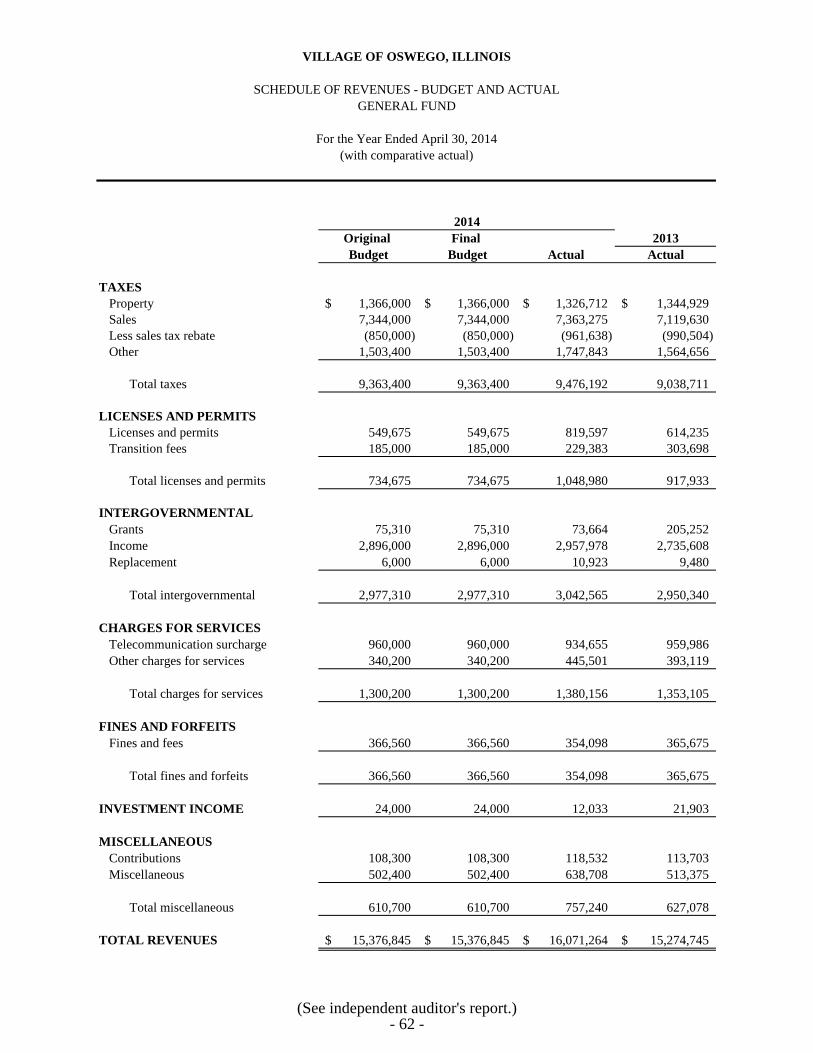
Original Final 2013
Budget Budget Actual Actual
TAXES
Property 1,366,000$ 1,366,000$ 1,326,712$ 1,344,929$
Sales 7,344,000 7,344,000 7,363,275 7,119,630
Less sales tax rebate (850,000) (850,000) (961,638) (990,504)
Other 1,503,400 1,503,400 1,747,843 1,564,656
Total taxes 9,363,400 9,363,400 9,476,192 9,038,711
LICENSES AND PERMITS
Licenses and permits 549,675 549,675 819,597 614,235
Transition fees 185,000 185,000 229,383 303,698
Total licenses and permits 734,675 734,675 1,048,980 917,933
INTERGOVERNMENTAL
Grants 75,310 75,310 73,664 205,252
Income 2,896,000 2,896,000 2,957,978 2,735,608
Replacement 6,000 6,000 10,923 9,480
Total intergovernmental 2,977,310 2,977,310 3,042,565 2,950,340
CHARGES FOR SERVICES
Telecommunication surcharge 960,000 960,000 934,655 959,986
Other charges for services 340,200 340,200 445,501 393,119
Total charges for services 1,300,200 1,300,200 1,380,156 1,353,105
FINES AND FORFEITS
Fines and fees 366,560 366,560 354,098 365,675
Total fines and forfeits 366,560 366,560 354,098 365,675
INVESTMENT INCOME 24,000 24,000 12,033 21,903
MISCELLANEOUS
Contributions 108,300 108,300 118,532 113,703
Miscellaneous 502,400 502,400 638,708 513,375
Total miscellaneous 610,700 610,700 757,240 627,078
TOTAL REVENUES 15,376,845$ 15,376,845$ 16,071,264$ 15,274,745$
(with comparative actual)
2014
VILLAGE OF OSWEGO, ILLINOIS
SCHEDULE OF REVENUES - BUDGET AND ACTUAL
GENERAL FUND
For the Year Ended April 30, 2014
(See independent auditor's report.)- 62 -

Original Final 2013
Budget Budget Actual Actual
CURRENT
General government
Administration
Salaries/personnel services 497,856$ 497,856$ 487,864$ 443,685$
Insurance and benefits 178,408 178,408 159,799 147,537
Professional services 449,935 449,935 409,022 400,786
Contractual services 103,000 103,000 69,733 94,198
Communication 20,820 20,820 16,970 13,515
Professional development 32,645 32,645 27,321 17,958
Operating supplies 3,650 3,650 95,278 3,667
Reserve for contingency 145,046 145,046 - -
Total administration 1,431,360 1,431,360 1,265,987 1,121,346
Community relations
Salaries/personnel services 107,138 107,138 108,666 105,170
Insurance and benefits 35,425 35,425 35,578 28,986
Professional services 58,500 58,500 58,276 64,699
Contractual services 32,168 32,168 25,995 22,688
Communication 35,500 35,500 30,212 31,980
Professional development 2,500 2,500 759 1,499
Operating supplies 2,280 2,280 596 1,461
Total community relations 273,511 273,511 260,082 256,483
Finance
Salaries/personnel services 294,927 294,927 297,568 280,643
Insurance and benefits 104,990 104,990 105,027 98,676
Professional services 235,300 235,300 174,395 134,482
Contractual services 51,276 51,276 45,354 47,843
Communication 4,000 4,000 3,943 3,807
Professional development 7,700 7,700 6,071 3,951
Operating supplies 2,300 2,300 1,456 2,067
Total finance 700,493 700,493 633,814 571,469
Total general government 2,405,364 2,405,364 2,159,883 1,949,298
(with comparative actual)
VILLAGE OF OSWEGO, ILLINOIS
SCHEDULE OF DETAILED EXPENDITURES - BUDGET AND ACTUAL
GENERAL FUND
For the Year Ended April 30, 2014
2014
(This schedule is continued on the following pages.)- 63 -

Original Final 2013
Budget Budget Actual Actual
CURRENT (Continued)
Building and zoning
Salaries/personnel services 415,161$ 415,161$ 413,952$ 406,214$
Insurance and benefits 172,730 172,730 172,356 165,187
Professional services 4,000 4,000 5,240 3,376
Contractual services 23,438 23,438 25,486 18,422
Communication 7,400 7,400 9,041 7,726
Professional development 5,500 5,500 2,901 2,950
Operating supplies 9,100 9,100 8,988 12,341
Capital outlay 25,000 25,000 - -
Total building and zoning 662,329 662,329 637,964 616,216
Community development
Community development
Salaries and personnel services 326,667 326,667 324,370 250,702
Insurance and benefits 120,141 120,141 117,169 92,229
Professional services 61,600 61,600 22,403 9,854
Contractual services 13,075 13,075 15,871 12,271
Communication 8,742 8,742 6,655 4,955
Professional development 4,100 4,100 2,009 4,651
Operating supplies 9,605 9,605 10,713 3,715
Capital outlay 40,000 40,000 31,966 4,000
Total community development 583,930 583,930 531,156 382,377
Economic development
Salaries and personnel services 94,744 94,744 96,350 67,480
Insurance and benefits 42,094 42,094 29,233 27,620
Professional services 7,000 7,000 11,765 2,340
Contractual services 3,123 3,123 3,512 2,917
Communication 8,000 8,000 2,914 3,777
Professional development 5,700 5,700 5,252 2,337
Operating supplies 350 350 684 961
Capital outlay 30,000 30,000 17,488 -
Total economic development 191,011 191,011 167,198 107,432
Total community development 774,941 774,941 698,354 489,809
GENERAL FUND
For the Year Ended April 30, 2014
2014
(with comparative actual)
VILLAGE OF OSWEGO, ILLINOIS
SCHEDULE OF DETAILED EXPENDITURES - BUDGET AND ACTUAL (Continued)
(This schedule is continued on the following page.)- 64 -

Original Final 2013
Budget Budget Actual Actual
GENERAL FUND
For the Year Ended April 30, 2014
2014
(with comparative actual)
VILLAGE OF OSWEGO, ILLINOIS
SCHEDULE OF DETAILED EXPENDITURES - BUDGET AND ACTUAL (Continued)
CURRENT (Continued)
Public works
Salaries/personnel services 334,412$ 334,412$ 374,817$ 343,366$
Insurance and benefits 142,023 142,023 143,155 137,592
Professional services 20,000 20,000 58,600 9,562
Contractual services 588,192 588,192 913,198 717,791
Communication 6,800 6,800 3,953 4,235
Professional development 4,500 4,500 3,920 2,943
Operating supplies 150,420 150,420 210,505 103,022
Capital outlay 107,800 107,800 121,346 143,647
Total public works 1,354,147 1,354,147 1,829,494 1,462,158
Public safety - police
Salaries/personnel services 4,925,912 4,925,912 4,830,707 4,710,062
Insurance and benefits 1,404,273 1,404,273 1,363,144 1,276,742
Professional services 47,862 47,862 41,207 44,016
Contractual services 463,303 463,303 490,567 424,993
Communication 60,887 60,887 52,738 54,624
Professional development 52,065 52,065 41,450 46,823
Operating supplies 173,995 173,995 151,578 149,163
Capital outlay 441,760 441,760 420,124 182,386
Contribution to Police Pension Fund 1,075,000 1,075,000 1,075,000 1,025,000
Total public safety - police 8,645,057 8,645,057 8,466,515 7,913,809
TOTAL EXPENDITURES 13,841,838$ 13,841,838$ 13,792,210$ 12,431,290$
(See independent auditor's report.)- 65 -

2014 2013
Cash and investments 24,833$ 21,237$
TOTAL ASSETS 24,833$ 21,237$
LIABILITIES
None -$ -$
Total liabilities - -
FUND BALANCE
Restricted for debt service 24,833 21,237
Total fund balance 24,833 21,237
TOTAL LIABILITIES AND
FUND BALANCE 24,833$ 21,237$
LIABILITIES AND FUND BALANCES
VILLAGE OF OSWEGO, ILLINOIS
BALANCE SHEET
DEBT SERVICE FUND
April 30, 2014
(with comparative prior year)
ASSETS
(See independent auditor's report.)- 66 -

Original Final 2013
Budget Budget Actual Actual
REVENUES
Investment income 100$ 100$ 347$ 91$
Miscellaneous - 3,600 3,600 -
Total revenues 100 3,700 3,947 91
EXPENDITURES
Debt service
Principal retirement 1,145,000 1,145,000 1,145,000 1,130,000
Interest and fiscal charges 652,507 773,007 621,442 693,047
Total expenditures 1,797,507 1,918,007 1,766,442 1,823,047
EXCESS (DEFICIENCY) OF REVENUES
OVER EXPENDITURES (1,797,407) (1,914,307) (1,762,495) (1,822,956)
OTHER FINANCING SOURCES (USES)
Transfers in 1,797,507 1,797,507 1,779,063 1,828,603
Bonds issued, at par - 6,770,000 6,770,000 -
Premium on bonds issued - 387,715 387,715 -
Payment to escrow agent - (7,170,687) (7,170,687) -
Total other financing sources (uses) 1,797,507 1,784,535 1,766,091 1,828,603
NET CHANGE IN FUND BALANCE 100$ (129,772)$ 3,596 5,647
FUND BALANCE, MAY 1 21,237 15,590
FUND BALANCE, APRIL 30 24,833$ 21,237$
2014
VILLAGE OF OSWEGO, ILLINOIS
SCHEDULE OF REVENUES, EXPENDITURES AND
CHANGES IN FUND BALANCE - BUDGET AND ACTUAL
DEBT SERVICE FUND
For the Year Ended April 30, 2014
(with comparative actual)
(See independent auditor's report.)- 67 -

NONMAJOR GOVERNMENTAL FUNDS
SPECIAL REVENUE FUNDS
Motor Fuel Tax Fund - to account for State Gasoline Tax Allocations restricted for local roadway
program expenditures.
Public Works Escrow Fund - to account for monies collected from developers and others for
specific road and other capital improvements.
Economic Development Fund - to account for income generated from low interest economic
development loans offered to local businesses.
Public Service Fund - to account for donations and contributions collected for various public
projects and special events.
CAPITAL PROJECTS FUND
Capital Projects Fund - to account for the acquisition of capital assets or construction of major
capital projects not being financed by proprietary funds.

Motor Public
Fuel Works Economic Public Capital
Tax Escrow Development Service Projects Total
ASSETS
Cash and investments 1,180,509$ 1,542,491$ 211,402$ 384,595$ 693,793$ 4,012,790$
Receivables
Accounts - - - 362 - 362
Intergovernmental 55,961 - - - - 55,961
Notes - - 210,498 - - 210,498
Prepaid items - - - 16,181 - 16,181
TOTAL ASSETS 1,236,470$ 1,542,491$ 421,900$ 401,138$ 693,793$ 4,295,792$
FUND BALANCES
LIABILITIES
Accounts payable 34,671$ -$ -$ 596$ 9,077$ 44,344$
Retainage payable - - - - 24,295 24,295
Escrow deposits - 524,545 - 6,884 - 531,429
Total liabilities 34,671 524,545 - 7,480 33,372 600,068
FUND BALANCES
Nonspendable
Notes - - 210,498 - - 210,498
Prepaid items - - - 16,181 - 16,181
Restricted
Highways and streets 1,201,799 - - - 76,420 1,278,219
Special projects - 1,017,946 - 377,477 - 1,395,423
Economic development - - 211,402 - - 211,402
Unrestricted - assigned
Capital projects - - - - 584,001 584,001
Total fund balances 1,201,799 1,017,946 421,900 393,658 660,421 3,695,724
TOTAL LIABILITIES AND
FUND BALANCES 1,236,470$ 1,542,491$ 421,900$ 401,138$ 693,793$ 4,295,792$
LIABILITIES AND
Special Revenue
VILLAGE OF OSWEGO, ILLINOIS
COMBINING BALANCE SHEET
NONMAJOR GOVERNMENTAL FUNDS
April 30, 2014
(See independent auditor's report.)- 68 -
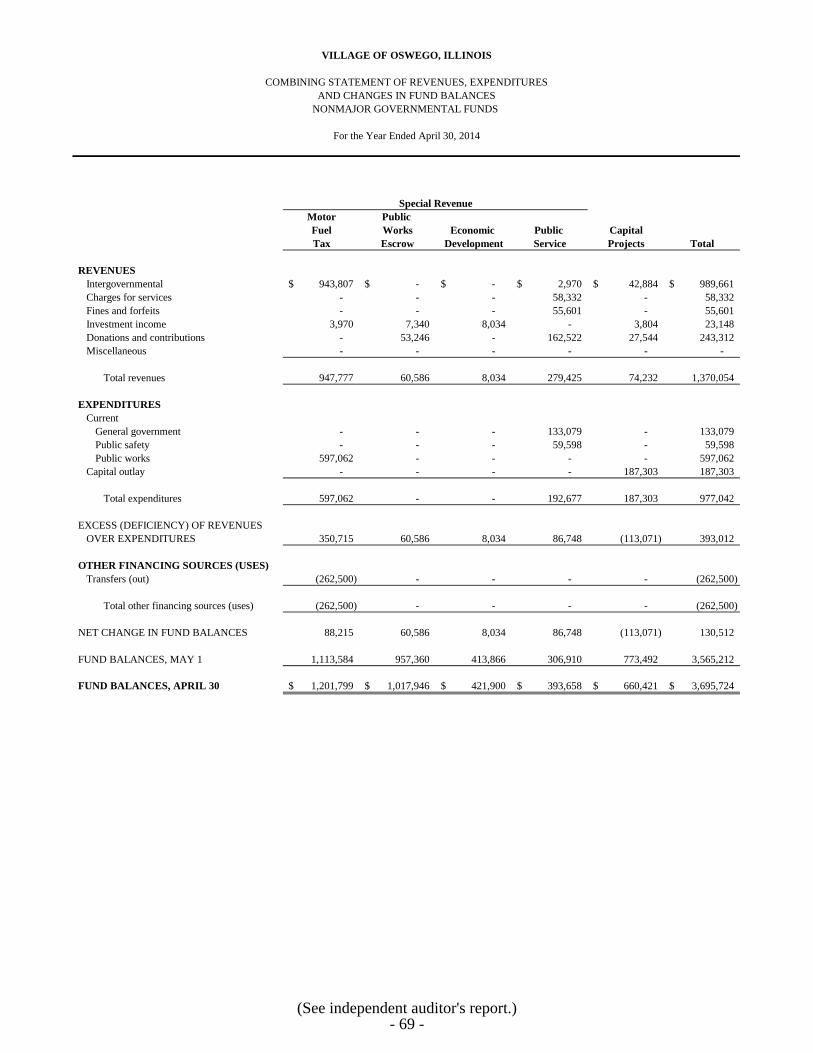
Motor Public
Fuel Works Economic Public Capital
Tax Escrow Development Service Projects Total
REVENUES
Intergovernmental 943,807$ -$ -$ 2,970$ 42,884$ 989,661$
Charges for services - - - 58,332 - 58,332
Fines and forfeits - - - 55,601 - 55,601
Investment income 3,970 7,340 8,034 - 3,804 23,148
Donations and contributions - 53,246 - 162,522 27,544 243,312
Miscellaneous - - - - - -
Total revenues 947,777 60,586 8,034 279,425 74,232 1,370,054
EXPENDITURES
Current
General government - - - 133,079 - 133,079
Public safety - - - 59,598 - 59,598
Public works 597,062 - - - - 597,062
Capital outlay - - - - 187,303 187,303
Total expenditures 597,062 - - 192,677 187,303 977,042
EXCESS (DEFICIENCY) OF REVENUES
OVER EXPENDITURES 350,715 60,586 8,034 86,748 (113,071) 393,012
OTHER FINANCING SOURCES (USES)
Transfers (out) (262,500) - - - - (262,500)
Total other financing sources (uses) (262,500) - - - - (262,500)
NET CHANGE IN FUND BALANCES 88,215 60,586 8,034 86,748 (113,071) 130,512
FUND BALANCES, MAY 1 1,113,584 957,360 413,866 306,910 773,492 3,565,212
FUND BALANCES, APRIL 30 1,201,799$ 1,017,946$ 421,900$ 393,658$ 660,421$ 3,695,724$
For the Year Ended April 30, 2014
Special Revenue
VILLAGE OF OSWEGO, ILLINOIS
COMBINING STATEMENT OF REVENUES, EXPENDITURES
AND CHANGES IN FUND BALANCES
NONMAJOR GOVERNMENTAL FUNDS
(See independent auditor's report.)- 69 -

Original Final 2013
Budget Budget Actual Actual
REVENUES
Intergovernmental
Motor fuel tax 775,000$ 775,000$ 943,807$ 912,260$
Reimbursements - - - 243,127
Investment income 5,000 5,000 3,970 4,920
Total revenues 780,000 780,000 947,777 1,160,307
EXPENDITURES
Current
Public works/transportation 600,000 600,000 597,062 512,422
Total expenditures 600,000 600,000 597,062 512,422
EXCESS (DEFICIENCY) OF REVENUES
OVER EXPENDITURES 180,000 180,000 350,715 647,885
OTHER FINANCING SOURCES (USES)
Transfers (out) (262,500) (262,500) (262,500) (262,500)
Total other financing sources (uses) (262,500) (262,500) (262,500) (262,500)
NET CHANGE IN FUND BALANCE (82,500)$ (82,500)$ 88,215 385,385
FUND BALANCE, MAY 1 1,113,584 728,199
FUND BALANCE, APRIL 30 1,201,799$ 1,113,584$
2014
VILLAGE OF OSWEGO, ILLINOIS
SCHEDULE OF REVENUES, EXPENDITURES AND CHANGES IN
FUND BALANCE - BUDGET AND ACTUAL
MOTOR FUEL TAX FUND
For the Year Ended April 30, 2014
(with comparative actual)
(See independent auditor's report.)- 70 -

Original Final 2013
Budget Budget Actual Actual
REVENUES
Intergovernmental -$ -$ 42,884$ 1,063,663$
Investment income 10,000 10,000 3,804 11,887
Developer contributions 15,000 15,000 27,544 23,463
Total revenues 25,000 25,000 74,232 1,099,013
EXPENDITURES
Capital outlay 435,000 435,000 187,303 1,156,074
Total expenditures 435,000 435,000 187,303 1,156,074
NET CHANGE IN FUND BALANCE (410,000)$ (410,000)$ (113,071) (57,061)
FUND BALANCE, MAY 1 773,492 830,553
FUND BALANCE, APRIL 30 660,421$ 773,492$
(with comparative actual)
2014
VILLAGE OF OSWEGO, ILLINOIS
SCHEDULE OF REVENUES, EXPENDITURES AND
CHANGES IN FUND BALANCE - BUDGET AND ACTUAL
CAPITAL PROJECTS FUND
For the Year Ended April 30, 2014
(See independent auditor's report.)- 71 -

MAJOR ENTERPRISE FUNDS
Water and Sewer Fund - to account for revenues and expenses relative to the operation of the
water and sewer utility.
Garbage Fund - to account for the operations of the Village’s garbage collection service.

2014 2013
CURRENT ASSETS
Cash and investments 8,554,764$ 8,418,855$
Accounts receivable 704,800 703,992
Restricted cash and investments
IEPA restriction 654,000 654,000
Prepaid expenses 25,701 20,163
Due from fiduciary funds 1,536 515
Total current assets 9,940,801 9,797,525
NONCURRENT ASSETS
Capital assets
Capital assets, net of depreciation
Nondepreciable assets 897,871 2,997,414
Depreciable buildings, property and infrastructure 74,856,966 71,969,094
Accumulated depreciation (18,603,437) (17,060,375)
Total capital assets 57,151,400 57,906,133
Total assets 67,092,201 67,703,658
DEFERRED OUTFLOWS OF RESOURCES
Unamortized loss on refunding 485,208 331,392
Total deferred outflows of resources 485,208 331,392
Total assets and deferred outflows of resources 67,577,409 68,035,050
(with comparative prior year)
VILLAGE OF OSWEGO, ILLINOIS
STATEMENT OF NET POSITION
WATER AND SEWER FUND
April 30, 2014
(This statement is continued on the following page.)- 72 -

2014 2013
CURRENT LIABILITIES
Accounts payable 618,964$ 1,193,110$
Accrued payroll 33,930 26,189
Retainage payable 129,273 8,695
Compensated absences 49,259 35,667
Interest payable 211,175 232,391
IEPA loans payable 123,830 120,576
Bonds payable 995,000 940,000
Total current liabilities 2,161,431 2,556,628
LONG-TERM LIABILITIES
Compensated absences 11,632 11,874
Other postemployment benefits 5,241 3,627
IEPA loans payable 882,902 1,006,733
Bonds payable, net 13,006,418 13,842,867
Total long-term liabilities 13,906,193 14,865,101
Total liabilities 16,067,624 17,421,729
NET POSITION
Net investment in capital assets 42,143,249 41,995,957
Restricted for radium removal 654,000 654,000
Unrestricted 8,712,536 7,963,364
TOTAL NET POSITION 51,509,785$ 50,613,321$
STATEMENT OF NET POSITION (Continued)
WATER AND SEWER FUND
April 30, 2014
(with comparative prior year)
VILLAGE OF OSWEGO, ILLINOIS
(See independent auditor's report.)- 73 -

Original Final 2013
Budget Budget Actual Actual
OPERATING REVENUES
Charges for services 5,271,800$ 5,271,800$ 5,160,783$ 5,571,056$
Total operating revenues 5,271,800 5,271,800 5,160,783 5,571,056
OPERATING EXPENSES
Salaries/personnel services 903,714 903,714 949,532 948,034
Insurance and benefits 380,893 380,893 377,430 362,607
Professional services 55,000 55,000 98,138 97,927
Contractual services 1,561,400 1,561,400 1,581,340 1,228,518
Communication 63,000 63,000 56,329 51,146
Professional development 5,600 5,600 3,702 3,899
Operating supplies 278,600 278,600 259,750 184,567
Capital maintenance 3,166,520 3,166,520 808,379 1,903,597
Total operating expenses 6,414,727 6,414,727 4,134,600 4,780,295
OPERATING INCOME (LOSS) (1,142,927) (1,142,927) 1,026,183 790,761
NON-OPERATING REVENUES (EXPENSES)
Connection fees 455,000 455,000 1,063,085 1,124,571
Grant revenue 107,500 107,500 99,265 610,021
Investment income 23,000 23,000 28,995 27,353
Interest expense and amortization (1,178,971) (1,178,971) (585,988) (692,132)
Principal retirement (520,576) (520,576) (1,060,576) (1,227,409)
Miscellaneous income 9,500 9,500 19,657 30,761
Total non-operating revenues (expenses) (1,104,547) (1,104,547) (435,562) (126,835)
NET INCOME (LOSS) BEFORE TRANSFERS (2,247,474) (2,247,474) 590,621 663,926
TRANSFERS IN (OUT)
General Fund - - - 1,621,000
ADJUSTMENTS TO GAAP BASIS
Principal retirement 520,576 520,576 1,060,576 1,227,409
Depreciation - - (1,563,112) (1,602,382)
Capital assets capitalized 3,166,520 3,166,520 808,379 1,903,597
Total adjustments to GAAP basis 3,687,096 3,687,096 305,843 1,528,624
CHANGE IN NET POSITION 1,439,622$ 1,439,622$ 896,464 3,813,550
NET POSITION, MAY 1 50,613,321 46,799,771
NET POSITION, APRIL 30 51,509,785$ 50,613,321$
2014
(with comparative actual)
For the Year Ended April 30, 2014
VILLAGE OF OSWEGO, ILLINOIS
SCHEDULE OF REVENUES, EXPENSES AND
CHANGES IN NET POSITION - BUDGET AND ACTUAL
WATER AND SEWER FUND
(See independent auditor's report.)- 74 -

2014 2013
CURRENT ASSETS
Cash and investments 321,672$ 185,315$
Accounts receivable 385,537 362,198
Intergovernmental - 26,648
Total current assets 707,209 574,161
NONCURRENT ASSETS
None - -
Total assets 707,209 574,161
CURRENT LIABILITIES
Accounts payable 176,319 35,530
Total current liabilities 176,319 35,530
LONG-TERM LIABILITIES
None - -
Total liabilities 176,319 35,530
NET POSITION
Unrestricted 530,890 538,631
TOTAL NET POSITION 530,890$ 538,631$
(with comparative prior year)
VILLAGE OF OSWEGO, ILLINOIS
STATEMENT OF NET POSITION
GARBAGE FUND
April 30, 2014
(See independent auditor's report.)- 75 -

Original Final 2013
Budget Budget Actual Actual
OPERATING REVENUES
Charges for services 2,176,500$ 2,176,500$ 2,097,286$ 2,032,054$
Total operating revenues 2,176,500 2,176,500 2,097,286 2,032,054
OPERATING EXPENSES
Disposal services 2,175,000 2,175,000 2,105,583 2,069,201
Total operating expenses 2,175,000 2,175,000 2,105,583 2,069,201
OPERATING INCOME (LOSS) 1,500 1,500 (8,297) (37,147)
NON-OPERATING REVENUES (EXPENSES)
Grant revenue - - - 26,648
Investment income 900 900 556 1,095
Total non-operating revenues (expenses) 900 900 556 27,743
CHANGE IN NET POSITION 2,400$ 2,400$ (7,741) (9,404)
NET POSITION, MAY 1 538,631 548,035
NET POSITION, APRIL 30 530,890$ 538,631$
2014
(with comparative actual)
For the Year Ended April 30, 2014
VILLAGE OF OSWEGO, ILLINOIS
SCHEDULE OF REVENUES, EXPENSES AND
CHANGES IN NET POSITION - BUDGET AND ACTUAL
GARBAGE FUND
(See independent auditor's report.)- 76 -

FIDUCIARY FUNDS
PENSION TRUST FUND
Police Pension Fund - to account for the resources necessary to provide retirement and disability
benefits to the personnel of the Village police department.
AGENCY FUNDS
Agency Fund - to account for land/cash and transition fees collected from developers for other
governmental entities.
Subdivision Escrow Fund - to account for developer deposits.

2014 2013
ASSETS
Cash and cash equivalents 163,967$ 289,777$
Investments, at fair value
U.S. Government and agency securities 7,465,426 6,365,831
Municipal bonds 1,195,014 907,435
Insurance contracts 2,577,616 2,872,769
Equity mutual funds 7,392,852 6,319,422
Accrued interest receivable 49,112 42,005
Prepaid items 517 -
Total assets 18,844,504 16,797,239
LIABILITIES
Accounts payable 5,695 6,880
Total liabilities 5,695 6,880
NET POSITION HELD IN TRUST FOR
PENSION BENEFITS 18,838,809$ 16,790,359$
VILLAGE OF OSWEGO, ILLINOIS
STATEMENT OF NET POSITION
POLICE PENSION FUND
April 30, 2014
(with comparative prior year)
(See independent auditor's report.)- 77 -

SCHEDULE OF CHANGES IN FIDUCIARY NET POSITION -
BUDGET AND ACTUAL -
For the Year Ended April 30, 2014
Original Final 2013
Budget Budget Actual Actual
ADDITIONS
Contributions
Employer 1,075,000$ 1,075,000$ 1,075,000$ 1,025,000$
Employee 400,000 400,000 396,282 394,850
Total contributions 1,475,000 1,475,000 1,471,282 1,419,850
Investment income
Net appreciation in fair
value of investments - - 899,387 894,162
Interest 250,000 250,000 399,772 357,490
Total investment income 250,000 250,000 1,299,159 1,251,652
Less investment expense (30,000) (45,881) (46,498) (41,664)
Net investment income 220,000 204,119 1,252,661 1,209,988
Total additions 1,695,000 1,679,119 2,723,943 2,629,838
DEDUCTIONS
Benefits and refunds 450,000 653,448 653,446 453,869
Administration 29,800 29,800 22,047 23,328
Total deductions 479,800 683,248 675,493 477,197
NET INCREASE $ 1,215,200 $ 995,871 2,048,450 2,152,641
NET POSITION HELD IN TRUST
FOR PENSION BENEFITS
May 1 16,790,359 14,637,718
April 30 $ 18,838,809 $ 16,790,359
VILLAGE OF OSWEGO, ILLINOIS
(with comparative actual)
2014
PENSION TRUST FUND
(See independent auditor's report.)- 78 -

Balances Balances
May 1 Additions Deductions April 30
Cash and investments 425,880$ 55,773$ -$ 481,653$
Accounts receivable 3,300 4,009 - 7,309
Due from others 1,887 10,580 1,887 10,580
TOTAL ASSETS 431,067$ 70,362$ 1,887$ 499,542$
Accounts payable 2,055$ 10,438$ -$ 12,493$
Due to others 425,802 117,210 58,796 484,216
Due to other funds 3,210 1,021 1,398 2,833
TOTAL LIABILITIES 431,067$ 128,669$ 60,194$ 499,542$
Cash and investments 79,393$ 1,887$ -$ 81,280$
Due from others 1,887 - 1,887 -
TOTAL ASSETS 81,280$ 1,887$ 1,887$ 81,280$
Due to others 81,280$ -$ -$ 81,280$
TOTAL LIABILITIES 81,280$ -$ -$ 81,280$
AGENCY FUND
ASSETS
LIABILITIES
ASSETS
LIABILITIES
VILLAGE OF OSWEGO, ILLINOIS
COMBINING STATEMENT OF CHANGES IN ASSETS AND LIABILITIES
AGENCY FUNDS
For the Year Ended April 30, 2014
ALL FUNDS
(This statement is continued on the following page.)- 79 -

Balances Balances
May 1 Additions Deductions April 30
Cash and investments 346,487$ 53,886$ -$ 400,373$
Accounts receivable 3,300 4,009 - 7,309
Due from others - 10,580 - 10,580
TOTAL ASSETS 349,787$ 68,475$ -$ 418,262$
Accounts payable 2,055$ 10,438$ -$ 12,493$
Due to others 344,522 117,210 58,796 402,936
Due to other funds 3,210 1,021 1,398 2,833
TOTAL LIABILITIES 349,787$ 128,669$ 60,194$ 418,262$
ASSETS
LIABILITIES
SUBDIVISION ESCROW FUND
VILLAGE OF OSWEGO, ILLINOIS
COMBINING STATEMENT OF CHANGES IN ASSETS AND LIABILITIES (Continued)
AGENCY FUNDS
For the Year Ended April 30, 2014
(See independent auditor's report.)- 80 -

SUPPLEMENTAL DATA

Date of Issue
Date of Maturity
Authorized Issue 9,970,000$
Actual Issue 9,970,000$
Denomination of Bonds 1 - 1994 - $5,000
Interest Rates
Bonds
233 - 314 4.25%
315 - 979 4.30%
980 - 1089 4.38%
1090 - 1449 4.40%
1450 - 1854 4.45%
1855 - 1994 4.50%
Principal Maturity Date
Interest Dates
Payable at BNY Mellon
Tax
Levy Bond
Year Numbers Principal Interest Totals June 15 Amount December 15 Amount
2013 580-674 475,000$ 161,762$ 636,762$ 2014 80,881$ 2014 80,881$
2014 675-774 500,000 141,338 641,338 2015 70,669 2015 70,669
2015 775-874 500,000 119,838 619,838 2016 59,919 2016 59,919
2016 875-979 525,000 98,338 623,338 2017 49,169 2017 49,169
2017 980-1089 550,000 75,762 625,762 2018 37,881 2018 37,881
2018 1090-1204 575,000 51,700 626,700 2019 25,850 2019 25,850
2019 1205-1324 600,000 26,400 626,400 2020 13,200 2020 13,200
2020 1325-1449 - - - 2021 - 2021 -
2021 1450-1579 - - - 2022 - 2022 -
2022 1580-1714 - - - 2023 - 2023 -
2023 1715-1854 - - - 2024 - 2024 -
2024 1855-1994 - - - 2025 - 2025 -
3,725,000$ 675,138$ 4,400,138$ 337,569$ 337,569$
Note: The bonds maturing December 15, 2021 to 2025 totaling $3,350,000 were refunded by the General Obligation Refunding Bonds, Series 2013.
December 15 and June 15
FUTURE PRINCIPAL AND INTEREST REQUIREMENTS
Tax Levy Interest Due on
December 15, 2025
December 15
VILLAGE OF OSWEGO, ILLINOIS
LONG-TERM DEBT REQUIREMENTS
GENERAL OBLIGATION ALTERNATE REVENUE SOURCE
BOND SERIES OF 2006A
April 30, 2014
May 15, 2006
(See independent auditor's report.)- 81 -

Date of Issue
Date of Maturity
Authorized Issue 1,585,000$
Actual Issue 1,585,000$
Denomination of Bonds 1 - 317 - $5,000
Interest Rates
Bonds
61 - 263 4.25%
264 - 263 4.30%
264 - 288 4.35%
289 - 317 4.375%
Principal Maturity Date
Interest Dates
Payable at BNY Mellon
Tax
Levy Bond
Year Numbers Principal Interest Totals June 15 Amount December 15 Amount
2013 141-163 115,000$ 37,981$ 152,981$ 2014 18,991$ 2014 18,990$
2014 164-188 125,000 33,094 158,094 2015 16,547 2015 16,547
2015 189-213 125,000 27,781 152,781 2016 13,891 2016 13,890
2016 214-238 125,000 22,469 147,469 2017 11,235 2017 11,234
2017 239-263 125,000 17,156 142,156 2018 8,578 2018 8,578
2018 264-288 125,000 11,781 136,781 2019 5,891 2019 5,890
2019 289-317 145,000 6,344 151,344 2020 3,172 2020 3,172
885,000$ 156,606$ 1,041,606$ 78,305$ 78,301$
VILLAGE OF OSWEGO, ILLINOIS
LONG-TERM DEBT REQUIREMENTS
GENERAL OBLIGATION ALTERNATE REVENUE SOURCE
BOND SERIES OF 2006B
April 30, 2014
May 15, 2006
December 15, 2020
December 15
December 15 and June 15
FUTURE PRINCIPAL AND INTEREST REQUIREMENTS
Tax Levy Interest Due on
(See independent auditor's report.)- 82 -
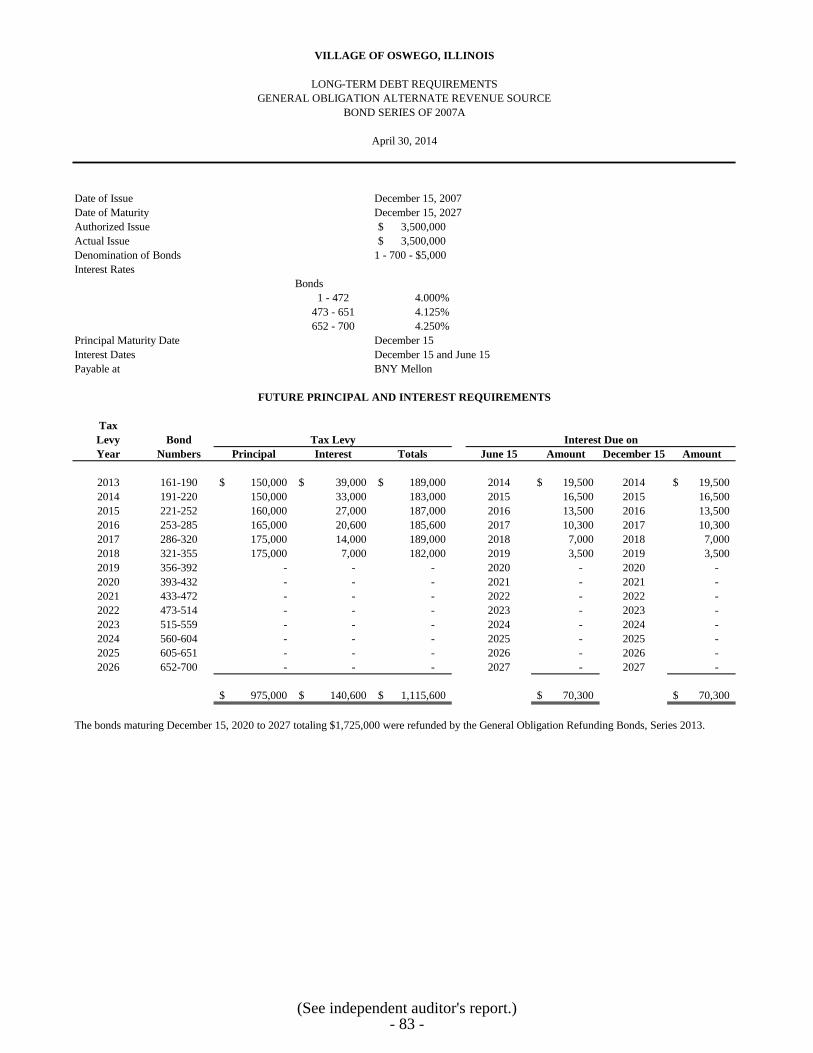
Date of Issue
Date of Maturity
Authorized Issue 3,500,000$
Actual Issue 3,500,000$
Denomination of Bonds 1 - 700 - $5,000
Interest Rates
Bonds
1 - 472 4.000%
473 - 651 4.125%
652 - 700 4.250%
Principal Maturity Date
Interest Dates
Payable at BNY Mellon
Tax
Levy Bond
Year Numbers Principal Interest Totals June 15 Amount December 15 Amount
2013 161-190 150,000$ 39,000$ 189,000$ 2014 19,500$ 2014 19,500$
2014 191-220 150,000 33,000 183,000 2015 16,500 2015 16,500
2015 221-252 160,000 27,000 187,000 2016 13,500 2016 13,500
2016 253-285 165,000 20,600 185,600 2017 10,300 2017 10,300
2017 286-320 175,000 14,000 189,000 2018 7,000 2018 7,000
2018 321-355 175,000 7,000 182,000 2019 3,500 2019 3,500
2019 356-392 - - - 2020 - 2020 -
2020 393-432 - - - 2021 - 2021 -
2021 433-472 - - - 2022 - 2022 -
2022 473-514 - - - 2023 - 2023 -
2023 515-559 - - - 2024 - 2024 -
2024 560-604 - - - 2025 - 2025 -
2025 605-651 - - - 2026 - 2026 -
2026 652-700 - - - 2027 - 2027 -
975,000$ 140,600$ 1,115,600$ 70,300$ 70,300$
The bonds maturing December 15, 2020 to 2027 totaling $1,725,000 were refunded by the General Obligation Refunding Bonds, Series 2013.
December 15, 2027
December 15
December 15 and June 15
FUTURE PRINCIPAL AND INTEREST REQUIREMENTS
Tax Levy Interest Due on
VILLAGE OF OSWEGO, ILLINOIS
LONG-TERM DEBT REQUIREMENTS
GENERAL OBLIGATION ALTERNATE REVENUE SOURCE
BOND SERIES OF 2007A
April 30, 2014
December 15, 2007
(See independent auditor's report.)- 83 -

Date of Issue
Date of Maturity
Authorized Issue 6,000,000$
Actual Issue 6,000,000$
Denomination of Bonds 1 - 1200 - $5,000
Interest Rates
Bonds
1 - 488 3.750%
489 - 1200 4.000%
Principal Maturity Date
Interest Dates
Payable at BNY Mellon
Tax
Levy Bond
Year Numbers Principal Interest Totals June 15 Amount December 15 Amount
2013 274-323 250,000$ 65,425$ 315,425$ 2014 32,713$ 2014 32,712$
2014 324-376 265,000 56,050 321,050 2015 28,025 2015 28,025
2015 377-431 275,000 46,114 321,114 2016 23,057 2016 23,057
2016 432-488 285,000 35,800 320,800 2017 17,900 2017 17,900
2017 489-548 300,000 24,400 324,400 2018 12,200 2018 12,200
2018 549-610 310,000 12,400 322,400 2019 6,200 2019 6,200
2019 611-675 - - - 2020 - 2020 -
2020 676-740 - - - 2021 - 2021 -
2021 741-810 - - - 2022 - 2022 -
2022 811-882 - - - 2023 - 2023 -
2023 883-957 - - - 2024 - 2024 -
2024 958-1035 - - - 2025 - 2025 -
2025 1036-1115 - - - 2026 - 2026 -
2026 1116-1200 - - - 2027 - 2027 -
1,685,000$ 240,189$ 1,925,189$ 120,095$ 120,094$
The bonds maturing December 15, 2020 to 2027 totaling $2,950,000 were refunded by the General Obligation Refunding Bonds, Series 2013.
December 15, 2027
December 15
December 15 and June 15
FUTURE PRINCIPAL AND INTEREST REQUIREMENTS
Tax Levy Interest Due on
VILLAGE OF OSWEGO, ILLINOIS
LONG-TERM DEBT REQUIREMENTS
GENERAL OBLIGATION ALTERNATE REVENUE SOURCE
BOND SERIES OF 2007B
April 30, 2014
December 15, 2007
(See independent auditor's report.)- 84 -

Date of Issue
Date of Maturity
Authorized Issue 9,015,000$
Actual Issue 9,015,000$
Denomination of Bonds 1 - 1803 - $5,000
Interest Rates *
Bonds Bonds
1-48 2.125% 810-877 4.600%
49-102 2.500% 878-949 4.700%
103-158 2.750% 950-1025 4.800%
159-268 3.250% 1026-1105 4.900%
269-382 3.500% 1106-1278 5.000%
383-501 3.750% 1279-1372 5.125%
502-625 4.000% 1373-1575 5.375%
626-744 4.375% 1576-1803 5.500%
745-809 4.450%
Principal Maturity Date
Interest Dates
Payable at BNY Mellon
Tax
Levy Bond
Year Numbers Principal Interest Totals June 15 Amount December 15 Amount
2013 269-382 570,000$ 362,550$ 932,550$ 2014 181,275$ 2014 181,275$
2014 383-501 595,000 342,600 937,600 2015 171,300 2015 171,300
2015 502-625 620,000 320,288 940,288 2016 160,144 2016 160,144
2016 626-744 595,000 295,488 890,488 2017 147,744 2017 147,744
2017 745-809 325,000 269,456 594,456 2018 134,728 2018 134,728
2018 810-877 340,000 254,994 594,994 2019 127,497 2019 127,497
2019 878-949 360,000 239,354 599,354 2020 119,677 2020 119,677
2020 950-1025 380,000 222,434 602,434 2021 111,217 2021 111,217
2021 1026-1105 400,000 204,194 604,194 2022 102,097 2022 102,097
2022 1106-1189 420,000 184,594 604,594 2023 92,297 2023 92,297
2023 1190-1278 445,000 163,594 608,594 2024 81,797 2024 81,797
2024 1279-1372 470,000 141,344 611,344 2025 70,672 2025 70,672
2025 1373-1471 495,000 117,256 612,256 2026 58,628 2026 58,628
2026 1472-1575 520,000 90,650 610,650 2027 45,325 2027 45,325
2027 1576-1686 555,000 62,700 617,700 2028 31,350 2028 31,350
2028 1687-1803 585,000 32,175 617,175 2029 16,088 2029 16,087
7,675,000$ 3,303,671$ 10,978,671$ 1,651,836$ 1,651,835$
*Pursuant to the American Recovery and Reinvestment Act, the Village is eligible to receive a rebate from the U.S. Treasury
Department of the 35% of the interest paid each year. The net interest rate for these Build America Bonds, after rebate, is
1.38% to 3.58%.
VILLAGE OF OSWEGO, ILLINOIS
LONG-TERM DEBT REQUIREMENTS
TAXABLE GENERAL OBLIGATION
BOND SERIES OF 2009
April 30, 2014
September 2, 2009
December 15, 2029
December 15
December 15 and June 15
FUTURE PRINCIPAL AND INTEREST REQUIREMENTS
Tax Levy Interest Due on
(See independent auditor's report.)- 85 -

Date of Issue
Date of Maturity
Authorized Issue 4,055,000$
Actual Issue 4,055,000$
Denomination of Bonds 1 - 811 - $5,000
Interest Rates
Bonds
1-119 2.000%
120-368 3.000%
369-811 3.500%
Principal Maturity Date
Interest Dates
Payable at BNY Mellon
Tax
Levy Bond
Year Numbers Principal Interest Totals June 15 Amount December 15 Amount
2013 63-120 290,000$ 120,675$ 410,675$ 2014 60,338$ 2014 60,337$
2014 121-180 300,000 114,875 414,875 2015 57,438 2015 57,437
2015 181-242 310,000 105,875 415,875 2016 52,938 2016 52,937
2016 243-304 310,000 96,575 406,575 2017 48,288 2017 48,287
2017 305-369 325,000 87,275 412,275 2018 43,638 2018 43,637
2018 370-437 340,000 77,525 417,525 2019 38,763 2019 38,762
2019 438-507 350,000 65,625 415,625 2020 32,813 2020 32,812
2020 508-579 360,000 53,375 413,375 2021 26,688 2021 26,687
2021 580-656 385,000 40,775 425,775 2022 20,388 2022 20,387
2022 657-734 390,000 27,300 417,300 2023 13,650 2023 13,650
2023 735-811 390,000 13,650 403,650 2024 6,825 2024 6,825
3,750,000$ 803,525$ 4,553,525$ 401,767$ 401,758$
December 15, 2024
December 15
December 15 and June 15
FUTURE PRINCIPAL AND INTEREST REQUIREMENTS
Tax Levy Interest Due on
VILLAGE OF OSWEGO, ILLINOIS
LONG-TERM DEBT REQUIREMENTS
GENERAL OBLIGATION REFUNDING
BOND SERIES OF 2011
April 30, 2014
December 20, 2011
(See independent auditor's report.)- 86 -
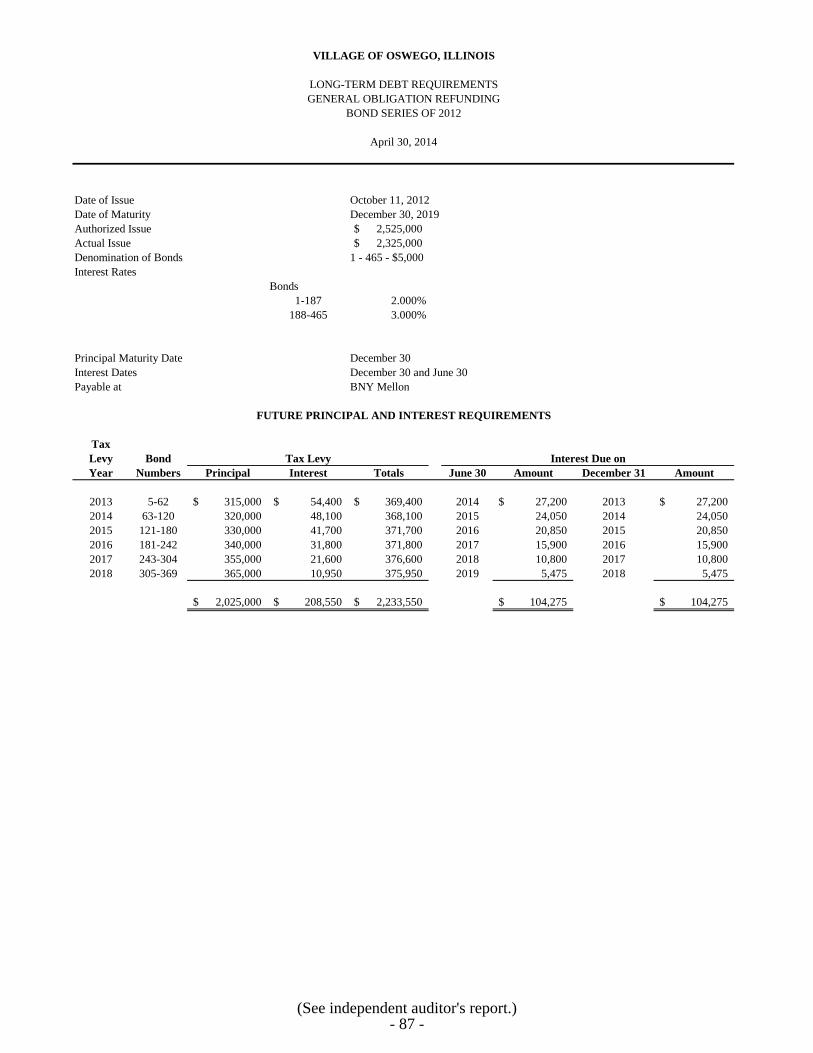
Date of Issue
Date of Maturity
Authorized Issue 2,525,000$
Actual Issue 2,325,000$
Denomination of Bonds 1 - 465 - $5,000
Interest Rates
Bonds
1-187 2.000%
188-465 3.000%
Principal Maturity Date
Interest Dates
Payable at BNY Mellon
Tax
Levy Bond
Year Numbers Principal Interest Totals June 30 Amount December 31 Amount
2013 5-62 315,000$ 54,400$ 369,400$ 2014 27,200$ 2013 27,200$
2014 63-120 320,000 48,100 368,100 2015 24,050 2014 24,050
2015 121-180 330,000 41,700 371,700 2016 20,850 2015 20,850
2016 181-242 340,000 31,800 371,800 2017 15,900 2016 15,900
2017 243-304 355,000 21,600 376,600 2018 10,800 2017 10,800
2018 305-369 365,000 10,950 375,950 2019 5,475 2018 5,475
2,025,000$ 208,550$ 2,233,550$ 104,275$ 104,275$
December 30, 2019
December 30
December 30 and June 30
FUTURE PRINCIPAL AND INTEREST REQUIREMENTS
Tax Levy Interest Due on
VILLAGE OF OSWEGO, ILLINOIS
LONG-TERM DEBT REQUIREMENTS
GENERAL OBLIGATION REFUNDING
BOND SERIES OF 2012
April 30, 2014
October 11, 2012
(See independent auditor's report.)- 87 -

Date of Loan
Date of Maturity
Authorized Loan 11,300,000$
Actual Loan 8,595,000$
Denomination of Bonds 1 - 1719 - $5,000
Interest Rate
Bonds
1-68 2.000%
69-1719 3.000%
Principal Maturity Date
Interest Dates
Tax
Levy Bond
Year Numbers Principal Interest Totals June 15 Amount December 15 Amount
2013 1-11 55,000$ 254,450$ 309,450$ 2014 127,225$ 2014 127,225$
2014 12-23 55,000 253,350 308,350 2015 126,675 2015 126,675
2015 24-35 55,000 252,250 307,250 2016 126,125 2016 126,125
2016 36-47 55,000 251,150 306,150 2017 125,575 2017 125,575
2017 48-59 55,000 250,050 305,050 2018 125,025 2018 125,025
2018 60-73 65,000 248,950 313,950 2019 124,475 2019 124,475
2019 74-189 575,000 247,650 822,650 2020 123,825 2020 123,825
2020 190-432 1,210,000 230,400 1,440,400 2021 115,200 2021 115,200
2021 433-683 1,250,000 194,100 1,444,100 2022 97,050 2022 97,050
2022 684-940 1,280,000 156,600 1,436,600 2023 78,300 2023 78,300
2023 941-1205 1,320,000 118,200 1,438,200 2024 59,100 2024 59,100
2024 1206-1471 1,325,000 78,600 1,403,600 2025 39,300 2025 39,300
2025 1472-1599 635,000 38,850 673,850 2026 19,425 2026 19,425
2026 1600-1732 660,000 19,800 679,800 2027 9,900 2027 9,900
8,595,000$ 2,594,400$ 11,189,400$ 1,297,200$ 1,297,200$
VILLAGE OF OSWEGO, ILLINOIS
LONG-TERM DEBT REQUIREMENTS
CORPORATE PURPOSE TAXABLE GENERAL OBLIGATION REFUNDING
April 30, 2014
May 17, 2013
December 15, 2027
BOND SERIES 2013 - TOTAL
December 15
December 15 and June 15
FUTURE PRINCIPAL AND INTEREST REQUIREMENTS
Tax Levy Interest Due on
(See independent auditor's report.)- 88 -

Date of Loan
Date of Maturity
Authorized Loan 11,300,000$
Actual Loan 8,595,000$
Denomination of Bonds 1 - 1719 - $5,000
Interest Rate
Bonds
1-68 2.000%
69-1719 3.000%
Principal Maturity Date
Interest Dates
Tax
Levy Bond
Year Numbers Principal Interest Totals June 15 Amount December 15 Amount
2013 1-11 45,000$ 200,300$ 245,300$ 2014 100,150$ 2014 100,150$
2014 12-23 45,000 199,400 244,400 2015 99,700 2015 99,700
2015 24-35 45,000 198,500 243,500 2016 99,250 2016 99,250
2016 36-47 45,000 197,600 242,600 2017 98,800 2017 98,800
2017 48-59 45,000 196,700 241,700 2018 98,350 2018 98,350
2018 60-73 55,000 195,800 250,800 2019 97,900 2019 97,900
2019 74-189 380,000 194,700 574,700 2020 97,350 2020 97,350
2020 190-432 1,000,000 183,300 1,183,300 2021 91,650 2021 91,650
2021 433-683 1,040,000 153,300 1,193,300 2022 76,650 2022 76,650
2022 684-940 1,065,000 122,100 1,187,100 2023 61,050 2023 61,050
2023 941-1205 1,090,000 90,150 1,180,150 2024 45,075 2024 45,075
2024 1206-1471 1,095,000 57,450 1,152,450 2025 28,725 2025 28,725
2025 1472-1599 400,000 24,600 424,600 2026 12,300 2026 12,300
2026 1600-1732 420,000 12,600 432,600 2027 6,300 2027 6,300
6,770,000$ 2,026,500$ 8,796,500$ 1,013,250$ 1,013,250$
VILLAGE OF OSWEGO, ILLINOIS
LONG-TERM DEBT REQUIREMENTS
CORPORATE PURPOSE TAXABLE GENERAL OBLIGATION REFUNDING
BOND SERIES 2013 - GOVERNMENTAL ACTIVITES
April 30, 2014
May 17, 2013
December 15, 2027
December 15
December 15 and June 15
FUTURE PRINCIPAL AND INTEREST REQUIREMENTS
Tax Levy Interest Due on
(See independent auditor's report.)- 89 -

Date of Loan
Date of Maturity
Authorized Loan 11,300,000$
Actual Loan 8,595,000$
Denomination of Bonds 1 - 1719 - $5,000
Interest Rate
Bonds
1-68 2.000%
69-1719 3.000%
Principal Maturity Date
Interest Dates
Tax
Levy Bond
Year Numbers Principal Interest Totals June 15 Amount December 15 Amount
2013 1-11 10,000$ 54,150$ 64,150$ 2014 27,075$ 2014 27,075$
2014 12-23 10,000 53,950 63,950 2015 26,975 2015 26,975
2015 24-35 10,000 53,750 63,750 2016 26,875 2016 26,875
2016 36-47 10,000 53,550 63,550 2017 26,775 2017 26,775
2017 48-59 10,000 53,350 63,350 2018 26,675 2018 26,675
2018 60-73 10,000 53,150 63,150 2019 26,575 2019 26,575
2019 74-189 195,000 52,950 247,950 2020 26,475 2020 26,475
2020 190-432 210,000 47,100 257,100 2021 23,550 2021 23,550
2021 433-683 210,000 40,800 250,800 2022 20,400 2022 20,400
2022 684-940 215,000 34,500 249,500 2023 17,250 2023 17,250
2023 941-1205 230,000 28,050 258,050 2024 14,025 2024 14,025
2024 1206-1471 230,000 21,150 251,150 2025 10,575 2025 10,575
2025 1472-1599 235,000 14,250 249,250 2026 7,125 2026 7,125
2026 1600-1732 240,000 7,200 247,200 2027 3,600 2027 3,600
1,825,000$ 567,900$ 2,392,900$ 283,950$ 283,950$
VILLAGE OF OSWEGO, ILLINOIS
LONG-TERM DEBT REQUIREMENTS
CORPORATE PURPOSE TAXABLE GENERAL OBLIGATION REFUNDING
BOND SERIES 2013 - BUSINESS-TYPE ACTIVITIES
April 30, 2014
May 17, 2013
December 15, 2027
December 15
December 15 and June 15
FUTURE PRINCIPAL AND INTEREST REQUIREMENTS
Tax Levy Interest Due on
(See independent auditor's report.)- 90 -

Date of Loan
Date of Maturity
Authorized Loan 907,735$
Actual Loan 907,735$
Interest Rate 2.890%
Principal Maturity Date
Interest Dates
Fiscal
Year Principal Interest Totals October 27 Amount April 27 Amount
2015 57,450$ 4,716$ 62,166$ 2014 2,564$ 2015 2,152$
2016 59,122 3,043 62,165 2015 1,734 2016 1,309
2017 60,844 1,322 62,166 2016 879 2017 443
177,416$ 9,081$ 186,497$ 5,177$ 3,904$
VILLAGE OF OSWEGO, ILLINOIS
LONG-TERM DEBT REQUIREMENTS
IEPA LOAN NO. 17-0783
April 30, 2014
November 1, 1999
April 27, 2017
April 27 and October 27
April 27 and October 27
FUTURE PRINCIPAL AND INTEREST REQUIREMENTS
Tax Levy Interest Due on
(See independent auditor's report.)- 91 -
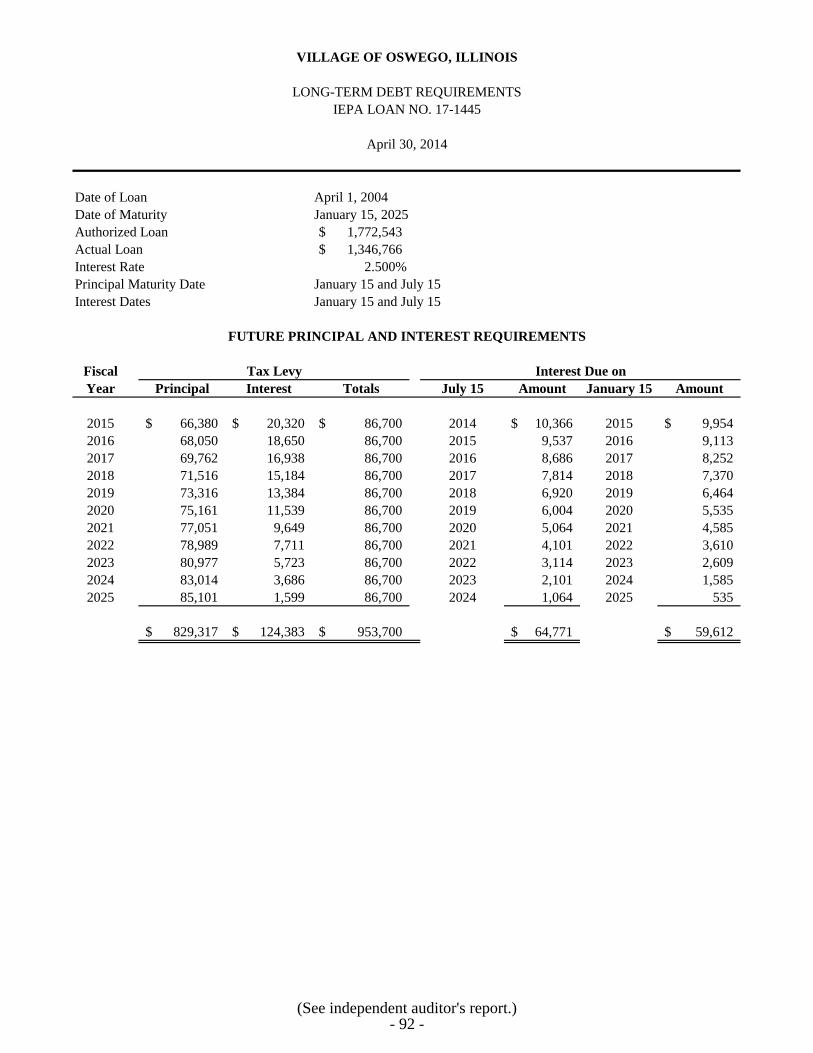
Date of Loan
Date of Maturity
Authorized Loan 1,772,543$
Actual Loan 1,346,766$
Interest Rate 2.500%
Principal Maturity Date
Interest Dates
Fiscal
Year Principal Interest Totals July 15 Amount January 15 Amount
2015 66,380$ 20,320$ 86,700$ 2014 10,366$ 2015 9,954$
2016 68,050 18,650 86,700 2015 9,537 2016 9,113
2017 69,762 16,938 86,700 2016 8,686 2017 8,252
2018 71,516 15,184 86,700 2017 7,814 2018 7,370
2019 73,316 13,384 86,700 2018 6,920 2019 6,464
2020 75,161 11,539 86,700 2019 6,004 2020 5,535
2021 77,051 9,649 86,700 2020 5,064 2021 4,585
2022 78,989 7,711 86,700 2021 4,101 2022 3,610
2023 80,977 5,723 86,700 2022 3,114 2023 2,609
2024 83,014 3,686 86,700 2023 2,101 2024 1,585
2025 85,101 1,599 86,700 2024 1,064 2025 535
829,317$ 124,383$ 953,700$ 64,771$ 59,612$
VILLAGE OF OSWEGO, ILLINOIS
LONG-TERM DEBT REQUIREMENTS
IEPA LOAN NO. 17-1445
April 30, 2014
April 1, 2004
January 15, 2025
January 15 and July 15
January 15 and July 15
FUTURE PRINCIPAL AND INTEREST REQUIREMENTS
Tax Levy Interest Due on
(See independent auditor's report.)- 92 -
STATISTICAL SECTION
This part of the Village comprehensive annual financial report presents detailed information as a context for understanding what the information in the financial statements, note disclosures and required supplementary information says about the Village’s overall financial health. Contents Page Financial Trends 93-102 These schedules contain trend information to help the reader understand how
the Village’s financial performance and well-being have changed over time.
Revenue Capacity 103-111 These schedules contain information to help the reader assess the Village’s
most significant local revenue source, the sales tax.
Debt Capacity 112-116 These schedules present information to help the reader assess the
affordability of the Village’s current levels of outstanding debt and the Village’s ability to issue additional debt in the future.
Demographic and Economic Information 117-118 These schedules offer demographic and economic indicators to help the
reader understand the environment within which the Village’s financial activities take place.
Operating Information 119-121 These schedules contain service and infrastructure data to help the reader
understand how the information in the Village’s financial report relates to the services the Village provides and the activities it performs.
Sources: Unless otherwise noted, the information in these schedules is derived from the comprehensive annual financial reports for the relevant year.

2005 2006* 2007 2008
GOVERNMENTAL ACTIVITIES
Net investment in capital assets 2,246,206$ 212,015,432$ 275,810,548$ 275,890,996$
Restricted 2,988,094 1,469,306 2,833,472 2,271,727
Unrestricted 2,742,804 5,867,096 4,676,344 6,193,562
TOTAL GOVERNMENTAL
ACTIVITIES 7,977,104$ 219,351,834$ 283,320,364$ 284,356,285$
BUSINESS-TYPE ACTIVITIES
Net investment in capital assets 24,853,527$ 37,823,930$ 38,320,494$ 41,640,918$
Restricted 3,151,950 899,500 899,500 899,500
Unrestricted 6,559,112 1,091,886 4,265,995 2,043,619
TOTAL BUSINESS-TYPE
ACTIVITIES 34,564,589$ 39,815,316$ 43,485,989$ 44,584,037$
PRIMARY GOVERNMENT
Net investment in capital assets 27,099,733$ 249,839,362$ 314,131,042$ 317,531,914$
Restricted 6,140,044 2,368,806 3,732,972 3,171,227
Unrestricted 9,301,916 6,958,982 8,942,339 8,237,181
TOTAL PRIMARY GOVERNMENT 42,541,693$ 259,167,150$ 326,806,353$ 328,940,322$
Data Source
Audited Financial Statements
* In fiscal year 2006, the Village began reporting infrastructure.
VILLAGE OF OSWEGO, ILLINOIS
NET POSITION BY COMPONENT
Last Ten Fiscal Years
- 93 -

2009 2010 2011 2012 2013 2014
279,192,631$ 275,314,514$ 274,396,968$ 272,998,786$ 271,570,611$ 269,462,285$
2,603,394 2,599,700 2,772,565 2,273,073 2,888,976 3,136,556
4,893,607 4,420,252 3,419,680 5,357,170 4,826,113 6,621,863
286,689,632$ 282,334,466$ 280,589,213$ 280,629,029$ 279,285,700$ 279,220,704$
40,762,063$ 42,523,985$ 41,398,648$ 40,762,984$ 41,995,957$ 42,143,249$
899,500 654,000 654,000 654,000 654,000 654,000
1,736,338 1,684,126 4,704,208 5,217,977 8,501,995 9,243,426
43,397,901$ 44,862,111$ 46,756,856$ 46,634,961$ 51,151,952$ 52,040,675$
319,954,694$ 317,838,499$ 315,795,616$ 313,761,770$ 313,566,568$ 311,605,534$
3,502,894 3,253,700 3,426,565 2,927,073 3,542,976 3,790,556
6,629,945 6,104,378 8,123,888 10,575,147 13,328,108 15,865,289
330,087,533$ 327,196,577$ 327,346,069$ 327,263,990$ 330,437,652$ 331,261,379$
- 94 -

2005 2006 2007 2008
EXPENSES
Governmental activities
General government 1,654,530$ 1,275,745$ 1,556,726$ 1,757,232$
Building and zoning 716,031 720,110 834,696 1,001,493
Community development 335,868 324,322 371,006 447,050
Public safety 4,367,226 5,648,230 6,165,019 7,264,710
Public works 1,329,419 5,215,219 6,750,620 6,454,882
Retirement 460,219 - - -
Interest 153,467 87,901 551,346 652,516
Total governmental activities
expenses 9,016,760 13,271,527 16,229,413 17,577,883
Business-type activities
Water and sewer 3,790,286 4,750,871 5,672,233 6,866,834
Garbage 1,025,226 1,197,131 1,350,403 1,675,620
Total business-type activities
expenses 4,815,512 5,948,002 7,022,636 8,542,454
TOTAL PRIMARY GOVERNMENT
EXPENSES 13,832,272$ 19,219,529$ 23,252,049$ 26,120,337$
PROGRAM REVENUES
Governmental activities
Charges for services
General government 42,921$ 22,572$ 40,357$ 59,324$
Building and zoning 81,812 1,806,043 2,111,691 1,190,633
Community development 1,164,757 164,422 179,377 200,517
Public safety 317,633 398,781 490,922 523,519
Operating grants and contributions 743,489 1,516,159 1,635,808 1,353,159
Capital grants and contributions - 54,754,974 67,207,177 4,638,376
Total governmental activities
program revenues 2,350,612 58,662,951 71,665,332 7,965,528
Business-type activities
Charges for services
Water and sewer 3,501,031 3,955,995 7,143,385 6,563,342
Garbage 1,069,999 1,237,470 1,399,455 1,736,868
Operating grants and contributions - - - -
Capital grants and contributions 950,200 3,414,625 2,575,410 1,474,988
Total business-type activities
program revenues 5,521,230 8,608,090 11,118,250 9,775,198
TOTAL PRIMARY GOVERNMENT
PROGRAM REVENUES 7,871,842$ 67,271,041$ 82,783,582$ 17,740,726$
NET REVENUE (EXPENSE)
Governmental activities (6,666,148)$ 45,391,424$ 55,435,919$ (9,612,355)$
Business-type activities 705,718 2,660,088 4,095,614 1,232,744
TOTAL PRIMARY GOVERNMENT
NET REVENUE (EXPENSE) (5,960,430)$ 48,051,512$ 59,531,533$ (8,379,611)$
VILLAGE OF OSWEGO, ILLINOIS
CHANGE IN NET POSITION
Last Ten Fiscal Years
- 95 -

2009 2010 2011 2012 2013 2014
2,550,510$ 2,786,451$ 2,574,508$ 2,551,465$ 2,504,327$ 2,568,401$
782,406 688,512 574,252 603,708 627,008 638,618
567,010 413,592 355,570 469,946 507,828 707,665
7,281,633 7,495,117 7,771,351 7,785,066 7,854,804 8,374,812
6,321,596 6,465,291 6,443,722 6,466,254 7,560,190 7,119,256
- - - - - -
774,560 798,077 810,467 756,086 827,319 580,528
18,277,715 18,647,040 18,529,870 18,632,525 19,881,476 19,989,280
6,441,779 6,444,545 5,915,469 5,573,478 5,171,212 5,475,321
1,982,933 1,995,198 2,088,471 2,272,694 2,069,201 2,105,583
8,424,712 8,439,743 8,003,940 7,846,172 7,240,413 7,580,904
26,702,427$ 27,086,783$ 26,533,810$ 26,478,697$ 27,121,889$ 27,570,184$
71,824$ 132,928$ 34,291$ 22,668$ 19,489$ 79,360$
544,440 513,399 438,255 530,892 546,995 745,449
168,897 162,819 169,080 146,390 135,718 167,520
486,881 722,428 708,635 682,086 603,156 631,669
1,230,557 1,380,242 1,218,753 1,207,396 1,561,809 1,148,407
7,447,372 598,992 3,681,288 3,495,236 3,614,701 2,525,807
9,949,971 3,510,808 6,250,302 6,084,668 6,481,868 5,298,212
5,348,323 5,308,250 5,497,141 6,261,974 6,695,627 6,223,868
2,052,072 2,084,353 2,172,351 2,267,599 2,032,054 2,097,286
- - - 111,935 636,669 99,265
166,998 - 149,056 62,390 - -
7,567,393 7,392,603 7,818,548 8,703,898 9,364,350 8,420,419
17,517,364$ 10,903,411$ 14,068,850$ 14,788,566$ 15,846,218$ 13,718,631$
(8,327,744)$ (15,136,232)$ (12,279,568)$ (12,547,857)$ (13,399,608)$ (14,691,068)$
(857,319) (1,047,140) (185,392) 857,726 2,123,937 839,515
(9,185,063)$ (16,183,372)$ (12,464,960)$ (11,690,131)$ (11,275,671)$ (13,851,553)$
- 96 -

2005 2006 2007 2008
GENERAL REVENUES AND OTHER
CHANGES IN NET ASSETS
Governmental activities
Taxes
Property 875,573$ 957,682$ 1,008,600$ 1,149,608$
Sales 2,179,804 2,514,830 2,925,295 3,595,313
Telecommunication 867,423 937,474 899,885 1,020,222
Developer contributions 1,286,994 - - -
Utility - 837,414 824,833 972,764
Other 874,764 253,381 266,240 293,303
Intergovernmental - unrestricted
Income tax 1,426,886 1,525,240 1,681,961 1,837,415
Personal property replacement tax 8,077 9,135 9,926 11,864
Investment income 110,685 282,254 736,926 516,202
Miscellaneous 529,556 782,579 548,958 785,556
Transfers in (out) - 313,646 337,048 382,146
Total governmental activities 8,159,762 8,413,635 9,239,672 10,564,393
Business-type activities
Developer contributions 4,883,135 - - -
Connection fees 2,934,498 2,724,191 - -
Miscellaneous - - - -
Investment income 46,939 122,081 212,107 228,086
Transfers in (out) - (313,646) (337,048) (382,146)
Total business-type activities 7,864,572 2,532,626 (124,941) (154,060)
TOTAL PRIMARY GOVERNMENT 16,024,334$ 10,946,261$ 9,114,731$ 10,410,333$
CHANGE IN NET POSITION
Governmental activities 1,493,614$ 53,805,059$ 64,675,591$ 952,038$
Business-type activities 8,570,290 5,192,714 3,970,673 1,078,684
TOTAL PRIMARY GOVERNMENT
CHANGE IN NET POSITION 10,063,904$ 58,997,773$ 68,646,264$ 2,030,722$
Data Source
Audited Financial Statements
VILLAGE OF OSWEGO, ILLINOIS
CHANGE IN NET POSITION (Continued)
Last Ten Fiscal Years
- 97 -

2009 2010 2011 2012 2013 2014
1,258,277$ 1,395,165$ 1,449,154$ 1,454,079$ 1,344,929$ 1,326,712$
3,444,187 4,072,717 5,349,488 6,039,345 6,129,126 6,401,637
1,067,075 1,073,121 1,022,272 1,304,003 959,986 934,655
- - - - - -
957,052 886,998 1,010,223 959,959 1,009,180 1,136,668
387,339 354,165 490,642 511,361 555,475 612,825
2,175,465 2,304,243 2,261,969 2,460,342 2,735,608 2,957,978
10,366 9,175 10,666 9,627 9,480 10,923
229,198 74,953 100,039 92,563 57,097 35,528
707,915 610,529 722,862 707,593 876,398 1,046,968
424,217 - (1,883,000) 325,470 (1,621,000) -
10,661,091 10,781,066 10,534,315 13,864,342 12,056,279 14,463,894
- - - - - -
- - - - - -
- 107,450 164,442 14,345 30,761 19,657
95,400 55,376 32,695 44,349 28,448 29,551
(424,217) - 1,883,000 (325,470) 1,621,000 -
(328,817) 162,826 2,080,137 (266,776) 1,680,209 49,208
10,332,274$ 10,943,892$ 12,614,452$ 13,597,566$ 13,736,488$ 14,513,102$
2,333,347$ (4,355,166)$ (1,745,253)$ 1,316,485$ (1,343,329)$ (227,174)$
(1,186,136) (884,314) 1,894,745 590,950 3,804,146 888,723
1,147,211$ (5,239,480)$ 149,492$ 1,907,435$ 2,460,817$ 661,549$
- 98 -

2005 2006 2007 2008
GENERAL FUND
Reserved 257,274$ 96,976$ 97,538$ 222,328$
Unreserved - undesignated 4,726,667 4,636,113 4,905,726 5,039,694
Nonspendable - - - -
Restricted - - - -
Unrestricted
Committed - - - -
Assigned - - - -
Unassigned - - - -
TOTAL GENERAL FUND 4,983,941$ 4,733,089$ 5,003,264$ 5,262,022$
ALL OTHER GOVERNMENTAL FUNDS
Reserved -$ 1,455,526$ 2,955,549$ 2,271,727$
Unreserved, reported in
Special Revenue Funds 1,044,710 501,978 401,022 1,208,681
Debt Service Funds 19,091 - - -
Capital Project Funds 2,969,003 601,901 6,573,870 6,154,477
Nonspendable - - - -
Restricted - - - -
Unrestricted
Committed - - - -
Assigned - - - -
Unassigned - - - -
TOTAL ALL OTHER GOVERNMENTAL
FUNDS 4,032,804$ 2,559,405$ 9,930,441$ 9,634,885$
Data Source
Audited Financial Statements
*The Village implemented GASB Statement No. 54 for the fiscal year ended April 30, 2012.
VILLAGE OF OSWEGO, ILLINOIS
FUND BALANCES OF GOVERNMENTAL FUNDS
Last Ten Fiscal Years
- 99 -

2009 2010 2011 2012* 2013 2014
138,934$ 160,365$ 154,338$ -$ -$ -$
4,799,544 5,461,181 4,372,535 - - -
- - - 88,206 128,249 158,983
- - - - - -
- - - - - -
- - - 5,021,748 5,021,748 5,358,071
- - - 891,528 606,285 1,180,021
4,938,478$ 5,621,546$ 4,526,873$ 6,001,482$ 5,756,282$ 6,697,075$
2,603,394$ 2,599,700$ 2,828,917$ -$ -$ -$
739,078 (242) - - - -
- - - - - -
991,902 263,626 349,405 - - -
- - - 313,658 260,251 226,679
- - - 2,253,504 2,628,725 2,909,877
- - - - - -
- - - 755,050 697,473 584,001
- - - - - -
4,334,374$ 2,863,084$ 3,178,322$ 3,322,212$ 3,586,449$ 3,720,557$
- 100 -

2005 2006 2007 2008
REVENUES
Taxes 3,909,703$ 4,487,332$ 5,014,388$ 5,923,856$
Telecommunication surcharge 853,278 - - -
Licenses and permits 1,273,831 2,553,194 2,626,747 1,762,818
Intergovernmental 2,178,452 2,319,621 2,442,523 2,587,649
Charges for services 344,262 1,406,122 1,439,999 1,603,959
Fines and forfeits 127,642 209,438 269,025 255,339
Transition fees 1,076,448 - - -
Franchise fees - - - -
Reimbursements - - - -
Contributions 210,546 - 372,236 136,582
Rents - - - -
Investment income 110,685 282,255 736,926 516,202
Miscellaneous 390,944 689,341 706,084 779,490
Total revenues 10,475,791 11,947,303 13,607,928 13,565,895
EXPENDITURES
General government 1,510,602 1,361,693 1,573,828 1,946,204
Building and zoning 712,483 693,129 800,393 1,000,940
Community development 335,868 313,529 357,065 464,973
Public safety 3,945,254 5,272,127 5,920,557 7,120,633
Public works 1,253,272 2,484,197 1,982,817 1,613,678
Retirement 460,219 539,628 633,103 -
Capital outlay 924,712 2,440,790 4,530,533 6,831,068
Debt service
Principal 280,000 405,000 125,000 500,000
Interest 55,506 138,441 378,275 555,028
Other charges 1,385 1,200 1,100 1,625
Total expenditures 9,479,301 13,649,734 16,302,671 20,034,149
EXCESS (DEFICIENCY) OF REVENUES
OVER EXPENDITURES 996,490 (1,702,431) (2,694,743) (6,468,254)
OTHER FINANCING SOURCES (USES)
Transfers in 515,631 1,600,276 1,137,048 1,606,398
Transfers (out) (14,624) (1,286,630) (800,000) (1,224,252)
Bonds issued at par 3,389,991 - 9,970,000 6,000,000
Premium on bonds issued - - - -
Payment to escrow agent - - - -
Discount on bonds issued (29,657) - - (48,000)
Proceeds from sale of capital assets - 70,366 28,906 13,427
Total other financing sources (uses) 3,861,341 384,012 10,335,954 6,347,573
NET CHANGE IN FUND BALANCES 4,857,831$ (1,318,419)$ 7,641,211$ (120,681)$
DEBT SERVICE AS A PERCENTAGE
OF NONCAPITAL EXPENDITURES 392.00% 4.85% 4.28% 7.84%
Data Source
Audited Financial Statements
VILLAGE OF OSWEGO, ILLINOIS
CHANGES IN FUND BALANCES OF GOVERNMENTAL FUNDS
Last Ten Fiscal Years
- 101 -

2009 2010 2011 2012 2013 2014
6,070,220$ 7,509,857$ 8,078,942$ 9,289,911$ 9,038,711$ 9,476,192$
- - - - - -
944,023 759,162 741,030 807,046 917,933 1,048,980
3,144,141 3,129,158 3,885,905 3,243,025 5,176,372 4,032,226
1,507,759 1,594,789 1,349,356 1,651,653 1,353,105 1,438,488
259,635 466,995 508,506 478,278 386,811 409,699
- - - - - -
- - - - - -
- - - - - -
66,208 66,394 59,168 46,926 - -
- - - - - -
229,198 74,953 100,039 92,563 57,097 35,528
745,738 674,537 798,293 743,581 830,654 1,004,152
12,966,922 14,275,845 15,521,239 16,352,983 17,760,683 17,445,265
2,337,350 2,570,171 2,368,944 2,083,617 2,159,799 2,292,962
783,117 692,072 573,687 602,123 616,216 637,964
564,967 417,585 353,320 467,525 489,809 698,354
7,144,164 7,281,450 7,555,771 7,759,427 7,926,878 8,526,113
1,845,856 2,114,545 1,659,059 1,949,282 1,974,580 2,426,556
- - - - - -
4,880,950 3,274,945 243,714 222,351 1,156,074 187,303
720,000 740,000 1,010,000 1,060,000 1,130,000 1,145,000
761,851 741,672 811,754 796,970 691,422 619,817
1,625 1,625 1,625 1,625 1,625 1,625
19,039,880 17,834,065 14,577,874 14,942,920 16,146,403 16,535,694
(6,072,958) (3,558,220) 943,365 1,410,063 1,614,280 909,571
2,070,351 1,888,737 1,821,696 2,143,087 1,901,294 1,779,063
(1,646,134) (1,888,737) (3,704,696) (1,817,617) (3,522,294) (1,779,063)
- 2,285,000 - 2,300,000 - 6,770,000
- - - 92,033 - 387,715
- - - (2,351,675) - (7,170,687)
- - - - - -
24,676 8,091 2,702 106 25,757 16,124
448,893 2,293,091 (1,880,298) 365,934 (1,595,243) 3,152
(5,624,065)$ (1,265,129)$ (936,933)$ 1,775,997$ 19,037$ 912,723$
10.43% 10.17% 12.53% 12.60% 11.48% 10.96%
- 102 -

VILLAGE OF OSWEGO, ILLINOIS
ASSESSED VALUE AND ESTIMATED ACTUAL VALUE OF TAXABLE PROPERTY
Last Ten Levy Years
Total Estimated Estimated
Total Taxable Direct Actual Actual
Levy Fiscal Residential Commercial Industrial Railroad Railroad Assessed Tax Taxable Taxable
Year Year Farm Property Property Property Local State Value Rate Value Value
2004 2005 845,537$ 428,720,119$ 63,514,300$ 7,074,855$ 9,200$ 27,693$ 500,191,704$ 0.1682 1,502,077,189$ 33.300%
2005 2006 853,932 527,855,050 78,769,511 7,509,528 9,200 27,849 615,025,070 0.1439 1,846,922,132 33.300%
2006 2007 696,570 623,511,609 83,409,340 7,640,570 9,010 27,693 715,294,792 0.1404 2,148,032,408 33.300%
2007 2008 725,042 714,402,997 112,097,740 8,141,000 9,390 27,693 835,403,862 0.1334 2,508,720,306 33.300%
2008 2009 1,015,643 768,055,888 120,267,641 8,426,867 9,200 27,693 897,802,932 0.1393 2,696,104,901 33.300%
2009 2010 1,011,885 790,703,227 132,681,817 8,887,396 3,000 27,693 933,315,018 0.1400 2,802,747,802 33.300%
2010 2011 874,234 748,097,856 132,123,809 8,779,509 3,015 27,693 889,906,116 0.1468 2,672,390,739 33.300%
2011 2012 916,416 700,657,817 126,530,094 8,573,857 3,015 27,693 836,708,892 0.1453 2,512,639,315 33.300%
2012 2013 959,934 645,685,646 124,345,342 8,468,446 3,015 27,723 779,490,106 0.1560 2,340,811,129 33.300%
2013 2014 1,038,430 615,982,517 119,791,336 8,090,629 - 27,693 744,930,605 0.1633 2,237,028,844 33.300%
Note: Property in the Village is reassessed each year. Property is assessed at 33% of actual value.
Data Source
Kendall County Clerk
- 103 -

Total Kendall
Bonds Direct County Kendall
Levy Fiscal and Police Tax Kendall Mental County
Year Year Corporate Interest IMRF Pension Audit Rate County Health Health
2004 2005 0.0300$ 0.0154$ 0.0366$ 0.0857$ 0.0005$ 0.1682$ 0.5578$ 0.0311$ 0.0305$
2005 2006 0.0171 - 0.0230 0.1038 - 0.1439 0.5559 0.0317 0.0280
2006 2007 0.0156 - 0.0232 0.1016 - 0.1404 0.5925 - -
2007 2008 0.0229 - 0.0205 0.0900 - 0.1334 0.5595 - -
2008 2009 0.0084 - 0.0317 0.0992 - 0.1393 0.5724 - -
2009 2010 0.0079 - 0.0259 0.1062 - 0.1400 0.5734 - -
2010 2011 0.0081 - 0.0246 0.1141 - 0.1468 0.6396 - -
2011 2012 - - 0.0228 0.1225 - 0.1453 0.6998 - -
2012 2013 - - 0.0205 0.1355 - 0.1560 0.7446 - -
2013 2014 - - 0.0042 0.1591 - 0.1633 0.8009 - -
Note: The Village basic property tax rate may be increased only by a majority vote of the Village's residents.
Rates for debt service are set based on each year's requirements.
Data Source
Kendall County Clerk
Village Direct Rates Overlapping Rates
VILLAGE OF OSWEGO, ILLINOIS
DIRECT AND OVERLAPPING PROPERTY TAX RATES
Last Ten Levy Years
- 104 -
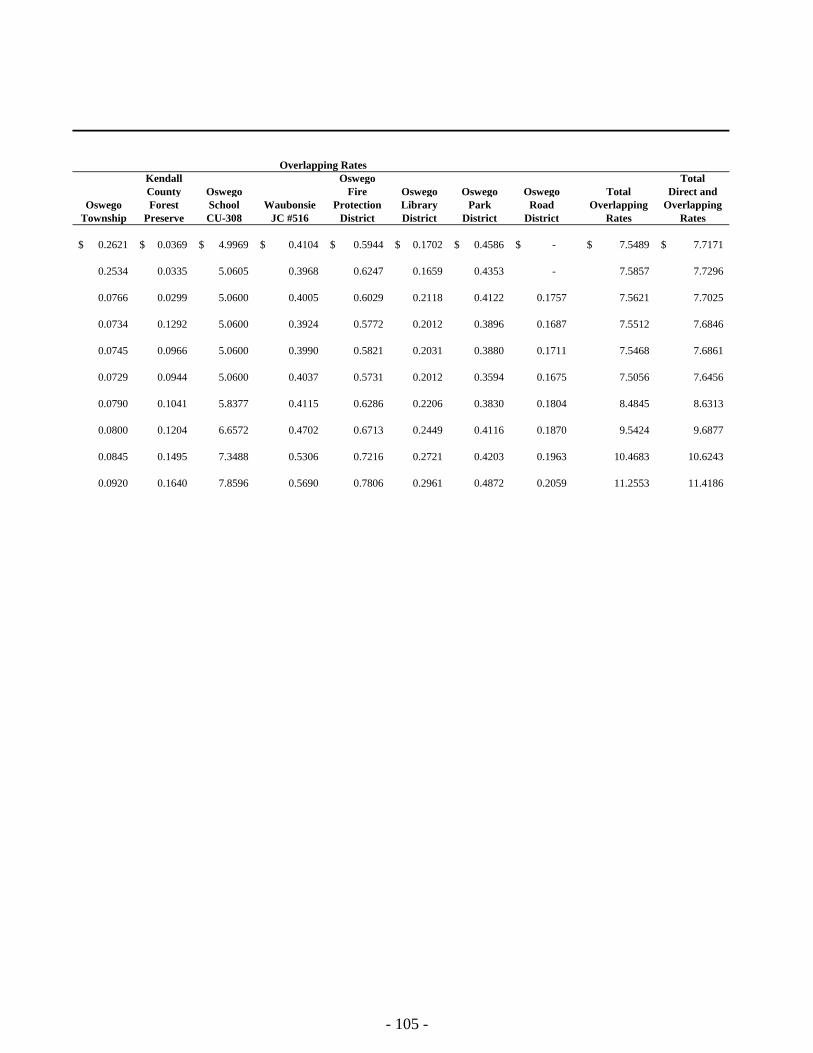
Kendall Oswego Total
County Oswego Fire Oswego Oswego Oswego Total Direct and
Oswego Forest School Waubonsie Protection Library Park Road Overlapping Overlapping
Township Preserve CU-308 JC #516 District District District District Rates Rates
0.2621$ 0.0369$ 4.9969$ 0.4104$ 0.5944$ 0.1702$ 0.4586$ -$ 7.5489$ 7.7171$
0.2534 0.0335 5.0605 0.3968 0.6247 0.1659 0.4353 - 7.5857 7.7296
0.0766 0.0299 5.0600 0.4005 0.6029 0.2118 0.4122 0.1757 7.5621 7.7025
0.0734 0.1292 5.0600 0.3924 0.5772 0.2012 0.3896 0.1687 7.5512 7.6846
0.0745 0.0966 5.0600 0.3990 0.5821 0.2031 0.3880 0.1711 7.5468 7.6861
0.0729 0.0944 5.0600 0.4037 0.5731 0.2012 0.3594 0.1675 7.5056 7.6456
0.0790 0.1041 5.8377 0.4115 0.6286 0.2206 0.3830 0.1804 8.4845 8.6313
0.0800 0.1204 6.6572 0.4702 0.6713 0.2449 0.4116 0.1870 9.5424 9.6877
0.0845 0.1495 7.3488 0.5306 0.7216 0.2721 0.4203 0.1963 10.4683 10.6243
0.0920 0.1640 7.8596 0.5690 0.7806 0.2961 0.4872 0.2059 11.2553 11.4186
Overlapping Rates
- 105 -

2004 2005 2006 2007 2008 2009 2010 2011 2012 2013
Village of Oswego 0.1682$ 0.1439$ 0.1404$ 0.1335$ 0.1393$ 0.1400$ 0.1468$ 0.1453$ 0.1560$ 0.1633$
Kendall County 0.5578 0.5559 0.5925 0.5595 0.5724 0.5734 0.6396 0.6998 0.7446 0.8009
Kendall County Mental Health 0.0311 0.0317 - - - - - - - -
Kendall County Health 0.0305 0.0280 - - - - - - - -
Oswego Township 0.2621 0.2534 0.0766 0.0734 0.0745 0.0729 0.0790 0.0800 0.0845 0.0920
Kendall County Forest Preserve 0.0369 0.0335 0.0299 0.1292 0.0966 0.0944 0.1041 0.1204 0.1495 0.1640
Oswego School CU-308 4.9969 5.0605 5.0600 5.0600 5.0600 5.0600 5.8377 6.6570 7.3488 7.8596
Waubonsie JC #516 0.4104 0.3968 0.4005 0.3924 0.3990 0.4037 0.4115 0.4702 0.5306 0.5690
Oswego Fire Protection District 0.5944 0.6247 0.6029 0.5772 0.5821 0.5731 0.6286 0.6713 0.7216 0.7806
Oswego Library District 0.1702 0.1659 0.2118 0.2012 0.2031 0.2012 0.2206 0.2449 0.2721 0.2961
Oswego Park District 0.4586 0.4353 0.4122 0.3896 0.3880 0.3594 0.3830 0.4116 0.4203 0.4872
Oswego Road District - - 0.1757 0.1687 0.1711 0.1675 0.1804 0.1870 0.1963 0.2059
TOTAL 7.7171$ 7.7296$ 7.7025$ 7.6847$ 7.6861$ 7.6456$ 8.6313$ 9.6875$ 10.6243$ 11.4186$
Property tax rates are per $100 of assessed valuation.
*Levy Year finances the subsequent fiscal year (i.e., Levy Year 2012 finances Fiscal Year 2014)
Data Source
Kendall County Clerk
VILLAGE OF OSWEGO, ILLINOIS
PROPERTY TAX RATES - PER $100 OF ASSESSED VALUATION - DIRECT AND OVERLAPPING GOVERNMENTS
Last Ten Levy Years
- 106 -

VILLAGE OF OSWEGO, ILLINOIS
PRINCIPAL PROPERTY TAXPAYERS
Current Year and Nine Years Ago
Percentage Percentage
of Total of Total
Village Village
Taxable Taxable Taxable Taxable
Assessed Assessed Assessed Assessed
Taxpayer Value Rank Valuation Value Rank Valuation
Inland Western Oswego Douglas 6,327,746$ 1 0.85% 6,317,830$ 1 0.88%
Farmington Lakes, LLC 5,232,066 2 0.70% 5,768,130 2 0.81%
Inland Western Oswego Gerry Centenial, LLC 4,296,807 3 0.58% - n/a 0.00%
VS Oswego LLC 4,088,670 4 0.55% - n/a 0.00%
Meijer Stores LTD Partnership 4,037,374 5 0.54% - n/a 0.00%
Wal-Mart Real Estate Business Trust 3,733,483 6 0.50% - n/a 0.00%
Target Corporation 2,255,050 7 0.30% 2,921,210 3 0.41%
Home Depot USA 2,057,653 8 0.28% 2,915,340 4 0.41%
Jewel Food Stores, Inc 1,818,771 9 0.24% - n/a 0.00%
Oswego Partners LLC 1,807,886 10 0.24% - n/a 0.00%
Inland Real Estate Towne Cross - n/a 0.00% 2,892,940 5 0.40%
Dreyer Clinic, Inc - n/a 0.00% 1,554,250 6 0.22%
Mason Square LLC - n/a 0.00% 1,376,060 7 0.19%
Goodrich Quality Theaters, Inc - n/a 0.00% 1,366,410 8 0.19%
Amoco Oil Co. - n/a 0.00% 1,346,770 9 0.19%
MicDanick Investments, LLC - n/a 0.00% 1,319,500 10 0.18%
35,655,506$ n/a 4.79% 27,778,440$ 3.88%
Data Source
Office of the County Clerk
2013 Levy 2004 Levy
- 107 -

VILLAGE OF OSWEGO, ILLINOIS
PROPERTY TAX LEVIES AND COLLECTIONS
Last Ten Levy Years
Collections
Levy Percentage in Subsequent Percentage
Year Tax Levied Amount of Levy Years Amount* of Levy
2004 841,319$ 841,620$ 100.04% -$ 841,620$ 100.04%
2005 885,020 874,069 98.76% 148 874,217 98.78%
2006 1,004,275 1,006,551 100.23% - 1,006,551 100.23%
2007 1,116,935 1,116,423 99.95% (36) 1,116,387 99.95%
2008 1,249,762 1,248,470 99.90% 666 1,249,136 99.95%
2009 1,306,268 1,303,787 99.81% (736) 1,303,051 99.75%
2010 1,306,204 1,304,363 99.86% 1,639 1,306,002 99.98%
2011 1,216,073 1,215,196 99.93% (466) 1,214,730 99.89%
2012 1,216,083 1,214,638 99.88% (258) 1,214,380 99.86%
2013 1,216,099 - 0.00% - - 0.00%
Note: Property in the Village is reassessed each year. Property is assessed at 33% of actual value.
** Total collections to date are the same as the amount collected during the fiscal year that the levy is financing.
Certain years may have collections greater than 100% as the County does not identify the tax year related
to prior year collections.
Data Source
Office of the County Clerk
Collected within the
Fiscal Year of the Levy Total Collections to Date**
- 108 -

VILLAGE OF OSWEGO, ILLINOIS
DIRECT AND OVERLAPPING SALES TAX RATES
Last Ten Calendar Years
County
Village Public
Calendar Direct County Safety State
Year Rate Rate Rate Rate Total
2005 1.00% 0.25% 0.50% 5.00% 6.75%
2006 1.00% 0.25% 0.50% 5.00% 6.75%
2007 1.00% 0.25% 0.50% 5.00% 6.75%
2008 1.00% 0.25% 1.00% 5.00% 7.25%
2009 1.00% 0.25% 1.00% 5.00% 7.25%
2010 1.00% 0.25% 1.00% 5.00% 7.25%
2011 1.00% 0.25% 1.00% 5.00% 7.25%
2012 1.00% 0.25% 1.00% 5.00% 7.25%
2013 1.50% 0.25% 1.00% 5.00% 7.75%
2014 1.50% 0.25% 1.00% 5.00% 7.75%
Data Source
Department of Revenue
- 109 -

VILLAGE OF OSWEGO, ILLINOIS
GENERAL SALES TAX BY CATEGORY
Last Ten Calendar Years
Calendar Year 2004 2005 2006 2007 2008 2009 2010 2011 2012 2013
General merchandise 386,487$ 427,467$ 543,782$ 835,823$ 1,026,304$ 1,017,002$ 1,044,682$ 897,868$ 1,052,030$ 1,032,790$
Food 655,955 687,128 687,390 626,897 469,987 608,638 561,369 520,995 465,110 477,393
Drinking and eating places 242,078 281,626 366,868 388,960 418,317 543,990 538,906 566,591 598,064 639,448
Apparel 33,842 42,128 53,429 182,697 203,385 200,655 228,374 379,146 252,180 263,034
Furniture & H.H. & Radio 35,603 36,501 49,469 251,549 310,674 260,491 267,536 266,894 246,453 229,101
Lumber, building hardware 550,776 555,657 407,660 433,350 366,169 302,034 313,492 281,290 215,643 249,375
Automobile and filling stations 520,992 569,694 591,150 869,332 1,033,223 1,004,753 1,113,413 1,309,894 1,467,995 1,497,855
Drugs and miscellaneous retail 319,011 356,124 403,803 469,358 489,005 501,300 550,689 578,602 665,416 693,093
Agriculture and all others 200,887 246,646 264,769 305,607 258,909 184,054 132,674 186,966 369,659 324,119
Manufacturers 13,025 12,687 15,849 20,973 24,764 76,516 74,224 23,368 23,555 23,724
TOTAL 2,958,656$ 3,215,658$ 3,384,169$ 4,384,546$ 4,600,736$ 4,699,433$ 4,825,359$ 5,011,615$ 5,356,105$ 5,429,931$
VILLAGE DIRECT SALES
TAX RATE 1.00% 1.00% 1.00% 1.00% 1.00% 1.00% 1.00% 1.00% 1.00% 1.00%
Data Source
Illinois Department of Revenue
Data available for calendar year only
- 110 -

VILLAGE OF OSWEGO, ILLINOIS
HOME RULE SALES TAX BY CATEGORY
Last Ten Calendar Years
Calendar Year 2004 2005 2006 2007 2008 2009 2010 2011 2012 2013
General Merchandise -$ -$ -$ -$ -$ -$ 200,098$ 317,148$ 358,345$ 355,684$
Food - - - - - - 61,378 109,599 79,882 82,826
Drinking and Eating Places - - - - - - 132,401 279,711 294,925 317,169
Apparel - - - - - - 59,752 155,532 126,033 131,438
Furniture & H.H. & Radio - - - - - - 74,095 131,635 121,668 113,174
Lumber, Building Hardware - - - - - - 74,964 140,120 107,447 124,058
Automobile and Filling Stations - - - - - - 128,593 292,333 315,667 284,747
Drugs and Miscellaneous Retail - - - - - - 90,094 189,861 229,725 233,106
Agriculture and All Others - - - - - - 26,246 79,016 176,477 153,561
Manufacturers - - - - - - 16,907 9,130 9,547 9,736
TOTAL -$ -$ -$ -$ -$ -$ 864,528$ 1,704,085$ 1,819,716$ 1,805,500$
VILLAGE HOME RULE
TAX RATE 0.50% 0.50% 0.50% 0.50% 0.50% 0.50% 0.50% 0.50% 0.50% 0.50%
Note: Home Rule Tax established July 1, 2010. Data before that is not applicable.
Data Source
Illinois Department of Revenue
Data available for Calendar Year only
- 111 -

General General
Obligation Obligation Other Percentage
Fiscal General Alternate IEPA Alternate Governmental Total of
Year Obligation Revenue Installment Loans Revenue Loans Primary Personal Per
Ended Bonds Bonds Contract Payable Bonds Payable Government Income* Capita*
2005 290,000$ 3,300,000$ 89,991$ 1,971,377$ 10,010,000$ -$ 15,661,368$ 2.88% 785$
2006 - 3,185,000 45,956 1,852,504 9,395,000 - 14,478,460 2.67% 726
2007 - 13,030,000 - 1,773,982 10,350,000 - 25,153,982 4.63% 1,260
2008 - 18,530,000 - 1,684,310 13,055,000 - 33,269,310 6.13% 1,667
2009 - 17,810,000 - 1,578,760 12,115,000 - 31,503,760 3.94% 1,073
2010 - 19,355,000 - 1,470,363 17,875,000 - 38,700,363 3.91% 1,275
2011 - 18,345,000 - 1,359,041 16,870,000 - 36,574,041 3.85% 1,188
2012 - 17,325,000 - 1,244,716 15,850,000 - 34,419,716 3.62% 1,118
2013 - 16,195,000 - 1,127,309 14,635,000 - 31,957,309 3.36% 1,038
2014 - 15,970,483 - 1,006,733 14,001,417 - 30,978,633 2.96% 1,007
Note: Details of the Village's outstanding debt can be found in the notes to financial statements.
Data Source: Village Finance Department
See the schedule of Demographic and Economic Information on page 116 for personal income and population.
Business-Type
Activities
VILLAGE OF OSWEGO, ILLINOIS
RATIOS OF OUTSTANDING DEBT BY TYPE
Last Ten Fiscal Years
Governmental
Activities
- 112 -
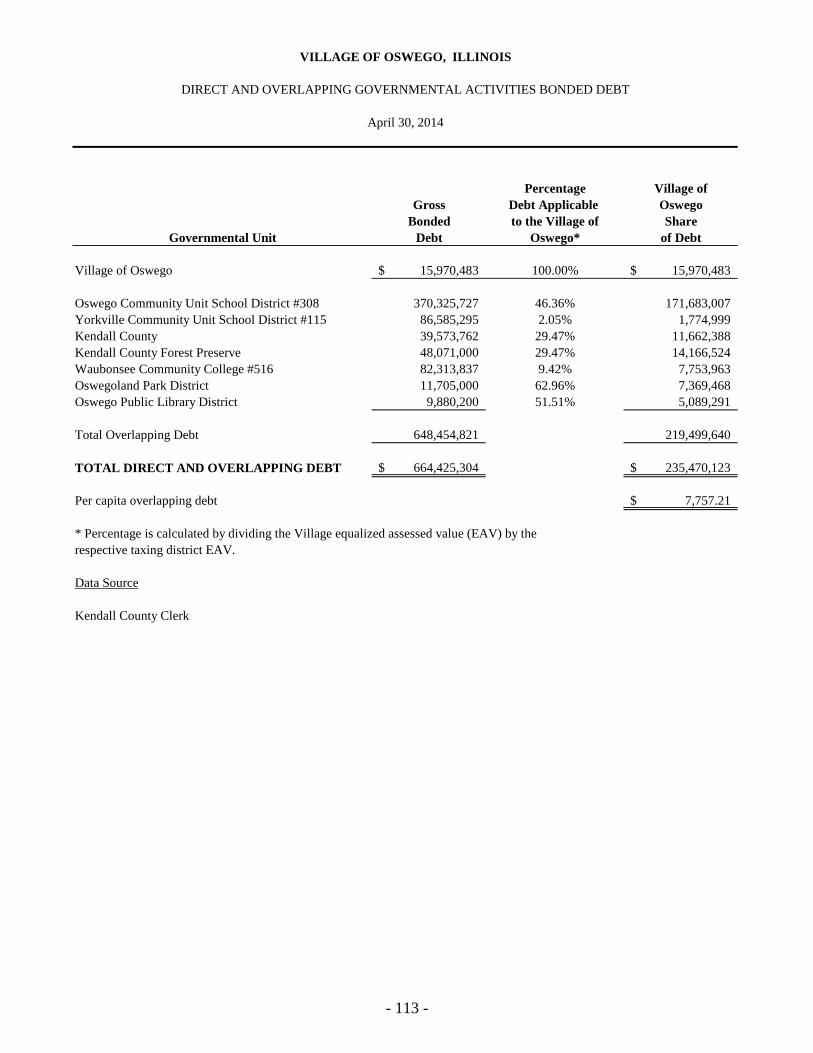
VILLAGE OF OSWEGO, ILLINOIS
DIRECT AND OVERLAPPING GOVERNMENTAL ACTIVITIES BONDED DEBT
April 30, 2014
Percentage Village of
Gross Debt Applicable Oswego
Bonded to the Village of Share
Governmental Unit Debt Oswego* of Debt
Village of Oswego 15,970,483$ 100.00% 15,970,483$
Oswego Community Unit School District #308 370,325,727 46.36% 171,683,007
Yorkville Community Unit School District #115 86,585,295 2.05% 1,774,999
Kendall County 39,573,762 29.47% 11,662,388
Kendall County Forest Preserve 48,071,000 29.47% 14,166,524
Waubonsee Community College #516 82,313,837 9.42% 7,753,963
Oswegoland Park District 11,705,000 62.96% 7,369,468
Oswego Public Library District 9,880,200 51.51% 5,089,291
Total Overlapping Debt 648,454,821 219,499,640
TOTAL DIRECT AND OVERLAPPING DEBT 664,425,304$ 235,470,123$
Per capita overlapping debt 7,757.21$
* Percentage is calculated by dividing the Village equalized assessed value (EAV) by the
respective taxing district EAV.
Data Source
Kendall County Clerk
- 113 -
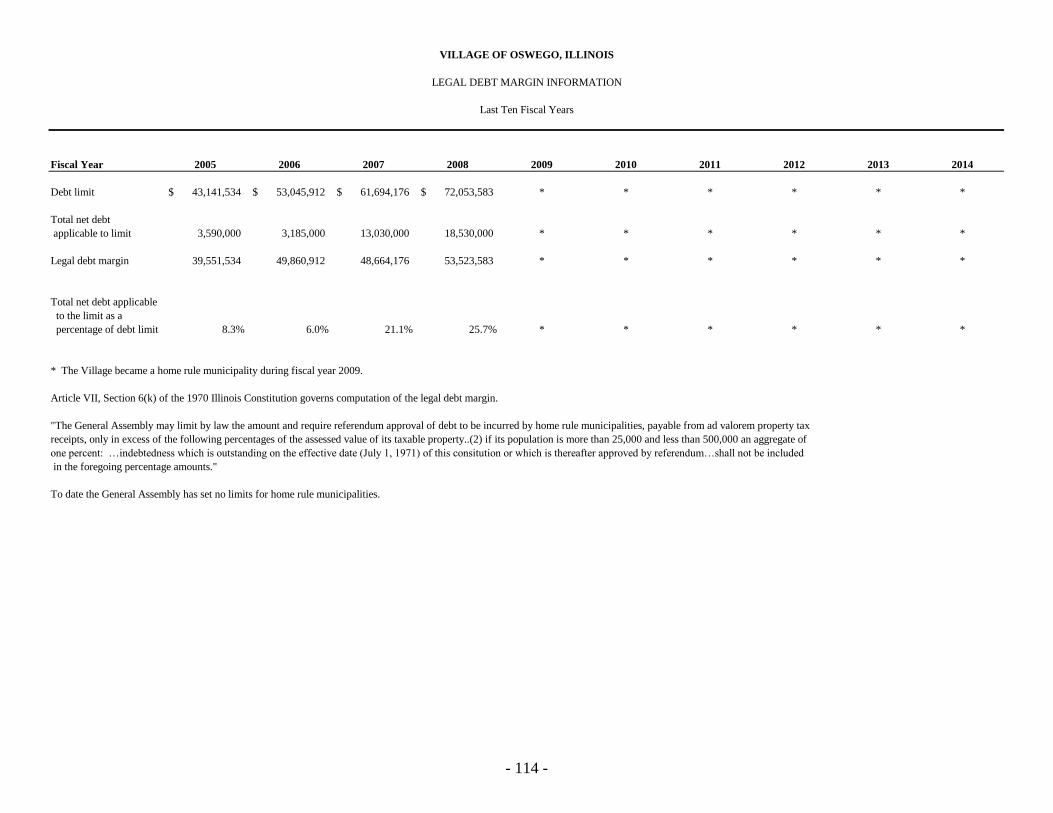
VILLAGE OF OSWEGO, ILLINOIS
LEGAL DEBT MARGIN INFORMATION
Last Ten Fiscal Years
Fiscal Year 2005 2006 2007 2008 2009 2010 2011 2012 2013 2014
Debt limit 43,141,534$ 53,045,912$ 61,694,176$ 72,053,583$ * * * * * *
Total net debt
applicable to limit 3,590,000 3,185,000 13,030,000 18,530,000 * * * * * *
Legal debt margin 39,551,534 49,860,912 48,664,176 53,523,583 * * * * * *
Total net debt applicable
to the limit as a
percentage of debt limit 8.3% 6.0% 21.1% 25.7% * * * * * *
* The Village became a home rule municipality during fiscal year 2009.
Article VII, Section 6(k) of the 1970 Illinois Constitution governs computation of the legal debt margin.
"The General Assembly may limit by law the amount and require referendum approval of debt to be incurred by home rule municipalities, payable from ad valorem property tax
receipts, only in excess of the following percentages of the assessed value of its taxable property..(2) if its population is more than 25,000 and less than 500,000 an aggregate of
one percent: …indebtedness which is outstanding on the effective date (July 1, 1971) of this consitution or which is thereafter approved by referendum…shall not be included
in the foregoing percentage amounts."
To date the General Assembly has set no limits for home rule municipalities.
- 114 -

VILLAGE OF OSWEGO, ILLINOIS
PLEDGED-REVENUE COVERAGE
Last Ten Fiscal Years
Sales Net
Fiscal Tax Available Debt Service
Year Revenue Revenue Principal Interest Coverage
2005 2,159,366$ 2,159,366$ 205,000$ 50,591$ 8.45$
2006 2,489,674 2,489,674 330,000 136,491 5.34
2007 2,913,178 2,913,178 125,000 379,375 5.78
2008 3,510,620 3,510,620 500,000 556,653 3.32
2009 3,475,795 3,475,795 720,000 763,476 2.34
2010 4,072,717 4,072,717 740,000 743,297 2.75
2011 5,349,488 5,349,488 1,010,000 813,379 2.93
2012 6,039,346 6,039,346 1,060,000 798,595 3.25
2013 6,129,126 6,129,126 1,130,000 693,047 3.36
2014 6,401,637 6,401,637 1,145,000 621,442 3.62
Note: Details of the Village's outstanding debt can be found in the notes to financial statements.
GOVERNMENTAL ACTIVITIES
General Obligation Bonds
- 115 -
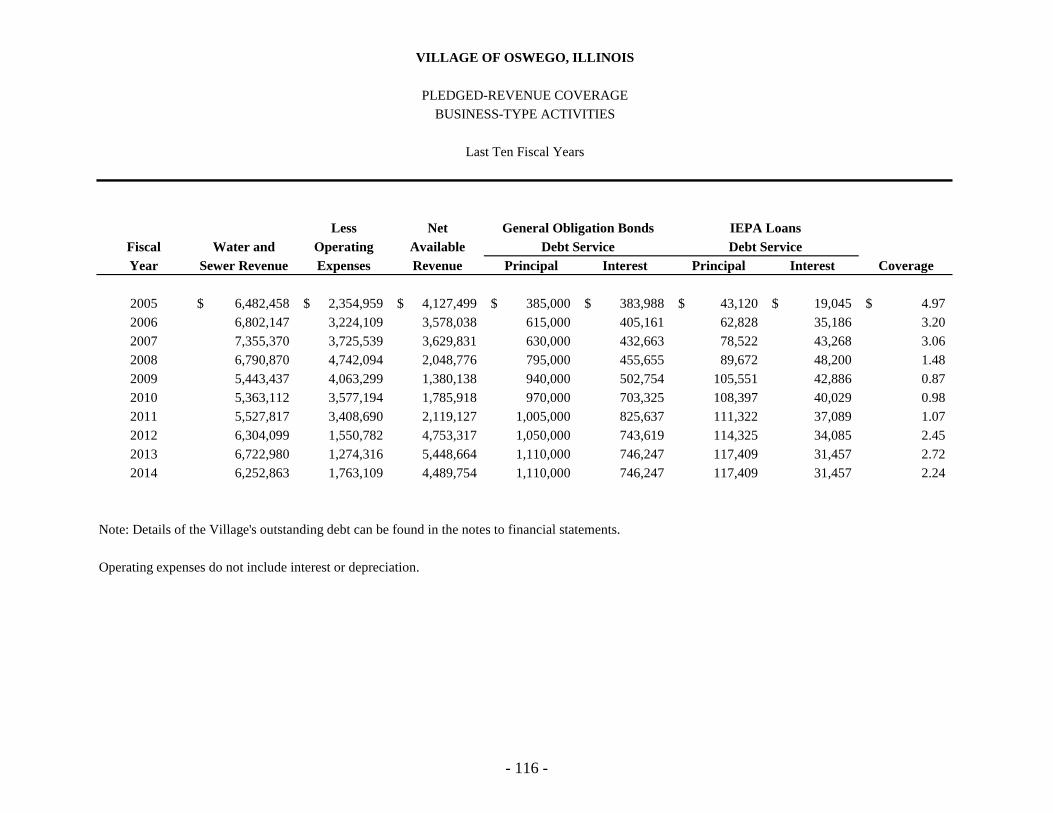
VILLAGE OF OSWEGO, ILLINOIS
PLEDGED-REVENUE COVERAGE
BUSINESS-TYPE ACTIVITIES
Last Ten Fiscal Years
Less Net
Fiscal Water and Operating Available Debt Service Debt Service
Year Sewer Revenue Expenses Revenue Principal Interest Principal Interest Coverage
2005 6,482,458$ 2,354,959$ 4,127,499$ 385,000$ 383,988$ 43,120$ 19,045$ 4.97$
2006 6,802,147 3,224,109 3,578,038 615,000 405,161 62,828 35,186 3.20
2007 7,355,370 3,725,539 3,629,831 630,000 432,663 78,522 43,268 3.06
2008 6,790,870 4,742,094 2,048,776 795,000 455,655 89,672 48,200 1.48
2009 5,443,437 4,063,299 1,380,138 940,000 502,754 105,551 42,886 0.87
2010 5,363,112 3,577,194 1,785,918 970,000 703,325 108,397 40,029 0.98
2011 5,527,817 3,408,690 2,119,127 1,005,000 825,637 111,322 37,089 1.07
2012 6,304,099 1,550,782 4,753,317 1,050,000 743,619 114,325 34,085 2.45
2013 6,722,980 1,274,316 5,448,664 1,110,000 746,247 117,409 31,457 2.72
2014 6,252,863 1,763,109 4,489,754 1,110,000 746,247 117,409 31,457 2.24
Note: Details of the Village's outstanding debt can be found in the notes to financial statements.
Operating expenses do not include interest or depreciation.
IEPA LoansGeneral Obligation Bonds
- 116 -

Per
Capita
Personal Personal Unemployment
Population Income Income Rate
2005 * 19,956 542,883,024$ 27,204$ 4.8%
2006 19,956 542,883,024 27,204 4.6%
2007 19,956 542,883,024 27,204 3.8%
2008 19,956 542,883,024 27,204 3.9%
2009 * 29,364 798,818,256 27,204 5.2%
2010 ** 30,355 954,543,330 31,446 8.5%
2011 *** 30,780 950,763,420 30,889 8.7%
2012 30,750 1,013,058,750 32,945 8.0%
2013 30,750 1,033,384,500 33,606 8.3%
2014 30,750 1,046,914,500 33,406 7.0%
* Population change in 2005 and 2009 due to Special Census data received from Census Bureau.
** Per capita personal income stated in 2008 inflation-adjusted dollars.
*** Per capita personal income stated in 2009 inflation-adjusted dollars.
Data Source
U.S. Census Bureau Fact Sheet
Year
VILLAGE OF OSWEGO, ILLINOIS
DEMOGRAPHIC AND ECONOMIC INFORMATION
Last Ten Fiscal Years
Fiscal
- 117 -

% of % of
Total Village Total Village
Employer Rank Number Population Employer Rank Number Population
Oswego Comm. Unit School Dist. No. 308 1 1,887 6.1% Oswego Comm. Unit School Dist. No. 308 1 1400 7.0%
Meijer Corporation 2 300 1.0% Wal-Mart Stores, Inc. 2 450 2.3%
Jewel/Osco 3 280 0.9% Meijer Corporation 3 425 2.1%
Wal-Mart Stores, Inc. 4 270 0.9% Dominck's Fresh Foods, Inc. 4 275 1.4%
Kohl's 5 225 0.7% Jewel/Osco 5 275 1.4%
Radiac Abrasives, Inc. 6 150 0.5% Lowe's Home Improvement 6 250 1.3%
Target Corporation 7 125 0.4% Target Corporation 7 250 1.3%
Home Depot USA 8 120 0.4% Home Depot USA 8 250 1.3%
Village of Oswego 8 120 0.4% Kohl's 9 225 1.1%
Anfinsen Assembly, Inc. 9 75 0.2% Anfinsen Assembly, Inc. 10 150 0.8%
Data Source
Oswego Economic Development Corporation
2014 2005
VILLAGE OF OSWEGO, ILLINOIS
PRINCIPAL EMPLOYERS
Current Year and Nine Years Ago
- 118 -
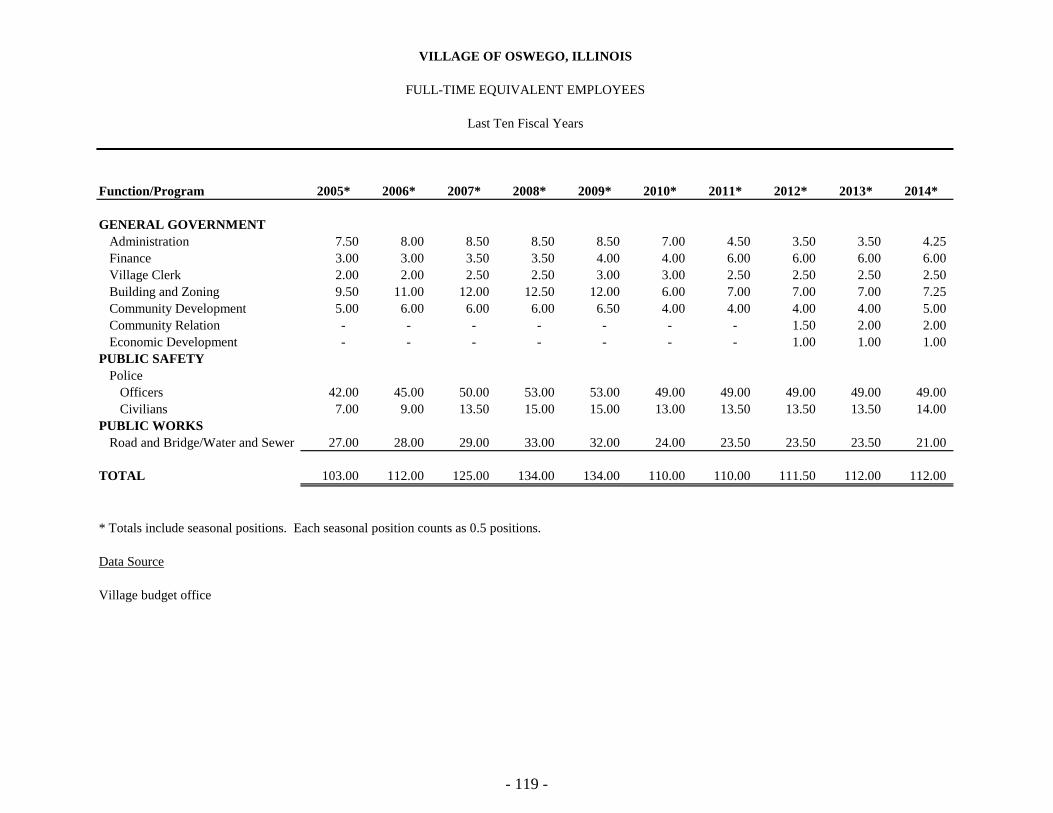
Function/Program 2005* 2006* 2007* 2008* 2009* 2010* 2011* 2012* 2013* 2014*
GENERAL GOVERNMENT
Administration 7.50 8.00 8.50 8.50 8.50 7.00 4.50 3.50 3.50 4.25
Finance 3.00 3.00 3.50 3.50 4.00 4.00 6.00 6.00 6.00 6.00
Village Clerk 2.00 2.00 2.50 2.50 3.00 3.00 2.50 2.50 2.50 2.50
Building and Zoning 9.50 11.00 12.00 12.50 12.00 6.00 7.00 7.00 7.00 7.25
Community Development 5.00 6.00 6.00 6.00 6.50 4.00 4.00 4.00 4.00 5.00
Community Relation - - - - - - - 1.50 2.00 2.00
Economic Development - - - - - - - 1.00 1.00 1.00
PUBLIC SAFETY
Police
Officers 42.00 45.00 50.00 53.00 53.00 49.00 49.00 49.00 49.00 49.00
Civilians 7.00 9.00 13.50 15.00 15.00 13.00 13.50 13.50 13.50 14.00
PUBLIC WORKS
Road and Bridge/Water and Sewer 27.00 28.00 29.00 33.00 32.00 24.00 23.50 23.50 23.50 21.00
TOTAL 103.00 112.00 125.00 134.00 134.00 110.00 110.00 111.50 112.00 112.00
* Totals include seasonal positions. Each seasonal position counts as 0.5 positions.
Data Source
Village budget office
VILLAGE OF OSWEGO, ILLINOIS
FULL-TIME EQUIVALENT EMPLOYEES
Last Ten Fiscal Years
- 119 -

Function/Program 2005 2006 2007 2008 2009 2010 2011 2012 2013 2014
Building and Zoning
Permits issued 1,080 1,754 2,098 1,642 1,123 1,492 982 1,285 1,191 1,585
Community Development
Total year end requested projects 57 64 84 40 46 45 47 38 34 48
Total year end projects approved 83 88 109 39 45 45 46 27 32 45
Public Safety
Police
Physical arrests 798 1,302 1,326 1,382 1,371 1,140 1,201 1,174 997 748
Parking violations 387 882 1,600 1,174 758 1,137 505 604 1,225 1,297
Traffic violations 10,639 18,663 20,136 6,172 4,565 5,033 5,246 11,622 12,548 10,841
Criminal reports 3,998 4,948 5,096 2,335 2,185 1,770 1,862 4,339 3,982 1,436
Calls for service 30,847 44,385 50,837 51,918 46,378 47,813 25,128 22,607 23,568 22,885
Road and Bridge
Pothole repairs (tons) 45 47 33 99 94 65 109 - 37 80
Parkway tree replacement 60 17 1 48 57 - 1 - 586 546
Water
Number of accounts 7,810 8,965 9,624 10,061 10,350 10,344 10,597 10,733 10,829 10,873
Total annual consumption 762,958,040 886,948,175 878,522,150 930,759,000 898,847,000 895,657,000 868,978,000 909,085,000 971,176,000 934,131,000
Average daily consumption 2,090,296 2,429,995 2,406,910 2,550,025 2,462,595 2,453,855 2,380,762 2,490,644 2,660,756 2,559,263
Peak daily consumption 3,631,000 5,071,000 5,289,000 5,692,000 5,951,000 4,588,000 4,146,000 4,723,000 4,943,000 4,683,000
Water main breaks 12 8 4 9 13 7 9 - 9 3
Water service repairs 3 3 3 7 8 11 69 - 74 153
Main line valve repairs - 5 - 1 - - 5 - 1 0
Fire hydrant replacements - - 2 3 1 - 4 - 2 4
n/a = not available
Data Source
Various Village Departments
VILLAGE OF OSWEGO, ILLINOIS
OPERATING INDICATORS
Last Ten Fiscal Years
- 120 -

Function/Program 2005 2006 2007 2008 2009 2010 2011 2012 2013 2014
PUBLIC SAFETY
Police
Stations 1 1 1 1 1 1 1 1 1 1
Patrol units 32 30 34 34 38 37 34 34 32 34
PUBLIC WORKS
Miles of streets 97 115 125 125 128 128 128 128 128 129
Streetlights 1,770 2,000 2,094 2,094 2,120 2,126 2,133 2,145 2,149 2,149
Traffic signals 16 16 20 20 20 20 20 20 20 24
WATER
Water mains (miles) 110 119 159 159 161 161 161 161 162 162
Fire hydrants 2,099 2,400 2,400 2,400 2,517 2,511 2,503 2,543 2,544 2,543
Storage capacity (gallons) 3,500,000 3,500,000 3,500,000 3,500,000 3,800,000 3,800,000 5,300,000 5,300,000 5,300,000 5,300,000
n/a = not available
Data Source
Various village departments
VILLAGE OF OSWEGO, ILLINOIS
CAPITAL ASSET STATISTICS
Last Ten Fiscal Years
- 121 -