Embed Size (px)
Citation preview

VII/1
Atmospheric transport and chemistry lecture
I. Introduction
II. Fundamental concepts in atmospheric dynamics: Brewer-Dobson circulation and waves
III. Radiative transfer, heating and vertical transport
IV. Stratospheric ozone chemistry
V. The tropical tropopause
VI. Climate gases
VII. Solar variability
1 The sun
2 Solar radiation changes, climate & ozone
3 Solar particles and the middle atmosphere

VII/2
Solar irradiance provides energy to the earth system
Turco 1997
SW heatingUV/Vis/NIR
LW coolingThermal IR

VII/3
Solar irradiance at TOA: near UV/Vis/IR
Weber et al., 1998, Weber 1999
Skupin et al., 2005
05-MAR-2004
Ca II
H

VII/4
MgII h and k emission
Fraunhofer lines:wing: absorption originating
in the photosphere (T~6000K)
core: emission, originating in the chromophere/transition region
Rottmann et al., 2005

VII/5
Mg II index chromospheric activity index from GOME
UV solar activity proxy from core-to-wing ratio of Mg II line
insensitive to optical degradation
linearly correlates well with UV and EUV wavelength variations down to 30 nm (Viereck et al. 2001)

VII/6
Solar UV irradiance variability
Mg II index is a suitable proxy for modelling solar UV and EUV variability (Viereck et al. 2001)
suitable proxy for modelling UV irradiance in climate models and for TSI reconstruction (Fröhlich et al. 2004)
VII/7
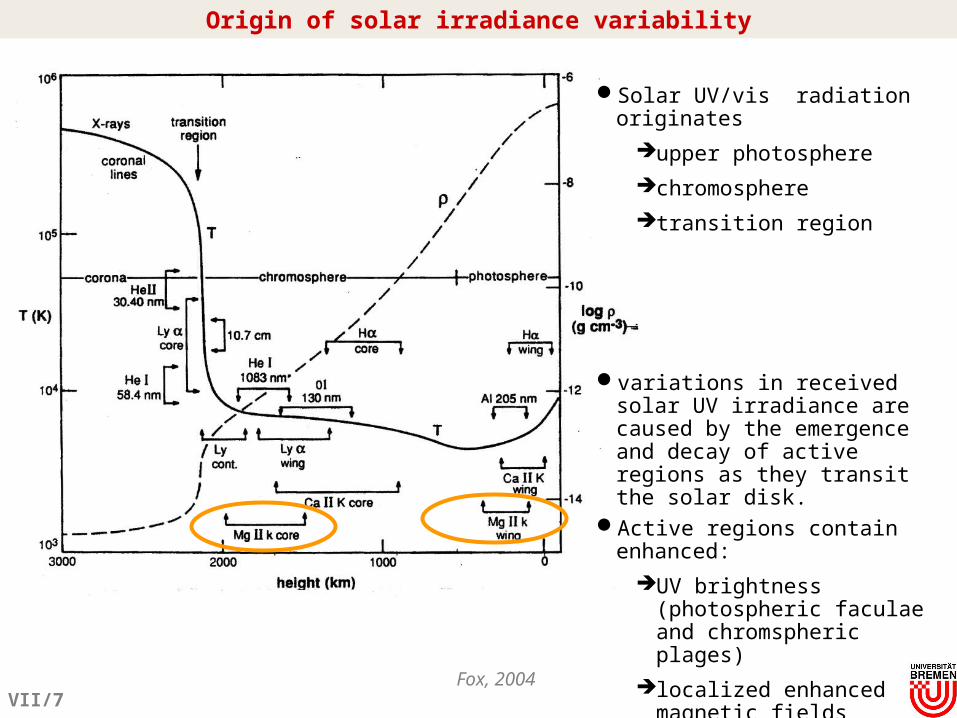
Origin of solar irradiance variability
variations in received solar UV irradiance are caused by the emergence and decay of active regions as they transit the solar disk.
Active regions contain enhanced:
UV brightness (photospheric faculae and chromspheric plages)
localized enhanced magnetic fields
Solar UV/vis radiation originates
upper photosphere
chromosphere
transition region
Fox, 2004

VII/8
origin of solar irradiance variability
H continuum image (white light)
H line center emission

VII/9

VII/10
The magnetic flux at the solar surface also varies quasi-periodicallyover the 11-year solar cycle.
MaximumMaximumMaximumMaximum
Magnetic fluxMagnetic flux MinimumMinimum
X-raysX-rays
The short-wave radiation varies strongly throughthe activity cycle: from a factor 2 in the UV (<100nm) up to a factor 100 in X-rays.
The solar activity cycle
VII/11
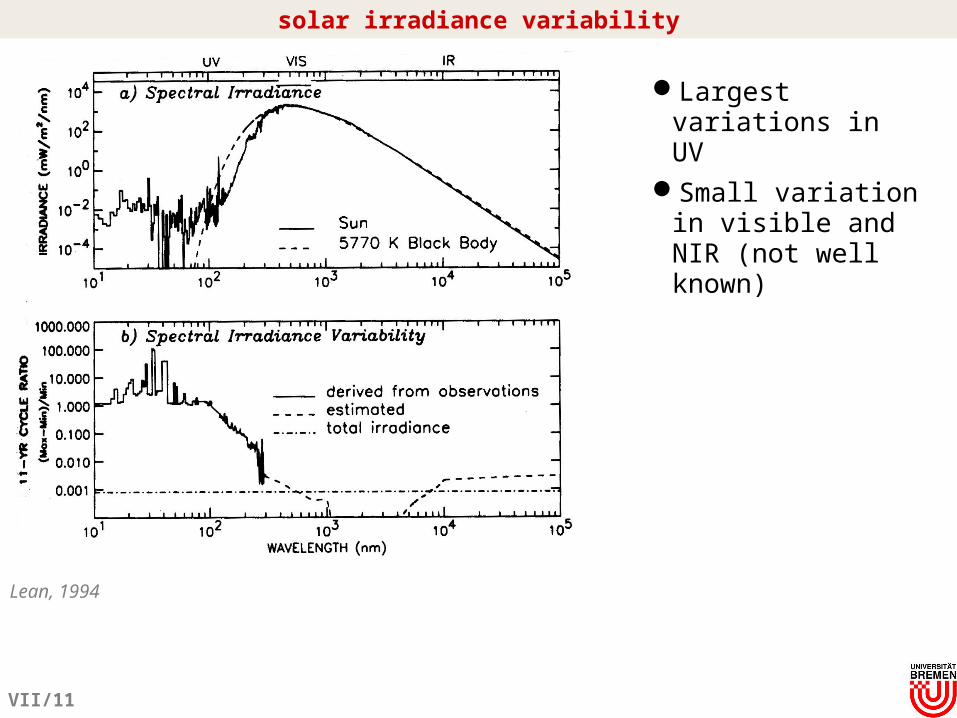
solar irradiance variability
Largest variations in UV
Small variation in visible and NIR (not well known)
Lean, 1994

VII/12
UV variation from solar minimum (1996) to maximum (1992)
UV variation below 400 nm linearly correlates with MgII index (280 nm)
(Rottmann, 2000
UARS/SOLSTICE

VII/13
Total solar irradiance from space („solar constant“)
CGD, NCARPMOD TSI
0.1%
Froehlich, priv. comm.
VII/14
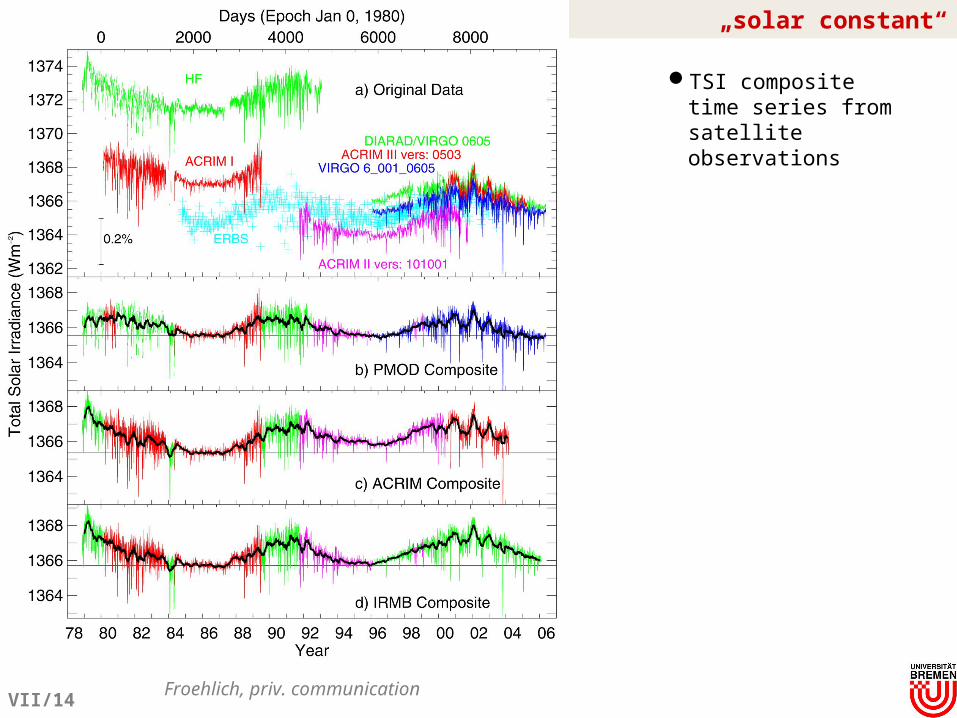
„solar constant“
TSI composite time series from satellite observations
Froehlich, priv. communication

VII/15
Modelled TSI contribution
UV (<400 nm) contributes 8% to TSI
60% of TSI variability comes from the UV (<400 nm)
Lean et al. (1997) estimated abt. 30% contribution from 200-400 nm varibility to that of TSI (from SOLSTICE observations)
Krivova et al. 2006Krivova et al. 2006
500 nm50 nm 100 nm
≈60%
≈8%

VII/16
Contribution to TSI variability
Lean et al., 1997

VII/17
Solar indices
Various solar indices show variation with the 11 year solar cycle and 27 d solar rotation (full disc)
UV brightening competing with sunspot darkening (VIS)
Mg index starts in 1978F10.8 since the early 1900sSunspots counts since 1700s
122 nm
VII/18
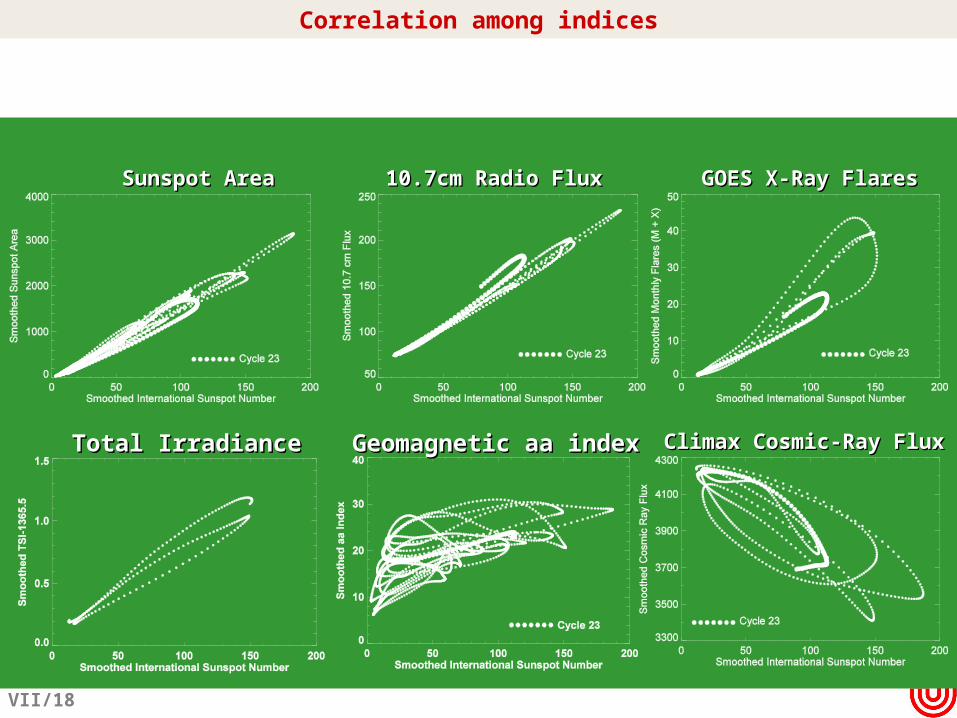
Correlation among indices
Sunspot AreaSunspot Area 10.7cm Radio Flux10.7cm Radio Flux GOES X-Ray FlaresGOES X-Ray Flares
Climax Cosmic-Ray FluxClimax Cosmic-Ray FluxGeomagnetic aa indexGeomagnetic aa indexTotal IrradianceTotal Irradiance

VII/19
Penetration depth of solar radiation in the atmosphere
Liou, 2002
Thuillier et al., 2004

VII/20
Solar influence on climate
Climate impact from periodic earth events
some evidence for surface T response to solar variability on time scales longer than the 11y cycle (before 1980)
solar influence

VII/21
Milankovich cycles: changes in earth orbit parameters
~41ky
~100ky
~19 and 24 ky
obliquity
excentricity
precession
Changes in earth
parametersChange in solar
insolation

VII/22
Milankovich cycles: climate impact
solar insulation anomaly
ice volume derivative
Wallace & Hobbs 2005

VII/23
Global warming & cooling
Lohmann, priv. communication

VII/24
Solar variability and climate: recent past
TSI about 0.25% lower than current values during Maunder minimum
Sunsp
ot
num
bers Maunder
mínimumDalton
mínimum

VII/25
recent trends
solarwave drivingBD circulationaerosol
ESC
Total ozone trends: mid- to high NH latitudes
Dhomse et al. (2006)
Increase in NH total ozone since mid ninetiesincrease in BD circulation strength rise of solar cycle 23return to stratospheric aerosol background conditions after
Pinatubo eruption

VII/26
Global ozone trends and solar cycle variability
WMO 2006, Chapter 3

VII/27
Global ozone trends and solar cycle variability
WMO 2006, Chapter 3
Models do not show the double peak (25 and 50 km altitude)
Possible reasons Data record too short (~2.5 solar cycles) NOx from particle (electron precipitation) leads to ozone destruction during solar minimum in middle stratosphere -> BUT:
equires „huge“ amounts of Nox Reduced ozone production (less sunlight) in middle stratosphere from enhanced ozone in the upper stratosphere Interference from QBO and other dynamical effects Lower stratospheric solar signature are probbaly from dynamical response to solar variability

VII/28
Dynamics
Δ Absorption ofsolar UV-radiation
Δ NOx / HOx
chemistry
Δ UV Δ CP
Temperature
Ozone
Coupling between solar variability and atmospheric dynamics

VII/29
Solar coupling & planetary waves & polar O3 loss
extra solar heating during solar max strengthens subtropical stratopause jet (SJ) in early winter
radiative response
Strengthening of westerlies (SJ) means reduced wave progation and reduced BD circulation /warming of tropical tropopause region in early einter
dynamical response
Deflection of planetary waves away from subtropics (towards pole) while SJ descends downwards and polewards leading to a waekening weakening of polar night jet (polar vortex) in mid- to late winter
warmer polar stratospheric temperatures with reduced polar ozone loss in late winter
chemical responseKodera and Kuroda (2002)

VII/30
U and T response to solar cycle
Change in zonal mean wind (u) in m/s and zonal mean temperature (T) in K for a cahnge of 100 sfu (F10.8 units)
From solar minimum to maximum ~120 sfu
T
u

VII/31
Solar coupling and QBO
extra solar heating during solar max strengthens subtropical stratopause jet (SJ) in early winter
radiative response
Strengthening of westerlies (SJ) means reduced wave progation and reduced BD circulation /warming of tropical tropopause region in early einter
dynamical response
Deflection of planetary waves away from subtropics (towards pole) while SJ descends downwards and polewards leading to a waekening weakening of polar night jet (polar vortex) in mid- to late winter
warmer polar stratospheric temperatures with reduced polar ozone loss in late winter
chemical response
Update from Labitzke,1987, and Labitzke and van Loon, 1988
mostly during QBO west phase
VII/32
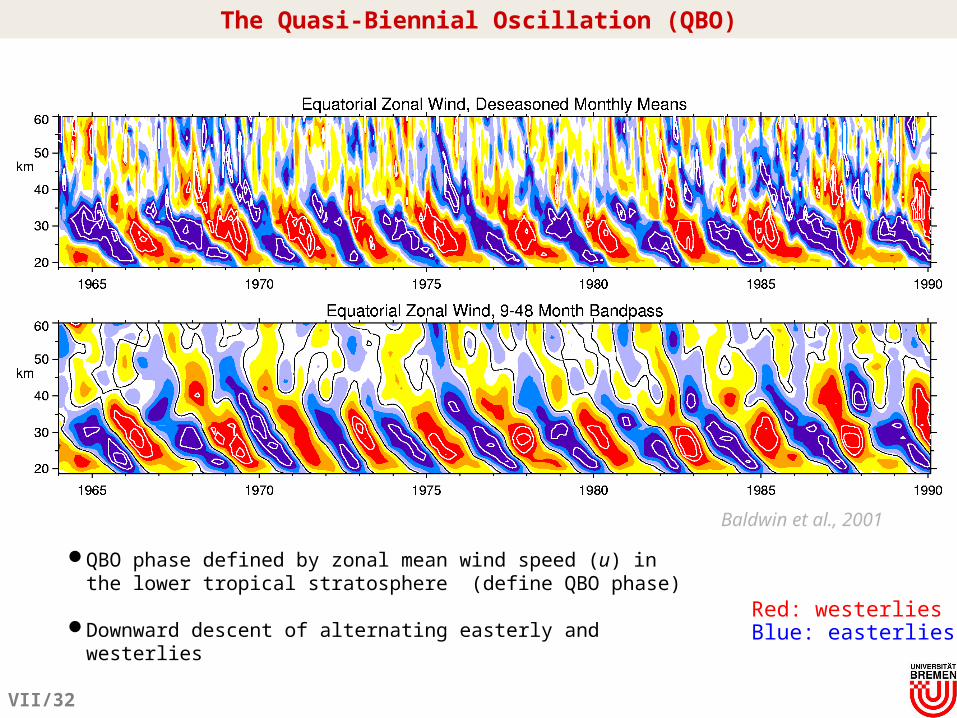
The Quasi-Biennial Oscillation (QBO)
QBO phase defined by zonal mean wind speed (u) in the lower tropical stratosphere (define QBO phase)
Downward descent of alternating easterly and westerlies
Baldwin et al., 2001
Red: westerliesBlue: easterlies

VII/33Baldwin, et. al., 2001
Holton-Tan mechanism (1980)
QBO: coupling to the extratropics
Wind speed differences between QBO east and QBO west phase (40hPa)
Blue: wind speed difference (u) negative (more easterly)
Red: wind speed difference (u) positive (more westerly)
Holton-Tan mechanism relates mid-latitude planetary wave propagation to QBO
impacting the mean meridonal circulation


![Ao Atmospheric Corrosion - [DePa] Departamento de ...depa.fquim.unam.mx/labcorr/publicaciones/AtmosphericCorrosion.pdf · Ao Atmospheric Corrosion M. TULLMIN ... Atmospheric corrosion](https://img.dokumen.tips/doc/110x75/5b78a8f87f8b9a331e8c0cd9/ao-atmospheric-corrosion-depa-departamento-de-depafquimunammxlabcorrpublicaciones.jpg)