Embed Size (px)
Citation preview
Reducing Sugars:Using Glucosamine Supplements to Alter Bacterial DNA
John Goering

Goering 2
Natural Science Seminar
May 10, 2012
Abstract
Reducing sugars are a unique class of carbohydrates that are capable of
being oxidized in chemical reactions, thus causing other substances to be
reduced. Past research has shown that these sugars are capable of reacting
with nucleic acids, particularly in the form of bacterial plasmid DNA, to
initiate chemical changes such as nicks and cuts in the DNA strands. The
research described in this paper specifically addresses the affects of a
particular sugar, glucosamine, on E. coli plasmid DNA. It was found that not
only can pure laboratory-grade glucosamine initiate these changes, but also
nutritional supplements intended to enhance joint health, which contain
glucosamine as a key ingredient. In addition, it is shown that buffers present
in the reducing sugar-DNA reaction solution can potentially inhibit some DNA
alteration. The effects of two different pH buffers, tris and phosphate, are
compared. Tris buffer, which acts as a free-radical inhibitor, is found to
inhibit DNA damage to a small degree.

Goering 3
Introduction
Researchers have long known that certain types of carbohydrate
(sugar) molecules are capable of reacting nonenzymatically with other
biological molecules – especially nucleic acids and proteins – to initiate
chemical changes.1 These sugars, known as reducing sugars, react with the
amino groups of biological molecules in a process called nonenzymatic
browning. The reacting amino group is found either in the amino acids of
proteins or the nitrogenous bases of nucleic acids.
Reducing sugars were first discovered by food scientist L.C. Maillard in
1912. Maillard noted that certain sugars could react with the amino groups
of proteins to form a stable, yellow-brown colored product. This initial
discovery was of great interest to food scientists, as the process is at least
partially responsible for the browning and spoilage of fruits, vegetables, and
other foods.1,2
It has also become clear that reducing sugars are capable of reacting
with proteins and nucleic acids in living tissues, potentially causing damage.
Reducing sugars have been found to have significant effects on the
physiological functioning of living cells. For example, glucose 6-phosphate
has been shown to have a mutagenic effect on the E. coli plasmid pBR322 in
vivo.2
Reducing sugars are also of great interest to some researchers for the
effects that they may have on human health. Research suggests that even
glucose, the body’s most abundant sugar, may not be biologically inert as
has traditionally been assumed. In fact, the effects of glucose on the

Goering 4
proteins of the body is now though to contribute to the aging process by
causing significant declines in the functioning of cells and tissues over time.3
Many age-related declines in physiological function are due to the
accumulation of unrepaired genetic damage or mutations: DNA strand
breaks, chromosomal abnormalities, and errors in DNA replication,
transcription, and repair.4
This project addresses the effects of a particular reducing sugar –
glucosamine – on the bacterial DNA plasmid pBR322, found in E. coli
bacteria. Previous research suggests that glucosamine is capable of causing
single-strand scission (“nicking”), double-stranded cleavage, and other
damage. In this experiment, glucosamine samples were prepared from
readily available over-the-counter joint-health supplements and reacted with
pBR322, an E. coli DNA plasmid. Results obtained from reaction with these
supplements are compared with results from reaction with pure laboratory-
grade glucosamine. If supplements intended for human consumption are
capable of damaging bacterial DNA, it may have implications for human
health as well.
Materials and Methods
There were two primary objectives for this experiment. The first was
to determine the effects of various types of glucosamine on plasmid DNA.
Four different glucosamine solutions were used, one of which was prepared
using laboratory-grade glucosamine powder, while the other three utilized

Goering 5
readily available over-the-counter nutritional supplements containing
glucosamine.
The second objective was to determine the effects that different pH
buffers may have on the ability of glucosamine to react with DNA. All
reactions were carried out in the presence of one of two different buffering
solutions. The buffers used were tris(hydroxymethyl)aminomethane
hydrochloride (“Tris”) and monobasic sodium phosphate (Na H 2P O 4). Tris
functions as a free-radical inhibitor, while phosphate does not. Because
reducing sugars are believed to exert their effects on nucleic acids by way of
a free-radical mechanism, it is hypothesized that reactions carried out in the
presence of a tris buffer may cause less DNA damage than those carried out
in phosphate.
Reagents
Water: ultrapure deionized water was utilized to prepare all buffers and
reaction solutions for this experiment, in order to minimize the potential
effects of dissolved metals and other ions on the reaction.
DNA: the DNA used in these experiments was E. coli plasmid pBR322
purchased from Carolina Biological Supply. The stock solution had a
concentration of 0.1 µg/µL.
Phosphate buffer: prepared by dissolving 6.900 g of monobasic sodium
phosphate [NaH2PO4] in 100 mL of water, then using concentrated HCl to
adjust the pH to 7.2. This stock solution was prepared at a concentration of
500 mM.

Goering 6
Tris buffer: prepared by dissolving 6.055 g of
tris(hydroxymethyl)aminomethane base [NH2C(CH2OH)3] in 100 mL of water,
then adjusting to pH 7.2 with concentrated HCl. Final concentration was 500
mM.
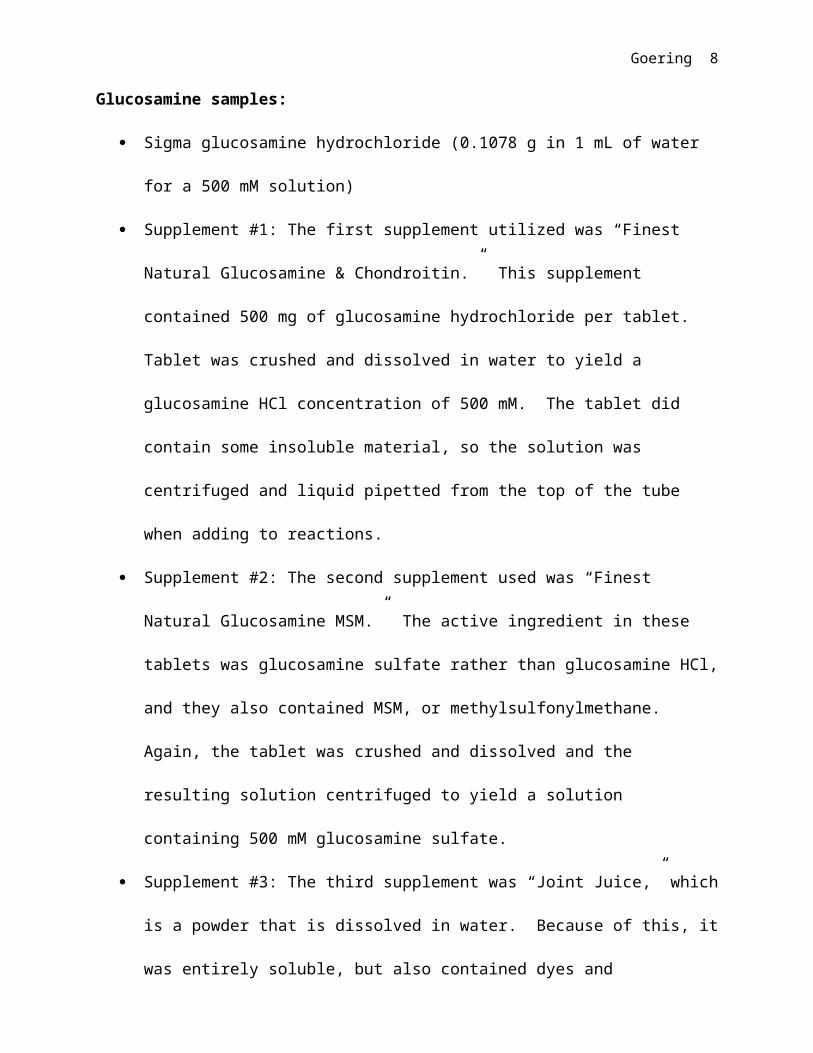
Glucosamine samples:
Sigma glucosamine hydrochloride (0.1078 g in 1 mL of water for a 500
mM solution)
Supplement #1: The first supplement utilized was “Finest Natural
Glucosamine & Chondroitin.” This supplement contained 500 mg of
glucosamine hydrochloride per tablet. Tablet was crushed and
dissolved in water to yield a glucosamine HCl concentration of 500 mM.
The tablet did contain some insoluble material, so the solution was
centrifuged and liquid pipetted from the top of the tube when adding
to reactions.
Supplement #2: The second supplement used was “Finest Natural
Glucosamine MSM.” The active ingredient in these tablets was
glucosamine sulfate rather than glucosamine HCl, and they also
contained MSM, or methylsulfonylmethane. Again, the tablet was
crushed and dissolved and the resulting solution centrifuged to yield a
solution containing 500 mM glucosamine sulfate.
Supplement #3: The third supplement was “Joint Juice,” which is a
powder that is dissolved in water. Because of this, it was entirely
soluble, but also contained dyes and flavorings. The active ingredient

Goering 7
was glucosamine HCl (as in supplement #1), and was prepared at a
concentration of 500 mM.
Loading dye/stop solution: taken from a stock solution prepared by
previous students studying reducing sugar-DNA interactions. Contains
bromophenol blue and xylene cyanol dissolved in water, glycerol, and Tris.
This solution served two purposes: it was added to reaction solutions at
specific time intervals to “freeze” the reaction and preserve the DNA in its
current state until gel electrophoresis could be performed, and it also
contained the loading dye necessary to visualize the movement of the
solution through the gel during electrophoresis.
Reaction Procedure
All reagents were measured using micropipettes and combined in 1.5-mL
plastic tubes. For each glucosamine sample analyzed, four conditions were
used: one containing DNA, glucosamine, and tris buffer; one containing DNA,
glucosamine, and phosphate buffer; and two control reactions containing
DNA and either tris or phosphate buffer, but without any glucosamine
present, to ensure that any DNA damage effects are indeed the result of the
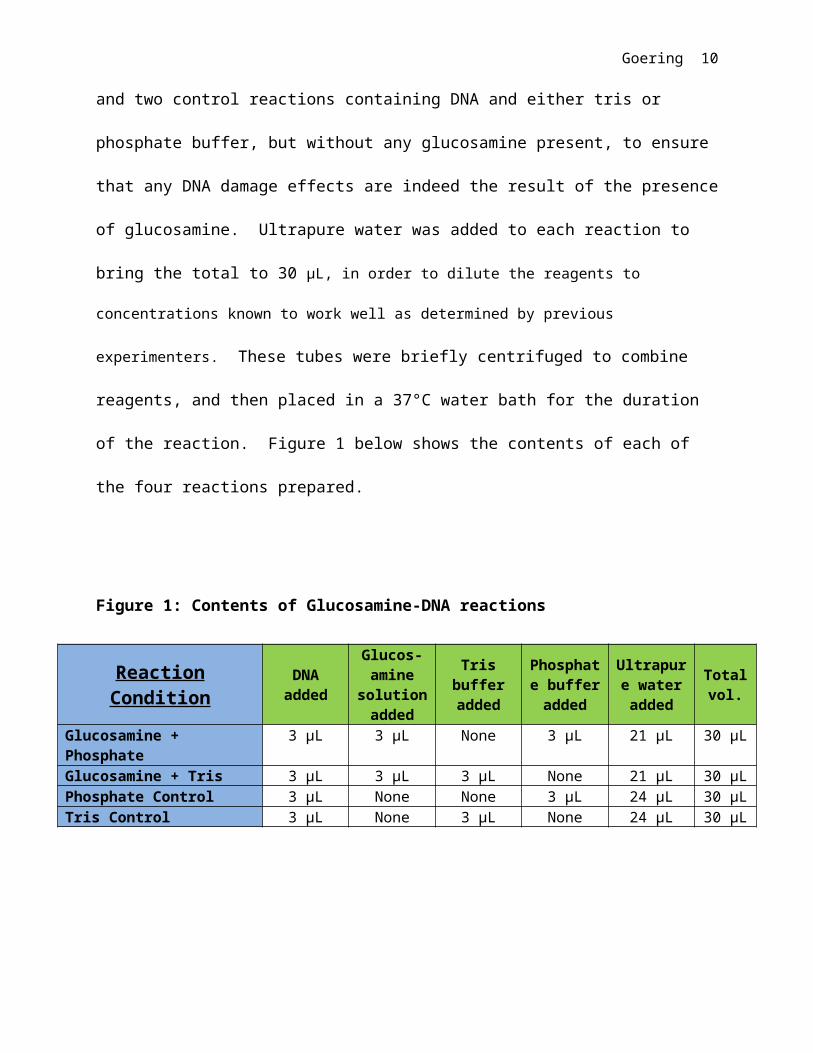
presence of glucosamine. Ultrapure water was added to each reaction to
bring the total to 30 µL, in order to dilute the reagents to concentrations known to
work well as determined by previous experimenters. These tubes were briefly
centrifuged to combine reagents, and then placed in a 37°C water bath for
Goering 8
the duration of the reaction. Figure 1 below shows the contents of each of
the four reactions prepared.
Figure 1: Contents of Glucosamine-DNA reactions
Reaction Condition
DNA added
Glucos-amine
solution added
Tris buffer added
Phosphate buffer
added
Ultrapure water added
Totalvol.
Glucosamine + Phosphate
3 µL 3 µL None 3 µL 21 µL 30 µL
Glucosamine + Tris 3 µL 3 µL 3 µL None 21 µL 30 µLPhosphate Control 3 µL None None 3 µL 24 µL 30 µLTris Control 3 µL None 3 µL None 24 µL 30 µL
Immediately after combining the reagents, initial “reference” samples
of each of the four reaction mixtures were taken. A 5 µL sample of each was
added to a clean tube, and 5 µL of stop solution was added to halt the
progress of the reaction. These samples were refrigerated for later analysis
by electrophoresis. The reaction tubes were then placed in a 37° C warm
water bath and the reaction allowed to progress. Samples were again taken
from the reaction mixture after 24 hours had passed. Gel electrophoresis
was then performed to allow comparison of the DNA before and after the
reaction had taken place. It should be noted that while 0 and 24-hour
samples were taken for all 4 sets of reactions, additional 3 and 6-hour
samples were also taken for only the first set of reactions (those utilizing the
laboratory glucosamine as a reagent).

Goering 9
Earlier trials had shown that the DNA plasmids degraded rapidly after
about 24 hours, to the point that electrophoresis no longer yielded useful
results. Thus, the reactions were concluded at 24 hours and no more
samples were taken.
Gel Electrophoresis Procedure
25 mL of 1% agarose in 1X TAE buffer was prepared by heating in a
microwave oven and poured into a gel casting tray with 12-well comb to
harden. After the gel hardened, the comb was removed, and the gel placed
into the electrophoresis apparatus, which was then filled with 1X TAE buffer
to cover the gel. Wells were loaded using 5 µL of desired reaction solutions
to be analyzed. Gels were electrophoresed at a constant voltage of
approximately 100V for 30-45 minutes, or until loading dye reached 23 to 34 of
the way to end of the gel. The gel was then stained with 0.5 µg/mL ethidium
bromide, while being lightly agitated, for about 5 minutes, then rinsed with
deionized water several times. The gel was finally visualized under UV light
and a Polaroid picture taken for scanning and analysis.
Digital Image Analysis Procedure
To determine the effects of the various glucosamine samples in, the
gel photographs were digitally scanned in grayscale at 600 dpi, and saved in
JPEG format. IMAL software (Image and Measurement Analysis Lab) is a
scientific image analysis product that was used to analyze the gels. By using
Goering 10
the “strip densitometry” function to analyze each lane of the gel, it can be
determined how much DNA is found in each of the three possible forms.
Bacterial DNA plasmids are usually found in one of these three forms:
covalently closed circular (ccc, also known as “supercoiled”), nicked (or open
circular), or linear. The supercoiled form is the most abundant form of
pBR322 under normal conditions. However, reducing sugars such as
glucosamine are known to be capable of inducing breakages in the strands of
bacterial DNA, causing it to adopt the “nicked” conformation, and eventually
a linear conformation. Thus, as the reaction progresses, it would be
expected that large amounts of nicked DNA would appear, and eventually
linear DNA as well. Figure 2 shows the various conformations of DNA.
Figure 2: Supercoiled vs. Nicked DNA

CCCLinearNicked
CCCNicked
1 2 3 4 5 6 7 8
9 10 11 12 13 14 15 16
Goering 11
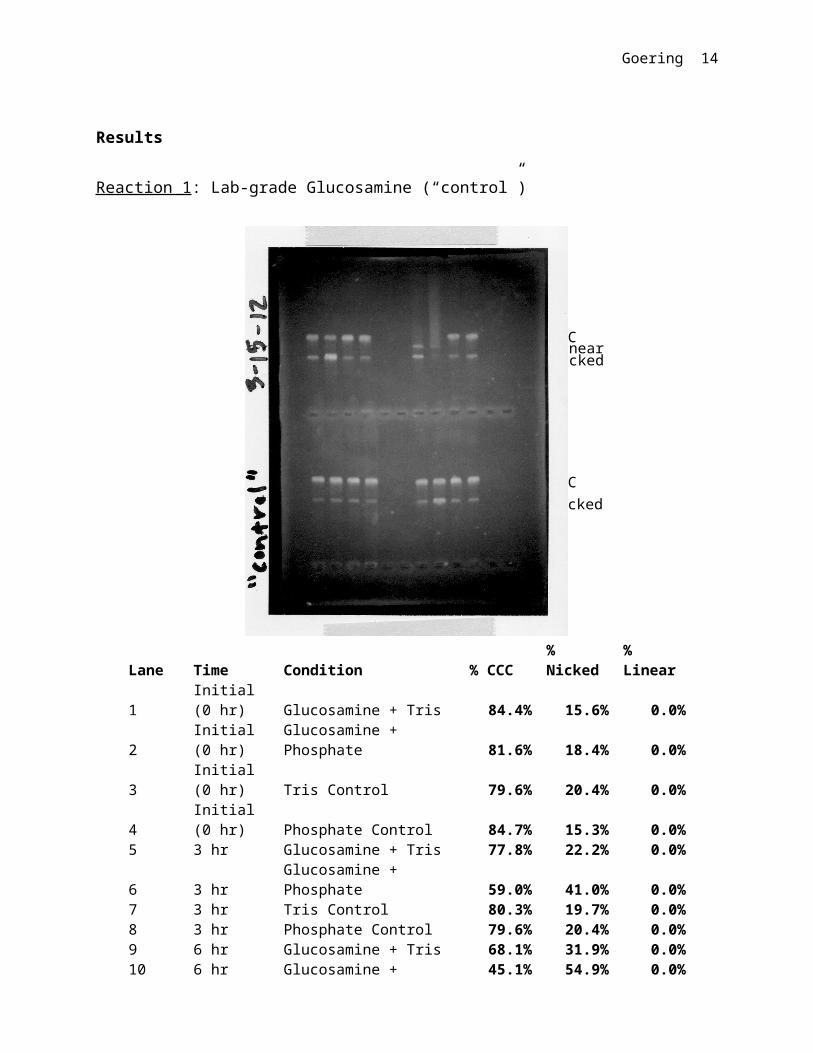
Results
Reaction 1: Lab-grade Glucosamine (“control”)
Lane Time Condition % CCC% Nicked % Linear
1 Initial (0 hr) Glucosamine + Tris 84.4% 15.6% 0.0%
2 Initial (0 hr)Glucosamine + Phosphate 81.6% 18.4% 0.0%
3 Initial (0 hr) Tris Control 79.6% 20.4% 0.0%4 Initial (0 hr) Phosphate Control 84.7% 15.3% 0.0%5 3 hr Glucosamine + Tris 77.8% 22.2% 0.0%
6 3 hrGlucosamine + Phosphate 59.0% 41.0% 0.0%
7 3 hr Tris Control 80.3% 19.7% 0.0%8 3 hr Phosphate Control 79.6% 20.4% 0.0%9 6 hr Glucosamine + Tris 68.1% 31.9% 0.0%
10 6 hrGlucosamine + Phosphate 45.1% 54.9% 0.0%
11 6 hr Tris Control 82.7% 17.3% 0.0%12 6 hr Phosphate Control 79.6% 20.4% 0.0%13 24 hr Glucosamine + Tris 0.0% 59.9% 40.1%
14 24 hrGlucosamine + Phosphate 0.0% 40.0% 60.0%

Goering 12
15 24 hr Tris Control 82.2% 17.8% 0.0%16 24 hr Phosphate Control 71.3% 28.7% 0.0%
Glucosam
ine + Tr
is (0)
Glucosam
ine + Tr
is (3)
Glucosam
ine + Tr
is (6)
Glucosam
ine + Tr
is (24)
Glucosam
ine + Phosp
hate (0
)
Glucosam
ine + Phosp
hate (3
)
Glucosam
ine + Phosp
hate (6
)
Glucosam
ine + Phosp
hate (2
4)
Tris C
ontrol (0
)
Tris C
ontrol (3
)
Tris C
ontrol (6
)
Tris C
ontrol (2
4)
Phosphate
Control (0
)
Phosphate
Control (3
)
Phosphate
Control (6
)
Phosphate
Control (2
4)0%
20%
40%
60%
80%
100%
"Control" Reaction
% CCC% Nicked% Linear

1 2 3 4 5 6 7 8
Goering 13
Reaction 2: Finest Natural Glucosamine & Chondroitin Supplement
Lane Time Condition % CCC%
Nicked % Linear
1 Initial (0 hr)Glucosamine + Phosphate 48.9% 51.1% 0.0%
2 Initial (0 hr) Glucosamine + Tris 51.0% 49.0% 0.0%3 Initial (0 hr) Phosphate Control 100.0% 0.0% 0.0%4 Initial (0 hr) Tris Control 95.1% 4.9% 0.0%
5 24 hrGlucosamine + Phosphate 0.0% 44.1% 55.9%
6 24 hr Glucosamine + Tris 0.0% 53.7% 46.3%7 24 hr Phosphate Control 81.3% 18.7% 0.0%8 24 hr Tris Control 79.2% 20.8% 0.0%
1 2 3 4 5 6 7 8
Goering 14
Glucosam
ine + Phosp
hate (0
)
Glucosam
ine + Phosp
hate (2
4)
Glucosam
ine + Tr
is (0)
Glucosam
ine + Tr
is (24)
Phosphate
Control (0
)
Phosphate
Control (2
4)
Tris C
ontrol (0
)
Tris C
ontrol (2
4)0%
20%40%60%80%
100%
Supplement #1: "FN Glucosamine & Chondroitin"
% CCC% Nicked% Linear
Reaction 3: Finest Natural Glucosamine MSM
Lane Time Condition % CCC% Nicked % Linear
1 Initial (0 hr)Glucosamine + Phosphate N/A N/A N/A
2 Initial (0 hr) Glucosamine + Tris N/A N/A N/A3 Initial (0 hr) Phosphate Control N/A N/A N/A4 Initial (0 hr) Tris Control N/A N/A N/A
5 24 hrGlucosamine + Phosphate 0.0% 40.6% 59.4%

Goering 15
6 24 hr Glucosamine + Tris 0.0% 66.5% 33.5%7 24 hr Phosphate Control 74.7% 25.3% 0.0%8 24 hr Tris Control 84.7% 15.3% 0.0%
Glucosamine + Phosphate (24)
Glucosamine + Tris (24)
Phosphate Control (24)
Tris Control (24)
0%
20%
40%
60%
80%
100%
Glucosamine Supplement #2: "FN Glucosamine MSM "
% CCC% Nicked% Linear

1 2 3 4 5 6 7 8
Goering 16
Reaction 4: Joint Juice
Lane Time (hrs) Condition % CCC% Nicked
% Linear
1 Initial (0 hr)Glucosamine + Phosphate 88.7% 11.3% 0.0%
2 Initial (0 hr) Glucosamine + Tris 92.9% 7.1% 0.0%3 Initial (0 hr) Phosphate Control 100.0% 0.0% 0.0%4 Initial (0 hr) Tris Control 100.0% 0.0% 0.0%
5 24 hrGlucosamine + Phosphate 0.0% 79.4% 20.6%
6 24 hr Glucosamine + Tris N/A N/A N/A7 24 hr Phosphate Control 73.3% 26.7% 0.0%8 24 hr Tris Control 83.0% 17.0% 0.0%

Goering 17
Glucosam
ine + Phosp
hate (0
)
Glucosam
ine + Phosp
hate (2
4)
Glucosam
ine + Tr
is (0)
Glucosam
ine + Tr
is (24)
Phosphate
Control (0
)
Phosphate
Control (2
4)
Tris C
ontrol (0
)
Tris C
ontrol (2
4)0%
20%40%60%80%
100%
Glucosamine Supplement #3: "Joint Juice"
% CCC% Nicked% Linear
Discussion
The first question this experiment was intended to address was
whether or not the glucosamine contained in common nutritional
supplements intended for human consumption is capable of exerting the
same type of effects on E. coli plasmid pBR322 as pure glucosamine
ordinarily used for laboratory purposes. This is clearly the case. In each of
the three reactions using the supplements, significant DNA damage occurred
in the solutions containing glucosamine, while the control reactions had
much lower levels of nicking.
The second major question addressed is whether tris buffer, as a free-
radical inhibitor, is capable of mitigating the effects of glucosamine on DNA.
An examination of the results shows that in every case in which a
comparison can be made of the effects of both buffers, reactions carried out
in tris buffer showed less DNA damage (lower percentage of nicked/linear
Data
Una
vaila
ble

Goering 18
DNA) than those carried out in phosphate buffer, after 24 hours of reaction
time. The graph below shows this.
Gluc
. + P
hosp
hate
(24)
Gluc
. + T
ris (2
4)
Gluc
. + P
hosp
hate
(24)
Gluc
. + T
ris (2
4)
Gluc
. + P
hosp
hate
(24)
Gluc
. + T
ris (2
4)
Gluc
. + P
hosp
hate
(24)
Gluc
. + T
ris (2
4)Reaction 1 Reaction 2 Reaction 3 Reaction 4
0.0%10.0%20.0%30.0%40.0%50.0%60.0%70.0%80.0%90.0%
100.0%
Buffer Comparison
% CCC% Nicked% Linear
A couple of other unexpected results were also noted. For one, it is
clear that a low level of DNA damage occurred in the control reactions
despite the absence of glucosamine. Additionally, a significant amount of
DNA damage appeared in the initial reaction samples, which were taken
within a minute or two of mixing the reagents. This was particularly
noticeable in with the reaction containing “supplement #1.” In this reaction,
about 50% of the initial DNA was nicked. This could be because the
glucosamine was able to react immediately with the DNA, causing significant
damage very quickly, or because the stop solution in this case failed to
completely stop the reaction.

Goering 19
Acknowledgements
First and foremost, I would like to thank Dr. Gary Histand for providing the
guidance necessary to perform this project from beginning to end. I would
also like to thank the Bethel College Chemistry Department for the provision
of all materials and equipment necessary to complete the project, as well as
the Biology Department for allowing the use of their DNA viewing equipment.
Lastly, I appreciate all of the support I have received from all my professors,
fellow students, and parents.

Goering 20
References
1. Lee, A.; Cerami, A. In vitro and in vivo reactions of nucleic acids with reducing sugars. Mutation Research, 1990, 185-191.
2. Lee, A. and Cerami, A. Elevated glucose 6-phosphate levels are associated with plasmid mutations in vivo. Proc. Natl. Acad. Sci., USA. Vol. 84, 1987, 8311-8314.
3. Lee, A.; Vlassara, H.; Brownlee, M. Glucose and Aging. Scientific American, 1987, Vol. 256(5), 90-96.
4. Bucala, R.; Model, P.; Cerami, A. Modification of DNA by reducing sugars: A possible mechanism for nucleic acid aging and age-related dysfunction in gene expression. Proc. Natl. Acad. Sci., USA. Vol. 81, 1984, 105-109.
5. Image: http://users.wmin.ac.uk/~redwayk/lectures/images/super.gif