Embed Size (px)
Citation preview

Abstract—We know that more and more information content is being distributed in digital format or through web-based e-commerce, educational, entertainment, and other systems. Most of these systems use a fashion-driven graphical user interface design, which does not necessarily provide the readers with high readability and legibility of the presented information. However, not many studies have addressed this problem. Some of them were performed with subtractive colors and thus do not provide guidelines for additive colors that are used with modern displays. Therefore we carried out an experiment involving 270 students in order to estimate the readability of variations in color of text and background. 30 web safe color combinations have been tested on a CRT monitor that is nowadays frequently used for reading web material. The obtained results show that reading is very complex and sensitive process influenced by many interrelated factors, which cannot be easily identified and controlled. Therefore speed of reading text in different color combinations cannot be described as one-dimensional problem. The aim of this paper is to identify existence of different dimensions and to determine approximate number of them.
Index Terms—Color, Speed of Reading, User Interfaces, Web-Based system.
Povzetek: Z razvojem elektronskega poslovanja in drugih digitalnih sistemov s področja izobraževanja, zabave itd. se vedno več informacij seli na spletne strani. Mnogo teh sistemov uporablja modne uporabniške vmesnike, ki ne zagotavljajo vedno visoko berljivost in vidnost predstavljene informacije. Kljub temu pa se s tem problemom raziskovalci niso pogosto ukvarjali. Nekateri med njimi so raziskovali tiskane barve. Vendar ti rezultati niso uporabni za sodobne monitorje, ki sevajo svetlobo. Zato smo izvedli preskus v katerem je sodelovalo 270 študentov z namenom, da bi ugotovili berljivost različnih barv besedila in podlage. Testirali smo 30 spletno varnih barvnih kombinacij na katodnem monitorju, ki se danes pogosto uporablja za branje spletnih gradiv. Dobljeni rezultati kažejo, da je branje zelo kompleksen in občutljiv postopek na katerega vplivajo mnogi povezani dejavniki, ki jih ne moremo enostavno ugotoviti in nadzirati. Zato hitrost branja besedila v različnih barvnih kombinacijah ne more biti predstavljena kot enodimenzionalen problem. Namen tega dela je ugotoviti obstoj različnih dimenzij in oceniti približno število le-teh.
Ključne besede: barva, hitrost branja, uporabniški vmesnik, spletni sistem
I. INTRODUCTIONuman information processing when learning, creating, making decisions, and entertaining depends on the way of how information has been accepted [1]-[6]. Acceptance of information depends on the
form of information presentation. The importance of information presentation became first evident not until 1973 [7], but systematic research on this topic, and particularly on the role of a color as an additional information dimension, started two years afterwards [8]-[13]. This can be supported by at least two reasons: first, as a natural phenomenon, color is strongly incorporated into the system of human interactions with the environment. In the esthetic function color is much more effective than in the functionally rational category. Therefore there has been no need for man-computer interactions for a research of possible effects of colors on the human information processing capacity for quite a long time.
H
This work was supported in part by the Slovenian Ministry of Education, Science and Sport under grant SLO-US-2001/38: “Influence of Color on the Quality of Information and Decision-Making”.
M. Gradisar, and T. Turk are with the Faculty of Economics, University of Ljubljana, Slovenia, EU (phone: ++386-1-5892-400; fax: ++386-1-5892-698; e-mail: [email protected], [email protected] ).
I. Humar is with the Faculty of Electrical Engineering, University of Ljubljana, Slovenia, EU (e-mail: [email protected] ).
The Impact of Colors on the Speed of Reading Web Pages on a CRT monitor
1

Second, the use of color depended on the level of information technology development. In the first period the focus of development was mostly directed towards technical and economic aspects. Ergonomic and personal aspects were neglected.
In the past ten years intensive development of the Internet made information presentation become of key importance. Unfortunately, most web pages use a fashion-driven graphical user interface design with a main objective to attract attention of visitors and reflect a graphical image of organization. High readability and legibility [14] of the presented information is rarely treated as most important. However, not many studies have addressed this problem, which is especially expressed in technology enhanced web-based systems [15], [16] where readability is one of the most critical elements in competition with printed materials. Despite of that there is a long history of research on the impact of color combinations to visual performance. From the below given review of related work it is evident, that first studies were carried out using printed material. More recent research work is mainly focused on the effects of different color combinations for the information presented on modern computer displays.
I. I READABILITY AND LEGIBILITY
Readability is defined as the property that permits an individual to read sentences from the stimulus material easily irrespective of their meanings [17]. Normally it is concerned with continuous texts. Common measures of readability include reading rate, identification of misspelled words, searching for pre-specified letters/words within word lists of passages. However, as readability is considered to be a human psychological response, there are several factors influencing on its performance. It is usually difficult to isolate these parameters when measuring readability performance. One of principal requirements for efficient readability is the legibility of the presented information. In this paper, legibility is understood as the visual properties of a character or symbol that determine the ease with which it can be recognized, with respect to ISO 9241-3 [18]. In principle, legibility is affected by observer spatial vision abilities. Up to some asymptotic level, legibility is enhanced by high luminance and color contrast, larger targets, increased inter- and intra - target spacing [19]. In this study, we will examine the influence of color combination on the readability property of the information, presented in a web page on a modern high-resolution cathode ray tube (CRT) display.
I. II SUBTRACTIVE (PRINTING) COLORS
The first research about which color combinations of the posters make them most visible from the distance was published by Le Courier [20], [21]. Sheldons Limited House in Leeds, the posters printing company, performed an experiment in which they put different color posters on wooden signs. Each poster contained two rows of letters. One row had well defined letters, the other had less defined letters like i, j. The posters were exposed to sunlight and a group of people was asked to rank the legibility of the letters, while reading the posters from different distances. Apparently, the most legible poster from the far distance was the poster with black letters on a yellow background. They tested thirteen color combinations and got the results which are listed in order from the most legible to the least legible and are known as Le Courier legibility table:1. Black on yellow 8. White on red2. Green on white 9. White on green3. Red on white 10. White on black4. Blue on white 11. Red on yellow5. White on blue 12. Green on red6. Black on white 13. Red on green7. Yellow on black
Surprisingly, the most widely used combination of printed text, black letters on white background, is only in the sixth position of legibility. The amount of difference between ranks is not given. Consequently, one does not know how much worse the combination of red on green is than the combination of black on yellow or any other combination. Detailed statements regarding the conditions of
2

the experiment such as the number of subjects, kind of ink and paper used, size of type, line with, text used, etc., are omitted. For these reasons more definite information was needed as a guide to improved advertising practice.
Between 1928 and 1963 M. A. Tinker and D. G. Paterson carried out a comprehensive research of legibility and readability [22]-[34]. Among other parameters of printed material they studied influence of colors as well. They used ten color combinations. Eight of them were comparable to the combinations from Le Courier table. Another two resulted from the available colored paper stocks. Students have been tested with Chapman-Cook speed of reading test. The obtained results differ from that of Le Courier table in five out of eight cases. The most important difference is the first place of the combination black on white and the fourth of the combination of black on yellow. They stated that legibility does not depend on color as such but on brightness differences. Despite of those differences in legibility tables the main common characteristic is that both in generally recommend dark characters on a light background.
I. III INTEGRATIVE (DISPLAY) COLORS
The computer displays differ from printed texts on optical characteristics: the printed colors are subtractive, while CRT displays produce integrative colors. In CRT display an energized beam of electrons bombarding a thin layer of phosphor material produces the image. The beam is activated while scanning across the visible portion of image end deactivated when scanning where there is no image. This results in a flickering picture on a CRT display. Previous studies [35], [36] report that image quality of integrative-color display is inferior to the subtractive-color prints. It has been shown that the workers performed tasks about 30% slower with CRT display than with paper. The workers also complained more about visual fatigue and visual strain.
According to the different optical characteristics between printed texts and images presented on the display, in previous subsection described effects of color combinations on visual performances and user preferences regarding printed colours may not directly apply to CRT display. This conclusion has given motivation to investigate the influence of color combination on visual performance using computer displays.
Although some of the early work ([37], [38]) failed to identify specific color combinations that are more readable than others on computer displays, it has been shown that color combination of text and background is an important characteristic of visual stimuli that may affect visual performance.
Some studies [39], [40], [41] found that inappropriate use of color can result in poor performance and a higher incidence of visual discomfort. They suggested the avoidance of using red, green and blue in combination.
In some of studies the authors tried to almost wholly explain the differences in visual performance merely by the luminance contrast. Bruce and Foster [39] compared 42 color combinations and found positive correlation between luminance contrast and the rank order of reading speed for all background colors except green. Small [42] performed an experiment that directly looked at the role of luminance contrast on the performance of detecting spelling errors in the text displayed on a screen. There was a strong positive correlation between this measure and the logarithm of the luminance contrast. The hypothesis that reading ability is sensitive to luminance contrast and insensitive to chromatic contrast was also supported by the results of Legge and Rubin [43]. They measured reading rate for four color combinations always with black as background and foreground text in four chromaticities, produced by inserting color filters in front of the monochrome display. All of the colors were equiluminant. The results showed no influence of chromatic contrast on the reading performance. However, the extension of results from this study to other displays need to be made cautiously, since the luminance of the text used in the experiment was only 6 cd/m2, which is much less than 80 cd/m2, recommended by ISO 9241-3 [18] standard. Also, the results were obtained by using only black color as background and cannot be extended to a variety of different chromatic colors that are nowadays very popular for backgrounds and texts of state-of-the-art Web pages. In his study, Mathews [41] used a visual search task in order to compare 7 color combinations. The results indicate that the color (hue) had very little influence on visual performance and support the contention that luminance contrast is an important predictor of readability. Two very extensive experiments were conducted by Pastoor [44]. In broader experiment, thirty-two
3

subjects were asked to rank the aesthetic appearance of the presented screen pages on a six point scale. 440 color combinations with negative polarity and 352 combinations with positive polarity were tested. The colors were chosen from ten different chromaticity levels using at least two different luminance contrasts. Although there were no significant differences between the results of different color combinations, the instructions on using saturated and desaturated colors in text/background combinations are given. In second experiment, a heavily reduced set of 18 color combinations was used to measure reading time, perform searching task and preference ratings. However, no significant effect of color combination to the reading speed and visual search task was found.
Although luminance contrast was found to be of a major importance affecting CRT visual performance in the abovementioned studies, it was not sufficient to explain the results of subsequent studies. Travis, et al. [45] preformed an experiment to further investigate the influence of chromatic contrast. He employed 33 subjects to compare 36 color stimuli on white background by detecting given strings among words and nonsense anagrams presented on the screen for a short time. The results show that although the luminance contrast between the alphabetic string and the white background was zero, a near-perfect reading was still possible. This important finding means that purely chromatic differences may be sufficient for the visual system to maintain word identification. The results are in accordance with the ones presented by Shieh et al. [46], where the percentage of correctly recognized Chinese characters, viewing distance and subjective preference were measured for five color combinations. The results obtained by the last two measures differ significantly. Shieh cautions, however, not to directly generalize these findings, since the structure of Chinese characters is quite different and the visual processes involved may not be the same as those in English. He suggested explaining the relation between visual performance and color combinations not only with luminance contrast but also taking color difference into consideration. In the second study, Shieh et al. [47] analyzed the visual performance of 12 color combinations (compounded of yellow, red, blue, and purple) by asking the participants to write down the capital English characters displayed in the central area of the screen for very short time. The subjective preference for each color combination was also collected and the results show that color combinations significantly affected both, visual and subjective preference. The results of both experiments are similar and show that blue-on-yellow combination performed as best, while purple-on-red combination was the worst.
More recent studies concentrate on impact of the color combinations used on the World Wide Web. A series of two experiments were conducted by van Shaik [48], [49]. In first study they investigated the effect of color by employing twenty-nine participants rating and performing visual search of information in navigation bar. The combinations were black on white, blue on white, blue on yellow, yellow on blue, red on green and green on red. There was an effect of color combination on accuracy and speed of searching, as well on preference and perceived display quality. The green/red combination was relatively poor in terms of speed. Regarding the subjective data, blue on white was best in terms of preference and perceived display quality.
From the above given review it is evident that majority of authors studied readability of color combinations and according to our knowledge nobody until now examined legibility of integrative colors. Almost all authors came to different conclusions. The results of studies on this phenomenon disagree even about influence of luminance contrast, which seems to be the most important characteristic of color combination in regard to readability. In other words, a single scientifically proved and commonly accepted readability table of integrative color combinations at this moment does not exist. We can draw a conclusion that reading is very complex and sensitive human psychological response influenced by many interrelated factors. Therefore speed of reading text in different color combinations cannot be described as one-dimensional problem. We can expect at least two basic groups of factors, namely the factors associated with psychological responses, and the factors connected with the physical characteristics of color combinations. On one hand, we presume that the second group is manageable with available experiment technology (we can observe human responses with varying color combinations). On the other hand, psychological factors are relatively complex and cannot be easily identified and controlled. It is difficult if not impossible to isolate these factors when measuring readability performance.
The aim of this paper is to identify the existence of factors, which influence reading experience. If this wouldn't be possible, the conclusion could be made that reading experiments are too complex for today's
4

research tools, and the focus should be oriented firstly towards legibility and visibility studies, for which the factors associated with psychological responses are not present in such extent.
The remainder of the paper is organized as follows: the description of the experiment from different points of view is followed by the results and final remarks.
II. EXPERIMENT DESIGN
Our study examined the readability of different color combinations of text and background, presented on the CRT display, by two experiments – measurement of speed of reading and subjective rating task.
II. I COLOR COMBINATIONS
In their study, Hoadley and Jankins [50] found that solid colors without any pattering were the most effective to utilize in multi-color information presentations on CRT display. In accordance with this finding and to achieve the same presentation among different monitors and browsers, the colors used in our study were chosen from non-dithering web-safe color palette [51], which consists of 216 different colors. Although a very large number of color combinations might be utilized in an experiment of this kind, it was necessary to limit the present study to a smaller number of well-defined colors. The colors chosen for the experiment were the elementary colors: (1) white (hexadecimal red-green-blue (RGB) intensity value is #FFFFFF), (2) yellow (#FFFF00), (3) red (#FF0000), (4) magenta (#FF00FF), (5) blue (#0000FF), (6) cyan (#00FFFF), (7) green (#00FF00), and (8) black (#000000). Each of the eight colors was combined with every other different color to make the 56 text/background color combinations. Table 1 shows the color combinations, their color difference (E) and color contrasts (L), which are calculated in accordance to model of color space CIE L*a*b* proposed in year 1976 by Commission Internationale de l’Éclairage.
Having a limited number of participants and time, the experiment was performed with thirty color combinations of the highest luminance contrast. Since evaluating all thirty color combinations by each participant would be too tiring for him/her we have decided to split the color combinations into three sets of ten combinations.
5

Table 1: Color combinations sorted by decreasing L
No Background (RGB) Text (RGB) E L1. Sample 000000 FFFFFF 100 1002. Sample FFFFFF 000000 100 1003. Sample 000000 FFFF00 136,05 984. Sample FFFF00 000000 136,05 985. Sample 000000 00FFFF 105,39 916. Sample 00FFFF 000000 105,39 917. Sample 000000 00FF00 143,34 888. Sample 00FF00 000000 143,34 889. Sample 0000FF FFFFFF 148,55 7010. Sample FFFFFF 0000FF 148,55 7011. Sample 0000FF FFFF00 231,74 6812. Sample FFFF00 0000FF 231,74 6813. Sample 0000FF 00FFFF 165,2 6114. Sample 00FFFF 0000FF 165,2 6115. Sample 000000 FF00FF 126,63 6016. Sample FF00FF 000000 126,63 6017. Sample 0000FF 00FF00 249,44 5818. Sample 00FF00 0000FF 249,44 5819. Sample 000000 FF0000 119,9 5420. Sample FF0000 000000 119,9 5421. Sample FF0000 FFFFFF 116,52 4622. Sample FFFFFF FF0000 116,52 4623. Sample FF0000 FFFF00 108,97 4424. Sample FFFF00 FF0000 108,97 4425. Sample FF00FF FFFFFF 118,47 4026. Sample FFFFFF FF00FF 118,47 4027. Sample FFFF00 FF00FF 192,23 3828. Sample FF00FF FFFF00 192,23 3829. Sample FF0000 00FFFF 161,3 3730. Sample 00FFFF FF0000 161,3 3731. Sample 00FF00 FF0000 163,94 3432. Sample FF0000 00FF00 163,94 3433. Sample 00FFFF FF00FF 154,95 3134. Sample FF00FF 00FFFF 154,95 3135. Sample 000000 0000FF 134,42 3036. Sample 0000FF 000000 134,42 3037. Sample 0000FF FF00FF 65,42 3038. Sample FF00FF 0000FF 65,42 3039. Sample 00FF00 FF00FF 224,93 2840. Sample FF00FF 00FF00 224,93 2841. Sample 0000FF FF0000 184,04 2442. Sample FF0000 0000FF 184,04 2443. Sample 00FF00 FFFFFF 113,78 12
6
44. Sample FFFFFF 00FF00 113,78 1245. Sample 00FF00 FFFF00 64,91 1046. Sample FFFF00 00FF00 64,91 1047. Sample 00FFFF FFFFFF 53,92 948. Sample FFFFFF 00FFFF 53,92 949. Sample 00FFFF FFFF00 113,75 750. Sample FFFF00 00FFFF 113,75 751. Sample FF0000 FF00FF 130,79 652. Sample FF00FF FF0000 130,79 653. Sample 00FF00 00FFFF 100,04 354. Sample 00FFFF 00FF00 100,04 355. Sample FFFF00 FFFFFF 94,39 256. Sample FFFFFF FFFF00 94,39 2
II. II PARTICIPANTS
In response to advertisements at the introductory course of Informatics at the first-year of study at the University of Ljubljana, 300 students were recruited as volunteers. They consisted of 121 males and 179 females. The mean age of participants was 19 (ranging from 18 to 21). All participants had normal or corrected to normal visual acuity, and were tested with the Ishihara test for color blindness to identify the participants with color vision deficiencies (protanopia, deuteranopia, tritanopia). Nine participants (six male and three female) failed on this test. The data were collected from them, but are not considered in this paper. All participants had at least basic computer experience. After 270 valid results the experiment was terminated.
II. III APPARATUS, MATERIALS, ENVIRONMENT AND VIEWING CONDITIONS
To assure adequate and equal testing environment to all participants, the viewing conditions were arranged in conformance with the ISO 9241 [18] and ISO 12646 [52] standards. The experimental tasks were presented on 21” Dell CRT display. The screen resolution was 1280 x 1024 pixels without interpolation and the refresh rate was 85 Hz (non-interlaced). Chromatic resolution was 32 bit. The chromaticity of white point was set to D50, gamma value to 2.0, and luminance level of white point was greater than 120 cd/m2. The display has been calibrated with the X-Rite Color Monitor Optimizer [53].
Following the standard, the ambient was neutral (light brown) with no areas causing glares or reflections on the monitor screen. The mean ambient illumination was bellow 300 lux. The only light source in the room was a shielded lamp on the ceiling, while other light sources had been curtained. The luminance values of the ambient were measured with a digital lux-meter.
The participants were seated in a position where the distance between the screen and the participants’ eyes was 1 m, as suggested in [54]. The screen center was slightly below the participants’ eyes height, forming viewing angle of approximately 15°. The inclination of the monitor was 105°.
II. IV PROCEDURE
There were two components to the experiment: measurement of the speed of reading followed by a subjective rating task. In both tasks, the same participant was exposed to the same 11 different color combinations.
TASK 1: MEASUREMENT OF THE SPEED OF READING
We have employed a very similar method to the one presented in [33]. However, the colors used in this research are not well defined. The color names such as “green” or “red” can incorporate a great variety of color casts – from a light green to dark one. The Chapman-Cook Speed of Reading tests [23]-[33] have
7

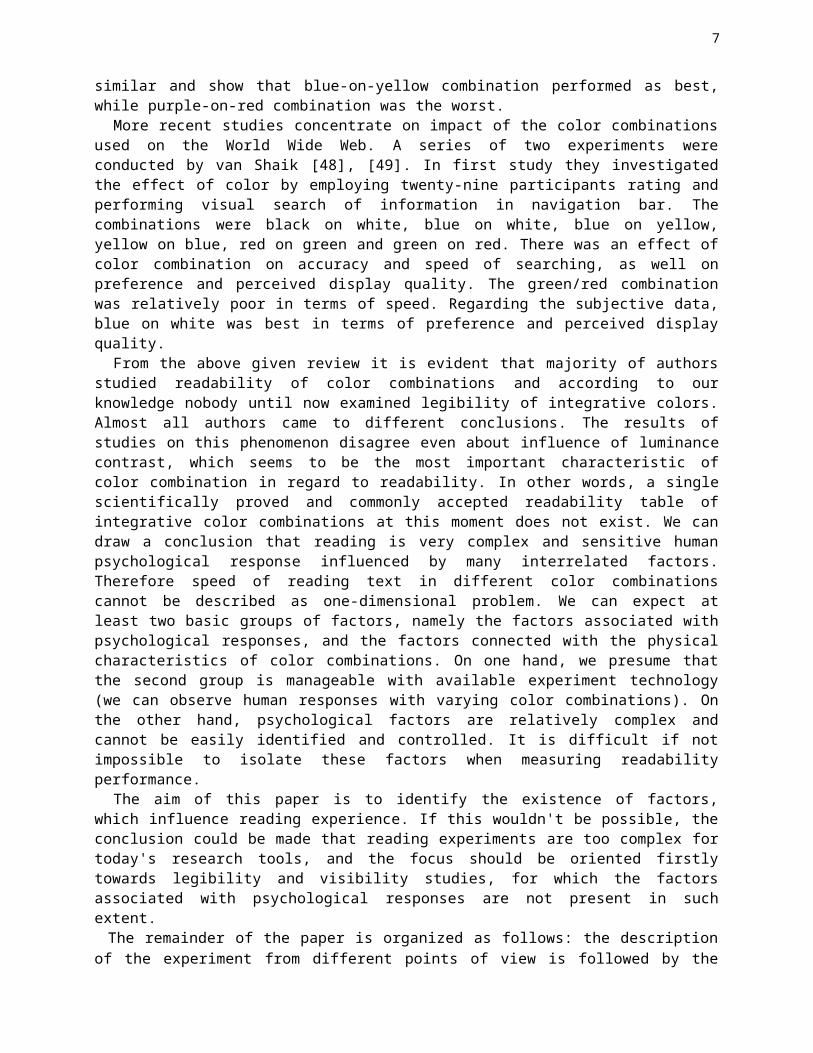
been slightly adapted for the measurement of readability performance from a computer screen. Instead of measuring a number of paragraphs and words read in a certain amount of time, the participants were requested to read a fixed length paragraph of meaningless syllables (Figure 1), while the time of reading was collected as a parameter for the speed of reading.
The participants were divided in three groups of 90 people. Each group of people performed experiments by reading 10 color combinations as well as the white - black combination for reference. A single participant tested each color combination with a slightly different paragraph. All the paragraphs were the same in length and consisted of the same collection of words but the word order was different in order to prevent the participants from memorizing the text when reading it for several times. A 10 x 10 Latin square determined which paragraph is read in which color combination and the sequence of colors in the test. In each group of 90 people, the Latin square was used nine times. With three groups, all thirty color combinations were tested.
Each participant was tested in isolation. Before the experimental session, a participant had been thoroughly explained the system and had performed a practice session under the supervision of a tutor. The participants were asked to read each paragraph as quickly and as accurately as possible.
Figure 1. An example of the reading speed test page
The experiment, developed as a web-based application with java on client side and database on the server side [55], consisted of three parts. First, a user was requested to enter the data about sex and age. The second part was a color vision test. The third part consisted of reading 11 color combinations, starting with white-black for each participant. Before starting to read the paragraph in a particular color combination, the whole computer screen was colored in the color of the combination background. After pressing a key, the timer was started and the paragraph was displayed in the middle of the screen. The participant started to read the text as soon as it was displayed. Having finished reading, he/she pressed the key again to stop the timer. The time needed for reading the paragraph in each color combination was collected automatically for all users and stored into the database. Between testing two color combinations, the participant was exposed to a screen with a relaxing light gray color to neutralize the effect of the previous color combination. When ready for the next one, he/she pressed a key.
8

TASK 2: SUBJECTIVE RATING After finishing the speed of reading test, the participants were asked to subjectively rate color
combinations. The rating was done with responding to a question “How readable do you find the text presented in this color combination?” by sorting the color combinations from the least to the most readable. The participants were presented with the same set of color combinations in the same order as they had been presented in the speed of reading test. Every color combination was demonstrated by a passage of sample text, as shown in Figure 2.
Figure 2. An example of the subjective rating test page
Participants took approximately 20 min to complete both components of the experiment. Following completion, the participants were thanked and then fully debriefed.
II. RESULTS
Since the speed of reading is regarded as a good measure of readability [31]-[33], the analysis of variance was performed without giving any statistically significant differences in the average of reading times between all 30 color combinations. The results sorted by mean reading time inside the decade of color combinations, are shown in Table 2. The results of subjective rating task (Table 3) do not show statistically significant differences either. We did not find some special similarities between our readability table and some readability table from the literature. There are also substantial differences between measured reading times and subjective ratings. The results could be disappointing if we would not expected them since the literature does not offer any readability and legibility table with more than 6 color combinations where differences between color combinations would be statistically significant. The purpose of our research was not to propose another readability table but to identify existence of different factors influencing readability and to determine approximate number of them. Therefore we carried out a further statistical analysis.
9

Table 2: The results of reading speed test sorted by mean reading time inside the decades of color combinations
The speed of reading depends on a color combination, font selection, type size, type rendering technology, etc. [20]-[34], [56]. Since our goal is to explore the association between the speed of reading and color combination, we prepared the experiments with other factors fixed. Each color combination has numerous physical characteristics such as contrast, color difference, difference in the level of saturation, etc. Each of them influenced readability and influence of each could be studied separately. But this was not our main intention. On the other side there are many psychological factors influencing speed of reading for instance esthetic, which can very differ from person to person. But in our case probably the most disturbing factor was possible different interpretation of the part of the instructions for the participants, which says: read the text on the screen as fast as possible. This factor can probably influence speed of reading more, maybe even for order of magnitude more, than color combination itself. Theoretically variations of psychological factors could be neutralized by increased number of participants from several hundred to maybe several thousands, which would be practically almost impossible. Therefore the intention of our research was only to determine presence of different factors and to assess approximate number of them by performing the multidimensional scaling method (MDS) [57].
The goal of MDS analysis is to detect meaningful underlying factors that allow the researcher to explore observed similarities or dissimilarities between stimuli, which are color combinations in our case.
10

Factors are in MDS represented by dimensions. MDS attempts to arrange objects (color combinations) in a space with a particular number of dimensions so as to reproduce the observed distances (similarities or dissimilarities).
Table 3: The results of subjectively rating inside the decades of color combinations
Table 4: Coefficients of alienation and stress values for all dimension setups and groups of experiments
No. of dim. Group 1 Group 2 Group 3
Coeff. of
Alien.
STRESS
Coeff. of
Alien.
STRESS
Coeff. of
Alien.
STRESS
1 0.546 0.432 0.525 0.425 0.516 0.4152 0.297 0.226 0.322 0.247 0.302 0.2373 0.211 0.148 0.215 0.149 0.201 0.1344 0.132 0.078 0.132 0.060 0.129 0.0835 0.080 0.047 0.034 0.034 0.065 0.039
A stimulus in our case is defined as a measure of dissimilarity ij. ij is the absolute difference in processing times for a stimulus pair (i, j). The obtained dissimilarity was then averaged on the
11

participants, thus establishing the diagonal matrix of data, where each row and column represents the average absolute difference in processing times for a stimulus pair (i, j). Since we have experiments in three groups, there are three separate groups of results.
First, we calculated STRESS values as a fit measure for different dimension setups. A STRESS value is the sum of squared deviations of the observed dissimilarities from the reproduced dissimilarities. According to Table 4, for all three groups of experiments we should choose at least five-dimensional setup to reduce STRESS value below 0.05. In that way we achieved relatively low values for the coefficient of alienation. Both measures for all dimension setups are shown in Table 4.
The reader should note that the graphical representation of STRESS values for dimension setups (Figure 3) is not giving any advice as to the number of dimensions to choose. The reported values of fit measures are not in favor of a one-dimensional setup, which would be the most desirable one, if the color combination is directly related to the speed of reading.
Figure 3. STRESS values and number of dimensions for the MDS of color combinations processing times
Figures 4 to 6 represent Shepard diagrams of five dimensional setups for three groups of experiments. Most of the points are clustered around the step-line (the monotonically transformed input data as a step function)
12

Figure 4. Shepard diagram for five-dimensional MDS solution for the first group of experiments
Figure 5. Shepard diagram for five-dimensional MDS solution for the second group of experiments
13

Figure 6. Shepard diagram for five-dimensional MDS solution for the third group of experiments
Tables 5, 6 and 7 show the results from five-dimensional setups, for each experiment group separately. The dimensions are ranked from 1 to 5 according to their strength of distinguishing between different color combinations. Color combinations are arranged according to the values of dimension 1. The arrangements of color combinations in sense of readability scales are not concluded yet. Namely, the STRESS values for each group of experiments and dimension setups (Figure 3) show that there exist at least five factors having influence on the speed of reading. It seems that readability depends on a mixture of at least five factors, if not more.
Table 5: Five-dimensional color combinations scale: first group of experiments
Dimensions Bkgr. Text
1 2 3 4 5-0.817 -0.346 -0.176 0.251 -0.693 Yellow Black-0.709 0.297 -0.028 0.506 0.247 White Blue-0.667 -0.374 0.131 -0.377 0.447 Black Cyan-0.209 0.699 -0.178 -0.695 0.118 Black White0.013 -0.119 -0.275 -0.017 0.092 White Black0.345 0.355 0.685 -0.371 -0.554 Green Black0.389 -0.581 0.676 -0.069 0.246 Blue White0.412 0.368 0.464 0.720 0.143 Black Yellow0.591 0.434 -0.758 0.123 0.031 Black Green0.653 -0.734 -0.540 -0.071 -0.078 Cyan Black
14

Table 6: Five-dimensional color combinations scale: second group of experiments
Dimension Bkgr. Text
1 2 3 4 5-1.041 -0.114 -0.333 0.182 -0.072 Blue Yellow-0.341 -0.284 0.765 -0.154 0.403 Magenta Black-0.280 0.209 0.024 -0.105 0.220 White Black-0.181 0.865 0.271 0.302 -0.199 Blue Cyan-0.135 0.287 -0.074 -0.863 -0.220 Red Black0.001 -0.336 0.466 0.019 -0.783 Blue Green0.081 0.120 -0.389 0.014 0.872 Green Blue0.255 -1.022 -0.325 -0.257 -0.002 Cyan Blue0.321 0.217 -0.940 0.197 -0.383 Black Magenta0.333 -0.249 0.230 0.933 0.074 Black Red0.986 0.306 0.305 -0.269 0.089 Yellow Blue
Table 7: Five-dimensional color combinations scale: third group of experiments
Dimension Bkgr. Text
1 2 3 4 5-1.100 0.211 0.050 -0.097 0.131 Yellow Red-0.303 -0.798 -0.165 0.515 -0.097 White Red-0.236 -0.015 -0.655 -0.685 -0.371 White Magenta-0.193 0.283 0.936 0.441 0.086 Magenta Yellow-0.084 -0.104 -0.433 -0.048 0.477 Red Cyan0.001 -0.632 0.619 -0.649 0.110 Cyan Red0.005 0.149 -0.260 0.689 -0.666 Yellow Magenta0.041 0.003 0.052 -0.055 -0.016 White Black0.160 0.867 -0.295 0.067 0.500 Red White0.689 0.436 0.341 -0.419 -0.493 Red Yellow1.021 -0.399 -0.190 0.241 0.340 Magenta White
III. FINAL REMARKS
The obtained results show that there are no statistically significant differences in readability between 30 color combinations. We noticed at least five factors, which simultaneously and differently affect readability of a colored text. It would be very difficult to identify them and to design a new experiment in such a way that statistical significance would be reached within acceptable number of participants.
One possible and approximate solution of the problem would be in limitation of research to visibility/legibility of color combinations. It can be assumed that visibility is the most important common factor, which influenced readability and is independent of esthetics, content, context etc. of text.
ACKNOWLEDGMENT
The authors are grateful to professor Milton A. Jenkins from the University of Baltimore for his help, valuable comments and suggestions.
15

REFERENCES
[1] R. P. Bostrom, K. M. Kaiser, ”Personality Differences within System Project Teams - Implications for Designing Solving Centers”, in Proceedings of the XVIII. Computer Personnel Research Conference, New York, ACM, 1981.
[2] A. Dillon, Reading from paper versus screens, a critical reviev of empirical literature, Taylor and Francis Ltd., 1992.
[3] D. McDowell, E. Kodak, and L. Warter, Viewing Conditions, The Prepress Bulletin, 1997.[4] T. Rahman, P. Muter, “Designing an Interface to Optimize Reading with Small Display Windows ,”
Human factors, vol. 41, no. 1, Mar. 1999.[5] G. Resinovič, M. A. Jenkins, M. Gradišar, and J. Jaklič, “Legibility and visibility issues in color
enhanced information presentation,” Working paper No. 88, University of Ljubljana, Faculty of economics, 1999.
[6] K. S. Suh, “Impact of Communication Medium on Task Performance and Satisfaction: An Examination of Media-richness Theory,” Information & Management, vo1. 35, no. 5, 1999.
[7] R. O. Mason, L. L. Mitroff, “A Program for Research on Management Information Systems,” Management Science, vol. 19, no. 5, 1973.
[8] A. Arditi, K. Knoblauch, “Choosing effective display colors for the partially sighted,” Society for Information Display International Symposium Digest of Technical Papers, pp. 32-35, 1994.
[9] G. DeSanctis, “Computer Graphics as Decision Aids,” WP, University of Minnesota, Minneapolis, 1984.
[10] G. DeSanctis, S. L. Jarvenpaa, “An Investigation of the »Tables Versus Graphs« Controversy,” in Proceedings of the VI. International Conference on Information Systems, 1985.
[11] J. Ghani, E. J. Lusk, “The Impact of Information Presentation and Modification on Decision Performance,” WP, The Sloan School, MTT, 1981.
[12] L. L. Gremillion, A. M. Jenkins, “The Effects of Color Enhanced Information Presentations,” Discussion Paper #173, Indiana University, Bloomington, Indiana, 1981.
[13] T. Rahman, P. Muter, “Designing an Interface to Optimize Reading with Small Display Windows,” Human factors, vol. 41, no. 1, Mar. 1999.
[14] K. Connolly, “Legibility and Readability of Small Print. Effects of Font, Observer Age and Spatial Vision,” A Master of science Thesis, Department of Psychology, Calgary Alberta, Feb. 1998.
[15] M. Casini, D. Prattichizzo, and A. Vicino, “The Automatic Control Telelab: A User-Friendly Interface for Distance Learning,” IEEE Transactions on Education, vol. 46, no. 2, pp. 252-257, May 2003.
[16] H. A. Latchman, Ch. Salzmann, D. Gillet, and H. Bouzekri, “Information Technology Enhanced Learning in Distance and Conventional Education,” IEEE Transactions on Education, vol. 42, no. 4, pp. 247-254, Nov. 1999.
[17] S. Fukuzumi, T. Yamazaki, K. Kamijo, and Y. Hayashi. “Physiological and psycho-logical evaluation for visual display colour readability: A visual evoked potential study and a subjective evaluation study,” Ergonomics, vol. 41, no. 1, pp. 89-108, 1998.
[18] ISO 9241-3. Ergonomic requirements for office work with visual display terminals (VDTs), Part 3: Visual display requirements. International Organization for Standardization, 1992.
[19] M. S. Sanders, E. J. McCormick, Human factors in engineering and design. Singapore: McGraw-Hill, 1993.
[20] Sheldons Limited House, “Lisibilite des affiches en couleurs,” Le Courrier du Livre, Cosmos, Sept. 5, pp. 255, 1912.
[21] M. Luckiesh, Light and Color in Advertising and Merchandising, H. Van Nostrand Co., New York, pp. 246-251, 1923.
[22] A. M. Tinker, Legibility of Print, Ames, IA: Iowa State University Press, 1963.[23] A. M. Tinker, Tinker Speed of Reading Test, University of Minnesota Press, Minneapolis, 1955.[24] A. M. Tinker, G. D. Paterson, “Readability of mixed type forms,” Journal of Applied Psychology,
vol. 30, pp. 631-637, 1946.
16

[25] A. M. Tinker, G. D. Paterson, “Eye movements in reading black print on white background and red print on dark green background,” American Journal of Psychology, vol. 57, pp. 93-94, 1944.
[26] A. M. Tinker, G. D. Paterson, “Reader preferences and typography,” Journal of Applied Psychology, vol. 26, pp. 38-40, 1942.
[27] A. M. Tinker, G. D. Paterson, “How to make type readable: A manual for typographers, printers, and advertisers, based on twelve years of research involving speed of reading tests given to 33,031 persons,” Harper & Brothers, New York, 1940.
[28] A. M. Tinker, G. D. Paterson, “Studies of typographical factors influencing speed of reading: II. Size of Type,” The Journal of Applied Psychology, vol. 13, no. 2, pp. 120-130, April 1929.
[29] A. M. Tinker, G. D. Paterson, “Studies of typographical factors influencing speed of reading. III. Length of line,” The Journal of Applied Psychology, vol. 13, no. 3, pp. 205-219, June 1929.
[30] A. M. Tinker, G. D. Paterson, “Studies of typographical factors influencing speed of reading: X. Style of typeface,” The Journal of Applied Psychology, vol. 16, pp. 605-613.
[31] A. M. Tinker, G. D. Paterson, “Studies of typographical factors influencing speed of reading: V. Simultaneous Variations od Type Site and Line Length,” The Journal of Applied Psychology, vol. 13, no. 2, pp. 72-78, June 1929.
[32] A. M. Tinker, G. D. Paterson, “Studies of typographical factors influencing speed of reading: VI. Black type versus white type,” The Journal of Applied Psychology, vol. 13, no. 2, pp. 241-247, June 1929.
[33] A. M. Tinker, G. D. Paterson, “Studies of typographical factors influencing speed of reading, VII. Variations in color of print and background,” The Journal of Applied Psychology, vol. 13, no. 2, pp. 471-479, June 1929.
[34] A. M. Tinker, G. D. Paterson, “Influence of type form on speed of reading,” Journal of Applied Psychology, vol. 12, pp. 359-368, 1928.
[35] A. J. D. Gould, L. Alfaro, V. Barnes, R. Finn, N. Grischkowsky, and A. Minuto. “Reading is slower from CRT displays than from paper: attempts to isolate a single-variable explanation,” Human Factors, vol. 29, no. 3, pp. 269-299, 1987.
[36] A. Dillon, “Reading from paper versus screen: a critical review of empirical literature,” Ergonomics, vol. 32, pp. 1297-1326, 1992.
[37] G. W. Radl, “Experimental investigations for optimal presentation-mode and colours of symbols on the CRT-screen”, In E. Grandjean & E. Vigliani (Eds.), Ergonomic aspects of visual display terminals, London, UK: Taylor & Francis, pp. 127-135, 1980.
[38] B. J. Pace, “Color combinations and contrast reversals on visual display units,” Proceedings of the Human Factors Society 28th Annual Meeting, Santa Monica, CA: HFES, pp.326-330, 1984..
[39] M. Bruce, J. J. Foster, “The Visibility of Colored Characters on Colored Back-grounds in Viewdata Displays,” Visible Language, vol. 16, no. 4, pp. 382-390, 1982.
[40] G. M. Murch, “Color graphics – Blessing or ballyhoo?,” Computer Graphics Forum, vol. 4, pp. 127-135, 1985.
[41] M. L. Matthews, K. Mertins, “The influence of color on visual search and subjective discomfort using CRT displays”. Proceedings of the Human Factors Society 31st Annual Meeting, Santa Monica, CA: HFES, pp. 1271-1275, 1987.
[42] P. L. Small, “Factors influencing the legibility of text/background color combinations on the IBM 3279 color display station,” Report No. HF066. Winchester, England: IBM Hursley Park, 1982.
[43] G. E. Legge, G.S Rubin, “Psychophysics of reading: IV. Wavelength effects in normal and low vision,” Journal of the Optics Society of America, vol. A no. 3, 40-51, 1986.
[44] S. Pastoor, “Legibility and subjective preference for color combinations in text,” Human Factors, vol. 32, no. 2, pp. 157-171, 1990.
[45] D. S. Travis, S. Bowles, J. Seton, and R. Peppe. “Reading from color displays: A psychophysical model,” Human Factors, vol. 32 no. 2, pp. 147-156, 1990.
[46] K. K. Shieh, M. Chen, and J. H. Chuang, “Effects of Color Combinations and Typography on Identification of Characters Briefly Presented on VDT’s,“ International Journal of Human-Computer Interaction, vol. 9, no. 2, pp. 169-181, 1997.
17

[47] K. K. Shieh, and C. C. Lin, “Effects of screen type, ambient illumination, and color combination on VDT visual performance and subjective preference,” International Journal of Industrial Ergonomics, vol. 26, no. 5, pp. 527–536, 2000.
[48] J. Ling, P. van Schaik, “The effect of text and background colour on visual search of Web pages,” Displays, vol. 23, pp. 223-230, 2002.
[49] R. Pearson, P. van Schaik, ”The effect of spatial layout of and link colour in web pages on performance in a visual search task and an interactive search task,“ International journal on Human-Computer studies, vol. 59, pp. 327-353, 2003.
[50] E. Hoadley, A. M. Jenkins, “The effects of color on performance in an information extraction task using varying forms of information presentation: Pilot studies,” IRMIS Working Paper #W713, Bloomington, Indiana University Institute for Research on the Management of Information Systems, Graduate School of Bussiness, 1987.
[51] D. Lehn, H. Stern, “Death of the Web safe Color Palette?,” 2000. Available: http://webmonkey.wired.com/webmonkey/00/37/index2a.html?tw=desin
[52] ISO 12646, Graphic technology – Displays for colour proofing – Characteristics and viewing conditions. International Organization for Standardization, 2004.
[53] “Monitor Opimizer Software Guide, X-Rite Colorimeter”, Available: http://www.xrite.com/Products/Product.asp?Show=Description&id=11
[54] K. H. E. Kroemer, “Locating the Computer Screen: How High, How Far?,” Economics in Design, pp. 7-8, Oct. 1993.
[55] I. Humar, M. Gradišar, ”Color test,” Available: http://spin.fe.uni-lj.si/colors/[56] D. Boyarski, C. Neuwirth, J. Forlizzi, S. R. Harkness, “A Study of Fonts Designed for Screen
Display,” in CHI 98, 18 – 23 April, pp. 87-94, 1998.[57] M. L. Davidson, Multidimensional Scaling, John Wiley & Sons, New York, 1983.
18