Embed Size (px)
Citation preview

Viewing Modus and Media Franchise Engagement ∗
Current version: November 2019
Mina Ameri† Elisabeth Honka‡ Ying Xie§
Abstract
We investigate the relationship between viewing modus (low and high intensity viewing)
and consumers’ engagement with media franchises in two areas: personal and interactive
engagement. The former involves consumers’ adoption and consumption of franchise ex-
tensions and the latter concerns consumers’ content generation related to a focal media
product they watched. Our novel data come from an online anime (Japanese cartoons)
platform containing individual-level information on consumers’ anime watching behavior
and their user-generated content. We find that the effects of high intensity viewing on
personal engagement critically depend on the availability of a franchise extension at the
time of watching the focal media product and the type of franchise extension (sequels
versus other types of extensions). For interactive engagement, our results show that high
intensity viewing is associated with lower submission rates but higher valence of anime
ratings, the most prevalent form of UGC on the platform. Furthermore, we explore five
common sources of heterogeneity: age, gender, geography, usage, and experience. We
discuss managerial implications for TV networks and online streaming services regarding
the timing of content release.
Keywords: Viewing Modus, Media Consumption, Binge-Watching, Media Franchise,
Consumer Engagement, Online Movie Streaming
JEL Classification: L82, M31
∗All errors are our own. The authors thank Pradeep Chintagunta, Sanjay Sood, Brian Ratchford, seminar
participants at Emory University, and attendees of the 2017 Marketing Science/INFORMS conference for their
comments.†University of Pittsburgh, [email protected].‡University of California Los Angeles, [email protected].§University of Texas at Dallas, [email protected].

1 Introduction
The global at-home media entertainment industry has fundamentally changed during the last
15 years due to online streaming, a new technology brought about by high-speed Internet.
Prior to online streaming, at-home media consumption was mostly characterized by “appoint-
ment watching” or “linear watching” of TV programs, i.e., consumers turning to a specific
TV channel to watch a show on a day and at a time determined by the TV network. While
appointment watching still exists, its importance has declined. At-home media consumption
through TV channels and satellite TV has been – to a large extent – replaced by over-the-top
(OTT) media consumption.1 OTT media services allow consumers to freely choose when and
how much of a movie or TV series to watch. Consumers have overwhelmingly embraced this
new technology giving rise to new media consumption behaviors such as “binge-watching,”
which is characterized by rapid consumption of media content in a short period of time. This
new technology has also changed the structure of the at-home media entertainment industry:
streaming services such as Netflix and Hulu have emerged as major players in distributing and
creating media content, traditional TV networks have launched their own streaming platforms,
and new contenders such as Apple and Disney have just launched their OTT services.2
Another notable trend in the entertainment and media industry is the rising success of
media franchises on both big and small screens.3 We define “media franchise” as a collection
of media products in which several derivative works have been developed in response to the
popularization of an original creative work and the commercial exploitation of such through
1An OTT media service is a streaming service that delivers film, TV and video content di-rectly to viewers over the internet without requiring users to subscribe to traditional cable or satel-lite pay TV. In 2015, over 40% of U.S. households subscribed to at least one video streaming service(http://www.nielsen.com/us/en/insights/reports/2015/the-total-audience-report-q4-2014.html). 70% of NorthAmerican internet traffic in 2015 consisted of streaming video and audio content and Netflix alone accountedfor 37% of all internet traffic in North America (https://www.sandvine.com/pr/2015/12/7/sandvine-over-70-of-north-american-traffic-is-now-streaming-video-and-audio.html).
2In a recent article from November 9-10, 2019 titled “There will be blood,” the Wall Street Journal quotestwo industry experts as saying “The next 18 months is going to be the most interesting in the history of theentertainment business – the grounds are shifting” and “This market is going to have to shake out – it doesn’tfeel like all these players can continue to play this game forever”.
3In 1994, 1 out of the 10 top grossing movies was a franchise. In 2014, 7 out of the 10 top grossing movieswere franchises (https://www.ft.com/content/192f583e-7fa7-11e4-adff-00144feabdc0?mhq5j=e5).
1

licensing agreements (Aarseth 2006). For example, the three top-grossing movies of 2015 all
belonged to franchises such as “Star Wars,” “Jurassic World,” and “Avengers.”4 Franchise
series also ruled the small screen as witnessed by the exploding traffic on Netflix drawn to
“Breaking Bad” and “House of Cards,” original series created by the streaming service.
Anecdotal evidence and common industry practices suggest that consuming media content
at a high intensity might increase viewer engagement with media franchise series. For example,
“Breaking Bad” creator Vince Gilligan previously told Mashable that the show “may have met
its demise after season two, had it not been for streaming video on demand. It ushered in new
viewers and encouraged time-starved individuals to keep watching at their own pace resulting
in enormous growth from season to season” that reached its climactic end in September 2013
with 10.3 million viewers (the show’s highest viewership ever) (Hernandez 2014). Similarly,
for popular series such as “Supernatural,” Netflix starts streaming previous season(s) shortly
before the release of a new season (on traditional TV).5
However, there is little systematic examination into the relationship between a consumer’s
media consumption intensity and her engagement with a media franchise. In this paper, we aim
to fill this gap. To do so, we differentiate between two media consumption modi: low-intensity
viewing (LoVi) and high-intensity viewing (HiVi). We define LoVi as “slow” or gradual watch-
ing (of a series) over a longer time period. This definition encompasses both appointment
watching (on TV) and consumer-driven slow viewing of a series (through an OTT service).
In contrast, we define HiVi as “fast” or “intensive” watching of a series over a short time
period. This definition applies to both marathon releases (on TV) and consumer-driven in-
tensive viewing of a series (through an OTT service). HiVi includes, but is not restricted to
binge-watching.6
4The total historic revenue from the “Star Wars” franchise was $42 billion (by 2015), $25 billion (by 2016)for the “Harry Potter” franchise, and $6 billion (by 2016) for the “Ice Age” franchise.
5The empirical context of this paper are anime (Japanese cartoon) series. Thus we use the terms “nextseason” and “sequel” interchangeably.
6Recently, a process-based definition of binge-watching has been suggested (see, e.g., Schweidel and Moe2016, Lu et al. 2017). It poses that streaming data are necessary to classify viewing behavior as binge-watching,i.e., the researcher has to observe that a consumer watched at least two episodes of a series directly in a row.Our data contain information on how many minutes of a series a consumer watched on average per day, but wedo not observe whether this watching happened in one sitting. For more details, please see Sections 2.2 and 3.1.
2

To measure consumer engagement with media products, we adopt the categorization de-
veloped by Calder et al. (2009). They identify two types of consumer engagement: “personal
engagement” such as enjoyment and relaxation directly derived from consuming the product
and “interactive engagement” such as socialization and participation in a community facili-
tated by consuming the product. Calder et al. (2009) associate the former with an individual’s
internal state of getting caught up in the flow of an activity and being absorbed by it (Csikszent-
mihalyi 1997) and the latter with an individual’s voluntary content generation and promotion
of a focal media product. Therefore, increased engagement with a TV series might result in
the viewer watching subsequent seasons or other types of franchise extensions7 of the same
series (i.e., personal engagement) and/or in the viewer promoting the TV series and producing
user-generated content (UGC) about it (i.e., interactive engagement).
In this paper, we empirically examine whether intensively watching a focal media product
indeed increases personal engagement by enhancing a consumer’s adoption and consumption
of other media products belonging to the same franchise. At the same time, we also investi-
gate whether watching intensively affects consumers’ interactive engagement by altering their
content generation behaviors related to the focal media product. If HiVi increases consumers’
engagement with a media franchise, this finding would have important implications for both
online streaming services and traditional TV networks. For online streaming services, it would
validate their practice of releasing a whole season of a series at once and thereby making it
bingeable. For TV networks, it would provide support for their new strategy of promoting a
new season shown on traditional TV by making older seasons available through online streaming
7We study five types of franchise extensions in this paper: sequels, side stories, spin-offs, summaries, andremakes. Frequently, we divide franchise extensions into two groups: sequels and “other types of franchiseextensions” (i.e., side stories, spin-offs, summaries, and remakes). A “sequel” is a story that is a direct contin-uation of the focal series and usually carries on elements of the original story, often with the same charactersand settings. For example, season 8 of “Game of Thrones” is a sequel to season 7 of “Game of Thrones.” A“side story” is a short story related to the main characters in the context of the focal series. For example, themovie “Sherlock: The Abominable Bride” is a side story for the “Sherlock” series. A “spin-off” is a story takenfrom the focal series, however, unrelated to the main story. It usually tells the story of a secondary characterfollowing a different storyline, almost like a new series. For example, the “Joey” series is a spin-off from thepopular sitcom series “Friends.” A “summary” is a short series or a movie summarizing the events of the focalseries. For example, the “Pink Panther” movie is a summary of the events in the identically titled TV series. A“remake” is a remake of the series, usually with small differences in the plot or a different ending. For example,there are several “Batman” series that are remakes of the same story.
3

services. This strategic tool could represent an especially important benefit for TV networks
since it would not only increase immediate profits through higher advertising revenues (for the
new season on traditional TV), but also extend the “life” of a series, making it more likely to
reach five seasons at which point the series is a candidate for syndication, a very profitable path
for networks.
If HiVi does not increase media franchise engagement or if it does not do so for all shows or
all consumers, it is important to understand when and why this is the case. Does the timing of
the release through online streaming services matter? Or does the type of franchise extension
matter? Furthermore, given the varying popularity of online streaming and HiVi across different
countries and consumer segments, are consumers with certain characteristics more susceptible
to the effect of HiVi than other consumers? In this paper, through a systematic empirical
investigation, we provide a description of this new viewing modus and its relation to consumer
media franchise engagement.
Our data come from MyAnimeList.net, an online forum that attracts anime (Japanese
cartoons) fans from all over the world. We observe an individual’s adoption timing of anime
series including the number of days it took a consumer to watch the whole season of an anime.
This information allows us to classify consumer-anime combinations into “HiVi” and “LoVi”
cases. Further, we observe an individual’s self-generated content about an anime in the form
of published posts on the discussion forum as well as submitted ratings and recommendations.
Our data also contain information on a consumer’s decision to watch the next season (sequel) of
an adopted anime and/or to watch other types of franchise extensions. And lastly, we observe
a consumer’s demographic and behavioral characteristics, including the individual’s geographic
location, age, gender, domain expertise, and recent anime watching activities. These consumer-
specific traits allow us to explore whether and how the effects of HiVi vary across different
consumer segments.
We mostly use bivariate binary probit models to study the relationship between the viewing
modus and a consumer’s actions related to media franchise engagement.8 The first equation
8For a few continuous engagement variables, we use a linear regression model together with a binary probit
4

describes the user’s decision of viewing modus (low vs. high intensity) and the second equation
models the relation between high intensity viewing and consumer engagement. Further, we
incorporate two exclusion variables that can be interpreted as instruments in the viewing modus
equation to account for the potential endogeneity of the decision to watch at high intensity. By
simultaneously modeling a consumer’s viewing modus decision and media franchise engagement
decision, we also allow correlated unobservables to affect both decisions.
Our results show that the effect of HiVi on an individual’s personal engagement largely
depends on both the availability of a franchise extension at the time of watching the focal
season and the type of franchise extension. If the franchise extension is available, watching the
prior season at high intensity significantly increases a consumer’s probability of watching the
subsequent season (sequel), but decreases the probability of adopting another type of franchise
extension. If the franchise extension is not available at the time of watching the focal season,
HiVi decreases the adoption probability of both sequels and other types of franchise extensions.
However, conditional on adopting a franchise extension, we find that HiVi has a significant
positive effect on the likelihood of finishing to watch the franchise extension – regardless of the
type of franchise extension. In addition, we find that consumers who watch a focal anime at
high intensity are more likely to watch a franchise extension immediately next than those who
watch at low intensity and that this effect is stronger when the franchise is a sequel (versus
another type of franchise extension).
Regarding the relationship between HiVi and interactive engagement, i.e., the production of
UGC, we find that the effect of HiVi varies with the type of UGC: it decreases the likelihood of
submitting a rating, increases the likelihood of making a recommendation, and does not affect
the likelihood of publishing a forum post. Given that ratings are the most prevalent type of
UGC and recommendations are very rare on this platform, our results provide partial support
for the general avoidance tendency of binge-watchers, proposed and documented in previous
literature (e.g., Schweidel and Moe 2016). We also find that consumers who watch at high
model allowing for a correlation in the error terms across the two equations, i.e. we use an analogue of thebivariate binary probit model with one of the equations being a linear instead of a probit model.
5

intensity rate the focal anime higher, suggesting that HiVi positively affects consumers’ liking
of a media product.
We extend our analysis to explore five common sources of heterogeneity: age, gender, geogra-
phy, usage, and experience. Geographic heterogeneity is mostly captured by different behaviors
of consumers in and outside of North America: consumers in North America are more likely
to consume at high intensity, less likely to engage personally, and more likely to engage inter-
actively than consumers outside of North America. We find a limited amount of heterogeneity
related to age and gender: older consumers are less likely to watch at high intensity and to
produce related UGC than younger consumers. Women are more likely to write forum posts
and submit ratings, but these forum posts are shorter and ratings are worse than those writ-
ten and submitted by men. Our results also indicate that more experienced consumers and
consumers with higher recent usage are less likely to consume at high intensity than less expe-
rienced consumers and consumers with no recent usage. Lastly, we find that the effects of HiVi
on interactive engagement vary with experience and usage: more experienced consumers and
consumers with higher recent usage who watch at high intensity tend to generate more forum
posts and/or recommendations related to a media franchise than less experienced consumers
and consumers with no recent usage who watch at high intensity.
Our paper makes the following two contributions. First, we contribute to the consumer en-
gagement literature by systematically examining the factors that drive consumer engagement
in the context of a media franchise. By quantifying the effect of HiVi on consumer engagement
with a media franchise in two broad areas – interactive and personal engagement – our paper
provides empirical evidence that the modus of consumption, on top of product adoption, in-
fluences consumer brand engagement. And second, our paper adds to the small but rapidly
growing literature on viewing modus, binge-watching, and online streaming. To the best of our
knowledge, we are the first to study the relationship between viewing modus and consumers’
subsequent media consumption and word-of-mouth behavior. Our results have important man-
agerial implications for both online streaming services and traditional TV networks regarding
content provision and the timing thereof.
6

The remainder of the paper is organized as follows: In the next section, we present our
theoretical framework. In Sections 3 and 4, we describe our data, introduce our model and
estimation approach. We present our results in Section 5. In Section 6, we explore five potential
sources of heterogeneity and discuss limitations and future research in the following section.
Finally, we conclude by summarizing our findings and discussing managerial implications in
Section 8.
2 Theoretical Background
In this section, we draw from relevant streams of literature on customer engagement with a
media franchise, on viewing modus, and on online movie streaming. We then discuss how past
research in these three domains informs us about the relationship between the viewing modus
and consumer engagement with a media franchise.
2.1 Customer Engagement with a Media Franchise
Customer engagement has been extensively studied in the marketing literature (e.g., Bowden
2009; Mollen and Wilson 2010; Van Doorn et al. 2010; Vivek et al. 2012).9 It differs from
similar relational concepts such as participation or involvement in that it highlights customers’
interactive and co-creative experiences in networked relationships with multiple stakeholders
including service personnel, firms, and/or other customers (Brodie et al. 2011). Table A-1 in
Appendix A provides a brief summary of engagement definitions used by previous literature.
Empirical studies across various industries have shown that engaged customers play a key
role in viral marketing activities by generating referrals and recommendations for products
and services, in new product development, and in co-creating experiences and value (e.g.,
Nambisan and Nambisan 2008; Brakus et al. 2009; Hoyer et al. 2010). However, to the best of
our knowledge, no empirical study to date has systematically examined customer engagement
in the context of media franchises.
9We refer readers to Brodie et al. (2011) for an extensive review of the marketing literature on engagement.
7

To understand what drives customer engagement with media franchises, the first question
is how customer engagement with a media product should be measured. In this regard, Calder
et al. (2009) define media engagement in terms of the different motivational experiences that
consumers have with a media product. Using confirmatory factor analysis, they identify two
types of media engagement: personal engagement and interactive engagement. Personal en-
gagement is associated with intrinsic motivation and includes individualistic experiences such
as enjoyment and relaxation directly derived from consuming a media product. More specifi-
cally, a consumer’s personal engagement with a media product is driven by the “transportation”
motive, i.e., by consuming a media product a consumer aims to be transported into a different
state (e.g., from bored to happy) or to be transported into taking part in an activity, such as
being absorbed into a story and shutting out the real world. Csikszentmihalyi (1997) describes
a more general variant of the “transportation” experience as the internal state of an individual
getting caught up in the “flow” of an activity and being absorbed by it. Interactive engagement,
on the other hand, is associated with extrinsic motivation and includes interactive experiences
such as socialization and participation in a community facilitated by the consumption of a
media product. For example, after watching a movie, a consumer may have the urge to gener-
ate online word-of-mouth related to the movie by submitting a rating, publishing a review, or
participating in discussion forums on social media. This online word-of-mouth has been shown
to be effective in raising awareness and influencing opinions of other consumers, through which
it increases the adoption of the movie (Ameri et al. 2019).
In this study, we follow the categorization by Calder et al. (2009) when examining consumers’
personal and interactive engagement with media franchises. In our empirical context of an online
anime platform, we measure a user’s personal engagement with a media franchise by examining
her self-enjoyment of the focal media product and the adoption of its franchised extensions
including sequels, spin-offs, summaries, side stories, and remakes. We assess her interactive
engagement through her content generation and promotion of a focal media product, i.e., her
decision to submit recommendations, ratings, and comments in a community discussion forum
regarding the focal anime series.
8

2.2 Viewing Modus
We differentiate between two viewing modi: low-intensity viewing (LoVi) and high-intensity
viewing (HiVi). We define LoVi as “slow” or gradual watching (of a series) over a longer
time period. This definition encompasses both appointment watching (on TV) and consumer-
driven slow viewing of a series (through an OTT service). In contrast, we define HiVi as “fast”
or “intensive” watching of a series over a short time period. This definition applies to both
marathon releases (on TV) and consumer-driven intensive viewing of a series (through an OTT
service).
HiVi includes, but is not restricted to binge-watching, i.e., the practice of watching mul-
tiple episodes (of a series) in one sitting.10 Table A-2 in Appendix A provides a summary of
binge-watching definitions used by previous literature. We note from Table A-2 that there is
disagreement on how much watching is considered binge-watching. Based on a survey of their
users, Netflix defines binge-watching as watching at least two episodes in one sitting (Netflix
2013). The number of two episodes is not agreed upon by everyone though. For example,
Amazon made the first 3 episodes of its series “Alpha House” available to its viewers at once,
implying that it considers 3 episodes as a bingeable amount. Schweidel and Moe (2016) and Lu
et al. (2017) use process-level streaming data to define binge-watching. For example, Schweidel
and Moe (2016) consider “the consumption of multiple episodes of a television series in a short
period of time” as binge-watching. Other studies rely on respondents’ perception of what is
considered binge-watching without defining a specific amount (e.g., Devasagayam 2014; Pena
2015).
These definitions rely on the number of episodes without differentiating between one-hour
dramas (about 40 minutes without commercials) and 30-minute sitcoms (about 20 minutes
without commercials). It is debatable whether watching 8 episodes of a sitcom corresponding
to about 2.5 hours should be considered as binge-watching. To circumvent these obstacles, in
10Many regard the element of control, i.e., the consumer’s control over whether to watch more episodes, as anessential part of binge-watching. In other words, binge-watching is not only about watching multiple episodesin one sitting, but also about a consumer’s control and decision of when and what to watch. Thus a consumerwatching a marathon release on TV would not count as binge-watching.
9

this study, we suggest a clear definition of HiVi which is based on the time spent watching a
whole season and also test its robustness (see Web Appendix B). This definition is in line with
the idea that HiVi is a violation of what is considered the norm, regular TV watching such as
”appointment watching” or “linear watching,” which we classify as LoVi.
The underlying mechanism that drives HiVi is related to the concept of flow (e.g., Hoffman
and Novak 1996), which describes a state of focused concentration, intrinsic enjoyment, and
time distortion. Previous research has found that users who experience the flow are more
likely to repeat their behaviors or even become addicted (e.g., Kubey and Csikszentmihalyi
2002; Chou and Ting 2003). This mechanism also provides a plausible explanation for the
interplay between advertisements and binge-watching as documented in Schweidel and Moe
(2016): advertisements in a viewing session discourage binge-watching and binge-watchers are
less responsive to advertisements compared to non-binge-watchers.
While there has been a considerable amount of research on the reasons for HiVi, few studies
have focused on the consequences of HiVi. In the TiVo (2015) study, 52% of respondents
indicated that they feel sad when they finish bingeing a series; 31% reported that they have
lost sleep due to bingeing. Binge-watching - due to the intensity of the experience and the flow
it creates - has been suggested to create loyalty to a series, to lead to fandom, and to help
the formation of one-sided, unconscious bonds between viewers and characters or, at the very
least, behavior similar to fandom such as purchasing ancillary materials, creating fandom pages
or posting or creating content (Devasagayam 2014; Jenner 2015). However, empirical evidence
supporting these claims is very limited. To the best of our knowledge, this paper is the first to
carry out a systematic empirical examination of the effects of HiVi on consumer engagement
with a media franchise.
2.3 Online Streaming
Despite its wide popularity, research on online movie streaming is scarce. Cha and Chan-
Olmsted (2012) study the plausible cannibalization effect of online video platforms on tradi-
10

tional TV. They find that users of online video platforms believe that online video platforms
have unique functionality and therefore are not substitutes to traditional TV. However, non-
users of online video platforms perceive online video platforms as substitutes for traditional
TV because of their perceived similar functionality. Cha (2013) finds that the more consumers
perceive online video platforms to differ from traditional TV in satisfying their needs, the more
likely they are to use online video platforms.
Studying consumer behavior within online streaming services, Zhang et al. (2013) develop a
new class of “clumpiness” measures and, using data from Hulu.com, show that the “clumpiness
phenomenon” is widely prevalent in digital content consumption. In a separate study, Zhang
et al. (2015) extend the traditional recency/frequency/monetary value (RFM) segmentation
framework to include the clumpiness measure (RFMC). In particular, they show that the RFMC
framework can help companies with bingeable content (such as online streaming platforms)
uncover previously unseen customer segments. Ameri et al. (2019) investigate the drivers of
consumers’ anime adoption decisions in the context of online streaming. They find the average
anime rating and the popularity rank from the community network, i.e., the platform, to have
larger effects on consumers’ adoption decisions than the same two types of information obtained
from the personal network, i.e., a consumer’s friends. And lastly and most closely related to this
paper, Schweidel and Moe (2016) simultaneously examine the drivers of users’ binge-watching
behavior and their responses to advertisements using data from Hulu.com. They find that
binge-watchers are less responsive to advertising compared to non-binge-watchers.
2.4 Theoretical Synthesis
In this subsection, we provide a theoretical synthesis of prior research based on which we
develop a set of predictions for our empirical context. We first discuss the relationship between
the viewing modus and personal engagement and conclude this subsection by examining the
relationship between the viewing modus and interactive engagement.
HiVi can affect consumers’ personal engagement in two distinct ways. On the one hand,
11

media consumers who experience the flow created by intensively watching are more likely to
repeat their behavior or even become addicted in order to stay in the flow (e.g., Kubey and
Csikszentmihalyi 2002; Chou and Ting 2003). One would expect that a natural way for con-
sumers to continue the flow after intensively watching a focal media product is to watch its
franchise extensions if they are available (at the time of watching the focal media product).
By watching franchise extensions, consumers can remain in the state concentrated around the
same characters and their story shown in the focal media product. Therefore, HiVi may elevate
consumers’ probability of choosing a franchise extension of the focal media product as the next
media product to watch compared to choosing an unrelated media product next. Similarly, HiVi
may also affect the overall likelihood of consumers adopting a franchise extension of the focal
media product at any point in the future, as a means of continuing the immersive experience
and maintaining the one-sided relationship with the characters in the focal media series. And
lastly, conditional on starting to watch a franchise extension, HiVi may also increase consumers’
probability of finishing to watch the franchise extension so that they can continue staying in
the flow.
On the other hand, by watching and finishing a season in a short amount of time, HiVi may
also cause “satiation” or boredom with the focal media product. Satiation propels consumers
to move away from related media products such as franchise extensions. For example, con-
sumers may seek for variety by watching something unrelated to the focal series next, they may
completely move away from consuming any franchise extensions of the focal media product at
any point in the future, and/or they may not finish watching a franchise extension.
These two effects of HiVi on personal engagement work in opposite directions. Therefore the
net effect of HiVi depends on how consumers balance the flow created by watching intensively
against the satiation that is also brought about by this viewing modus. Whether HiVi enhances
or weakens a consumer’s personal engagement with media franchises is therefore an empirical
question that we set out to answer in this paper.
Among the different kinds of franchise extensions, sequels, i.e. next seasons, are the ones
that continue the same story line of and share the same main characters with the prequel or
12

previous season. Other franchise extensions may have a different story line or may be centered
around different characters (e.g., “Better Call Saul” as a spin off of “Breaking Bad” follows the
story of a lawyer who was a secondary character in “Breaking Bad”).11 Therefore, we expect
the flow created by intensively watching a media product to be best continued by sequels. In
other words, we expect that consumers experience a stronger flow effect when they watch a
sequel relative to other types of franchise extensions. However, for exactly the same reason,
after intensively watching the focal media product, consumers may also experience stronger
satiation when watching a sequel. In the current study, we empirically examine how the net
effect of HiVi on personal engagement varies across different types of franchise extensions.
And lastly, we discuss the relationship between viewing modus and interactive engagement.
Due to consumers’ inclination to stay in the flow when watching at high intensity, they tend
to avoid any activities that distract them from watching the focal media product, including
interactive engagement activities such as content creation and promotion of the focal media
product. This avoidance tendency is manifested in Schweidel and Moe (2016) where the authors
find that binge-watchers are less responsive to advertisements compared to non-binge-watchers.
Many industry observers also accredit Netflix’s no disruption design (for example, getting rid of
the opening credits at the start of an episode if you are watching more than one episode) as one
of the main reasons for the wide spread of binge-watching (Vidar 2015). Thus, we conjecture
that consumers who intensively watch a focal media product are less likely to generate related
content than consumers who watch the product at a slower pace. However, if these consumer
ever generate content about the focal media product, we suspect this content might be more
favorable than content generated by consumers who watch at a slower pace. This is because
HiVi is suggested to induce loyalty or fandom-like behaviors (Devasagayam 2014; Jenner 2015).
11Other examples are “Frasier” as a spin-off of “Cheers,” “Joey” as a spin-off of “Friends,” and “The GoodFight” as a spin-off of “The Good Wife.”
13

3 Data
Our data come from MyAnimeList.net. This website is a consumption-related online community
where online interactions are based upon shared enthusiasm for a specific consumption activity
(Kozinets 1999). It was created to allow anime fans to gather and share their excitement and
opinions about animes (Japanese cartoons). This website was established in November 2004,
but its main activities did not begin until 2007 when the website moved to a public domain
and its user base started to grow rapidly (see Figure 1). At the point in time when we started
the data collection in March 2015, there were more than 2.5 million users on the website.
—— Insert Figure 1 about here ——
On MyAnimeList.net, both animes and users have their own pages. On a user’s page,
information about the animes the individual has adopted (including the dates) and her opinion
about adopted animes (via numerical ratings, forum posts, and recommendations) is shown in
addition to personal information such as the individual’s geographic location, gender, age and
the date when she joined the website. Users can create a list of animes that they have watched
or plan to watch (we refer to this list as “watch list” throughout this paper).12,13 Note that
users add animes to their watch lists using a search function so that all animes are correctly
and uniquely identified. Further, users can also indicate their opinion about the animes on
their watch list by rating them on a scale ranging from 1 to 10 (10 being the highest rating).
Throughout this paper, we refer to ratings given to animes on watch lists as “ratings.” Lastly,
users can indicate the date they started watching an anime series and the date they finished
watching an anime series. We use the start and end dates to infer the beginning and end of a
user’s watch period for an anime series.
12We do not account for platform choice in this paper because, in general, users can watch animes ei-ther legally or illegally through a number of different channels such as netflix.com, hulu.com, funimation.com,crunchyroll.com, aniplexusa.com and others.
13Our adoption data are self-reported. Thus accuracy in the reporting of adoptions is a potential concern. Weaddress this concern when discussing Figure 4. Further note that in contrast to incentivized surveys, there areno incentives for users on MyAnimeList.net to falsely report their true anime watching behavior. Furthermore,in the similar setting of TV shows, Lovett and Staelin (2016) compare survey panelists’ self-reported viewingdata and the actual streaming data and find that people tend to correctly report their actual watching behavior.Thus we are confident that the self-reported adoption data are reliable in our context.
14

3.1 Viewing Modus
We define an individual as having intensively watched an anime season if the individual watches
the series for over 3 hours a day – a more conservative measure than Netflix’s.14 To differentiate
HiVi from LoVi incidences in our data, we use the average daily time that an individual spent
watching a season of an anime series, i.e., we divide the total duration of the anime season
(measured in hours) by the number of days that it took the individual to watch all episodes
of the anime season. If a user watches more than an average of 3 hours a day (corresponding
to about 8 25-minutes long episodes, excluding the few minutes of openings and endings), we
mark this incidence as HiVi.15 In Web Appendix B, we test the robustness of this definition
with respect to shorter and longer average daily watch times of 2 and 4 hours, respectively.
Our results are qualitatively robust to these alternative operationalizations of HiVi.
3.2 Engagement
We investigate three aspects of an individual’s personal engagement with media franchises by
examining her consumption decisions related to franchise extensions of a focal anime season.
First, intensively watching an anime season might affect a user’s likelihood of watching its
franchise extension (at any point in time in the future). Second, conditional on watching a
franchise extension, the viewing modus might affect a consumer’s likelihood of finishing to
watch the franchise extension. And lastly, if a franchise extension is available at the time of
watching the focal anime, watching intensively might also affect the likelihood of watching a
franchise extension immediately next versus an unrelated anime. We operationalize these three
aspects of personal engagement as binary indicator variables: (i) whether a user watched a
franchise extension (at any point in time in the future), (ii) whether a user finished watching
the franchise extension (conditional on starting to watch a franchise extension), and (iii) whether
a user watched a franchise extension next (conditional on a franchise extension being available).
14Netflix defines binge-watching as watching at least two episodes in one sitting (Netflix 2013).15Note that a user might have watched more than 3 hours on a Sunday, but it took him Monday to Friday
to gradually watch the remaining 3 episodes (about 1 hour) and finish the season. Our data do not allow us toidentify the watching behavior on Sunday as HiVi.
15

We examine an individual’s interactive engagement with media franchises by looking at
her decisions to produce UGC related to adopted anime seasons. We investigate three types
of UGC: recommendations, ratings, and posts on the discussion forum. Recommendations
on this platform exhibit the following pattern: “If you like anime A, you will like anime B
because of XYZ.” In that sense, individuals give a recommendation for which two animes are
similar, but not necessarily a recommendation that an anime is particularly good. Posts on the
discussion forum typically discuss topics such as new season release dates, voice cast decisions,
story lines, specific characters, awards, or anime adaptations. Ratings are different from the
two previously mentioned forms of UGC in that they are numerical and a higher rating clearly
indicates a more favorable opinion towards the rated anime season. Furthermore, while ratings
are publicly visible to everybody, they are recorded by a user on her watch list and help her
remember her preference for or liking of a particular anime.
For each type of UGC, we study whether the viewing modus affects UGC incidence, i.e.,
whether bingeing affects the likelihood of (a) writing (at least) one recommendation, (b) sub-
mitting a numerical rating, or (c) publishing (at least) one post on the discussion forum related
to the focal anime season. Conditional on UGC incidence, we further investigate whether the
viewing modus also affects UGC valence of (d) ratings or (e) forum posts. In addition, since a
user can submit more than one recommendation and more than one forum post about an anime
series, we also study whether the viewing modus affects (f) the number of recommendations
and (g) the number of forum posts submitted by the individual, conditional on incidence. And
lastly, for forum posts only, we also investigate whether HiVi affects (h) the average length
of submitted forum posts. Variables (a) - (c) are operationalized as indicator variables and
variables (d) - (h) are treated as continuous variables.
3.3 Estimation Sample
We scraped data on 370,000 individuals from the website. Not all users list start dates for
(all or any) anime series they have adopted on their watch list. After excluding all user-anime
16

combinations for which we did not have start dates, we were left with 92,273 individuals.16 We
then dropped (i) animes for which we did not have the release date or information on the number
of episodes; (ii) user-anime combinations for which the watch period seemed unreasonably long,
i.e. more than 3,000 days; (iii) observations for days on which individuals indicated to have
watched animes for more than 24 hours; (iv) observations with start dates before 2008 since,
although the website was launched in 2004, its main activities did not start until mid 2007 (see
Figure 1); (v) observations with start dates after the end of 2014. Using the remaining 89,422
individuals and 4,896 animes (3,481,664 user-anime combinations), we took the following steps
to get to our final data.
First, we dropped anime series for which it would take an individual less than 3 hours to
watch the whole season. Table 1 shows the frequency distribution of anime series with respect
to their number of episodes and durations of a season in hours. Movies or short anime series
generally take less than 3 hours to be watched and thus, according to our operationalization of
HiVi, cannot be watch at high intensity. Note that, even if an individual watches 3 movies back
to back, if they are not part of a franchise, we do not consider this instance as HiVi. Second, we
dropped user-anime combinations in which an individual did not watch the whole season. Even
if a user intensively watches the first half of a season (and does not watch the second half of the
season), her behavior might be different from someone who intensively watched and finished
the whole season. To be able to attribute the difference in user behavior to the viewing modus
and not to the completion of the whole season, we only consider cases in which the individual
finished watching the whole season.
—— Insert Table 1 about here ——
Third, we only consider user-anime combinations in which users have the option to inten-
sively watch the anime, but may choose not to do so, i.e., we only consider watching incidences
after the season finale of an anime has been aired. It is noteworthy that most of our obser-
vations are for such cases. In Figure 2, we show the number of days (after the original airing
16Individuals’ behavior on MyAnimeList.net is consistent with the well-known 90-9-1 rule in social media(see, e.g., https:www.nngroup.comarticlesparticipation-inequality): a large proportion of individuals is inactive.
17

of the first and last episode in a season, respectively) after which individuals who watched the
anime intensively and individuals who watched the anime at a slower pace started to watch
it. For example, Figure 2(b) shows that individuals, who slowly watched the anime, did not
start watching it immediately after the original airing of the first episode, but instead waited
until the season finale aired.17 Note that access to the anime after its original airing is not
a reason for the delayed watching: almost all animes are available through online streaming
within 3 days of the original episode airing (see also Ameri et al. 2019). And lastly, we dropped
individuals for whom we do not have their geographic location. This type of information is
needed to control for national holidays and weekends and to explore geographic heterogeneity.
After these steps, our final data sample for the empirical analysis of interactive engagement
contains 37,694 individuals and 2,562 animes with 693,173 user-anime combinations.18
—— Insert Figure 2 about here ——
For personal engagement, we need to constrain the final data sample further. More specifi-
cally, we can only consider anime series that have a franchise extension, i.e., next season (sequel)
or another type of franchise extension (i.e. side story, spin-off, summary or remake). After drop-
ping anime series that do not have any franchise extension, the data sample contains 35,447
individuals and 1,250 animes with 490,717 user-anime combinations, i.e. unique user-(focal)-
anime combinations. Sometimes, anime series have multiple types of franchise extensions (e.g.,
a spin-off and a summary). In such cases, we model the adoption of each type of franchise
extension as a separate potential adoption. Sometimes, anime series have multiple franchise
extensions of the same type (e.g., two spin-offs). In such cases, we only model the first potential
adoption among franchise extensions of the same type. Because of these two issues, the number
of observations in the model estimation is 764,666.
17A large number of animes have 13 or 26 episodes in a season (see also Table 1). The two spikes arounddays 91 and 182 after the original airing of the first episode in Figures 2(a) and (b) are consistent with thesetwo frequent season lengths.
18Because of missing values in one of our explanatory variables (popularity rank), the number of observationsin the model estimation is 663,963.
18

3.4 Data Description
We present summary statistics for the 37, 694 individuals in our final sample in Table 2. 20,167
individuals in our final sample report their age. Among these individuals, the average age is
19 years. 42% of users are female and 41% of individuals are male with the remaining 17% of
individuals not specifying their gender. 46% of individuals live in Europe, 34% come from North
America, 9% from South America, 8% from Asia, and 4% from Oceania. Users, on average, have
watched 2 animes during the last 30 days and 57 animes over the course of their membership
on the platform. Note that both distributions exhibit positive skewness and long right tails.
We use the number of watched animes during the last 30 days to measure consumers’ recent
product usage and the number of watched animes over the course of the platform membership
to measure consumer experience. Further, we find that users, on average, started watching
31% and 3% of the animes on their watch lists on weekends and holidays, respectively. Given
that, for example, weekend days represent 28% of days in our data, we observe that users are
over-proportionally more likely to start watching animes on weekends (similar results hold for
holidays). And lastly, users are significantly more likely to watch intensively on weekends and
holidays than to do the same during the workweek or on non-holidays providing support for
us modeling the viewing modus decision as a function of the weekend and holiday dummies.
For example, on any given day during the workweek and on any given day during the weekend,
13.56% and 16.09% of users, respectively, watch intensively (similar results hold for holidays).
To summarize, we find that users are more likely to start watching and more likely to watch
intensively on weekends and holidays than during the workweek or on non-holidays.
—— Insert Table 2 about here ——
Figure 3 shows the distribution of watch periods, i.e., the number of days between watching
the first and last episode of an anime season, in our estimation sample. In more than 50% of
the user-anime combinations, the individual watched a complete anime season within 5 days,
with 18.62% of user-anime combinations being watched within a day or two. While Figure 3
does not account for the length of a season in terms of the number of episodes, i.e., whether
19

a season consists of 13 or 26 episodes, or the length of episodes (in minutes), it nevertheless
shows the possibility that a significant portion of user-anime combinations might be watched
intensively.
—— Insert Figure 3 about here ——
In Figures 4(a) and 4(b), we display the total number of hours individuals watched animes
on a day during which they watched at high and low intensity, respectively (using our 3-
hour operationalization of HiVi). Note that the total number of hours in this figure includes
everything the user watched, i.e. all animes the user watched intensively on that day and any
other animes the user might have watched on that day. On days during which users watch
intensively, the vast majority of users watches between 3 and 6 hours with a second, smaller
group of individuals watching between 9 and 11 hours. While the distribution has a long right
tail, very few users report watching more than 16 hours a day. This gives us confidence in the
accuracy of the self-reported watching behavior (see also Netflix 2013). On days during which
users watch at a slower pace, almost all individuals watch less than 3 hours. This is not a direct
result of our definition of LoVi since Figure 4 shows the total number of hours users spent on
watching any anime. For example, users who watch 7 20-minutes episodes of one anime series
and 7 20-minutes episodes of another anime series would be classified watching at a slower pace
on that day, but would have watched more than 3 hours.
—— Insert Figure 4 about here ——
Figure 5 shows the distribution of the fraction of anime series on a user’s watch list that
can be classified as HiVi vs. LoVi using our 3-hour operationalization. About 41.8% of users
only engage in LoVi, while for 6.5% of users HiVi is their only viewing modus for all animes.
This implies that most of the users choose to intensively watch some anime series while slowly
watch others. This empirical observation is consistent with previous findings (e.g., MarketCast
2013; Schweidel and Moe 2016). On average, we classify 20.4% of animes on a user’s watch list
as watched intensively with a standard deviation of 28% and a median of 8.3%.
20

—— Insert Figure 5 about here ——
Figure 6 displays how the number of HiVi vs. LoVi user-anime combinations has evolved
over time. Up until about 2013, both the number of HiVi and the number of LoVi user-anime
combinations gradually increased. Starting in 2013, the number of HiVi cases continued to
increase, while the number of LoVi cases started to decrease, implying that the proportion of
intensively watched animes among all animes a user watches is increasing. This pattern of
an increasing proportion of users who watch intensively is consistent with findings reported in
several survey studies (e.g., TiVo 2015).
—— Insert Figure 6 about here ——
Next, we discuss our engagement variables. Table 3 shows statistics for our personal en-
gagement variables. We observe that personal engagement crucially depends on (i) the type of
franchise extension (sequel vs. another type) and (ii) the availability of a franchise extension at
the time of watching the focal media product. If a sequel is available at the time of watching the
focal anime, individuals who watch the focal anime season intensively are more likely to watch
the sequel, to finish watching it, and to watch it immediately next than individuals who watch
at a slower pace (all three differences are statistically significant at p < 0.01). If another type of
franchise extension is available at the time of watching the focal anime, individuals who watch
the focal anime season intensively are more likely to watch this other type of franchise extension
immediately next and to finish watching it (both differences are significant at p < 0.01), but
are not more likely to watch it than individuals who watch at a slower pace. And lastly, if
another type of franchise is not available at the time of watching the focal anime, individuals
who watch intensively are less likely to watch the franchise extension once it becomes available
than consumers who watch at a slower pace (difference significant at p < 0.01).
—— Insert Table 3 about here ——
In Figure 7, we report statistics related to users’ interactive engagement. Note that, out
of the three types of UGC on this platform (i.e., forum posts, ratings, and recommendations),
21

ratings are the dominant form of UGC in terms of user participation: the submission rate
is 92.66% for ratings compared to 0.68% for forum posts and 0.18% for recommendations.
Further, we find that users who watch an anime season intensively are less likely to post on
the discussion forum (difference statistically significant at p < 0.01). Conditional on posting
on the discussion forum, users who watch an anime season intensively make longer and more
negative posts (both differences statistically significant at p < 0.01). Further, users who watch
an anime season intensively are less like to rate it, but conditional on rating, they rate it higher
(both differences statistically significant at p < 0.01). We do not observe significant differences
between users who watch intensively and users who watch extensively in their recommendation
behaviors.
—— Insert Figure 7 about here ——
4 Models and Estimation
We investigate the relationship between the viewing modus and a consumer’s personal and
interactive media franchise engagement. Potential endogeneity of the decision to watch inten-
sively is a concern. To account for it, we simultaneously model an individual’s viewing modus
decision and media engagement decisions for the focal anime season allowing for the error terms
across the two equations to be correlated (see Heckman 1978, Maddala 1983, Wooldridge 2010).
We start by describing the viewing modus equation.19 Let i = 1, ..., N denote consumers
and j = 1, ..., J denote animes. Individual i’s decision on whether to watch anime j intensively
is given by
B∗ij = αBi + βB1 wij + βB2 hij + δBCBij + γBGB
j + λBT + εBij
Bij =
1 B∗ij > 0
0 otherwise,
(1)
19Note that the viewing modus equation always includes the same set of variables as described in Equation(1). However, for each personal and each interactive engagement variable, we re-estimate the viewing modusequation together with the engagement equation for each engagement variable allowing for a correlation betweenthe two error terms.
22

where B∗ij is the underlying latent variable capturing consumer i’s utility of watching anime
j intensively. The variable Bij (whose realizations we observe in the data) equals 1 if B∗ij is
positive and 0 otherwise. B∗ij is a function of individual-specific random effects αBi following
a normal distribution N(αB, σ2
αB
), a weekend dummy wij, a holiday dummy hij, control vari-
ables CBij , anime-specific variables GB
j , time dummies T , and an error term εB that follows a
standard normal distribution.20 The control variables CBij consist of the popularity rank and
the community rating of anime j with both variables being measured at the time of user i’s
adoption of the focal anime season.21 GBj contains anime-specific variables, namely, anime j’s
genre dummies, the number of episodes in a season, and the length of each episode in minutes.
Note that an anime typically belongs to three to four genres and the genre assignment is done
by the platform. And lastly, T contains calendar year dummies.
Next, we describe how we model a consumer’s personal engagement with a media franchise.
All three personal engagement variables under study are operationalized as binary indicator
variables. Thus consumer i’s utility from personally engaging with the media franchise is given
by
y∗ij = αi +(β1 + β2Sj + β3Aij + β4SjAij
)Bij + κ1Sj + κ2Aij + κ3SjAij + δCij + γGj + λT + εij
yij =
1 y∗ij > 0
0 otherwise.
(2)
The variable yij (whose realizations we observe in the data) equals 1 if y∗ij is positive and
0 otherwise. The underlying personal engagement utility y∗ij is a function of individual-specific
random effects αi following a normal distribution N (α, σ2α) and a dummy variable Bij indicating
whether user i watched anime j intensively. Because both the type and the availability of a
franchise extension play important roles in precisely pinning down the effects of HiVi (see also
20The weekend and holiday indicators, wij and hij , can be interpreted as exclusion variables. We expectusers to have more time on weekends and on holidays and thus to be more likely to watch intensively, whilethese variables should have no/less effect on users’ subsequent personal and interactive engagement.
21The popularity rank is based on the number of users who adopted the anime. The community rating isthe average rating of users who watched the anime. Users can see both variables on the platform.
23

Section 3.4), we not only estimate a main effect of HiVi, but also interact it with a dummy
variable Sj indicating whether the franchise extension is a sequel and with a dummy variable
Aij indicating whether the franchise extension was available at the time of user i watching the
focal anime season. Furthermore, we account for the main and interaction effects of the sequel
dummy Sj and the availability dummy Aij.22 Our control variables Cij include the popularity
rank and community rating of anime j both measured at the time of user i watching the focal
anime season and, if the franchise extension was not available at the time of user i watching
the focal anime season, the wait time until the franchise became available in days. And lastly,
Gj contains genre dummies for anime j, T contains calendar year dummies, and εij is an error
term following a standard normal distribution.
Given that both the viewing modus variable described in Equation (1) and the three personal
engagement variables described in Equation (2) are indicator variables, the three models – one
for each personal engagement variable – are estimated as bivariate probit models.
And lastly, we describe how we model a consumer’s interactive engagement with a media
franchise. As we describe in Section 3.2, we operationalize three UGC incidence variables as
binary indicator variables and the remaining five UGC valence, count, and length variables
(conditional on UGC incidence) as continuous variables. For the UGC incidence variables (e.g.,
forum post indicator), consumer i’s engagement is modeled as follows:
y∗ij = αi + βBij + δCij + γGj + λT + εij
yij =
1 y∗ij > 0
0 otherwise.
(3a)
If the variable capturing interactive media engagement is continuous (e.g., rating valence),
consumer i’s engagement is modeled as
y∗ij = αi + βBij + δCij + γGj + λT + εij. (3b)
αi is an individual-specific random effect following a normal distribution N(α, σ2α) and Bij is
22Note that for the personal engagement form of whether to watch a franchise extension immediately nextafter watching the focal anime, we condition on the availability of a franchise extension at the time of watchingthe focal anime. Thus, for that equation, we are not able to estimate the effects of availability.
24

a dummy variable indicating whether user i watched anime j intensively. Cij contains control
variables including the popularity rank, the average community rating, and the number of
previous forum posts about, ratings of or recommendations for anime j at the time of individual
i’s adoption of the focal anime season. For dependent variables related to forum posts only, we
also control for whether consumer i has ever published a forum post and the time since the last
forum post on anime j published by anyone. Gj contains anime-specific variables such as the
number of episodes in a season and genre dummies, and T contains calendar year dummies.
Lastly, εij is the error term following a standard normal distribution.
If the interactive media engagement variable is binary as described in Equation (3a), we
jointly estimate the viewing modus equation and the interactive media engagement equation
using a bivariate probit model with correlated errors. If the interactive media engagement
variable is continuous as described in Equation (3b), we jointly estimate the viewing modus
equation and the interactive media engagement equation using a probit and a linear model with
correlated errors.
5 Results
5.1 Viewing Modus Decision
We start by discussing the results for consumers’ viewing modus decisions. The lower halves of
Tables 4 and 5 show the results from the model parts capturing the decision to watch intensively.
Across the eleven sets of results shown in Tables 4 and 5, the coefficient estimates have the
expected signs and most of them are significant: the coefficients for the weekend and holiday
dummies are, as expected, positive. The lower the popularity rank of the focal anime season
(i.e., the better the rank), the more likely it is that an individual watches it intensively. Higher
rated anime series with more and longer episodes also increase the probability of HiVi. We also
find evidence for a significant amount of unobserved heterogeneity across users. Lastly, six out
of eleven correlations between the viewing modus and engagement decisions are statistically
25

significant with some correlations being positive and some being negative.
—— Insert Tables 4 and 5 about here ——
5.2 Personal Engagement
The top half of Table 4 shows the parameter estimates from the model parts describing con-
sumers’ personal engagement actions. Column (i) describes an individual’s decision of whether
to watch a franchise extension (at any point in time). We find the main effect of HiVi as well
as all four interaction effects (three two-way interactions and one three-way interaction) to be
statistically significant, suggesting that the effect of HiVi critically depends on the type of fran-
chise extension (sequel versus other type) and its availability at the time of watching the focal
media product. To facilitate interpretation of the effects of HiVi in each of the four scenarios
(sequel/available, sequel/not available, other type/available, other type/not available), we sep-
arately show the effects of HiVi (taking all main and interaction effects of the binge dummy
into account) for each scenario in column (i) in Table 6.23
—— Insert Table 6 about here ——
When a franchise extension is available, we find that watching the focal media product
intensively (compared to watching it at a slower pace) significantly increases the likelihood
of adopting a sequel, while it significantly decreases the likelihood of adopting other types of
franchise extensions. This finding is consistent with consumers experiencing a stronger and
more seamless flow effect by watching a sequel compared to watching other types of franchise
extensions. In the case of a sequel, the stronger flow created by watching intensively overcomes
the satiation effect and therefore leads to a positive net effect on adopting this specific type of
franchise extension. For other types of franchise extensions, since the flow is not as strong due
to the weaker connection to the focal media product, the satiation effect dominates resulting
in a negative net effect on adoption.
23For example, we calculate the effect of HiVi for the sequel/available scenario as follows: 0.069 = −0.142 +0.036 + 0.030 + 0.145. We use the Delta method to calculate the standard errors.
26

When a franchise extension is not available at the time of watching the focal media product,
we find that watching intensively (compared to watching at a slower pace) significantly decreases
the adoption probability for both sequels and other types of franchise extensions (once the media
franchise becomes available). Given the separation in time between watching the focal media
product and the possibility of adopting its franchise extension due to its initial unavailability,
the flow effect is not strong in this situation. As a result, the net effect of HiVi is mainly driven
by the satiation. This is why we find the adoption probabilities of both sequels and other types
of franchise extensions to decrease when they are not available at the time of watching the focal
anime season.
We further examine whether HiVi affects a consumer’s probability of finishing to watch the
franchise extension (conditional on starting to watch a franchise extension) in column (ii) of
Table 4. Again, we calculate the effect of HiVi (taking all main and interaction effects into
account) for each of the four scenarios separately and show them in column (ii) in Table 6. We
find that, after starting to watch a franchise extension, users who watch the focal media product
intensively are significantly more likely to finish watching the franchise extension than users
who watch it at a slower pace in all four scenarios. These results suggest that, once consumers
overcome their satiation (with the media franchise) and start watching a franchise extension,
the positive flow effect dominates which increases the probability of finishing to watch the
franchise extension.
Lastly, we examine how viewing modus affects the more immediate media watching behavior.
In column (iii) of Table 4, we pin down how HiVi affects a consumer’s probability of watching
a franchise extension (compared to an unrelated media product) immediately next (conditional
on it being available at the time of watching the focal media product). We find that individuals
who watch a focal anime season intensively are more likely to watch a franchise extension
immediately next than individuals who watch at a slower pace, and that this effect is stronger
when the franchise extension is a sequel (versus another type – see column (iii) in Table 6).
This result again speaks to the consumers’ tendency to continue the flow created by watching
the focal media product intensively. A natural way to do so is to watch its franchise extensions
27

if one is available. Relative to other types of franchise extensions, sequels benefit more from
the HiVi effect because of the stronger flow they create.
To summarize, our results for personal engagement show that HiVi only increases a con-
sumer’s probability of watching a franchise extension (at any point in time in the future) if
that franchise extension is a sequel and available at the time of watching the focal media prod-
uct. Otherwise, HiVi decreases the adoption probability of a franchise extension. However,
conditional on starting to watch a franchise extension, HiVi increases the probability that a
consumer finishes to watch it in all four scenarios. Further, HiVi also increases the probability
that a consumer watches a franchise extension immediately next after watching the focal media
product. And lastly, we would like to stress that our results regarding both personal and in-
teractive engagement are robust to alternative operationalizations of HiVi (shorter and longer
average daily watch times of 2 and 4 hours) as shown in Web Appendix B.
5.3 Interactive Engagement
Next, we discuss the results for interactive engagement shown in the upper half of Table 5.
Columns (i) to (iv) in Table 5 display the coefficients for estimations related to forum posts.
Our results in columns (i) and (iii) indicate that HiVi (compared to LoVi) does not significantly
affect a user’s probability of making forum posts – neither the incidence nor the number of forum
posts. Whether a user contributes to the discussion forum and the number of her contributions
rather appear to be largely driven by unobserved consumer heterogeneity. Conditional on
contributing to the discussion forum, if an individual watches intensively, she makes more
negative but longer posts (columns (ii) and (iv)). However, it is important to note that this
negative effect on valence does not necessarily mean that consumers who watch intensively have
a more negative opinion of the focal media product as a consequence of the viewing modus.
As mentioned before, discussion threads cover a wide range of topics related to the focal anime
season, including new season release dates, voice cast decisions, story lines, specific characters,
awards, and anime adaptations. It is possible that, if an individual watches intensively, she likes
28

the focal media product more, but makes a more negative post in a thread on the discussion
forum, for example, about the wait time until the next season becomes available.
Columns (vii) and (viii) in Table 5 show the results for recommendations – another form
of verbal UGC. Recall that recommendations on this platform exhibit the following pattern:
“If you like anime A, you will like anime B because of XYZ.” In that sense, individuals give
a recommendation for which two animes are similar, but not necessarily an endorsement that
either of these two animes is particularly good. Providing such a recommendation is likely to
be driven by a consumer’s higher interest level in an anime. We find that consumers who watch
intensively are significantly more likely to write a recommendation for the focal media product
than consumers who watch at a slower pace, but conditional on submitting a recommendation,
the former group does not write more recommendations than the latter group. Here, it is also
important to note that the recommendation count is very small in our estimation sample since
only a very small fraction of users make any recommendations and an even smaller fraction of
users makes more than one recommendation.
Ratings are different from the two previously mentioned forms of UGC in that they are
numerical and in that a higher rating clearly indicates a more favorable opinion towards the
rated anime. Furthermore, while ratings are publicly visible to everybody like the two other
forms of UGC, they are recorded by a user on her watch list and help her remember her
preference for or liking of a particular anime. This partly explains why ratings are the dominant
form of UGC in terms of user participation on this platform. Our results in columns (v) and
(vi) in Table 5 show that, if an individual watches intensively, she is significantly less likely to
rate the focal media product, but if she does rate it, she gives it a more positive rating than an
individual who watches at a slower pace.
To summarize, our results show that forum post incidence and frequency are rather driven by
unobserved consumer heterogeneity than HiVi. We also find that HiVi increases the probability
that an individual writes a recommendation for the focal media product. And lastly, we find
that consumers are less likely to rate an anime if they watch intensively, but conditional on
rating it, they give it a more positive rating.
29

Given that consumers who watch intensively are less likely to rate animes, we interpret our
results as providing partial support for HiVi having a negative effect on the amount of UGC
produced. We acknowledge that HiVi increases the probability of writing a recommendation.
However, ratings are a far more frequent form of interactive engagement on this platform (and
on most UGC platforms in general). We believe the negative effect of HiVi on the rating
submission can be explained by the inclination of consumers who watch intensively to stay
in the flow and to avoid any activity that distracts from or interrupts the watching, which
is also consistent with the avoidance tendency of bingeing individuals towards advertisements
documented in Schweidel and Moe (2016).
Furthermore, we believe that our results provide some evidence that HiVi increases con-
sumers’ liking of an anime. This is because individuals who watch intensively rate the focal
anime higher. This effect is consistent with previous research which suggests that bingeing
induces loyalty and fandom-like behavior (Devasagayam 2014, Jenner 2015).
6 Heterogeneity
In this section, we explore the extent of heterogeneity in our results with respect to five consumer
characteristics: geography, age, gender, usage, and experience.24 We explore three manifesta-
tions of heterogeneity: (i) in the viewing modus decision, (ii) in the baseline probability to
engage, and (iii) in the effect of viewing modus.
We start by exploring heterogeneity in the viewing modus decision.25 We find that con-
sumers outside of North America are less likely to watch intensively than consumers in North
America. Older (above 25 years), more experienced consumers, and consumers with higher
recent usage are also less likely to watch intensively than younger, less experienced consumers,
24We operationalize all heterogeneity variables as dummy variables. For experience, we conduct a median-split and operationalize experience as a high-experience dummy variable. Similarly, for usage, we conduct a3rd quartile split and operationalize usage as a high-usage dummy variable. We use the 3rd quartile as thesplit cutoff for usage because the median is 0. Geography and gender vary across individuals; age, usage, andexperience vary across individuals and time.
25Coefficient estimates for the heterogeneity variables (quantifying the effects of the heterogeneity variableson consumers’ decision to watch intensively) are shown in the lower halves of Tables C-1 to C-10 in WebAppendix C.
30

and consumers with no recent usage, respectively.
Next, we describe heterogeneity in both the baseline probability to engage and in the effects
of viewing modus on consumers’ personal and interactive engagement. A summary of the results
is shown in Table 7. Note that the table contains the results from a large number separate
regressions – one for each of the five sources of heterogeneity and each dependent variable.
The complete regression results with all coefficient estimates for all regressions can be found
in Web Appendix C. Further note that, since we are interested in the extent of heterogeneity,
we show the differential effects in Table 7, i.e., the estimates displayed in Table 7 indicate by
how much an effect is different from the baseline and whether this difference is statistically
significant. Intuitively speaking, significant effects in Table 7 mean that there is heterogeneity
and insignificant effects mean that there is no heterogeneity.26 And lastly, in Table 7, we show
both how the baseline probabilities to engage vary with consumer characteristics – these effects
are denoted by, for example, “Differential Effect of Europe” or “Differential Effect of Being
Female” – and how the effects of viewing modus vary with consumer characteristics – these
effects are denoted by, for example, “Differential Effect of HiVi in Europe” or Differential Effect
of HiVi for Females.”
In the following, we use a few examples to illustrate how the estimates in Table 7 should be
interpreted. For example, the baseline for the regressions exploring geographic heterogeneity is
North America (see 2nd line in Table 7). The differential effect of HiVi in Europe (as compared
to North America) for “Sequel & Available” is −0.021 and statistically insignificant (see column
(i) in Table 7). 27 This result shows the effect of HiVi on whether consumers watch a franchise
extension in case of “Sequel & Available” is the same for consumers in Europe and North
America. To give a second example, the differential effect of watching intensively in Asia (as
compared to North America) on forum post incidence is 0.189 and significant at p < 0.05
26We acknowledge that, strictly speaking, a statistically insignificant differential effect means that we cannotreject the null hypothesis of no heterogeneous effect and a statistically significant differential effect means thatwe can reject the null hypothesis of no heterogeneous effect.
27The differential effect of bingeing in Europe for “Sequel & Available” was calculated as follows using thecoefficient estimates from column (i) in Table C-1 in Web Appendix C: Europe × HiVi + Europe × HiVi ×Sequel + Europe × HiVi × Available + Europe × HiVi × Sequel × Available = 0.005+(−0.093)+0.017+0.050 =−0.021.
31

(see column (iv) in Table 7).28 This implies that Asian consumers who watch intensively are
significantly more likely to post on the discussion forum than North American consumers who
watch intensively. And lastly, we also show the differential effects of the heterogeneity variables
on the baseline engagement probabilities. For example, the “Differential Effect of Europe” on
watching a franchise extension is 0.126 and significant at p < 0.001 (see column (i) in Table
7).29 This means that consumers in Europe are significantly more likely to watch a franchise
extension than consumers in North America.
—— Insert Table 7 about here ——
Our results suggest a limited amount of heterogeneity in the baseline probabilities of en-
gaging with a media franchise. We find that consumers outside of North America are more
likely to personally engage, but less likely to interactively engage with a media franchise than
consumers in North America. Female consumers are more likely to finish watching a franchise
extension, to submit ratings, and to publish posts on the discussion forum than male consumers.
However, the length of forum posts and valence of ratings submitted by women is lower than
the length of forum posts and valence of ratings submitted by men. Older consumers, in gen-
eral, are less likely to interactively engage with a media franchise than younger consumers, as
indicated by their lower participation in all three forms of UGC. Further, we find very little to
no heterogeneity in the engagement probabilities related to experience and recent usage.
Lastly, we discuss the amount of heterogeneity in the effects of viewing modus. Regarding
personal engagement, consumers outside of North America who watch intensively are generally
more likely to watch a franchise extension immediately next than consumers in North America
who watch intensively (see column (iii) in Table 7). With regard to interactive engagement,
consumers in Europe and Oceania who watch intensively write more forum posts than con-
sumers in North America who watch intensively. Consumers in South America and Asia who
watch intensively submit fewer ratings and worse ratings, respectively, than consumers in North
28The differential effect of HiVi in Asia on forum post incidence equals the coefficient estimate for Asia ×HiVi in column (i) in Table C-2 in Web Appendix C.
29The differential effect of Europe on watching a franchise extension equals the coefficient estimate for theEurope dummy in column (i) in Table C-1 in Web Appendix C.
32

America who watch intensively. We only find two heterogeneous effects of HiVi related to age:
the effect of HiVi on watching a franchise that is neither a sequel nor available is smaller for
people older than 20 years old than younger people and the effect of HiVi on watching a fran-
chise that is not sequel immediately next is larger for the age group of 20 to 25 years than
for younger consumers. Regarding our two behavioral segmentation criteria of experience and
recent usage, our results show that consumers with a lot of experience who watch intensively
are less likely to finish a franchise extension (that is unavailable and of other type) than con-
sumers with little experience who watch intensively. Further, we find that the effect of HiVi
on interactive engagement varies with experience: consumers with more experience who watch
intensively write more forum posts and more recommendations but give worse ratings than
their less experienced counterparts. And lastly, we find that consumers with high recent usage
who watch intensively write more recommendations than consumers with no recent usage who
watch intensively.
To summarize, geographic heterogeneity is mostly captured by different behaviors of con-
sumers in and outside of North America: consumers outside of North America are less likely
to watch intensively, more likely to engage personally, and less likely to engage interactively
than consumers in North America. Further, if consumers outside of North America watch in-
tensively, they are more likely to watch a franchise extension immediately next than consumers
from North America who watch intensively. We find a limited amount of heterogeneity related
to age and gender: older consumers are less likely to watch intensively and produce UGC related
to a media franchise than younger consumers. Women are more likely to write forum posts and
submit ratings, but these forum posts are shorter and ratings are worse than those written and
submitted by men. Among our two behavioral segmentation criteria of experience and recent
usage, our results indicate that more experienced consumers and consumers with higher recent
usage are less likely to watch intensively than less experienced consumers and consumers with
no recent usage. Lastly, we find that the effects of HiVi on interactive engagement vary with
experience and usage: more experienced consumers and consumers with higher recent usage
who watch intensively tend to generate more forum posts and/or recommendations related to
33

a media franchise than less experienced consumers and consumers with no recent usage who
watch intensively.
7 Limitations and Future Research
There are several limitations to our research. First, a media franchise can also include mer-
chandising items that are available for purchase, such as posters, coffee mugs, toys, and trading
card games. In our data, we do not observe purchases of such ancillary products. It is left for
future research to investigate whether the viewing modus affects such purchases. Second, even
though we provide evidence for the validity of our data, measurement error in our HiVi variable
due to its self-reported nature remains a potential concern. It is well-known that measurement
error in an independent variable leads to attenuation bias, i.e. a bias of the coefficient towards
zero. Thus our results should be interpreted as a lower bound of the effects of HiVi.
Third, some TV shows or movies have a higher probability of being watched intensively
than others due to their creative content, which we do not consider in our model. It is left for
future research to study whether and how different content characteristics make a show more or
less suitable for an intensive viewing modus. And lastly, viewing modus may differ significantly
depending on the methods or channels of watching such as online streaming websites, streaming
platforms, DVDs, or piracy websites. An interesting direction for future research is to explore
how these different channels should design and deploy user interfaces, advertising methods, and
sequential watching strategies to influence the viewing modus.
8 Conclusion
With the introduction of high-speed Internet during the last 15 years, HiVi has become very
common among TV viewers. An open empirical question is whether the viewing modus has
implications for user engagement compared to the traditional, linear way of watching TV. In
this paper, using novel data coming from an online anime platform containing information on
34

individual users’ adoptions of different animes and their user-generated content, we examine
the relationship between HiVi and consumers’ engagement with a media franchise as related
to user-generated content and the adoption of franchise extensions. Our paper thus adds to
the small but rapidly growing body of literature on consumers’ digital media consumption as
well as on the online streaming industry. To the best of our knowledge, our paper is the first
systematic empirical examination of the effects of viewing modus on user engagement with a
media franchise.
Our results show that the effect of HiVi on personal engagement crucially depends on
both the type and the availability of franchise extensions at the time of watching the focal
media product. If the franchise extension is available, HiVi increases the probability that a
user watches the next season, while it has the opposite effect for other franchise extensions.
If the franchise extension is not available, HiVi decreases the adoption probability for both
sequels and other types of franchise extensions. However, conditional on starting to watch a
franchise extension, watching intensively increases the probability that a consumer finishes to
watch it in all four scenarios. We also find that HiVi increases the probability that a consumer
watches a franchise extension immediately after watching the focal media product. We believe
these effects are driven by the balance between the flow and the satiation, two forces created
by HiVi but operating in opposite directions. Regarding interactive engagement, our results
suggest HiVi decreases the submission of ratings, the most dominant form of UGC on the
platform, providing partial support for the avoidance tendency of binge-watchers proposed and
documented in previous literature.
Our results offer the following important managerial implications for TV channels and on-
line streaming platforms. First, HiVi can boost viewership of subsequent seasons (sequels).
However, the availability of the subsequent season plays a crucial role. Media content providers
have started to recognize this by making prior seasons available (for intensive viewing) shortly
before the release of the next season. Figure 8 shows several examples from Netflix.
—— Insert Figure 8 about here ——
35

Second, HiVi does not boost viewership of all franchise extensions. Which franchise exten-
sions benefit from a prior season that is available for intensive viewing depends on whether
the franchise extension helps to continue the flow viewers experience when watching the prior
season intensively. Franchise extensions that differ significantly in story lines and/or main char-
acters may not attract viewers who watched the prior season intensively. The general lackluster
performance of spin-offs speaks to the importance of staying close to the successful original
series when developing franchised extensions.30
Third, online streaming platforms such as Netflix have been aggressive in expanding their
services beyond the home country. Our study provides first empirical evidence regarding the
similarities and differences in consumers’ media consumption and engagement behaviors across
five continents. Specifically, we find that the effects of HiVi are present and robust across the
different regions, with a stronger effect on personal engagement for consumers outside of North
America. These findings provide valuable information that helps streaming providers decide to
what extent their content strategy in general and content release timing strategy in particular
should be customized to accommodate local consumers’ preferences.
References
Aarseth, E (2006), ‘The culture and business of cross-media productions’, Popular Communication
4(3), 203–211.
Ahmed, A (2017), ‘New era of tv-watching behavior: Binge-watching and its psychological effects’,
Media Watch 8(2), 192–207.
Algesheimer, R, U Dholakia and A Herrmann (2005), ‘The social influence of brand community:
Evidence from european car clubs’, Journal of Marketing 69(3), 19–34.
Ameri, M, E Honka and Y Xie (2019), ‘Word-of-mouth, observed adoptions, and anime watching
decisions: The role of the personal versus the community network’, Marketing Science 38(4), 567–
583.
Bowden, J (2009), ‘The process of customer engagement: A conceptual framework’, Journal of Mar-
keting Theory and Practice 17(1), 63–74.
30Wikipedia lists 1,142 TV spin-offs on its website (https://en.wikipedia.org/wiki/List of television spin-offs). Only 135 spin-offs (12%) ran for 5 or more seasons. 413 spin-offs (36%) ran for one season or less.
36

Brakus, J, B Schmitt and L Zarantonello (2009), ‘Brand experience: What is it? how is it measured?
does it affect loyalty?’, Journal of Marketing 73(3), 52–68.
Brodie, R, L Hollebeek, B Juric and A Ilic (2011), ‘Customer engagement: Conceptual domain,
fundamental propositions, and implications for research’, Journal of Service Research 14(3), 252–
271.
Calder, B, E Malthouse and U Schaedel (2009), ‘An experimental study of the relationship between
online engagement and advertising effectiveness’, Journal of Interactive Marketing 23(4), 321–331.
Cha, J (2013), ‘Predictors of television and online video platform use: A coexistence model of old and
new video platforms’, Telematics and Informatics 30(4), 296–310.
Cha, J and S Chan-Olmsted (2012), ‘Substitutability between online video platforms and television’,
Journalism & Mass Communication Quarterly 89(2), 261–278.
Chou, T and Ch Ting (2003), ‘The role of flow experience in cyber-game addiction’, CyberPsychology
& Behavior 6(6), 663–675.
Csikszentmihalyi, M (1997), Finding Flow: The Psychology of Engagement with Everyday Life, Basic
Books.
Devasagayam, R (2014), ‘Media bingeing: A qualitative study of psychological influences’, Proceedings
of the Marketing Management Association p. 40.
Flayelle, M, P Maurage and J Billieux (2017), ‘Toward a qualitative understanding of binge-watching
behaviors: A focus group approach’, Journal of Behavioral Addictions 6(4), 457–471.
Godinho de Matos, M and P Ferreira (2018), ‘Binge yourself out: The effect of binge watching on the
subscription of video on demand’, Working Paper .
Heckman, J (1978), ‘Dummy endogenous variables in a simultaneous equation system’, Econometrica
46(4), 931–959.
Hernandez, B (2014), ‘All ‘breaking bad’ episodes are now on netflix’.
URL: http://mashable.com/2014/02/24/all-breaking-bad-netflix/#XRHTdKSPkmqY
Higgins, E and A Scholer (2009), ‘Engaging the consumer: The science and art of the value creation
process’, Journal of Consumer Psychology 19(2), 100–114.
Hoffman, D and T Novak (1996), ‘Marketing in hypermedia computer-mediated environments: Con-
ceptual foundations’, Journal of Marketing 60(3), 50–68.
Hoyer, W, R Chandy, M Dorotic, M Krafft and S Singh (2010), ‘Consumer cocreation in new product
development’, Journal of Service Research 13(3), 283–296.
Jenner, M (2015), ‘Binge-watching: Video-on-demand, quality tv and mainstreaming fandom’, Inter-
national Journal of Cultural Studies 20(3), 304–320.
Kozinets, R (1999), ‘E-tribalized marketing?: The strategic implications of virtual communities of
consumption’, European Management Journal 17(3), 252–264.
37

Kubey, R and M Csikszentmihalyi (2002), ‘Television addiction’, Scientific American 286(2), 74–81.
Kumar, V, L Aksoy, B Donkers, R Venkatesan, Th Wiesel and S Tillmanns (2010), ‘Undervalued or
overvalued customers: Capturing total customer engagement value’, Journal of Service Research
13(3), 297–310.
Lovett, M and R Staelin (2016), ‘The role of paid and earned media in building entertainment brands:
Reminding, informing, and enhancing enjoyment’, Marketing Science 35(1), 142–157.
Lu, T, E Bradlow and W Hutchinson (2017), ‘Binge consumption of online content’, Working Paper .
Maddala, G (1983), Limited-Dependent and Qualitative Variables in Econometrics, Cambridge Uni-
versity Press.
MarketCast (2013), ‘Marathon tv: How binge-viewing is changing the way we watch’.
URL: http://www.mcast.com/bingestudy/#sthash.oeqhmvqi.dpuf
Mollen, A and H Wilson (2010), ‘Engagement, telepresence and interactivity in online consumer
experience: Reconciling scholastic and managerial perspectives’, Journal of Business Research 63(9-
10), 919–925.
Nambisan, S and P Nambisan (2008), ‘How to profit from a better ‘virtual customer environment”,
MIT Sloan Management Review 49(3), 53–61.
Netflix (2013), ‘Binge watching is the new normal’.
URL: https://media.netflix.com/en/press-releases/netflix-declares-binge-watching-is-the-new-
normal
Patterson, P, T Yu and K De Ruyter (2006), ‘Understanding customer engagement in services’, pp. 4–6.
Pena, L (2015), Breaking Binge: Exploring the Effects of Binge Watching on Television Viewer Re-
ception, PhD thesis, Syracuse University.
Pittman, M and K Sheehan (2015), ‘Sprinting a media marathon: Uses and gratifications of binge-
watching television through netflix’, First Monday 20(10).
Rajaram, P, P Manchanda and E Schwartz (2018), Bingeability and ad tolerance: New metrics for
the streaming media age, in ‘Workshops at the Thirty-Second AAAI Conference on Artificial Intel-
ligence’.
Schweidel, D and W Moe (2016), ‘Binge watching and advertising’, Journal of Marketing 80(5), 1–19.
Shim, H and K Kim (2018), ‘An exploration of the motivations for binge-watching and the role of
individual differences’, Computers in Human Behavior 82, 94–100.
Sung, Y, E Kang and W Lee (2015), ‘A bad habit for your health? an exploration of psychological
factors for binge watching behavior’, 65th International Communication Association, San Juan .
TiVo (2015), ‘Original streamed series top binge viewing survey for first time’.
URL: http://pr.tivo.com/manual-releases/2015/Original-Streamed-Series-Top-Binge-Viewing-
Survey
38
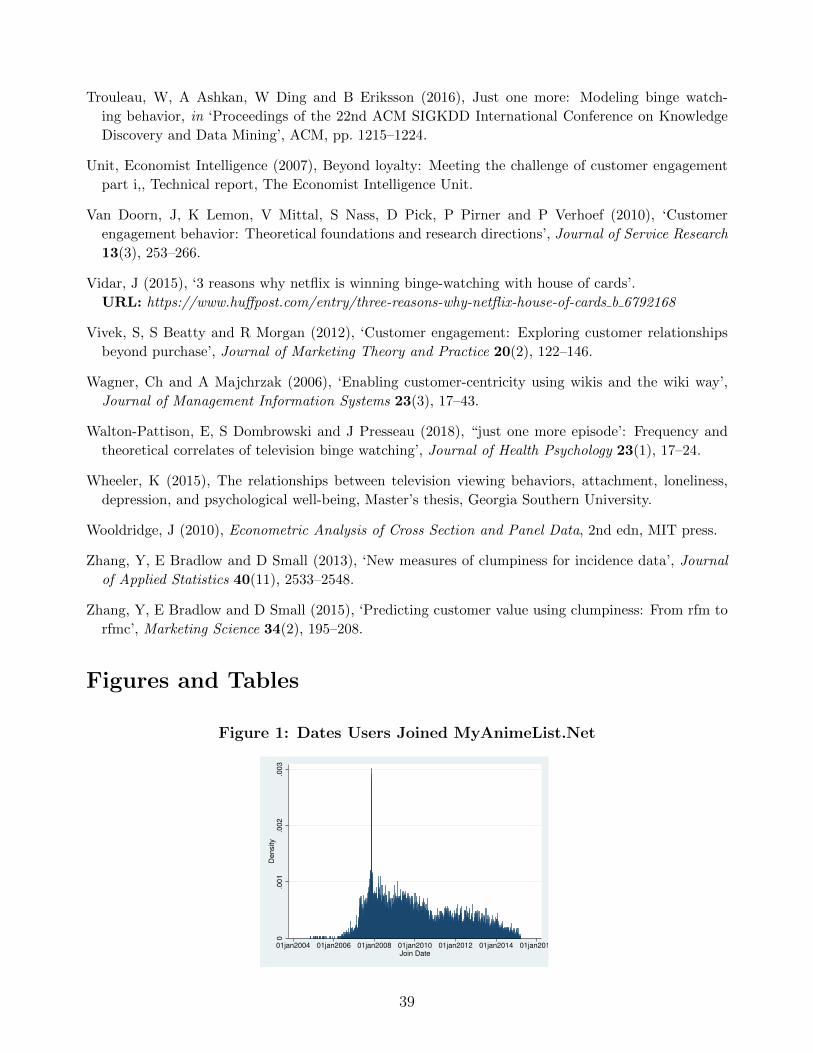
Trouleau, W, A Ashkan, W Ding and B Eriksson (2016), Just one more: Modeling binge watch-
ing behavior, in ‘Proceedings of the 22nd ACM SIGKDD International Conference on Knowledge
Discovery and Data Mining’, ACM, pp. 1215–1224.
Unit, Economist Intelligence (2007), Beyond loyalty: Meeting the challenge of customer engagement
part i,, Technical report, The Economist Intelligence Unit.
Van Doorn, J, K Lemon, V Mittal, S Nass, D Pick, P Pirner and P Verhoef (2010), ‘Customer
engagement behavior: Theoretical foundations and research directions’, Journal of Service Research
13(3), 253–266.
Vidar, J (2015), ‘3 reasons why netflix is winning binge-watching with house of cards’.
URL: https://www.huffpost.com/entry/three-reasons-why-netflix-house-of-cards b 6792168
Vivek, S, S Beatty and R Morgan (2012), ‘Customer engagement: Exploring customer relationships
beyond purchase’, Journal of Marketing Theory and Practice 20(2), 122–146.
Wagner, Ch and A Majchrzak (2006), ‘Enabling customer-centricity using wikis and the wiki way’,
Journal of Management Information Systems 23(3), 17–43.
Walton-Pattison, E, S Dombrowski and J Presseau (2018), “just one more episode’: Frequency and
theoretical correlates of television binge watching’, Journal of Health Psychology 23(1), 17–24.
Wheeler, K (2015), The relationships between television viewing behaviors, attachment, loneliness,
depression, and psychological well-being, Master’s thesis, Georgia Southern University.
Wooldridge, J (2010), Econometric Analysis of Cross Section and Panel Data, 2nd edn, MIT press.
Zhang, Y, E Bradlow and D Small (2013), ‘New measures of clumpiness for incidence data’, Journal
of Applied Statistics 40(11), 2533–2548.
Zhang, Y, E Bradlow and D Small (2015), ‘Predicting customer value using clumpiness: From rfm to
rfmc’, Marketing Science 34(2), 195–208.
Figures and Tables
Figure 1: Dates Users Joined MyAnimeList.Net
0.0
01
.002
.003
Density
01jan2004 01jan2006 01jan2008 01jan2010 01jan2012 01jan2014 01jan2016Join Date
39

Figure 2: Number of Days After Release of First or Final Episode in a Season ThatAnimes Were Watched
(a) High Intensity Viewing: Num-ber of days after FIRST episode ina season (truncated at 1,000 days)
0.0
01
.002
.003
.004
Density
0 200 400 600 800 1000Days after release
(b) Low Intensity Viewing: Num-ber of days after FIRST episode ina season (truncated at 500 days)
0.0
01
.002
.003
.004
Density
0 200 400 600 800 1000Days after release
(c) High Intensity Viewing: Num-ber of days after LAST episode in aseason (truncated at 1,000 days)
0.0
02
.004
.006
.008
Density
0 200 400 600 800 1000Days after finale
(d) Low Intensity Viewing: Num-ber of days after LAST episode in aseason (truncated at 500 days)
0.0
01
.002
.003
.004
.005
Density
0 200 400 600 800 1000Days after finale
Figure 3: Watch Period Distribution (truncated at 200 days)
0.1
.2.3
.4.5
Density
0 50 100 150 200Watch Period−Days
40

Figure 4: Number of Hours Watched Per Day
(a) Days with High Intensity Viewing0
.2.4
.6.8
Density
0 3 6 9 12 15 18 21 24Binge−Hours Per Day
(b) Days with Low Intensity Viewing
0.2
.4.6
.8D
ensity
0 3 6 9 12 15 18 21 24Non Binge−Hours Per Day
Figure 5: Percentage of A User’s Watch List That Is Watched at High Intensity
(a) Including 0% and 100%
0.1
.2.3
.4D
ensity
0 .2 .4 .6 .8 1percentage of animes
(b) Excluding 0% and 100%0
.02
.04
.06
.08
Density
0 .2 .4 .6 .8 1percentage of animes
Figure 6: High vs Low Intensity Viewership Across Time
05
00
01
.0e
+0
41
.5e
+0
4F
req
ue
ncy
01jan2008
01jan2009
01jan2010
01jan2011
01jan2012
01jan2013
01jan2014
01jan2015
Adoption
Binged Not Binged
41

Figure 7: Distribution of UGC for High vs. Low Intensity Viewing
(a) High Intensity Viewing:Publishing Forum Posts
99.36%
.6369%
Not published Published
(b) Low Intensity Viewing:Publishing Forum Posts
99.3%
.6968%
Not published Published
(c) High Intensity Viewing:Average Sentiment of ForumPosts
05
10
15
20
Pe
rce
nt
−1 −.5 0 .5 1Average Sentiment of Post
(d) Low Intensity Viewing:Average Sentiment of ForumPosts
05
10
15
20
Pe
rce
nt
−1 −.5 0 .5 1Average Sentiment of Post
(e) High Intensity Viewing:Average Number of Wordsin Forum Posts
05
10
15
20
Pe
rce
nt
0 100 200 300Average Number of Words in Post
(f) Low Intensity Viewing:Average Number of Wordsin Forum Posts
05
10
15
20
Pe
rce
nt
0 100 200 300Average Number of Words in Post
(g) High Intensity Viewing:Average Number of ForumPosts
02
04
06
08
01
00
Pe
rce
nt
0 20 40 60 80
Number of Post
(h) Low Intensity Viewing:Average Number of ForumPosts
02
04
06
08
01
00
Pe
rce
nt
0 20 40 60 80
Number of Post
42

Figure 7: Distribution of UGC for High vs. Low Intensity Viewing (Continued)
(i) High Intensity Viewing:Publishing a Rating
8.027%
91.97%
Not published Published
(j) Low Intensity Viewing:Publishing a Rating
7.127%
92.87%
Not published Published
(k) High Intensity Viewing:Distribution of Ratings
0.0
5.1
.15
.2.2
5.3
De
nsity
0 2 4 6 8 10Rating
(l) Low Intensity Viewing:Distribution of Ratings
0.0
5.1
.15
.2.2
5.3
De
nsity
0 2 4 6 8 10Rating
(m) High Intensity Viewing:Publishing a Recommenda-tion
99.81%
.186%
Not published Published
(n) Low Intensity Viewing:Publishing a Recommenda-tion
99.82%
.1785%
Not published Published
(o) High Intensity Viewing:Distribution of Number ofRecommendations
02
04
06
08
01
00
Pe
rce
nt
0 1 2 3 4 5 6 7 8 9 10
Number of Post
(p) Low Intensity Viewing:Distribution of Number ofRecommendations
02
04
06
08
01
00
Pe
rce
nt
0 1 2 3 4 5 6 7 8 9 10
Number of Post
43

Figure 8: Examples of Release Dates on Netflix
Table 1: Number of Episodes in and Duration of a Season
Number of Episodes Freq. Percent Duration of Season (in Hours) Freq. Percent1 78 1.59 less than 1 867 17.712 740 15.09 1 - 2 906 18.503 - 7 892 18.19 2 - 3 307 6.278 - 11 192 3.92 3 - 4 142 2.9012 691 14.09 4 - 5 715 14.6013 627 12.79 5 - 6 440 8.9914 - 27 956 19.50 6 - 10 417 8.5228 - 56 566 11.54 10 - 15 495 10.1157 and more 161 3.28 15 - 20 252 5.15
20 and more 355 7.25
44

Table 2: Descriptive Statistics
Mean Std. Dev. Min Median Max NAge 18.96 4.607371 6.01 18.57 71.06 20,167Number of Animes in Last 30 Days 1.63 7.22 0 0 298.56 37,694Number of Total Animes Watched 56.63 138.37 0 0 3927 37,694
Proportion in % NGenderFemales 42 37,694Males 41 37,694Not Specified 17 37,694
GeographyNorth America 34 37,694South America 9 37,694Europe 46 37,694Asia 8 37,694Oceania 4 37,694
Animes Watched Over Weekend 31 37,694Animes Watched Over Holiday 3 37,694
Table 3: Distribution of Personal Engagement by Viewing Modus
Whether Franchise was Watched (in %)High Intensity Low Intensity
Sequel & Available 75.3 70.4Sequel & Not Available 54.0 54.7Other Type & Available 31.8 31.8Other Type & Not Available 31.4 33.1
Whether Franchise was Finished (in %)High Intensity Low Intensity
Sequel & Available 69.8 65.0Sequel & Not Available 52.2 52.9Other Type & Available 23.0 19.2Other Type & Not Available 23.6 22.9
Whether Franchise was Watched Next (in %)High Intensity Low Intensity
Sequel & Available 4.3 0.4Sequel & Not Available - -Other Type & Available 2.2 0.5Other Type & Not Available - -
45

Table 4: Results - Personal Engagement
Note that all three variables “High Intensity Viewing,” “Sequel,” and “Availability” are dummy variables.
The model in column (ii) is estimated using user-anime observations for which the user decided to watch a
franchise extension, i.e. conditional on watching (any type of) franchise extension. The model in column (iii) is
estimated using user-anime observations for which (at least) one franchise is available at the time of watching
the focal anime, i.e. conditional on a franchise being available.
Whether Franchise wasWatched Finished Watched Next
(i) (ii) (iii)
Engagement EquationHigh Intensity Viewing -0.142*** 0.185*** 0.781***
(0.020) (0.035) (0.035)High Intensity Viewing× Sequel 0.036* -0.044 0.416***
(0.017) (0.029) (0.026)High Intensity Viewing× Availability 0.030* 0.093***
(0.014) (0.026)High Intensity Viewing× Sequel × Availability 0.145*** 0.076*
(0.020) (0.032)Sequel 0.648*** 1.045*** -0.061**
(0.009) (0.014) (0.020)Availability -0.784*** -0.385***
(0.016) (0.018)Sequel × Availability 0.500*** 0.554***
(0.010) (0.015)Wait Time Until Franchise Available When Started Watching Focal Seasona -0.147*** -0.048***
(0.003) (0.003)Popularity Ranka,b -0.065*** -0.011*** 0.016*
(0.002) (0.003) (0.007)Community Ratingb 0.061*** 0.071*** -0.011
(0.004) (0.007) (0.016)Number of Episodesb 0.028*** -0.513***
(0.004) (0.019)Constant 0.141*** -1.768*** -1.357***
(0.042) (0.065) (0.159)Standard Deviation of User Random Effect 0.593*** 0.762*** 0.252***
(0.004) (0.006) (0.013)Genre Dummies Yes Yes YesCalendar Year Dummies Yes Yes Yes
Viewing Modus EquationWeekend Dummy 0.045*** 0.044*** 0.045***
(0.004) (0.006) (0.005)Holiday Dummy 0.027** 0.014 0.025
(0.010) (0.016) (0.014)Popularity Ranka,b -0.050*** -0.044*** -0.037***
(0.002) (0.003) (0.003)Community Ratingb 0.045*** 0.073*** 0.049***
(0.005) (0.007) (0.006)Number of Episodesb 0.042*** 0.045*** 0.053***
(0.005) (0.007) (0.006)Duration of an Episodea 0.132*** 0.179*** 0.181***
(0.019) (0.028) (0.025)Constant -1.938*** -2.287*** -2.076***
(0.076) (0.115) (0.099)Standard Deviation of User Random Effect 0.948*** 0.921*** 0.791***
(0.005) (0.007) (0.006)Genre Dummies Yes Yes YesCalendar Year Dummies Yes Yes Yes
Error Correlation 0.096*** -0.100*** -0.126***(0.010) (0.016) (0.020)
Number of Observations 764,666 345,108 396,928AIC 1,524,347.41 671,905.76 408,906.11BIC 1,525,698.43 673,142.20 410,125.95Log Likelihood -762,056.71 -335,837.88 -204,341.05
Standard errors in parentheses.
* p < 0.05, ** p < 0.01, *** p < 0.001a Measured on logarithmic scale.b Of focal season.
46

Table 5: Results - Interactive Engagement
Note that the variable “High Intensity Viewing” is a dummy variable.
The models in column (ii), (iii), and (iv) are estimated using user-anime observations for which the user made (at
least) one forum post, i.e. conditional on a forum post. The model in column (vi) is estimated using user-anime
observations which the user rated, i.e. conditional on a rating. The model in column (viii) is estimated using
user-anime observations for which the user wrote a recommendation, i.e. conditional on a recommendation.
Forum Posts Ratings RecommendationsIncidence Valence Number Length Incidence Valence Incidence Number
(i) (ii) (iii) (iv) (v) (vi) (vii) (viii)
Engagement EquationHigh Intensity Viewing 0.132 -0.077* -0.069 0.227* -0.243*** 0.128*** 0.118* 0.005
(0.083) (0.031) (0.079) (0.099) (0.030) (0.009) (0.049) (0.012)Ever-Made-a-Forum-Post Indicator 0.116*** 0.006 0.073* -0.064
(0.034) (0.011) (0.030) (0.041)Time Since Last Forum Posta -0.026** -0.003 -0.008 -0.012
(0.008) (0.004) (0.008) (0.011)Number of Forum Postsa,c 0.020** -0.005 -0.001 -0.032**
(0.007) (0.004) (0.009) (0.012)Number of Ratingsa,c 0.004 0.003
(0.007) (0.002)Number of Recommendationsa,c 0.282*** 0.015
(0.038) (0.010)Popularity Ranka,b 0.095*** 0.004 0.024* 0.013 -0.059*** 0.057*** 0.045 0.005
(0.009) (0.004) (0.010) (0.013) (0.012) (0.004) (0.028) (0.007)Community Ratingb 0.046* 0.044*** 0.039 -0.022 0.123*** 1.034*** 0.098 -0.004
(0.020) (0.009) (0.022) (0.030) (0.028) (0.008) (0.056) (0.013)Number of Episodesb 0.360*** -0.012 0.273*** 0.095***
(0.018) (0.008) (0.020) (0.027)Constant -6.159*** -0.098 -0.189 3.369*** 3.693*** -0.318*** -5.856*** 0.682***
(0.193) (0.085) (0.205) (0.272) (0.274) (0.080) (0.534) (0.118)Standard Deviation of User Random Effect 1.424*** 0.067*** 0.329*** 0.510*** 2.861*** 0.764*** 1.078*** 0.044***
(0.027) (0.009) (0.012) (0.020) (0.034) (0.003) (0.011) (0.004)Genre Dummies Yes Yes Yes Yes Yes Yes Yes YesCalendar Year Dummies Yes Yes Yes Yes Yes Yes Yes Yes
Viewing Modus EquationWeekend Dummy 0.053*** 0.043 0.038 0.039 0.053*** 0.052*** 0.053*** 0.055
(0.004) (0.057) (0.058) (0.058) (0.011) (0.009) (0.010) (0.148)Holiday Dummy 0.024* 0.311* 0.304* 0.305* 0.025 0.022 0.024 -0.289
(0.011) (0.132) (0.134) (0.134) (0.029) (0.024) (0.026) (0.370)Popularity Rankb -0.030*** -0.089*** -0.089*** -0.088*** -0.030*** -0.031*** -0.031*** 0.018
(0.002) (0.026) (0.026) (0.026) (0.005) (0.004) (0.005) (0.067)Community Ratingb 0.054*** 0.027 0.023 0.025 0.054*** 0.058*** 0.055*** 0.363*
(0.005) (0.064) (0.064) (0.064) (0.012) (0.010) (0.011) (0.182)Number of Episodesb 0.052*** -0.045 -0.049 -0.044 0.051*** 0.052*** 0.051*** -0.064
(0.005) (0.058) (0.058) (0.058) (0.012) (0.010) (0.011) (0.171)Duration of an Episodea 0.380*** 0.493 0.480 0.493 0.382*** 0.379*** 0.379*** 0.482
(0.017) (0.285) (0.285) (0.285) (0.045) (0.038) (0.040) (0.986)Constant -2.728*** -2.367* -2.288* -2.376* -2.727*** -2.772*** -2.728*** -5.413
(0.069) (1.083) (1.087) (1.084) (0.186) (0.155) (0.164) (3.541)Standard Deviation of User Random Effect 0.774*** 0.963*** 0.976*** 0.981*** 0.780*** 0.753*** 0.758*** 0.867***
(0.005) (0.071) (0.072) (0.073) (0.005) (0.005) (0.005) (0.131)Genre Dummies Yes Yes Yes Yes Yes Yes Yes YesCalendar Year Dummies Yes Yes Yes Yes Yes Yes Yes Yes
Error Correlation -0.073 0.176 0.039 -0.126 0.144*** 0.007*** -0.048* 0.033(0.050) (0.090) (0.093) (0.087) (0.007) (0.002) (0.020) (0.048)
Number of Observations 663,963 4,564 4,564 4,564 663,963 615,325 663,963 1,215AIC 649,332.48 4,941.87 13,031.46 15,649.22 744,916.84 2,539,647.62 625,884.76 193.45BIC 650,176.52 5,655.15 13,744.74 16,362.51 746,205.71 2,540,939.23 627,128.01 729.21Log Likelihood -324,592.24 -2,359.93 -6,404.73 -7,713.61 -372,345.42 -1,269,709.81 -312,833.38 8.28
Standard errors in parentheses.
* p < 0.05, ** p < 0.01, *** p < 0.001a Measured on logarithmic scale.b Of focal season.c At the time of watching focal anime season.
47

Table 6: Effects of High Intensity Viewership
Whether Franchise wasWatched Finished Watched Next
(i) (ii) (iii)
Sequel & Available 0.069* 0.310*** 1.197***(0.036) (0.061) (0.044)
Sequel & Not Available -0.106*** 0.141***(0.026) (0.045)
Other Type & Available -0.112*** 0.278*** 0.781***(0.024) (0.044) (0.035)
Other Type & Not Available -0.142*** 0.185***(0.020) (0.035)
Standard errors in parentheses.
* p < 0.05, ** p < 0.01, *** p < 0.001
48

Table 7: Sources of Heterogeneity - Differential Effects
PERSONAL ENGAGEMENT INTERACTIVE ENGAGEMENTWhether Franchise was Forum Posts Ratings Recommendations
Watched Finished Watched Next Incidence Valence Number Length Incidence Valence Incidence Number(i) (ii) (iii) (iv) (v) (vi) (vii) (viii) (ix) (x) (xi)
GEOGRAPHYBaseline: North America (not shown)
Differential Effect of HiVia in EUROPE... 0.025 -0.028 0.120* 0.122 -0.110 -0.008 -0.097 -0.019(0.046) (0.022) (0.054) (0.072) (0.058) (0.018) (0.110) (0.026)
... for Sequel & Available -0.021 0.012 0.246***(0.061) (0.107) (0.055)
... for Sequel & Not Available -0.088* 0.029(0.041) (0.072)
... for Other Type & Available 0.022 -0.021 0.201***(0.036) (0.069) (0.040)
... for Other Type & Not Available 0.005 0.008(0.025) (0.047)
Differential Effect of HiVia in OCEANIA... 0.049 0.007 0.283* -0.014 -0.218 -0.023 -0.189 -0.018(0.103) (0.046) (0.113) (0.150) (0.165) (0.053) (0.288) (0.069)
... for Sequel & Available 0.020 -0.008 0.368*(0.178) (0.297) (0.144)
... for Sequel & Not Available 0.038 0.088(0.119) (0.201)
... for Other Type & Available -0.084 -0.023 0.139(0.105) (0.189) (0.101)
... for Other Type & Not Available 0.177* -0.063(0.072) (0.129)
Differential Effect of HiVia in ASIA... 0.189* -0.022 0.046 -0.039 -0.094 -0.067* 0.046 0.018(0.078) (0.035) (0.087) (0.115) (0.132) (0.033) (0.151) (0.038)
... for Sequel & Available -0.038 0.111 0.271**(0.113) (0.199) (0.098)
... for Sequel & Not Available -0.049 0.122(0.075) (0.135)
... for Other Type & Available -0.035 -0.086 0.112(0.067) (0.128) (0.069)
... for Other Type & Not Available 0.012 -0.164(0.046) (0.088)
Differential Effect of HiVia in 0.061 -0.076 0.149 -0.058 -0.344*** -0.039 -0.270 -0.029SOUTH AMERICA... (0.127) (0.061) (0.156) (0.211) (0.097) (0.035) (0.285) (0.074)
... for Sequel & Available -0.029 -0.008 0.121(0.126) (0.213) (0.102)
... for Sequel & Not Available -0.114 -0.007(0.084) (0.144)
... for Other Type & Available 0.015 -0.041 0.212**(0.074) (0.136) (0.069)
... for Other Type & Not Available -0.024 -0.005(0.051) (0.093)
Differential Effect of...... Europe 0.126*** 0.174*** 0.113*** -0.579*** -0.006 -0.119*** -0.101* -0.067* -0.052*** -0.352*** -0.005
(0.010) (0.014) (0.025) (0.039) (0.011) (0.033) (0.046) (0.032) (0.010) (0.053) (0.012)... Oceania 0.054* 0.057 0.073 -0.083 -0.005 -0.126* -0.086 0.148 -0.023 -0.088 -0.028
(0.023) (0.032) (0.056) (0.085) (0.022) (0.064) (0.090) (0.081) (0.026) (0.118) (0.028)... Asia 0.084*** 0.244*** 0.110** -0.315*** 0.010 -0.011 -0.102 0.049 0.270*** 0.011 -0.007
(0.017) (0.026) (0.041) (0.070) (0.020) (0.057) (0.079) (0.063) (0.018) (0.081) (0.021)... South America 0.196*** 0.263*** 0.151*** -0.756*** -0.007 -0.077 -0.287** -0.384*** 0.211*** -0.422*** -0.030
(0.016) (0.023) (0.038) (0.081) (0.023) (0.066) (0.093) (0.052) (0.017) (0.101) (0.026)
GENDERBaseline: Male (not shown)
Differential Effect of HiVia -0.064 0.014 -0.035 0.013 0.009 -0.008 0.167 0.046for FEMALES... (0.046) (0.021) (0.051) (0.068) (0.063) (0.018) (0.104) (0.025)
... for Sequel & Available -0.017 -0.005 0.031(0.061) (0.107) (0.054)
... for Sequel & Not Available 0.013 -0.021(0.041) (0.072)
... for Other Type & Available -0.007 -0.045 0.024(0.036) (0.069) (0.038)
... for Other Type & Not Available 0.036 -0.075(0.025) (0.047)
Differential Effect of Being Female 0.012 0.032* -0.024 0.162*** 0.009 0.029 -0.116** 0.069* -0.029** 0.048 -0.003(0.009) (0.013) (0.022) (0.037) (0.011) (0.031) (0.043) (0.031) (0.010) (0.051) (0.012)
Standard errors in parentheses.
* p < 0.05, ** p < 0.01, *** p < 0.001a High Intensity Viewing 49

Table 7: Sources of Heterogeneity - Differential Effects
PERSONAL ENGAGEMENT INTERACTIVE ENGAGEMENTWhether Franchise was Forum Posts Ratings Recommendations
Watched Finished Watched Next Incidence Valence Number Length Incidence Valence Incidence Number(i) (ii) (iii) (iv) (v) (vi) (vii) (viii) (ix) (x) (xi)
AGEBaseline: Age < 20 (not shown)
Differential Effect of HiVia 0.076 -0.031 -0.081 -0.071 -0.066 -0.015 0.081 0.025for AGE: 20 - 25... (0.066) (0.030) (0.073) (0.097) (0.084) (0.025) (0.134) (0.034)
... for Sequel & Available -0.020 0.064 0.025(0.088) (0.160) (0.076)
... for Sequel & Not Available -0.049 0.020(0.060) (0.108)
... for Other Type & Available -0.011 -0.049 0.104*(0.053) (0.103) (0.053)
... for Other Type & Not Available -0.086* -0.079(0.037) (0.071)
Differential Effect of HiVia 0.076 0.054 0.063 0.080 -0.098 -0.015 -0.174 -0.005for AGE > 25... (0.065) (0.029) (0.072) (0.097) (0.084) (0.025) (0.158) (0.039)
... for Sequel & Available -0.008 0.030 -0.013(0.086) (0.153) (0.076)
... for Sequel & Not Available -0.040 0.085(0.058) (0.103)
... for Other Type & Available 0.004 0.007 0.054(0.051) (0.098) (0.053)
... for Other Type & Not Available -0.104** 0.014(0.035) (0.067)
Differential Effect of...... Age: 20 - 25 0.015 -0.019 -0.001 -0.134** -0.001 -0.015 0.022 -0.068 -0.013 -0.110 0.010
(0.009) (0.014) (0.031) (0.043) (0.016) (0.042) (0.058) (0.044) (0.013) (0.075) (0.018)... Age > 25 -0.016 -0.017 0.046 -0.132** -0.009 -0.042 -0.018 -0.137** 0.012 -0.172* 0.001
(0.011) (0.017) (0.030) (0.049) (0.015) (0.043) (0.061) (0.042) (0.013) (0.074) (0.018)
EXPERIENCEBaseline: Little Experience (not shown)
Differential Effect of HiVia with 0.064 0.009 0.141* 0.073 0.098 -0.020* 0.098 0.051*LARGE EXPERIENCE... (0.052) (0.023) (0.057) (0.075) (0.078) (0.009) (0.078) (0.025)
... for Sequel & Available -0.038 0.022 0.065(0.071) (0.128) (0.058)
... for Sequel & Not Available -0.092 0.100(0.048) (0.087)
... for Other Type & Available -0.005 -0.055 0.047(0.042) (0.083) (0.040)
... for Other Type & Not Available -0.056 -0.198***(0.029) (0.057)
Differential Effect of Large Experience -0.002 0.015 0.005 -0.067 0.009 -0.050 -0.008 0.024 -0.021 0.024 -0.007(0.007) (0.011) (0.023) (0.037) (0.013) (0.035) (0.049) (0.050) (0.011) (0.050) (0.014)
USAGEBaseline: No Recent Usage (not shown)
Differential Effect of HiVia -0.012 0.008 -0.006 0.058 0.014 -0.015 0.113 0.060*with HIGH RECENT USAGE... (0.067) (0.030) (0.074) (0.098) (0.035) (0.011) (0.094) (0.029)
... for Sequel & Available -0.051 0.012 0.024(0.088) (0.159) (0.076)
... for Sequel & Not Available -0.033 0.116(0.059) (0.108)
... for Other Type & Available -0.028 -0.045 0.004(0.052) (0.102) (0.052)
... for Other Type & Not Available -0.035 -0.117(0.036) (0.070)
Differential Effect of High Recent Usage 0.002 0.026* -0.018 -0.052 -0.005 -0.064 -0.021 -0.017 -0.017* 0.019 -0.015(0.007) (0.011) (0.029) (0.038) (0.015) (0.040) (0.054) (0.023) (0.007) (0.054) (0.016)
Standard errors in parentheses.
* p < 0.05, ** p < 0.01, *** p < 0.001a High Intensity Viewing
50

Web Appendix A: Definitions
Table A-1: Definitions of Engagement
Personal InteractivePaper Definition Engagement Engagement
Algesheimer et al. (2005) Define “brand community engagement” as “a consumer’s intrinsic motivation to interact and coop-erate with community members.”
X
Patterson et al. (2006) Propose four specific customer engagement (CE) components, including (a) absorption: the level ofcustomer concentration on a focal engagement object, such as a brand/organization; (b) dedication:a customer’s sense of belonging to the organization/brand; (c) vigor: a customer’s level of energyand mental resilience in interacting with a focal engagement object; and (d) interaction: the two-waycommunications between a focal engagement subject and object.
X
Wagner and Majchrzak (2006) Intensity of customer participation with both representatives of the organization and with othercustomers in a collaborative knowledge exchange process
X
Unit (2007) Report that 79% of consumers defined engagement as recommending, and 64% of consumers definedit as frequent purchase
X X
Nambisan and Nambisan (2008) Customer experience in virtual CE is made up of four components: pragmatic experience, sociabilityexperience, usability experience and hedonic experience.
X X
Bowden (2009) A psychological process that models the underlying mechanisms by which customer loyalty forms fornew customers of a service brand as well as the mechanisms by which loyalty may be maintained forrepeat purchase customers of a service brand
X
Calder et al. (2009) Identified two different kinds of engagement. One kind, personal engagement, is when users seekstimulation and inspiration from the site, they want to use the site to facilitate their interactionswith other people, they feel the site affirms their self-worth, they get a sense of intrinsic enjoymentin using the site itself... The second kind, social-interactive engagement, is weighted more towardsexperiences that are more unique to the web, such as participating in discussions and socializing withothers through a site.
X X
Higgins and Scholer (2009) A state of being involved, occupied, fully absorbed or engrossed in something (i.e., sustained atten-tion), generating the consequences of a particular attraction or repulsion force.
X
Kumar et al. (2010) Identify 4 components: 1) customer purchasing behavior, whether it be repeat purchases or addi-tional purchases through up-selling and cross-selling; 2) customer referral behavior as it relates to theacquisition of new customers through a firm initiated and incentivized formal referral programs (ex-trinsically motivated; 3) customer influencer behavior through customers’ influence on other acquiredcustomers as well as on prospects (e.g., word-of-mouth activity that persuades and converts prospectsto customers, minimizes buyer remorse to reduce defections, encourages increased share-of-wallet ofexisting customers; usually intrinsically motivated; 4) customer knowledge behavior via feedbackprovided to the firm for ideas for innovations and improvements, and contributing to knowledgedevelopment (extrinsically or intrinsically motivated.
X X
Van Doorn et al. (2010) Customers’ behavioral manifestation toward a brand or firm, beyond purchase, resulting from motiva-tional drivers such as word-of- mouth activity, recommendations, helping other customers, blogging,writing reviews.
X
Brodie et al. (2011) CE is a psychological state that occurs by virtue of interactive, co-creative customer experiences witha focal agent/object
X
Vivek et al. (2012) CE is the intensity of an individual’s participation in and connection with an organization’s offeringsor organizational activities, which either the customer or the organization initiates.
X
Table A-2: Definitions of Binge-Watching
Paper Definition
Schweidel and Moe (2016); Rajaram et al. (2018) Consumption of multiple episodes of a television series in a short period of timeMarketCast (2013); Devasagayam (2014); Pena (2015); Shim andKim (2018); Godinho de Matos and Ferreira (2018)
Respondents’ perception of what is considered binge-watching without defining a specificamount
Netflix (2013); Sung et al. (2015); Ahmed (2017); Walton-Pattisonet al. (2018)
Watching of at least two episodes in one sitting
Devasagayam (2014); Pena (2015) Watching with the purpose of finishing a whole season in a short period of timeTiVo (2015) Watching 3 or more episodes in one dayTrouleau et al. (2016) Hyperbinge (3 episodeor more) vs binge (2 episode) in one sittingWheeler (2015); Lu et al. (2017) Many episodes in a single dayZhang et al. (2013, 2015); Pittman and Sheehan (2015); Flayelleet al. (2017); Shim and Kim (2018)
Multiple episodes in one sitting
51
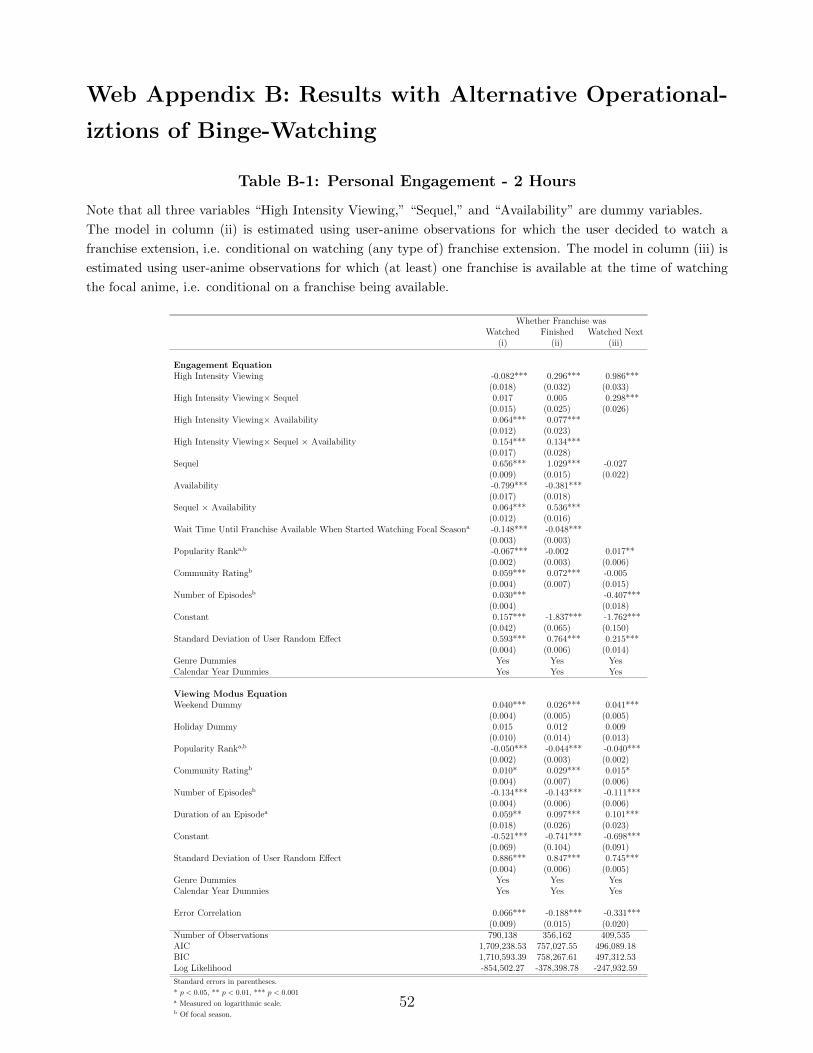
Web Appendix B: Results with Alternative Operational-
iztions of Binge-Watching
Table B-1: Personal Engagement - 2 Hours
Note that all three variables “High Intensity Viewing,” “Sequel,” and “Availability” are dummy variables.
The model in column (ii) is estimated using user-anime observations for which the user decided to watch a
franchise extension, i.e. conditional on watching (any type of) franchise extension. The model in column (iii) is
estimated using user-anime observations for which (at least) one franchise is available at the time of watching
the focal anime, i.e. conditional on a franchise being available.
Whether Franchise wasWatched Finished Watched Next
(i) (ii) (iii)
Engagement EquationHigh Intensity Viewing -0.082*** 0.296*** 0.986***
(0.018) (0.032) (0.033)High Intensity Viewing× Sequel 0.017 0.005 0.298***
(0.015) (0.025) (0.026)High Intensity Viewing× Availability 0.064*** 0.077***
(0.012) (0.023)High Intensity Viewing× Sequel × Availability 0.154*** 0.134***
(0.017) (0.028)Sequel 0.656*** 1.029*** -0.027
(0.009) (0.015) (0.022)Availability -0.799*** -0.381***
(0.017) (0.018)Sequel × Availability 0.064*** 0.536***
(0.012) (0.016)Wait Time Until Franchise Available When Started Watching Focal Seasona -0.148*** -0.048***
(0.003) (0.003)Popularity Ranka,b -0.067*** -0.002 0.017**
(0.002) (0.003) (0.006)Community Ratingb 0.059*** 0.072*** -0.005
(0.004) (0.007) (0.015)Number of Episodesb 0.030*** -0.407***
(0.004) (0.018)Constant 0.157*** -1.837*** -1.762***
(0.042) (0.065) (0.150)Standard Deviation of User Random Effect 0.593*** 0.764*** 0.215***
(0.004) (0.006) (0.014)Genre Dummies Yes Yes YesCalendar Year Dummies Yes Yes Yes
Viewing Modus EquationWeekend Dummy 0.040*** 0.026*** 0.041***
(0.004) (0.005) (0.005)Holiday Dummy 0.015 0.012 0.009
(0.010) (0.014) (0.013)Popularity Ranka,b -0.050*** -0.044*** -0.040***
(0.002) (0.003) (0.002)Community Ratingb 0.010* 0.029*** 0.015*
(0.004) (0.007) (0.006)Number of Episodesb -0.134*** -0.143*** -0.111***
(0.004) (0.006) (0.006)Duration of an Episodea 0.059** 0.097*** 0.101***
(0.018) (0.026) (0.023)Constant -0.521*** -0.741*** -0.698***
(0.069) (0.104) (0.091)Standard Deviation of User Random Effect 0.886*** 0.847*** 0.745***
(0.004) (0.006) (0.005)Genre Dummies Yes Yes YesCalendar Year Dummies Yes Yes Yes
Error Correlation 0.066*** -0.188*** -0.331***(0.009) (0.015) (0.020)
Number of Observations 790,138 356,162 409,535AIC 1,709,238.53 757,027.55 496,089.18BIC 1,710,593.39 758,267.61 497,312.53Log Likelihood -854,502.27 -378,398.78 -247,932.59
Standard errors in parentheses.
* p < 0.05, ** p < 0.01, *** p < 0.001a Measured on logarithmic scale.b Of focal season.
52

Table B-2: Interactive Engagement - 2 Hours
Note that the variable “High Intensity Viewing” is a dummy variable.
The models in column (ii), (iii), and (iv) are estimated using user-anime observations for which the user made (at
least) one forum post, i.e. conditional on a forum post. The model in column (vi) is estimated using user-anime
observations which the user rated, i.e. conditional on a rating. The model in column (viii) is estimated using
user-anime observations for which the user wrote a recommendation, i.e. conditional on a recommendation.
Forum Posts Ratings RecommendationsIncidence Number Length Valence Incidence Valence Incidence Number
(i) (ii) (iii) (iv) (v) (vi) (vii) (viii)
Engagement EquationHigh Intensity Viewing -0.544*** -0.048 -0.090 0.124 -0.534*** 0.188*** -0.189* 0.001
(0.063) (0.028) (0.066) (0.093) (0.037) (0.016) (0.095) (0.021)Ever-Made-a-Forum-Post Indicator 0.130*** 0.004 0.080** -0.066
(0.030) (0.010) (0.029) (0.041)Time Since Last Forum Posta -0.030*** -0.002 -0.005 -0.012
(0.008) (0.003) (0.008) (0.011)Number of Forum Postsa,c 0.021** -0.005 -0.003 -0.033**
(0.007) (0.004) (0.009) (0.012)Number of Ratingsa,c -0.012* 0.001
(0.005) (0.002)Number of Recommendationsa,c 0.281*** 0.014
(0.022) (0.008)Popularity Ranka,b 0.086*** 0.003 0.025** 0.014 -0.058*** 0.060*** 0.045** 0.005
(0.008) (0.004) (0.009) (0.013) (0.005) (0.002) (0.017) (0.005)Community Ratingb 0.055** 0.042*** 0.040 -0.013 0.130*** 1.034*** 0.101** -0.003
(0.019) (0.009) (0.022) (0.029) (0.010) (0.003) (0.033) (0.011)Number of Episodesb 0.338*** -0.012 0.270*** 0.100***
(0.018) (0.008) (0.020) (0.026)Constant -5.778*** -0.090 -0.202 3.302*** 3.542*** -0.315*** -5.829*** 0.680***
(0.193) (0.083) (0.203) (0.267) (0.105) (0.034) (0.336) (0.101)Standard Deviation of User Random Effect 1.349*** 0.067*** 0.331*** 0.508*** 2.713*** 0.751*** 1.082*** 0.044***
(0.024) (0.008) (0.011) (0.020) (0.033) (0.003) (0.032) (0.004)Genre Dummies Yes Yes Yes Yes Yes Yes Yes YesCalendar Year Dummies Yes Yes Yes Yes Yes Yes Yes Yes
Viewing Modus EquationWeekend Dummy 0.049*** 0.026 0.024 0.023 0.049*** 0.048*** 0.049*** 0.103
(0.004) (0.055) (0.055) (0.055) (0.004) (0.004) (0.004) (0.104)Holiday Dummy 0.013 0.319* 0.310* 0.315* 0.015 0.013 0.015 -0.098
(0.010) (0.126) (0.127) (0.127) (0.010) (0.010) (0.010) (0.259)Popularity Rankb -0.037*** -0.095*** -0.097*** -0.095*** -0.036*** -0.037*** -0.037*** -0.029
(0.002) (0.024) (0.024) (0.024) (0.002) (0.002) (0.002) (0.048)Community Ratingb 0.034*** 0.001 -0.005 -0.001 0.034*** 0.036*** 0.034*** 0.150
(0.004) (0.060) (0.060) (0.060) (0.004) (0.004) (0.004) (0.127)Number of Episodesb -0.112*** -0.179** -0.188*** -0.179** -0.112*** -0.111*** -0.111*** -0.137
(0.004) (0.057) (0.057) (0.057) (0.004) (0.005) (0.004) (0.127)Duration of an Episodea 0.183*** 0.252 0.227 0.253 0.191*** 0.186*** 0.185*** 0.347
(0.016) (0.266) (0.264) (0.265) (0.016) (0.016) (0.016) (0.656)Constant -1.083*** -0.836 -0.676 -0.834 -1.098*** -1.116*** -1.091*** -2.400
(0.064) (1.010) (1.009) (1.009) (0.064) (0.067) (0.064) (2.399)Standard Deviation of User Random Effect 0.728*** 0.977*** 0.984*** 0.979*** 0.737*** 0.725*** 0.723*** 0.878***
(0.004) (0.065) (0.066) (0.066) (0.004) (0.004) (0.004) (0.121)Number of Observations 682,787 4,703 4,703 4,703 682,787 632,455 682,787 1,243AIC 789,276.56 5,537.25 13,969.04 16,651.51 887,745.53 2,722,318.63 764,257.37 342.47BIC 790,580.03 6,260.31 14,692.11 17,374.58 889,037.57 2,723,613.37 765,503.67 880.63Log Likelihood -394,524.28 -2,656.62 -6,872.52 -8,213.76 -443,759.77 -1,361,045.31 -382,019.68 -66.24
Standard errors in parentheses.
* p < 0.05, ** p < 0.01, *** p < 0.001a Measured on logarithmic scale.b Of focal season.c At the time of watching focal anime season.
53

Table B-3: Personal Engagement - 4 Hours
Note that all three variables “High Intensity Viewing,” “Sequel,” and “Availability” are dummy variables.
The model in column (ii) is estimated using user-anime observations for which the user decided to watch a
franchise extension, i.e. conditional on watching (any type of) franchise extension. The model in column (iii) is
estimated using user-anime observations for which (at least) one franchise is available at the time of watching
the focal anime, i.e. conditional on a franchise being available.
Whether Franchise wasWatched Finished Watched Next
(i) (ii) (iii)
Engagement EquationHigh Intensity Viewing -0.146*** 0.291*** 1.008***
(0.025) (0.046) (0.040)High Intensity Viewing× Sequel -0.007 -0.044 0.456***
(0.020) (0.035) (0.027)High Intensity Viewing× Availability 0.046** 0.057
(0.017) (0.032)High Intensity Viewing× Sequel × Availability 0.113*** 0.108**
(0.023) (0.039)Sequel 0.676*** 1.056*** -0.054**
(0.008) (0.013) (0.019)Availability -0.793*** -0.365***
(0.016) (0.018)Sequel × Availability 0.504*** 0.558***
(0.009) (0.014)Wait Time Until Franchise Available When Started Watching Focal Seasona -0.150*** -0.049***
(0.003) (0.003)Popularity Ranka,b -0.070*** -0.011*** 0.008
(0.002) (0.003) (0.007)Community Ratingb 0.057*** 0.072*** -0.023
(0.004) (0.007) (0.016)Number of Episodesb 0.049*** -0.401***
(0.004) (0.021)Constant 0.137** -1.750*** -1.481***
(0.042) (0.065) (0.160)Standard Deviation of User Random Effect 0.592*** 0.767*** 0.217***
(0.004) (0.006) (0.015)Genre Dummies Yes Yes YesCalendar Year Dummies Yes Yes Yes
Viewing Modus EquationWeekend Dummy 0.081*** 0.083*** 0.074***
(0.005) (0.007) (0.006)Holiday Dummy 0.020 0.013 0.017
(0.012) (0.018) (0.016)Popularity Ranka,b -0.040*** -0.036*** -0.029***
(0.002) (0.003) (0.003)Community Ratingb -0.001 0.029*** -0.004
(0.005) (0.008) (0.007)Number of Episodesb -0.056*** -0.060*** -0.031***
(0.005) (0.008) (0.007)Duration of an Episodea 0.070** 0.084* 0.133***
(0.024) (0.036) (0.032)Constant -1.512*** -1.770*** -1.636***
(0.092) (0.139) (0.120)Standard Deviation of User Random Effect 0.925*** 0.868*** 0.723***
(0.006) (0.008) (0.007)Genre Dummies Yes Yes YesCalendar Year Dummies Yes Yes Yes
Error Correlation 0.081*** -0.171*** -0.179***(0.012) (0.021) (0.022)
Number of Observations 780,073 351,602 403,712AIC 1,390,319.93 606,052.55 328,305.42BIC 1,391,673.29 607,291.13 329,527.16Log Likelihood -695,042.97 -302,911.28 -164,040.71
Standard errors in parentheses.
* p < 0.05, ** p < 0.01, *** p < 0.001a Measured on logarithmic scale.b Of focal season.
54

Table B-4: Interactive Engagement - 4 Hours
Note that the variable “High Intensity Viewing” is a dummy variable.
The models in column (ii), (iii), and (iv) are estimated using user-anime observations for which the user made (at
least) one forum post, i.e. conditional on a forum post. The model in column (vi) is estimated using user-anime
observations which the user rated, i.e. conditional on a rating. The model in column (viii) is estimated using
user-anime observations for which the user wrote a recommendation, i.e. conditional on a recommendation.
Forum Posts Ratings RecommendationsIncidence Number Length Valence Incidence Valence Incidence Number
(i) (ii) (iii) (iv) (v) (vi) (vii) (viii)
Engagement EquationHigh Intensity Viewing -0.411*** -0.074 0.850*** 0.249* -0.354*** -1.008*** -0.287 -0.004
(0.108) (0.052) (0.043) (0.115) (0.047) (0.013) (0.148) (0.028)Ever-Made-a-Forum-Post Indicator 0.140*** 0.004 0.068* -0.071
(0.033) (0.010) (0.028) (0.041)Time Since Last Forum Posta -0.027*** -0.002 -0.006 -0.016
(0.008) (0.004) (0.008) (0.011)Number of Forum Postsa,c 0.024*** -0.005 0.000 -0.029*
(0.007) (0.004) (0.009) (0.012)Number of Ratingsa,c -0.012* -0.002
(0.005) (0.002)Number of Recommendationsa,c 0.280*** 0.014
(0.022) (0.009)Popularity Ranka,b 0.088*** 0.005 0.034*** 0.012 -0.052*** 0.060*** 0.046** 0.005
(0.009) (0.004) (0.010) (0.012) (0.005) (0.002) (0.017) (0.005)Community Ratingb 0.043* 0.047*** 0.029 -0.022 0.130*** 1.040*** 0.103** -0.003
(0.020) (0.009) (0.024) (0.029) (0.011) (0.004) (0.034) (0.011)Number of Episodesb 0.365*** -0.016 0.285*** 0.109***
(0.018) (0.009) (0.022) (0.027)Constant -5.900*** -0.123 -0.302 3.369*** 3.981*** -0.118*** -5.901*** 0.684***
(0.195) (0.083) (0.220) (0.266) (0.114) (0.035) (0.337) (0.101)Standard Deviation of User Random Effect 1.314*** 0.066*** 0.305*** 0.505*** 3.155*** 0.745*** 1.094*** 0.044***
(0.028) (0.009) (0.012) (0.021) (0.047) (0.003) (0.032) (0.004)Genre Dummies Yes Yes Yes Yes Yes Yes Yes YesCalendar Year Dummies Yes Yes Yes Yes Yes Yes Yes Yes
Viewing Modus EquationWeekend Dummy 0.076*** 0.116 0.074 0.114 0.076*** 0.066*** 0.076*** 0.341**
(0.005) (0.067) (0.048) (0.067) (0.005) (0.004) (0.005) (0.132)Holiday Dummy 0.021 0.264 0.150 0.262 0.022 0.016 0.022 0.025
(0.012) (0.152) (0.108) (0.153) (0.012) (0.012) (0.012) (0.338)Popularity Rankb -0.024*** -0.028 -0.028 -0.023 -0.024*** -0.019*** -0.025*** -0.055
(0.002) (0.031) (0.024) (0.031) (0.002) (0.002) (0.002) (0.063)Community Ratingb 0.012* 0.051 0.029 0.051 0.011* 0.049*** 0.012* 0.147
(0.005) (0.075) (0.059) (0.075) (0.005) (0.005) (0.005) (0.167)Number of Episodesb -0.032*** -0.106 -0.197*** -0.105 -0.033*** -0.071*** -0.033*** 0.095
(0.006) (0.072) (0.057) (0.072) (0.006) (0.005) (0.006) (0.161)Duration of an Episodea 0.172*** 0.336 0.319 0.346 0.175*** 0.129*** 0.173*** -0.210
(0.023) (0.367) (0.268) (0.367) (0.023) (0.022) (0.023) (0.802)Constant -1.830*** -2.830* -1.914 -2.901* -1.836*** -1.909*** -1.834*** -2.580
(0.087) (1.357) (1.017) (1.359) (0.087) (0.086) (0.087) (3.006)Standard Deviation of User Random Effect 0.710*** 0.852*** 0.401*** 0.868*** 0.712*** 0.662*** 0.702*** 0.873***
(0.005) (0.078) (0.045) (0.079) (0.005) (0.005) (0.005) (0.168)Genre Dummies Yes Yes Yes Yes Yes Yes Yes YesCalendar Year Dummies Yes Yes Yes Yes Yes Yes Yes Yes
Error Correlation 0.204** 0.132 -1.138*** -0.153 0.137*** 0.589*** 0.145 0.076(0.067) (0.135) (0.058) (0.091) (0.026) (0.008) (0.091) (0.122)
Number of Observations 671,223 4,646 4,646 4,646 671,223 621,871 671,223 1,237AIC 521,418.48 3,536.74 11,814.93 14,502.38 617,857.76 2,432,588.69 497,165.19 -290.50BIC 522,708.59 4,239.11 12,517.30 15,204.75 619,147.86 2,433,881.50 498,409.62 247.15Log Likelihood -260,596.24 -1,659.37 -5,798.47 -7,142.19 -308,815.88 -1,216,180.34 -248,473.59 250.25
Standard errors in parentheses.
* p < 0.05, ** p < 0.01, *** p < 0.001a Measured on logarithmic scale.b Of focal season.c At the time of watching focal anime season.
55

Web Appendix C: Complete Heterogeneity Results
Table C-1: Personal Engagement - Geography
Note that all three variables “HiVic,” “Sequel,” and “Availability” are dummy variables.
Whether Franchise was Whether Franchise wasWatched Finished Watched Next Watched Finished Watched Next
(i) (ii) (iii) (iv) (v) (vi)
Engagement Equation Viewing Modus Equation
HiVic -0.091*** 0.293*** 0.859*** Weekend Dummy 0.045*** 0.043*** 0.046***(0.025) (0.045) (0.043) (0.004) (0.006) (0.005)
HiVic × Sequel 0.090*** -0.077 0.382*** Holiday Dummy 0.022* 0.004 0.013(0.025) (0.042) (0.034) (0.010) (0.016) (0.014)
HiVic × Availability 0.031 0.100* Popularity Ranka,b -0.050*** -0.045*** -0.037***(0.020) (0.039) (0.002) (0.003) (0.003)
HiVic × Sequel × Availability 0.110*** 0.079 Community Ratingb 0.045*** 0.074*** 0.047***(0.028) (0.046) (0.005) (0.007) (0.006)
Europe × HiVic 0.005 0.008 0.201*** Number of Episodesb 0.043*** 0.049*** 0.057***(0.025) (0.047) (0.040) (0.005) (0.007) (0.006)
Europe × HiVic × Sequel -0.093** 0.021 0.045 Duration of an Episodea 0.133*** 0.186*** 0.185***(0.032) (0.055) (0.038) (0.019) (0.028) (0.025)
Europe × HiVic × Availability 0.017 -0.029 Europe -0.659*** -0.634*** -0.602***(0.026) (0.050) (0.012) (0.015) (0.013)
Europe × HiVic × Sequel × Availability 0.050 0.012 Oceania -0.651*** -0.673*** -0.594***(0.037) (0.061) (0.030) (0.034) (0.031)
Oceania × HiVic 0.177* -0.063 0.139 Asia -0.483*** -0.437*** -0.416***(0.072) (0.129) (0.101) (0.020) (0.027) (0.023)
Oceania × HiVic × Sequel -0.139 0.151 0.229* South America -0.798*** -0.743*** -0.726***(0.095) (0.154) (0.103) (0.021) (0.025) (0.022)
Oceania × HiVic × Availability -0.261*** 0.040 Constant -1.509*** -1.896*** -1.683***(0.076) (0.138) (0.076) (0.115) (0.098)
Oceania × HiVic × Sequel × Availability 0.243* -0.136 Standard Deviation of 0.899*** 0.861*** 0.727***(0.108) (0.170) User Random Effect (0.005) (0.007) (0.006)
Asia × HiVic 0.012 -0.164 0.112 Genre Dummies Yes Yes Yes(0.046) (0.088) (0.069) Calendar Year Dummies Yes Yes Yes
Asia × HiVic × Sequel -0.061 0.286** 0.159*(0.059) (0.102) (0.069)
Asia × HiVic × Availability -0.047 0.078 Error Correlation 0.064*** -0.156*** -0.247***(0.049) (0.093) (0.011) (0.017) (0.022)
Asia × HiVic × Sequel × Availability 0.058 -0.089(0.069) (0.113)
South America × HiVic -0.024 -0.005 0.212** Number of Observations 764,666 345,108 396,928(0.051) (0.093) (0.069) AIC 1,520,053.89 669,119.07 405,943.97
South America × HiVic × Sequel -0.090 -0.002 -0.091 BIC 1,521,682.05 670,613.54 407,338.09(0.067) (0.110) (0.075) Log Likelihood -759,885.95 -334,420.53 -202,843.99
South America × HiVic × Availability 0.039 -0.036(0.054) (0.099)
South America × HiVic × Sequel × Availability 0.046 0.035(0.077) (0.122)
Sequel 0.648*** 1.042*** -0.062**(0.009) (0.014) (0.020)
Availability -0.782*** -0.386***(0.016) (0.018)
Sequel × Availability 0.501*** 0.554***(0.010) (0.015)
Wait Time Until Franchise Available -0.147*** -0.048***When Started Watching Focal Seasona (0.003) (0.003)Popularity Ranka,b -0.065*** -0.010*** 0.015*
(0.002) (0.003) (0.007)Community Ratingb 0.061*** 0.069*** -0.014
(0.004) (0.007) (0.016)Number of Episodesb 0.027*** -0.526***
(0.004) (0.019)Europe 0.126*** 0.174*** 0.113***
(0.010) (0.014) (0.025)Oceania 0.054* 0.057 0.073
(0.023) (0.032) (0.056)Asia 0.084*** 0.244*** 0.110**
(0.017) (0.026) (0.041)South America 0.196*** 0.263*** 0.151***
(0.016) (0.023) (0.038)Constant 0.041 -1.896*** -1.369***
(0.043) (0.066) (0.158)Standard Deviation of 0.589*** 0.751*** 0.214***User Random Effect (0.004) (0.006) (0.014)Genre Dummies Yes Yes YesCalendar Year Dummies Yes Yes Yes
Standard errors in parentheses.
* p < 0.05, ** p < 0.01, *** p < 0.001a Measured on logarithmic scale.b Of focal season.c High Intensity Viewing.
56

Table C-2: Interactive Engagement - Geography
Note that the variable “HiVid” is a dummy variable.
Forum Posts Ratings RecommendationsIncidence Valence Number Length Incidence Valence Incidence Number
(i) (ii) (iii) (iv) (v) (vi) (vii) (viii)
Engagement EquationHiVid -0.528*** -0.081* -0.144 0.189 -0.170*** 0.236*** -0.110 0.002
(0.079) (0.033) (0.082) (0.106) (0.045) (0.014) (0.065) (0.016)Europe × HiVid 0.025 -0.028 0.120* 0.122 -0.110 -0.008 -0.097 -0.019
(0.046) (0.022) (0.054) (0.072) (0.058) (0.018) (0.110) (0.026)Oceania × HiVid 0.049 0.007 0.283* -0.014 -0.218 -0.023 -0.189 -0.018
(0.103) (0.046) (0.113) (0.150) (0.165) (0.053) (0.288) (0.069)Asia × HiVid 0.189* -0.022 0.046 -0.039 -0.094 -0.067* 0.046 0.018
(0.078) (0.035) (0.087) (0.115) (0.132) (0.033) (0.151) (0.038)South America × HiVid 0.061 -0.076 0.149 -0.058 -0.344*** -0.039 -0.270 -0.029
(0.127) (0.061) (0.156) (0.211) (0.097) (0.035) (0.285) (0.074)Ever-Made-a-Forum-Post Indicator 0.150*** 0.006 0.071* -0.070
(0.031) (0.011) (0.030) (0.042)Time Since Last Forum Posta -0.029*** -0.003 -0.008 -0.011
(0.008) (0.004) (0.008) (0.011)Number of Forum Postsa,c 0.022** -0.005 0.000 -0.031**
(0.007) (0.004) (0.009) (0.012)Number of Ratingsa,c 0.000 0.001
(0.007) (0.002)Number of Recommendationsa,c 0.281*** 0.015
(0.037) (0.010)Popularity Ranka,b 0.086*** 0.004 0.024* 0.013 -0.060*** 0.058*** 0.043 0.005
(0.009) (0.004) (0.010) (0.013) (0.011) (0.004) (0.027) (0.007)Community Ratingb 0.064** 0.044*** 0.039 -0.022 0.124*** 1.033*** 0.105 -0.002
(0.020) (0.009) (0.022) (0.030) (0.026) (0.008) (0.055) (0.013)Number of Episodesb 0.359*** -0.011 0.273*** 0.094***
(0.018) (0.008) (0.020) (0.027)Europe -0.579*** -0.006 -0.119*** -0.101* -0.067* -0.052*** -0.352*** -0.005
(0.039) (0.011) (0.033) (0.046) (0.032) (0.010) (0.053) (0.012)Oceania -0.083 -0.005 -0.126* -0.086 0.148 -0.023 -0.088 -0.028
(0.085) (0.022) (0.064) (0.090) (0.081) (0.026) (0.118) (0.028)Asia -0.315*** 0.010 -0.011 -0.102 0.049 0.270*** 0.011 -0.007
(0.070) (0.020) (0.057) (0.079) (0.063) (0.018) (0.081) (0.021)South America -0.756*** -0.007 -0.077 -0.287** -0.384*** 0.211*** -0.422*** -0.030
(0.081) (0.023) (0.066) (0.093) (0.052) (0.017) (0.101) (0.026)Constant -5.609*** -0.097 -0.137 3.421*** 3.573*** -0.340*** -5.563*** 0.677***
(0.197) (0.085) (0.206) (0.273) (0.253) (0.081) (0.523) (0.119)Standard Deviation of User Random Effect 1.289*** 0.067*** 0.327*** 0.505*** 2.726*** 0.756*** 1.021*** 0.043***
(0.027) (0.009) (0.011) (0.021) (0.027) (0.003) (0.010) (0.004)Genre Dummies Yes Yes Yes Yes Yes Yes Yes YesCalendar Year Dummies Yes Yes Yes Yes Yes Yes Yes Yes
Viewing Modus EquationWeekend Dummy 0.053*** 0.046 0.040 0.042 0.053*** 0.052*** 0.053*** 0.046
(0.004) (0.057) (0.057) (0.057) (0.010) (0.009) (0.010) (0.145)Holiday Dummy 0.016 0.275* 0.267* 0.267* 0.016 0.014 0.017 -0.277
(0.011) (0.131) (0.133) (0.133) (0.027) (0.024) (0.026) (0.363)Popularity Rankb -0.030*** -0.086*** -0.087*** -0.085** -0.030*** -0.030*** -0.030*** 0.017
(0.002) (0.026) (0.026) (0.026) (0.005) (0.004) (0.005) (0.066)Community Ratingb 0.053*** 0.039 0.032 0.035 0.053*** 0.055*** 0.053*** 0.357*
(0.005) (0.063) (0.064) (0.064) (0.012) (0.010) (0.011) (0.178)Number of Episodesb 0.056*** -0.029 -0.038 -0.032 0.055*** 0.060*** 0.055*** -0.059
(0.005) (0.058) (0.058) (0.058) (0.011) (0.010) (0.011) (0.168)Duration of an Episodea 0.381*** 0.492 0.475 0.489 0.386*** 0.385*** 0.383*** 0.443
(0.017) (0.283) (0.282) (0.282) (0.042) (0.038) (0.040) (0.958)Europe -0.612*** -0.494*** -0.493*** -0.497*** -0.611*** -0.612*** -0.616*** -0.600***
(0.011) (0.092) (0.092) (0.092) (0.011) (0.010) (0.011) (0.155)Oceania -0.596*** -0.569** -0.566** -0.566** -0.597*** -0.580*** -0.601*** -0.690
(0.027) (0.191) (0.193) (0.193) (0.026) (0.025) (0.025) (0.363)Asia -0.421*** -0.073 -0.065 -0.067 -0.419*** -0.433*** -0.442*** -0.070
(0.020) (0.149) (0.150) (0.150) (0.020) (0.018) (0.018) (0.228)South America -0.769*** -0.809*** -0.796*** -0.800*** -0.745*** -0.759*** -0.735*** -1.049**
(0.018) (0.208) (0.210) (0.210) (0.019) (0.017) (0.018) (0.379)Constant -2.324*** -2.292* -2.158* -2.254* -2.337*** -2.387*** -2.331*** -4.973
(0.070) (1.076) (1.080) (1.076) (0.172) (0.156) (0.164) (3.442)Standard Deviation of User Random Effect 0.704*** 0.926*** 0.938*** 0.939*** 0.705*** 0.692*** 0.700*** 0.815***
(0.004) (0.069) (0.070) (0.070) (0.005) (0.004) (0.004) (0.128)Genre Dummies Yes Yes Yes Yes Yes Yes Yes YesCalendar Year Dummies Yes Yes Yes Yes Yes Yes Yes Yes
Error Correlation 0.311*** -1.395*** -0.579*** -0.312*** 0.152*** 0.135*** 0.109*** -1.978***(0.053) (0.014) (0.012) (0.014) (0.007) (0.001) (0.021) (0.021)
Number of Observations 663,963 4,564 4,564 4,564 663,963 615,325 663,963 1,215AIC 645,482.33 4,917.61 12,963.63 15,584.36 742,547.78 2,534,801.25 621,749.81 189.00BIC 646,919.49 5,708.00 13,754.03 16,374.75 743,973.52 2,536,228.81 623,129.94 785.99Log Likelihood -322,615.17 -2,335.81 -6,358.82 -7,669.18 -371,148.89 -1,267,274.62 -310,753.91 22.50
Standard errors in parentheses.
* p < 0.05, ** p < 0.01, *** p < 0.001a Measured on logarithmic scale.b Of focal season.c At the time of watching focal anime season.d High Intensity Viewing.
57

Table C-3: Personal Engagement - Age
Note that all three variables “HiVic,” “Sequel,” and “Availability” are dummy variables.
Whether Franchise wasWatched Finished Watched Next
(i) (ii) (iii)
Engagement EquationHiVic -0.139*** 0.157*** 0.796***
(0.025) (0.045) (0.042)HiVic × Sequel 0.008 0.013 0.411***
(0.026) (0.043) (0.035)HiVic × Availability 0.016 0.109**
(0.021) (0.039)HiVic × Sequel × Availability 0.160*** 0.013
(0.030) (0.048)Age: 20 - 25 × HiVic -0.086* -0.079 0.104*
(0.037) (0.071) (0.053)Age: 20 - 25 × HiVic × Sequel 0.037 0.099 -0.079
(0.047) (0.082) (0.054)Age: 20 - 25 × HiVic × Availability 0.075* 0.030
(0.038) (0.075)Age: 20 - 25 × HiVic × Sequel × Availability -0.046 0.014
(0.053) (0.090)Age > 25 × HiVic -0.104** 0.014 0.054
(0.035) (0.067) (0.053)Age > 25 × HiVic × Sequel 0.064 0.071 -0.067
(0.046) (0.078) (0.055)Age > 25 × HiVic × Availability 0.108** -0.007
(0.037) (0.072)Age > 25 × HiVic × Sequel × Availability -0.076 -0.048
(0.052) (0.087)AgeMissing × HiVic 0.023 0.049 -0.064
(0.028) (0.051) (0.043)AgeMissing × HiVic × Sequel 0.022 -0.130* 0.048
(0.036) (0.060) (0.044)AgeMissing × HiVic × Availability -0.022 -0.030
(0.029) (0.054)AgeMissing × HiVic × Sequel × Availability 0.006 0.107
(0.041) (0.066)Sequel 0.648*** 1.046*** -0.061**
(0.009) (0.014) (0.020)Availability -0.784*** -0.385***
(0.016) (0.018)Sequel × Availability 0.501*** 0.554***
(0.010) (0.015)Wait Time Until Franchise Available When Started Watching Focal Seasona -0.147*** -0.048***
(0.003) (0.003)Popularity Ranka,b -0.066*** -0.011*** 0.016*
(0.002) (0.003) (0.007)Community Ratingb 0.061*** 0.071*** -0.011
(0.004) (0.007) (0.016)Number of Episodesb 0.028*** -0.513***
(0.004) (0.019)Age: 20 - 25 0.015 -0.019 -0.001
(0.009) (0.014) (0.031)Age > 25 -0.016 -0.017 0.046
(0.011) (0.017) (0.030)AgeMissing 0.005 0.000 0.003
(0.009) (0.013) (0.025)Constant 0.139** -1.762*** -1.364***
(0.043) (0.066) (0.159)Standard Deviation of User Random Effect 0.593*** 0.763*** 0.252***
(0.004) (0.006) (0.013)Genre Dummies Yes Yes YesCalendar Year Dummies Yes Yes Yes
Viewing Modus EquationWeekend Dummy 0.045*** 0.044*** 0.045***
(0.004) (0.006) (0.005)Holiday Dummy 0.027** 0.014 0.025
(0.010) (0.016) (0.014)Popularity Ranka,b -0.050*** -0.044*** -0.037***
(0.002) (0.003) (0.003)Community Ratingb 0.045*** 0.073*** 0.049***
(0.005) (0.007) (0.006)Number of Episodesb 0.042*** 0.045*** 0.053***
(0.005) (0.007) (0.006)Duration of an Episodea 0.132*** 0.180*** 0.181***
(0.019) (0.028) (0.025)Age: 20 - 25 0.019 0.017 0.013
(0.010) (0.014) (0.013)Age > 25 -0.040** -0.033 -0.040*
(0.013) (0.018) (0.016)AgeMissing 0.020 0.005 0.003
(0.011) (0.014) (0.013)Constant -1.942*** -2.287*** -2.073***
(0.076) (0.115) (0.099)Standard Deviation of User Random Effect 0.945*** 0.919*** 0.791***
(0.005) (0.007) (0.006)Genre Dummies Yes Yes YesCalendar Year Dummies Yes Yes Yes
Error Correlation 0.103*** -0.096*** -0.126***(0.010) (0.016) (0.020)
Number of Observations 764,666 345,108 396,928AIC 1,524,541.99 671,980.22 408,905.44BIC 1,526,100.86 673,410.18 410,255.99Log Likelihood -762,136.00 -335,857.11 -204,328.72
Standard errors in parentheses.
* p < 0.05, ** p < 0.01, *** p < 0.001a Measured on logarithmic scale.b Of focal season.c High Intensity Viewing.
58

Table C-4: Interactive Engagement - Age
Note that the variable “HiVid” is a dummy variable.
Forum Posts Ratings RecommendationsIncidence Valence Number Length Incidence Valence Incidence Number
(i) (ii) (iii) (iv) (v) (vi) (vii) (viii)
Engagement EquationHiVid 0.183* -0.052 -0.128 0.225* -0.252*** 0.132*** 0.108 -0.029
(0.087) (0.034) (0.083) (0.108) (0.048) (0.014) (0.086) (0.020)Age: 20 - 25 × HiVid 0.076 -0.031 -0.081 -0.071 -0.066 -0.015 0.081 0.025
(0.066) (0.030) (0.073) (0.097) (0.084) (0.025) (0.134) (0.034)Age > 25 × HiVid 0.076 0.054 0.063 0.080 -0.098 -0.015 -0.174 -0.005
(0.065) (0.029) (0.072) (0.097) (0.084) (0.025) (0.158) (0.039)AgeMissing × HiVid -0.120* -0.045* 0.080 -0.004 0.040 0.018 0.118 0.042
(0.051) (0.022) (0.056) (0.074) (0.070) (0.020) (0.112) (0.027)Ever-Made-a-Forum-Post Indicator 0.143*** 0.005 0.079** -0.070
(0.033) (0.011) (0.030) (0.042)Time Since Last Forum Posta -0.026** -0.003 -0.007 -0.011
(0.008) (0.003) (0.008) (0.011)Number of Forum Postsa,c 0.019** -0.004 0.000 -0.032**
(0.007) (0.004) (0.009) (0.012)Number of Ratingsa,c 0.004 0.004*
(0.007) (0.002)Number of Recommendationsa,c 0.282*** 0.015
(0.037) (0.010)Popularity Ranka,b 0.096*** 0.004 0.025* 0.013 -0.059*** 0.058*** 0.045 0.005
(0.009) (0.004) (0.010) (0.013) (0.012) (0.004) (0.027) (0.007)Community Ratingb 0.045* 0.043*** 0.040 -0.023 0.122*** 1.033*** 0.100 -0.004
(0.020) (0.009) (0.022) (0.030) (0.027) (0.008) (0.055) (0.013)Number of Episodesb 0.361*** -0.012 0.271*** 0.094***
(0.018) (0.008) (0.020) (0.027)Age: 20 - 25 -0.134** -0.001 -0.015 0.022 -0.068 -0.013 -0.110 0.010
(0.043) (0.016) (0.042) (0.058) (0.044) (0.013) (0.075) (0.018)Age > 25 -0.132** -0.009 -0.042 -0.018 -0.137** 0.012 -0.172* 0.001
(0.049) (0.015) (0.043) (0.061) (0.042) (0.013) (0.074) (0.018)AgeMissing 0.028 0.023 -0.076* -0.040 0.058 -0.010 0.082 -0.014
(0.037) (0.012) (0.033) (0.046) (0.034) (0.011) (0.056) (0.013)Constant -6.146*** -0.109 -0.143 3.401*** 3.548*** -0.310*** -5.853*** 0.699***
(0.194) (0.085) (0.206) (0.273) (0.265) (0.080) (0.523) (0.118)Standard Deviation of User Random Effect 1.424*** 0.068*** 0.327*** 0.510*** 2.770*** 0.763*** 1.045*** 0.044***
(0.027) (0.009) (0.011) (0.021) (0.030) (0.003) (0.010) (0.004)Genre Dummies Yes Yes Yes Yes Yes Yes Yes YesCalendar Year Dummies Yes Yes Yes Yes Yes Yes Yes Yes
Viewing Modus EquationWeekend Dummy 0.053*** 0.041 0.035 0.036 0.053*** 0.052*** 0.053*** 0.049
(0.004) (0.057) (0.058) (0.058) (0.011) (0.009) (0.010) (0.146)Holiday Dummy 0.025* 0.310* 0.300* 0.301* 0.025 0.021 0.024 -0.264
(0.011) (0.133) (0.134) (0.134) (0.028) (0.024) (0.026) (0.365)Popularity Rankb -0.030*** -0.090*** -0.090*** -0.089*** -0.031*** -0.031*** -0.031*** 0.017
(0.002) (0.026) (0.026) (0.026) (0.005) (0.004) (0.005) (0.066)Community Ratingb 0.054*** 0.026 0.020 0.023 0.054*** 0.058*** 0.055*** 0.360*
(0.005) (0.064) (0.064) (0.064) (0.012) (0.010) (0.011) (0.178)Number of Episodesb 0.051*** -0.047 -0.053 -0.048 0.051*** 0.052*** 0.052*** -0.077
(0.005) (0.058) (0.058) (0.058) (0.012) (0.010) (0.011) (0.169)Duration of an Episodea 0.379*** 0.489 0.468 0.485 0.382*** 0.380*** 0.379*** 0.492
(0.017) (0.287) (0.286) (0.286) (0.045) (0.037) (0.041) (0.983)Age: 20 - 25 -0.001 0.256* 0.252* 0.253* -0.005 0.001 0.001 0.055
(0.010) (0.116) (0.116) (0.116) (0.016) (0.014) (0.015) (0.204)Age > 25 -0.031* 0.247* 0.251* 0.251* -0.039** -0.034** -0.032* -0.314
(0.013) (0.121) (0.122) (0.122) (0.015) (0.013) (0.014) (0.228)AgeMissing 0.028** -0.191* -0.193* -0.194* 0.017 0.031** 0.026* 0.175
(0.011) (0.095) (0.095) (0.095) (0.013) (0.011) (0.012) (0.157)Constant -2.737*** -2.266* -2.134 -2.243* -2.734*** -2.786*** -2.739*** -5.449
(-0.070) (1.090) (1.092) (1.089) (0.184) (0.154) (0.168) (3.519)Standard Deviation of User Random Effect 0.768*** 0.972*** 0.980*** 0.984*** 0.776*** 0.747*** 0.763*** 0.836***
(0.005) (0.071) (0.072) (0.072) (0.005) (0.004) (0.005) (0.129)Genre Dummies Yes Yes Yes Yes Yes Yes Yes YesCalendar Year Dummies Yes Yes Yes Yes Yes Yes Yes Yes
Error Correlation -0.072 -1.400*** -0.578*** -0.311*** 0.151*** 0.134*** -0.085*** -1.980***(-0.049) (0.014) (0.012) (0.014) (0.007) (0.001) (0.020) (0.022)
Number of Observations 663,963 4,564 4,564 4,564 663,963 615,325 663,963 1,215AIC 649,479.72 4,939.00 13,000.68 15,630.06 745,703.37 2,539,484.43 625,408.78 201.25BIC 650,426.42 5,710.11 13,771.79 16,401.18 747,094.90 2,540,878.01 626,754.68 782.93Log Likelihood -324,656.86 -002,349.50 -6,380.34 -7,695.03 -372,729.69 -1,269,619.22 -312,586.39 13.38
Standard errors in parentheses.
* p < 0.05, ** p < 0.01, *** p < 0.001a Measured on logarithmic scale.b Of focal season.c At the time of watching focal anime season.d High Intensity Viewing.
59

Table C-5: Personal Engagement - Gender
Note that all three variables “HiVic,” “Sequel,” and “Availability” are dummy variables.
Whether Franchise wasWatched Finished Watched Next
(i) (ii) (iii)
Engagement EquationHiVic -0.133*** 0.197** 0.797***
(0.034) (0.061) (0.052)HiVic × Sequel 0.000 -0.011 0.408***
(0.039) (0.065) (0.048)HiVic × Availability 0.501*** 0.105
(0.010) (0.058)HiVic × Sequel × Availability 0.138** 0.033
(0.045) (0.072)Female × HiVic 0.036 -0.075 0.024
(0.025) (0.047) (0.038)Female × HiVic × Sequel -0.023 0.054 0.007
(0.032) (0.055) (0.039)Female × HiVic × Availability -0.043 0.030
(0.026) (0.050)Female × HiVic × Sequel × Availability 0.013 -0.014
(0.037) (0.061)GenderMissing × HiVic -0.030 0.021 -0.031
(0.034) (0.063) (0.050)GenderMissing × HiVic × Sequel 0.054 -0.067 0.007
(0.045) (0.075) (0.052)GenderMissing × HiVic × Availability 0.037 -0.030
(0.036) (0.067)GenderMissing × HiVic × Sequel × Availability 0.003 0.058
(0.051) (0.083)Sequel 0.648*** 1.045*** -0.061**
(0.009) (0.014) (0.020)Availability -0.783*** -0.385***
(0.016) (0.018)Sequel × Availability 0.018 0.555***
(0.032) (0.015)Wait Time Until Franchise Available When Started Watching Focal Seasona -0.147*** -0.048***
(0.003) (0.003)Popularity Ranka,b -0.065*** -0.011*** 0.016*
(0.002) (0.003) (0.007)Community Ratingb 0.061*** 0.071*** -0.011
(0.004) (0.007) (0.016)Number of Episodesb 0.028*** -0.513***
(0.004) (0.019)Female 0.012 0.032* -0.024
(0.009) (0.013) (0.022)GenderMissing 0.008 -0.012 0.021
(0.012) (0.017) (0.030)Constant 0.128** -1.771*** -1.365***
(0.043) (0.067) (0.160)Standard Deviation of User Random Effect 0.594*** 0.761*** 0.253***
(0.004) (0.006) (0.013)Genre Dummies Yes Yes YesCalendar Year Dummies Yes Yes Yes
Viewing Modus EquationWeekend Dummy 0.045*** 0.044*** 0.045***
(0.004) (0.006) (0.005)Holiday Dummy 0.028** 0.014 0.025
(0.010) (0.016) (0.014)Popularity Ranka,b -0.051*** -0.044*** -0.037***
(0.002) (0.003) (0.003)Community Ratingb 0.045*** 0.073*** 0.049***
(0.005) (0.007) (0.006)Number of Episodesb 0.041*** 0.045*** 0.053***
(0.005) (0.007) (0.006)Duration of an Episodea 0.132*** 0.180*** 0.181***
(0.019) (0.028) (0.025)Female 0.014 -0.008 -0.008
(0.011) (0.015) (0.013)GenderMissing 0.018 0.006 -0.009
(0.015) (0.019) (0.017)Constant -1.955*** -2.290*** -2.065***
(0.077) (0.116) (0.100)Standard Deviation of User Random Effect 0.938*** 0.924*** 0.791***
(0.005) (0.007) (0.006)Genre Dummies Yes Yes YesCalendar Year Dummies Yes Yes Yes
Error Correlation 0.097*** -0.098*** -0.126***(0.010) (0.016) (0.020)
Number of Observations 764,666 345,108 396,928AIC 1,524,682.82 671,778.76 408,890.18BIC 1,526,172.41 673,144.21 410,197.16Log Likelihood -762,212.41 -335,762.38 -204,325.09
Standard errors in parentheses.
* p < 0.05, ** p < 0.01, *** p < 0.001a Measured on logarithmic scale.b Of focal season.c High Intensity Viewing.
60

Table C-6: Interactive Engagement - Gender
Note that the variable “HiVid” is a dummy variable.
Forum Posts Ratings RecommendationsIncidence Valence Number Length Incidence Valence Incidence Number
(i) (ii) (iii) (iv) (v) (vi) (vii) (viii)
Engagement EquationHiVid 0.254** -0.047 -0.101 0.114 -0.243*** 0.094*** 0.083 -0.056
(0.095) (0.038) (0.096) (0.123) (0.070) (0.021) (0.136) (0.031)Female × HiVid -0.064 0.014 -0.035 0.013 0.009 -0.008 0.167 0.046
(0.046) (0.021) (0.051) (0.068) (0.063) (0.018) (0.104) (0.025)GenderMissing × HiVid -0.113 -0.045 0.059 0.121 0.014 -0.003 -0.074 0.038
(0.066) (0.029) (0.073) (0.098) (0.081) (0.024) (0.159) (0.036)Ever-Made-a-Forum-Post Indicator 0.111** 0.006 0.074* -0.066
(0.034) (0.011) (0.030) (0.041)Time Since Last Forum Posta -0.026** -0.003 -0.008 -0.011
(0.008) (0.004) (0.008) (0.011)Number of Forum Postsa,c 0.021** -0.004 -0.001 -0.032**
(0.007) (0.004) (0.009) (0.012)Number of Ratingsa,c 0.002 0.003
(0.007) (0.002)Number of Recommendationsa,c 0.283*** 0.016
(0.037) (0.010)Popularity Ranka,b 0.094*** 0.004 0.024* 0.012 -0.059*** 0.058*** 0.045 0.005
(0.009) (0.004) (0.010) (0.013) (0.012) (0.004) (0.027) (0.007)Community Ratingb 0.047* 0.043*** 0.039 -0.021 0.121*** 1.034*** 0.099 -0.002
(0.020) (0.009) (0.022) (0.030) (0.028) (0.009) (0.054) (0.013)Number of Episodesb 0.359*** -0.012 0.273*** 0.095***
(0.018) (0.008) (0.020) (0.027)Female 0.162*** 0.009 0.029 -0.116** 0.069* -0.029** 0.048 -0.003
(0.037) (0.011) (0.031) (0.043) (0.031) (0.010) (0.051) (0.012)GenderMissing 0.089 0.003 -0.039 0.027 0.106** -0.002 0.083 -0.017
(0.059) (0.016) (0.046) (0.064) (0.040) (0.013) (0.077) (0.017)Constant -6.282*** -0.101 -0.166 3.391*** 3.468*** -0.291*** -5.971*** 0.692***
(0.199) (0.086) (0.209) (0.278) (0.270) (0.083) (0.522) (0.118)Standard Deviation of User Random Effect 1.397*** 0.067*** 0.329*** 0.507*** 2.751*** 0.765*** 1.081*** 0.043***
(0.027) (0.009) (0.012) (0.021) (0.030) (0.003) (0.010) (0.004)Genre Dummies Yes Yes Yes Yes Yes Yes Yes YesCalendar Year Dummies Yes Yes Yes Yes Yes Yes Yes Yes
Viewing Modus EquationWeekend Dummy 0.053*** 0.041 0.035 0.037 0.053*** 0.052*** 0.053*** 0.047
(0.004) (0.057) (0.058) (0.058) (0.011) (0.009) (0.010) (0.148)Holiday Dummy 0.024* 0.301* 0.294* 0.295* 0.025 0.022 0.024 -0.266
(0.011) (0.132) (0.134) (0.134) (0.029) (0.024) (0.025) (0.369)Popularity Rankb -0.030*** -0.088*** -0.089*** -0.088*** -0.030*** -0.031*** -0.031*** 0.017
(0.002) (0.026) (0.026) (0.026) (0.005) (0.004) (0.005) (0.067)Community Ratingb 0.054*** 0.028 0.022 0.025 0.054*** 0.058*** 0.054*** 0.364*
(0.005) (0.064) (0.064) (0.064) (0.012) (0.010) (0.011) (0.181)Number of Episodesb 0.052*** -0.043 -0.049 -0.044 0.051*** 0.050*** 0.052*** -0.056
(0.005) (0.058) (0.058) (0.058) (0.012) (0.010) (0.011) (0.171)Duration of an Episodea 0.380*** 0.478 0.464 0.475 0.382*** 0.379*** 0.379*** 0.452
(0.017) (0.284) (0.284) (0.284) (0.045) (0.038) (0.039) (0.963)Female -0.015 -0.238** -0.237** -0.238** -0.009 -0.010 -0.013 0.215
(0.011) (0.089) (0.087) (0.087) (0.011) (0.010) (0.010) (0.148)GenderMissing 0.004 -0.072 -0.073 -0.075 0.001 0.015 0.006 -0.195
(0.015) (0.122) (0.123) (0.123) (0.015) (0.013) (0.014) (0.208)Constant -2.723*** -2.171* -2.071 -2.152* -2.724*** -2.774*** -2.726*** -5.252
(0.071) (1.087) (1.092) (1.088) (0.186) (0.156) (0.163) (3.475)Standard Deviation of User Random Effect 0.779*** 0.962*** 0.976*** 0.980*** 0.781*** 0.751*** 0.759*** 0.861***
(0.005) (0.070) (0.071) (0.072) (0.005) (0.005) (0.005) (0.131)Genre Dummies Yes Yes Yes Yes Yes Yes Yes YesCalendar Year Dummies Yes Yes Yes Yes Yes Yes Yes Yes
Error Correlation -0.069 -1.398*** -0.577*** -0.311*** 0.135*** 0.134*** -0.036 -1.981***(0.047) (0.014) (0.012) (0.014) (0.007) (0.001) (0.020) (0.021)
Number of Observations 663,963 4,564 4,564 4,564 663,963 615,325 663,963 1,215AIC 649,175.53 4,939.02 13,036.41 5,653.70 745,537.02 2,538,913.89 626,080.96 193.76BIC 650,544.25 5,690.86 13,788.25 16,405.53 746,894.33 2,540,273.48 627,392.65 760.14Log Likelihood -324,467.77 -2,352.51 -6,401.21 -7,709.85 -372,649.51 -1,269,336.94 -312,925.48 14.12
Standard errors in parentheses.
* p < 0.05, ** p < 0.01, *** p < 0.001a Measured on logarithmic scale.b Of focal season.c At the time of watching focal anime season.d High Intensity Viewing. 61

Table C-7: Personal Engagement - Experience
Note that all four variables “HiVic,” “Sequel,” “Availability,” and “Large Experience” are dummy variables.
Whether Franchise wasWatched Finished Watched Next
(i) (ii) (iii)
Engagement EquationHiVic -0.135*** 0.215*** 0.780***
(0.021) (0.037) (0.036)HiVic × Sequel 0.045* -0.100** 0.412***
(0.019) (0.031) (0.028)HiVic × Availability 0.021 0.070*
(0.015) (0.028)HiVic × Sequel × Availability 0.143*** 0.116***
(0.021) (0.035)Large Experience × HiVic -0.056 -0.198*** 0.047
(0.029) (0.057) (0.040)Large Experience × HiVic × Sequel -0.036 0.298*** 0.018
(0.038) (0.066) (0.042)Large Experience × HiVic × Availability 0.051 0.143*
(0.031) (0.060)Large Experience × HiVic × Sequel × Availability 0.003 -0.221**
(0.043) (0.072)Sequel 0.648*** 1.045*** -0.061**
(0.009) (0.014) (0.020)Availability -0.785*** -0.385***
(0.016) (0.018)Sequel × Availability 0.501*** 0.554***
(0.010) (0.015)Wait Time Until Franchise Available When Started Watching Focal Seasona -0.147*** -0.048***
(0.003) (0.003)Popularity Ranka,b -0.065*** -0.011*** 0.016*
(0.002) (0.003) (0.007)Community Ratingb 0.061*** 0.071*** -0.011
(0.004) (0.007) (0.016)Number of Episodesb 0.028*** -0.513***
(0.004) (0.019)Large Experience -0.002 0.015 0.005
(0.007) (0.011) (0.023)Constant 0.141*** -1.764*** -1.348***
(0.042) (0.065) (0.159)Standard Deviation of User Random Effect 0.594*** 0.762*** 0.251***
(0.004) (0.006) (0.013)Genre Dummies Yes Yes YesCalendar Year Dummies Yes Yes Yes
Viewing Modus EquationWeekend Dummy 0.045*** 0.044*** 0.045***
(0.004) (0.006) (0.005)Holiday Dummy 0.028** 0.014 0.025
(0.010) (0.016) (0.014)Popularity Ranka,b -0.050*** -0.045*** -0.037***
(0.002) (0.003) (0.003)Community Ratingb 0.045*** 0.073*** 0.049***
(0.005) (0.007) (0.006)Number of Episodesb 0.042*** 0.046*** 0.054***
(0.005) (0.007) (0.006)Duration of an Episodea 0.133*** 0.180*** 0.182***
(0.019) (0.028) (0.025)Large Experience -0.051*** -0.101*** -0.084***
(0.008) (0.012) (0.011)Constant -1.932*** -2.283*** -2.071***
(0.076) (0.115) (0.099)Standard Deviation of User Random Effect 0.940*** 0.916*** 0.788***
(0.005) (0.007) (0.006)Genre Dummies Yes Yes YesCalendar Year Dummies Yes Yes Yes
Error Correlation 0.099*** -0.097*** -0.132***(0.010) (0.016) (0.020)
Number of Observations 764,666 345,108 396,928AIC 1,524,821.60 672,136.30 408,817.87BIC 1,526,241.90 673,437.25 410,081.29Log Likelihood -762,287.80 -335,947.15 -204,292.94
Standard errors in parentheses.
* p < 0.05, ** p < 0.01, *** p < 0.001a Measured on logarithmic scale.b Of focal season.c High Intensity Viewing.
62

Table C-8: Interactive Engagement - Experience
Note that the variables “HiVid” and “Large Experience” are dummy variables.
Forum Posts Ratings RecommendationsIncidence Valence Number Length Incidence Valence Incidence Number
(i) (ii) (iii) (iv) (v) (vi) (vii) (viii)
Engagement EquationHiVid 0.103 -0.078* -0.094 0.214* 0.112 0.126*** 0.112 -0.010
(0.084) (0.032) (0.081) (0.099) (0.116) (0.019) (0.116) (0.025)Large Experience × HiVid 0.064 0.009 0.141* 0.073 0.098 -0.020* 0.098 0.051*
(0.052) (0.023) (0.057) (0.075) (0.078) (0.009) (0.078) (0.025)Ever-Made-a-Forum-Post Indicator 0.117*** 0.006 0.074* -0.064
(0.034) (0.011) (0.030) (0.041)Time Since Last Forum Posta -0.026** -0.003 -0.008 -0.012
(0.008) (0.004) (0.008) (0.011)Number of Forum Postsa,c 0.020** -0.005 0.000 -0.032**
(0.007) (0.004) (0.009) (0.012)Number of Ratingsa,c 0.282*** 0.008**
(0.022) (0.003)Number of Recommendationsa,c 0.282*** 0.014
(0.022) (0.009)Popularity Ranka,b 0.095*** 0.004 0.025* 0.013 0.044** 0.057*** 0.044** 0.005
(0.009) (0.004) (0.010) (0.013) (0.017) (0.002) (0.017) (0.006)Community Ratingb 0.046* 0.043*** 0.039 -0.023 0.097** 1.034*** 0.097** -0.003
(0.020) (0.009) (0.022) (0.030) (0.034) (0.004) (0.034) (0.011)Number of Episodesb 0.359*** -0.012 0.273*** 0.095***
(0.018) (0.008) (0.020) (0.027)Large Experience -0.067 0.009 -0.050 -0.008 0.024 -0.021 0.024 -0.007
(0.037) (0.013) (0.035) (0.049) (0.050) (0.011) (0.050) (0.014)Constant -6.146*** -0.096 -0.181 3.376*** -5.892*** -0.322*** -5.892*** 0.691***
(0.193) (0.085) (0.205) (0.272) (0.337) (0.034) (0.337) (0.103)Standard Deviation of User Random Effect 0.771*** 0.963*** 0.976*** 0.980*** 0.754*** 0.751*** 0.754*** 0.871***
(0.005) (0.071) (0.072) (0.073) (0.005) (0.005) (0.005) (0.131)Genre Dummies Yes Yes Yes Yes Yes Yes Yes YesCalendar Year Dummies Yes Yes Yes Yes Yes Yes Yes Yes
Viewing Modus EquationWeekend Dummy 0.053*** 0.043 0.038 0.039 0.053*** 0.052*** 0.053*** 0.054
(0.004) (0.057) (0.058) (0.058) (0.004) (0.004) (0.004) (0.111)Holiday Dummy 0.025* 0.310* 0.304* 0.304* 0.024* 0.021 0.024* -0.302
(0.011) (0.132) (0.134) (0.134) (0.011) (0.011) (0.011) (0.289)Popularity Rankb -0.030*** -0.088*** -0.088*** -0.088*** -0.031*** -0.030*** -0.031*** 0.017
(0.002) (0.026) (0.026) (0.026) (0.002) (0.002) (0.002) (0.051)Community Ratingb 0.054*** 0.027 0.023 0.026 0.055*** 0.058*** 0.055*** 0.363**
(0.005) (0.064) (0.064) (0.064) (0.005) (0.005) (0.005) (0.138)Number of Episodesb 0.052*** -0.044 -0.048 -0.043 0.052*** 0.052*** 0.052*** -0.060
(0.005) (0.058) (0.058) (0.058) (0.005) (0.005) (0.005) (0.130)Duration of an Episodea 0.381*** 0.495 0.483 0.494 0.380*** 0.380*** 0.380*** 0.498
(0.017) (0.285) (0.285) (0.285) (0.017) (0.017) (0.017) (0.757)Large Experience -0.088*** -0.066 -0.048 -0.048 -0.080*** -0.079*** -0.080*** 0.103
(0.009) (0.099) (0.098) (0.098) (0.008) (0.008) (0.008) (0.157)Constant -2.722*** -2.378* -2.308* -2.387* -2.727*** -2.765*** -2.727*** -5.474*
(0.069) (1.082) (1.088) (1.084) (0.069) (0.073) (0.069) (2.720)Standard Deviation of User Random Effect 0.771*** 0.963*** 0.976*** 0.980*** 0.754*** 0.751*** 0.754*** 0.871***
(0.005) (0.071) (0.072) (0.073) (0.005) (0.005) (0.005) (0.131)Genre Dummies Yes Yes Yes Yes Yes Yes Yes YesCalendar Year Dummies Yes Yes Yes Yes Yes Yes Yes Yes
Error Correlation -0.063 -1.398*** -0.578*** -0.311*** -0.056 0.134*** -0.056 -1.978***(0.050) (0.014) (0.012) (0.014) (0.069) (0.001) (0.069) (0.022)
Number of Observations 663,963 4,564 4,564 4,564 663,963 615,325 663,963 1,215AIC 649,312.75 4,946.16 13,030.54 15,654.55 625,864.47 2,539,112.05 625,864.47 194.70BIC 650,647.25 5,678.72 13,763.10 16,387.10 627,141.94 2,540,437.65 627,141.94 745.77Log Likelihood -324,539.37 -2,359.08 -6,401.27 -7,713.27 -312,820.24 -1,269,439.03 -312,820.24 10.65
Standard errors in parentheses.
* p < 0.05, ** p < 0.01, *** p < 0.001a Measured on logarithmic scale.b Of focal season.c At the time of watching focal anime season.d High Intensity Viewing.
63

Table C-9: Personal Engagement - Usage
Note that all four variables “HiVic,” “Sequel,” “Availability,” and “High Recent Usage” are dummy variables.
Whether Franchise wasWatched Finished Watched Next
(i) (ii) (iii)
Engagement EquationHiVic -0.140*** 0.198*** 0.781***
(0.021) (0.036) (0.036)HiVic × Sequel 0.036* -0.069* 0.414***
(0.018) (0.030) (0.027)HiVic × Availability 0.029 0.086**
(0.015) (0.027)HiVic × Sequel × Availability 0.148*** 0.095**
(0.020) (0.033)High Recent Usage × HiVic -0.035 -0.117 0.004
(0.036) (0.070) (0.052)High Recent Usage × HiVic × Sequel 0.002 0.233** 0.020
(0.047) (0.082) (0.055)High Recent Usage × HiVic × Availability 0.007 0.072
(0.038) (0.074)High Recent Usage × HiVic × Sequel × Availability -0.025 -0.176
(0.053) (0.090)Sequel 0.648*** 1.045*** -0.061**
(0.009) (0.014) (0.020)Availability -0.784*** -0.385***
(0.016) (0.018)Sequel × Availability 0.501*** 0.555***
(0.010) (0.015)Wait Time Until Franchise Available When Started Watching Focal Seasona -0.147*** -0.048***
(0.003) (0.003)Popularity Ranka,b -0.065*** -0.011*** 0.016*
(0.002) (0.003) (0.007)Community Ratingb 0.061*** 0.071*** -0.011
(0.004) (0.007) (0.016)Number of Episodesb 0.028*** -0.513***
(0.004) (0.019)High Recent Usage 0.002 0.026* -0.018
(0.007) (0.011) (0.029)Constant 0.140*** -1.769*** -1.354***
(0.042) (0.065) (0.159)Standard Deviation of User Random Effect 0.593*** 0.762*** 0.253***
(0.004) (0.006) (0.013)Genre Dummies Yes Yes YesCalendar Year Dummies Yes Yes Yes
Viewing Modus EquationWeekend Dummy 0.045*** 0.044*** 0.045***
(0.004) (0.006) (0.005)Holiday Dummy 0.027** 0.014 0.025
(0.010) (0.016) (0.014)Popularity Ranka,b -0.050*** -0.044*** -0.037***
(0.002) (0.003) (0.003)Community Ratingb 0.045*** 0.073*** 0.049***
(0.005) (0.007) (0.006)Number of Episodesb 0.042*** 0.045*** 0.054***
(0.005) (0.007) (0.006)Duration of an Episodea 0.132*** 0.180*** 0.182***
(0.019) (0.028) (0.025)High Recent Usage -0.009 -0.029* -0.035***
(0.008) (0.012) (0.010)Constant -1.938*** -2.288*** -2.076***
(0.076) (0.115) (0.099)Standard Deviation of User Random Effect 0.947*** 0.921*** 0.790***
(0.005) (0.007) (0.006)Genre Dummies Yes Yes YesCalendar Year Dummies Yes Yes Yes
Error Correlation 0.098*** -0.100*** -0.126***(0.010) (0.016) (0.020)
Number of Observations 764,666 345,108 396,928AIC 1,524,444.24 671,881.24 408,954.55BIC 1,525,864.55 673,182.18 410,217.96Log Likelihood -762,099.12 -335,819.62 -204,361.27
Standard errors in parentheses.
* p < 0.05, ** p < 0.01, *** p < 0.001a Measured on logarithmic scale.b Of focal season.c High Intensity Viewing.
64

Table C-10: Interactive Engagement - Usage
Note that the variables “HiVid” and “High Recent Usage” are dummy variables.
Forum Posts Ratings RecommendationsIncidence Valence Number Length Incidence Valence Incidence Number
(i) (ii) (iii) (iv) (v) (vi) (vii) (viii)
Engagement EquationHiVid 0.123 -0.078* -0.074 0.219* -0.217*** 0.126*** 0.097 -0.006
(0.083) (0.031) (0.079) (0.099) (0.042) (0.018) (0.115) (0.025)High Recent Usage × HiVid -0.012 0.008 -0.006 0.058 0.014 -0.015 0.113 0.060*
(0.067) (0.030) (0.074) (0.098) (0.035) (0.011) (0.094) (0.029)Ever-Made-a-Forum-Post Indicator 0.115*** 0.006 0.074* -0.064
(0.033) (0.011) (0.030) (0.041)Time Since Last Forum Posta -0.026** -0.003 -0.008 -0.012
(0.008) (0.004) (0.008) (0.011)Number of Forum Postsa,c 0.020** -0.005 -0.001 -0.032**
(0.007) (0.004) (0.009) (0.012)Number of Ratingsa,c -0.001 0.005*
(0.005) (0.002)Number of Recommendationsa,c 0.282*** 0.014
(0.022) (0.009)Popularity Ranka,b 0.095*** 0.004 0.024* 0.013 -0.059*** 0.057*** 0.044** 0.005
(0.009) (0.004) (0.010) (0.013) (0.005) (0.002) (0.017) (0.006)Community Ratingb 0.046* 0.044*** 0.040 -0.022 0.123*** 1.034*** 0.098** -0.005
(0.020) (0.009) (0.022) (0.030) (0.011) (0.004) (0.034) (0.011)Number of Episodesb 0.360*** -0.012 0.273*** 0.095***
(0.018) (0.008) (0.020) (0.027)High Recent Usage -0.052 -0.005 -0.064 -0.021 -0.017 -0.017* 0.019 -0.015
(0.038) (0.015) (0.040) (0.054) (0.023) (0.007) (0.054) (0.016)Constant -6.151*** -0.098 -0.198 3.372*** 3.507*** -0.316*** -5.866*** 0.699***
(0.192) (0.085) (0.205) (0.272) (0.109) (0.034) (0.338) (0.104)Standard Deviation of User Random Effect 0.775*** 0.964*** 0.977*** 0.981*** 0.780*** 0.751*** 0.759*** 0.867***
(0.005) (0.071) (0.072) (0.073) (0.005) (0.005) (0.005) (0.130)Genre Dummies Yes Yes Yes Yes Yes Yes Yes YesCalendar Year Dummies Yes Yes Yes Yes Yes Yes Yes Yes
Viewing Modus EquationWeekend Dummy 0.053*** 0.043 0.038 0.039 0.053*** 0.052*** 0.053*** 0.055
(0.004) (0.057) (0.058) (0.058) (0.004) (0.004) (0.004) (0.111)Holiday Dummy 0.024* 0.310* 0.303* 0.304* 0.025* 0.021 0.024* -0.294
(0.011) (0.132) (0.134) (0.134) (0.011) (0.011) (0.011) (0.289)Popularity Rankb -0.030*** -0.088*** -0.088*** -0.087*** -0.030*** -0.030*** -0.031*** 0.017
(0.002) (0.026) (0.026) (0.026) (0.002) (0.002) (0.002) (0.051)Community Ratingb 0.054*** 0.028 0.024 0.027 0.054*** 0.058*** 0.055*** 0.363**
(0.005) (0.064) (0.064) (0.064) (0.005) (0.005) (0.005) (0.138)Number of Episodesb 0.052*** -0.043 -0.048 -0.042 0.051*** 0.052*** 0.052*** -0.060
(0.005) (0.058) (0.058) (0.058) (0.005) (0.005) (0.005) (0.130)Duration of an Episodea 0.380*** 0.496 0.482 0.496 0.382*** 0.380*** 0.380*** 0.484
(0.017) (0.284) (0.285) (0.285) (0.017) (0.017) (0.017) (0.753)High Recent Usage -0.035*** -0.142 -0.130 -0.125 -0.033*** -0.030*** -0.034*** 0.067
(0.008) (0.110) (0.110) (0.110) (0.008) (0.008) (0.008) (0.179)Constant -2.722*** -2.396* -2.312* -2.405* -2.725*** -2.768*** -2.730*** -5.426*
(0.069) (1.081) (1.086) (1.083) (0.069) (0.073) (0.069) (2.705)Standard Deviation of User Random Effect 0.775*** 0.964*** 0.977*** 0.981*** 0.780*** 0.751*** 0.759*** 0.867***
(0.005) (0.071) (0.072) (0.073) (0.005) (0.005) (0.005) (0.130)Genre Dummies Yes Yes Yes Yes Yes Yes Yes YesCalendar Year Dummies Yes Yes Yes Yes Yes Yes Yes Yes
Error Correlation -0.067 -1.397*** -0.577*** -0.311*** 0.129*** 0.134*** -0.044 -1.978***(0.050) (0.014) (0.012) (0.014) (0.024) (0.001) (0.069) (0.022)
Number of Observations 663,963 4,564 4,564 4,564 663,963 615,325 663,963 1,215AIC 649,282.16 4,946.07 13,032.12 15,652.58 745,668.08 2,539,240.71 625,703.13 195.18BIC 650,616.66 5,678.62 13,764.68 16,385.14 746,991.17 2,540,566.31 626,980.60 746.25Log Likelihood -324,524.08 -2,359.03 -6,402.06 -7,712.29 -372,718.04 -1,269,503.36 -312,739.57 10.41
Standard errors in parentheses.
* p < 0.05, ** p < 0.01, *** p < 0.001a Measured on logarithmic scale.b Of focal season.c At the time of watching focal anime season.d High Intensity Viewing.
65