Embed Size (px)
Citation preview

Ashoka University Economics Discussion Paper 67
Viewing Caste Inequality Upside DownThe Perversity of Special Schemes for Brahmins in South India
October 2021
Ashwini Deshpande, Ashoka University Rajesh Ramachandran, Monash University

Viewing Caste Inequality Upside DownThe Perversity of Special Schemes for Brahmins in South India∗
Ashwini Deshpande† Rajesh Ramachandran‡
October 2021
This paper empirically examines the justification for a slew of preferentialpolicies aimed at Brahmins, the group unambiguously regarded at the topof the caste hierarchy, in three southern states of India. Using data fromIndia Human Development Survey, 2011-12, for united Andhra Pradesh atthe time of survey (which later split into Andhra Pradesh and Telangana)and Karnataka, we compare Brahmins with non-Brahmin upper caste Hin-dus, OBCs, SC-STs and upper caste Muslims in their respective states. Ourresults reveal that Brahmins in these three states are at the top of (a) var-ious human capital measures; (b) various standard of living indicators; and(c) have better political and social networks, compared to all other socialgroups. Since these schemes focus on economically weaker sections withinthe Brahmin communities, we also compare the poor within each of thesecommunities. Even within the poor, the caste hierarchy is clear and present,with the human capital and material outcomes of poor Brahmins being sub-stantially better than those of poor from other social groups. Finally, weshow that this pattern, where Brahmins are at the top of virtually everyindicator, is not confined to these specific states, but is a pan-Indian phe-nomenon. Thus, we argue that these preferential policies are perverse andretrench existing caste inequalities instead of eliminating them, and are inviolation of the spirit of the Indian Constitution.
Keywords: Caste inequality, Brahmins, Preferential Policies, Affirmative Action,
India
JEL Codes: I240; O15; J71
∗We are grateful to Pratap Bhanu Mehta for a phone discussion on the nuances of the Indian Constitu-tion’s approach to caste inequality; and to Vivaan Gupta for compiling background material on thespecial schemes examined in this paper. We are responsible for all remaining errors.
†Ashoka University, Department of Economics, Rajiv Gandhi Education City, Sonipat, Haryana 131029,India. [email protected]
‡Monash University Malaysia, Department of Economics, School of Business, Kuala Lumpur, [email protected]
1

1 Introduction
The preamble of the Constitution of India promises to secure for all citizens “Justice,social, economic and political; [and] ... Equality of status and opportunity...”, amongother goals.1 Ensuring genuine justice, liberty, equality and fraternity is immenselychallenging for any society; this was especially the case for newly independent India.As the Chairman of the Drafting Committee of the Indian Constitution, Dr. B. R.Ambedkar famously emphasised, by adopting these core constitutional values in 1950,India entered “into a life of contradictions”, in that political equality (the principle of“one man, one vote”) was superimposed on a foundation of social inequality embodiedby caste hierarchy that permeated all parts of the country, albeit with regional variation.Weakening the stranglehold of deep-rooted and multi-dimensional caste inequality wasessential to the realisation of the goals of justice and equality. The Indian policy ofaffirmative action, the reservation system, was one step in that direction, designed asa scheme of compensatory discrimination via quotas. The affirmative action measureswere complemented by several preferential policies targeted towards groups that were atthe receiving end of the worst expression of caste inequality, viz., untouchability and thedeep stigmatisation associated with it.
The administrative categories of Scheduled Castes or SC (a list of jatis, i.e. castes,that were considered ritually impure and therefore untouchable) and Scheduled Tribes,or ST (tribes that were highly marginalised) came into being as groups towards whomcompensatory discrimination would be targeted. This policy was constitutionally sanc-tioned via Articles 15 (4) and 16 (4).2 Untouchability was abolished via Article 17,deemed illegal and punishable by law through the Protection of Civil Rights Act, 1955.This was followed by the Prevention of Atrocities against SC-ST Act in 1989.3 The aimof these policies was to move towards substantive equality, which would make the formalguarantee of equality by the Constitution a lived reality. As a result, all states of Indiahave special schemes targeted towards SC-STs. Over time, other groups such as OtherBackward Classes (OBCs) and Economically Weaker Sections (EWS) got added to thelist of beneficiaries of affirmative action and preferential schemes.
Contemporary India has simultaneously witnessed vicious opposition to caste-basedreservation alongside vociferous demands by groups for inclusion as beneficiaries. Whilethe dominant discourse around reservation policies is opposed to caste-based preferenceson grounds of these being antithetical to “merit”, and/or being populist vote-garneringploys, the demand for being included in the reserved list continues to be raised by mul-tiple caste groups, such as dominant castes in specific states (Jats in Haryana, Marathasin Maharashtra, Patels or Patidars in Gujarat, Kapus in Andhra Pradesh). We haveprovided empirical evidence to show why extension of reservations to these dominant
1https://www.constitutionofindia.net/constitution of india/preamble2https://www.constitutionofindia.net/constitution of india/fundamental rights/articles/Article%20153https://tribal.nic.in/actRules/preventionofAtricities.pdf
2

castes would misplaced (Deshpande and Ramachandran, 2017) We have also analysedthe extension of reservations to the EWS category (the definition of which makes it ahighly inaccurate way to count the poor, i.e. those below poverty line), which effec-tively creates a quota for upper castes and dilutes the purpose for which reservationswere created in the first place, which was to provide representation to stigmatised andmarginalised social groups in elite positions (Deshpande and Ramachandran, 2019a).
In this paper, we focus on an extraordinary set of measures adopted by three southIndian states, Karnataka, Andhra Pradesh and Telangana, which provide preferentialschemes for Brahmins, the jati (caste) unambiguously at the top of the caste hierarchy.These measures are extraordinary and perverse for four reasons. One, they invert thelogic and purpose of preferential policies by suggesting that the most revered and sociallydominant group needs protection, instead of the most vulnerable, as has hitherto been thecase in independent India. Second, by conferring extra advantages to a group already atthe top of an entrenched social hierarchy, these measures violate the constitutional visionthat sought to create a society in which caste-based disadvantages would be minimised,to be eventually eliminated. Three, by earmarking certain types of training exclusivelyfor Brahmins (e.g. Vedic education, without going into the merit of this training), itreinforces the injustice of the caste system due to which the accident of birth becomesthe arbiter of future life chances. Fourth, the three state governments have been issuingcaste certificates to individual Brahmins who wish to avail of these policies. Thus,these measures paradoxically count (i.e. identify) a non-SC-ST caste group, at a timewhen there is a fierce opposition to counting caste through a national census. Sucha census would throw light on the actual material status of individual castes, but itis vociferously opposed because of the belief that it would harden caste distinctionsinstead of obliterating them. Identifying Brahmins violates the status quo just as muchas a caste census would, since currently the only context under which caste appears inthe official or public domain is that of reservation or preferential policies, i.e. groupssuch as SCs are identified as beneficiaries of schemes. For all other purposes, individualcaste affiliation is not officially or legally recognised or counted, notwithstanding theubiquitous presence of caste in the public sphere, via the marriage market or in electoralstrategies and outcomes.
Using data from India Human Development Survey 2011-12 for united Andhra Pradeshat the time of survey (which later split into Andhra Pradesh and Telangana) and Kar-nataka, we compare Brahmins with non-Brahmin upper caste Hindus, OBCs, SC-STsand upper caste Muslims in their respective states. Our results reveal that Brahmins inthese three states are the top of a) various human capital measures; b) various standardof living indicators; and c) have better political and social networks, compared to allother social groups. Since these schemes focus on the EWS within the Brahmin commu-nities, we also compare the poor within each of these communities (by using the moresensible official poverty line cut-off, which identifies the poor more accurately).4 Even
4We use the official poverty line based on the Tendulkar methodology (Tendulkar, 2013).
3

within the poor, the caste hierarchy is clear and present, with the human capital andmaterial outcomes of poor Brahmins being substantially better than those of poor fromother social groups. Lest it be argued that these states are exceptional, we also showthat the pattern of Brahmin outcomes exceeding those of other social groups by a largemargin is not unique to these states. Our results show that this is a pan-Indian reality.
The rest of this paper is organised as follows. Section 2 briefly outlines details ofthe preferential schemes. Section 3 shows the empirical results of comparing Brahminsto other social groups in the respective states. Section 4 focuses only on the poor andcompares group differences between the states. Section 5 presents a discussion of theresults and offers concluding comments. The online appendix presents the analysis ofSection 3 for the entire country.
2 Details of Preferential Schemes for Brahmins
All three states have very similar schemes targeted at Brahmins, briefly enumeratedbelow. It is noteworthy that the schemes have been named after iconic Brahmin figuressuch as Chanakya (Vishnugupt), the highly revered Brahmin philosopher, jurist andeconomist, the author of the first treatise on economics, “Arthashastra”, dated between3rd and 4th century BC. Schemes are also named after other historical and mythologicalfigures that are an integral part of the mainstream Hindu cultural ethos that the majoritycommunity subscribes to. Just this fact is sufficient to indicate that the schemes are nottargeting a disadvantaged or marginal community, but one whose icons predominate themainstream psyche and cultural values, despite the community being a tiny minority.
It is noteworthy that the set of policies promote or support Brahmins in their tra-ditional caste roles (priesthood or pursuing Vedic knowledge), but also pushes for di-versification of livelihood opportunities outside traditional roles e.g. entrepreneurship,in recognition of modern realities. This makes the policies all the more bizarre, as onecan, for arguments’ sake, justify a special policy to preserve a vanishing or a possiblynon-remunerative occupation. The question that arises is what considerations compelthese state governments to reserve diversification of livelihoods only to Brahmins andnot open up these opportunities to everyone. Caste-based occupational or educationaldivision is not meant to be promoted; it is a scourge that prevents equality of opportu-nity. Whatever the merit of Vedic education might be, reserving any kind of training oreducation for one section is anathema to the idea of equality.
We can see in the descriptions of the schemes below that many of consist of support tothe poor, which is a laudable goal for public policy, had it not been exclusively reservedfor the poor among the socially privileged and revered group.
The pioneer in developing preferential policies for Brahmins was the state of Andhra
4

Pradesh. In December 2014, N. Chandrababu Naidu, the Chief Minister heading theTelugu Desam Party (TDP) government, set up the Andhra Pradesh Brahmin WelfareCorporation for Brahmins in the state, a group with a 5 percent population share5. Whilethe initial amount of funding is not mentioned on the website, the state government’sCM Office Real-time Executive dashboard (CORE portal) provides a fair amount ofdetail on the “Brahmin Welfare Corp” until the year 2018-196.
It ran schemes such as Vedavyasa, a financial assistance for Brahmin students pursuingVedic Education; Gayathri, “recognizing of “topper students”, belonging to the Brah-min community, of a recognized and reputed” college at any education level; Bharti,“financial assistance to Brahmin students to continue their academic education”; Va-sishta, “Coaching and guidance to Brahmin students for competitive examinations”;Dronacharya, “Skill development among unemployed Brahmin youth”; Chanakya, “en-courage economically weak Brahmin entrepreneurs to set up enterprises”; KalyanamastuPathakam “Encouraging Vedic culture for the Bride who is marrying to a Brahmin Boywho is in the profession of Purohityam or Veda-Parayanam or Archakatam”; Kashyapa“Monthly pensions to poor orphaned or destitute women or differently abled, senior cit-izens, widows with food and shelter expenses”; Garuda, “financial assistance for funeralexpenses of deceased Brahmins where the family has no other means to meet the saidexpenses”; and Bhargava, “matching grants “to catalyse, energize and strengthen theefforts of individuals or an association or organisation representing Brahmin Commu-nity”.
In January 2017, the Telangana Rashtra Samithi (TRS) government led by K. Chan-drashekhar Rao followed suit and established the Telangana Brahmin Samkshema Parishad(TBSP) with an intial funding of INR 1 billion (100 crores) targeted at the 3 percentBrahmin population in the state.7
It runs schemes such as Vedahita (“encouraging and providing financial assistance toVeda classes, Vedic studies and students across the state”), and to provide “honorar-ium for Veda Shastra Pandits (expert scholars of the Vedas)” in the state; VivekanandaOverseas Education, which provides financial support to Brahmin students for highereducational courses abroad; Sri Ramanuja, which offers fee reimbursement to Brahminstudents belonging to the below povery line (BPL) category; Brahmin EntrepreneurshipScheme of Telangana (BEST) providing financial assistance to Brahmin entrepreneurs;and Brahmin Sadan, which establishes centres of cultural, religious, spiritual and com-munal activities to benefit Brahmins from the state.
5https://theprint.in/politics/now-ap-karnataka-telangana-usher-in-world-of-upper-caste-politics-privilege-the-brahmins/731030/
6https://core.ap.gov.in/CMDashBoard/UserInterface/School/BrahminWelfareCorpReport.aspx7https://timesofindia.indiatimes.com/city/hyderabad/upper-caste-quota-telangana-and-andhra-
already-running-brahmin-corporations/articleshow/67465534.cms. To put this number in perspec-tive it is interesting to note that for instance the entire state budget for mid-day meals for theyear 2019-20 was INR 318 crores; see http://mdm.nic.in/mdm website/Files/PAB/PAB-2019-20/PAB 2019-20 minutes/Telangana.pdf
5

There is very little information available on the detailed functions of the TBSP, withthe occasional mentions of “applications open for TBSP schemes” in some regional news-papers. An internet search revealed that the TBSP also runs a marriage scheme similarto that in Karnataka, which guarantees a joint fixed deposit of INR 300,000 and anadditional INR 100,000 for wedding expenses to brides who would marry a Brahminpriest, with no upper limit for the number of couples who would get this assistance.
In July 2020, the Chief Minister of Karnataka, B. S. Yediyurappa of the BharatiyaJanata Party (BJP), the national ruling party, set up the Karnataka State BrahminDevelopment Board (KSBDB) at a cost of INR 250 million (25 crores)8. The share ofBrahmins in the state poulation is roughly 4 percent. These schemes include financialassistance to “needy” Brahmin students, training and skill development programmesto help students compete in national level entrance examinations as well as for en-trepreneurial activities, old age support via pensions and old age homes and organisingyouth festivals for “younger generation in the development of [the] Brahmin communityand society as a whole”. Significantly, the KSBDB also conducts a survey of Brahminsin the state.
Although the KSBDB website does not provide any details, the Karnataka governmentannounced two schemes which were launched by the board, viz., Arundhati (550 Brahminwomen from poor backgrounds to be given INR 25,000 each for their marriage), andMaitreyi (offering a financial bond of INR 300,000 lakh for 25 women who marry Brahminpriests from poor backgrounds, to be used over three years.9)
3 How do the Brahmins fare in comparison to the other socialgroups?
3.1 Data and Methodology
We use data from the India Human Development Survey (IHDS) of 2011–12, whichclassifies individuals as Brahmins, Forward/General (except Brahmin), Other BackwardCastes (OBC), Scheduled Castes (SC), Scheduled Tribes (ST) and Others, as well as byreligious categories - Hindu, Muslim, Christian, Sikh, Buddhist, Jain, Tribal and Others- giving us a sample of 40,588 households and 197,377 individuals.
We construct five social groups using data on caste category and religion that accountfor the two of the key cleavages in society: Brahmin Hindus comprising 5 percent of thesample10; the upper caste Hindus (UC-Hindus), the non-SC-ST-OBC Hindus comprising
8https://ksbdb.karnataka.gov.in/english9https://indianexpress.com/article/explained/karnataka-brahmin-development-board-schemes-
explained-7191607/10The Brahmins are the individuals involved traditionally in the occupation of priests, scholars and
6

15 percent of the sample11; Other Backward Classes (OBCs) comprising 43 percentof the sample12; Scheduled Castes and Tribes (SC-ST) comprising 31 percent of thesample;13 and the upper caste Muslims (UC-Muslims) comprising 5.80 percent of thesample (Sachar Committee, 2007)14
We compare the five groups on indicators of human capital, material standards ofliving and social prestige and networks. We present group level means and the 95percent confidence intervals for each of the indicators. For the indicators measured atthe individual level, when calculating the group means and the confidence intervals, weaccount for age, gender and state of residence of the individual, and also allow for thestandard errors to be correlated for individuals living within the same sampling cluster.For the indicators measured at the household level, we account for the age, gender andstate of residence of the household head, and also allow for the standard errors to becorrelated for individuals living within the same sampling cluster.
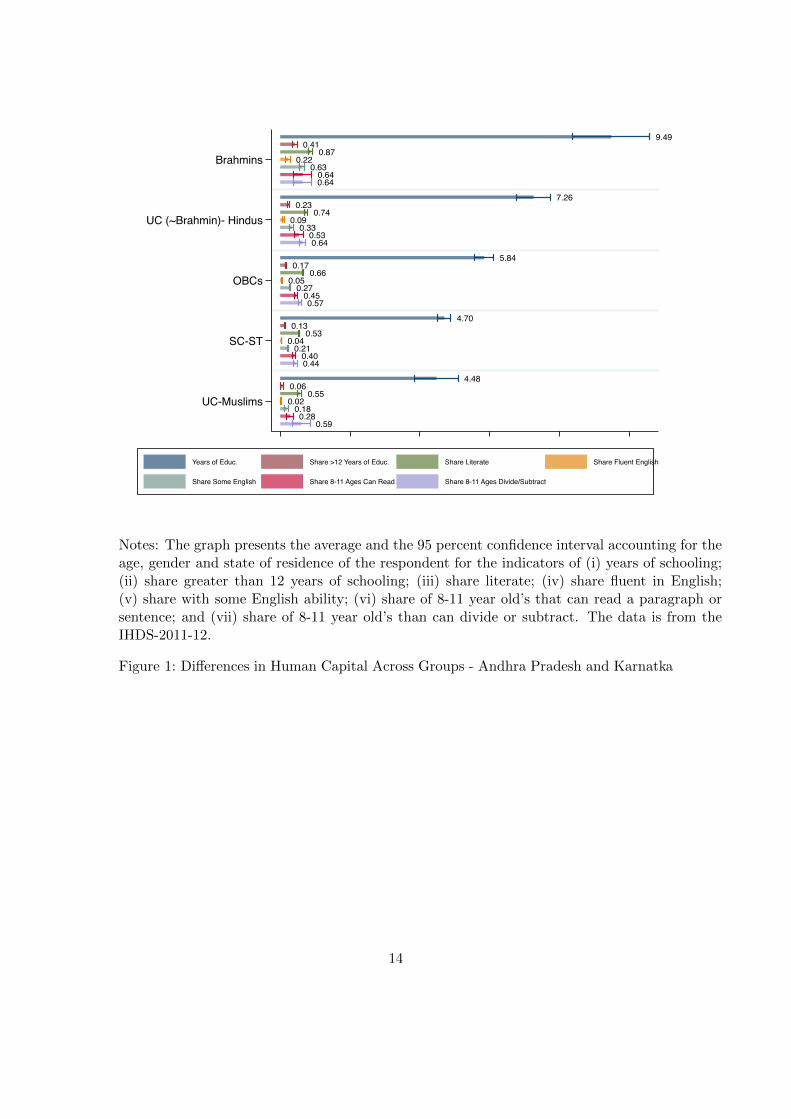
3.2 Human capital differences across groups
The first five indicators are: (i) years of schooling; (ii) a dummy for an individual with12 or more years of schooling; (iii) dummy for being literate; (iv) dummy for beingfluent in English; (v) dummy for having some English ability. We consider the sampleof individuals aged 18 years or more in 2011-12 resulting a total of 18,383 respondents,and the results are shown in Figure 1. We can see a clear ordering with Brahminshaving the best human capital outcomes on all seven indicators, followed by the non-Brahmin UC-Hindus, OBCs, SC-ST and UC-Muslims. For instance, they have on anaverage 9.5 years of schooling, 41 percent have finished 12 or more years of schooling and87 percent are literate. The commensurate figures for SC-ST are 4.70, 0.13 and 0.53,respectively. Thus, compared to the SC-ST they have more than double the years ofschooling, are three times more likely to have finished 12 years or more of schooling, andare 64 percent more likely to be literate. Even when comparing with the non-Brahmin
teachers and at the top of the caste hierarchy.11The UC-Hindus are the group consisting of the Kshatriyas (traditional occupation consisting of rulers,
warriors and administrators) and Vaishyas (traditional occupation consists of agriculturalists andmerchants), i.e. high-ranking castes.
12They are a group of intermediate to low-ranked castes and communities traditionally identified asShudras (traditional occupation of laborers and service providers). The OBCs receive affirmativeaction since 1992 in central government services, and since 2006 in central and private institutes ofhigher education (Deshpande, 2013)
13The SC-ST are among the most socioeconomically disadvantaged groups and receive preferential affir-mative action, for which purpose they are listed in a government schedule (hence called the ScheduledCastes and Scheduled Tribes). While the nomenclature of SC and ST are the official administrativecategories, Dalit meaning “oppressed” and Adivasi, meaning “indigenous people,” is often used todescribe SC and ST communities.
14The Muslims they have been recognized as a group facing multiple forms of disadvantage in the countrysince the publication of the Sachar Committee report on the social, economic and educational statusof Muslims.
7

UC Hindus, Brahmins have two more years of schooling, are 1.78 times more likely tohave finished 12 years or more of schooling, and are 18 percent more likely to be literate.
The human capital indicators show that Brahmins also report superior English abili-ties, a skill rewarded highly on the labor market (Azam et al., 2013); 22 and 63 percentreport being fluent or having some English ability, the corresponding figures for non-Brahmin UC-Hindus, and SC-ST are 9 and 33 and 4 and 21 percent, respectively.
These differences in human capital are already visible among children aged 8-11 yearsold whose ability to read, as well as numerical skills were tested. The last two bars ofFigure 1 consider the following two indicators for the children aged 8-11: (vi) dummyfor a child that can read a paragraph or sentence; and (vii) dummy for a child thatcan divide or subtract. It shows that 64 percent of Brahmin kids aged 8-11 can read aparagraph or story and divide and subtract, respectively. On the other hand, the figuresfor non-Brahmin UC-Hindus is 53 and 64 percent, respectively, and for the SC-ST, 40and 44 percent, respectively.
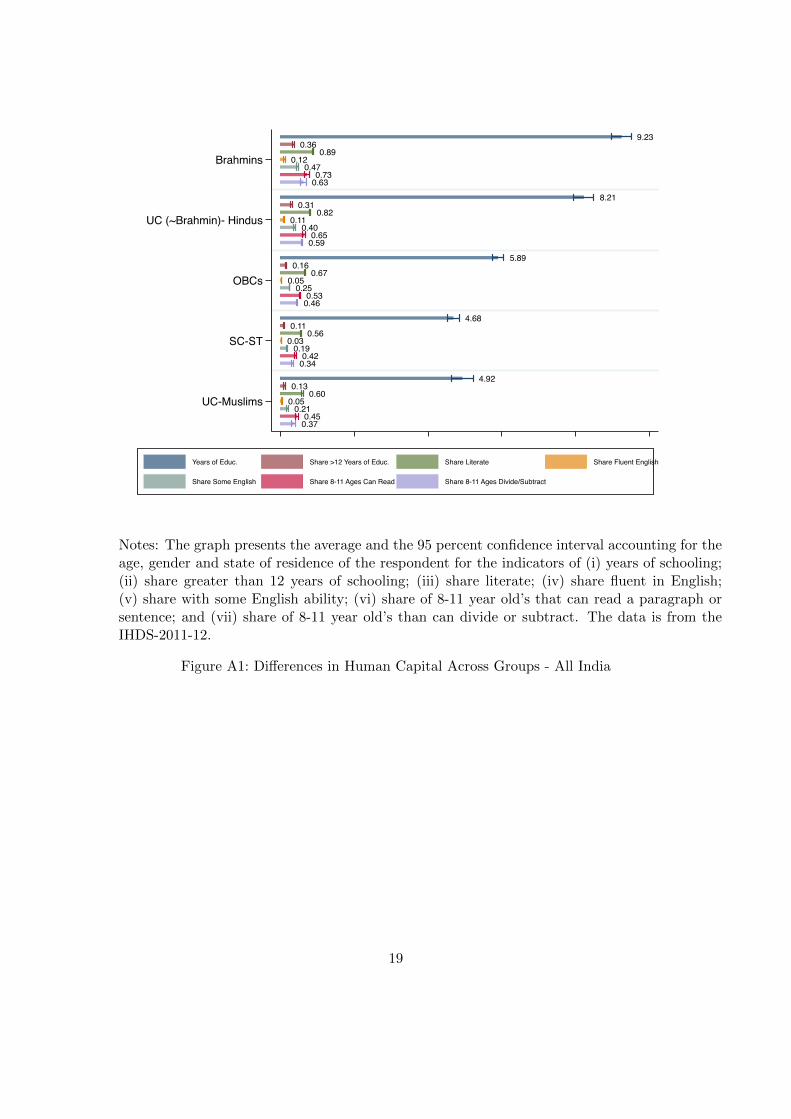
Figure A1 in the Appendix shows that the documented differences in human capital,with the Brahmins on top followed by the non-Brahmin UC Hindus, OBCs and SC-STis true not just for these states, but at an all India-level.15
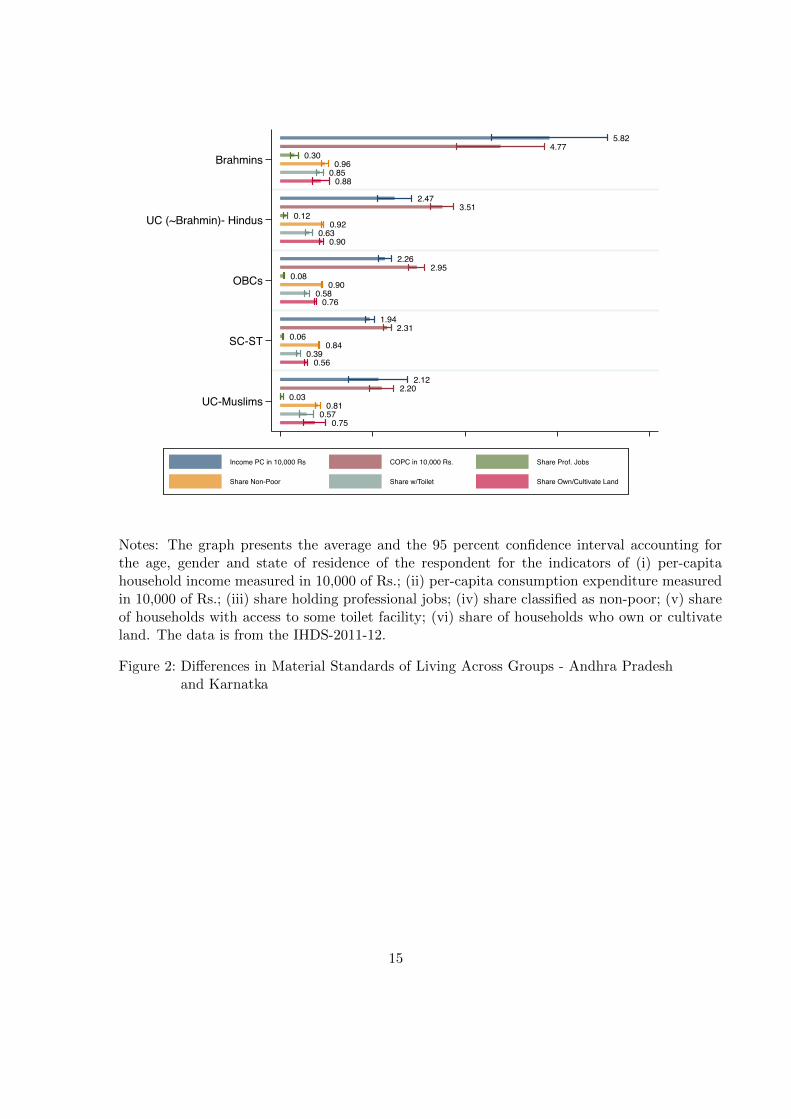
3.3 Differences in material standards of living
Figure 2 compares the same five social groups in Andhra Pradesh and Karnataka on sixindicators of living standards. Five indicators, namely: (i) per capita household incomemeasured in 10,000s of Rs. (in 2011-12 prices); (ii) per capita household consumptionexpenditure measured in 10,000s of Rs. (in 2011-12 prices); (iii) dummy for householdclassified as non-poor; (iv) dummy for households with access to some toilet facility; (v)dummy for households who own or cultivate land - are calculated at the household levelaccounting for age, gender and state of residence of the household head and results ina sample of 5664 households. The last indicator (vi) dummy for holding a professionaljob considers the entire sample of individuals aged 18 or more and who report havingan occupation (a sample of 8836 individuals).
We again observe that Brahmins have the best outcomes followed by the non-BrahminHindu UCs and the OBCs. The SC-ST and UC-Muslims are largely indistinguishablethough the UC-Muslim households do better in terms of access to toilets and owningor cultivating land. In terms of income per capita, the figures are Rs. 58200, 24700,22600, 19400 and 21200 for the Brahmins, non-Brahmin UC Hindus, OBCs, SC-ST andUpper Caste Muslims, respectively. In other words, the per capita income of Brahmins
15The ordering between SC-ST and UC-Muslims switches around, that is, the SC-ST perform betterthan the UC-Muslims in Andhra Pradesh and Karnataka, whereas the UC-Muslims perform betterwhen the country is considered as a whole.
8

is 2.35 to 3 times greater than the non-Brahmin UC Hindus and SC-ST, respectively.30 percent of Brahmins hold a professional job, whereas the corresponding figures are12, 8, 6 and 3 for non-Brahmin UC Hindus, OBCs, SC-ST and Upper Caste Muslims,respectively. Only 4 percent of Brahmin households are classified as poor, whereas thecorresponding proportions are 8 and 10 percent for non-Brahmin UC Hindus and theOBCs, respectively, and 16 and 19 percent for the SC-ST and UC Muslims, respectively.In other words, the rate of poverty is 4 to 5 times higher among the SC-ST and UCMuslims compared to the Brahmins. Finally, there are large differences in access tobasic infrastructure; whereas 85 percent of Brahmin households have access to someform of toilet, the commensurate figures are 63, 58, 39 and 57 for non-Brahmin UCHindus, OBCs, SC-ST and Upper Caste Muslims, respectively.
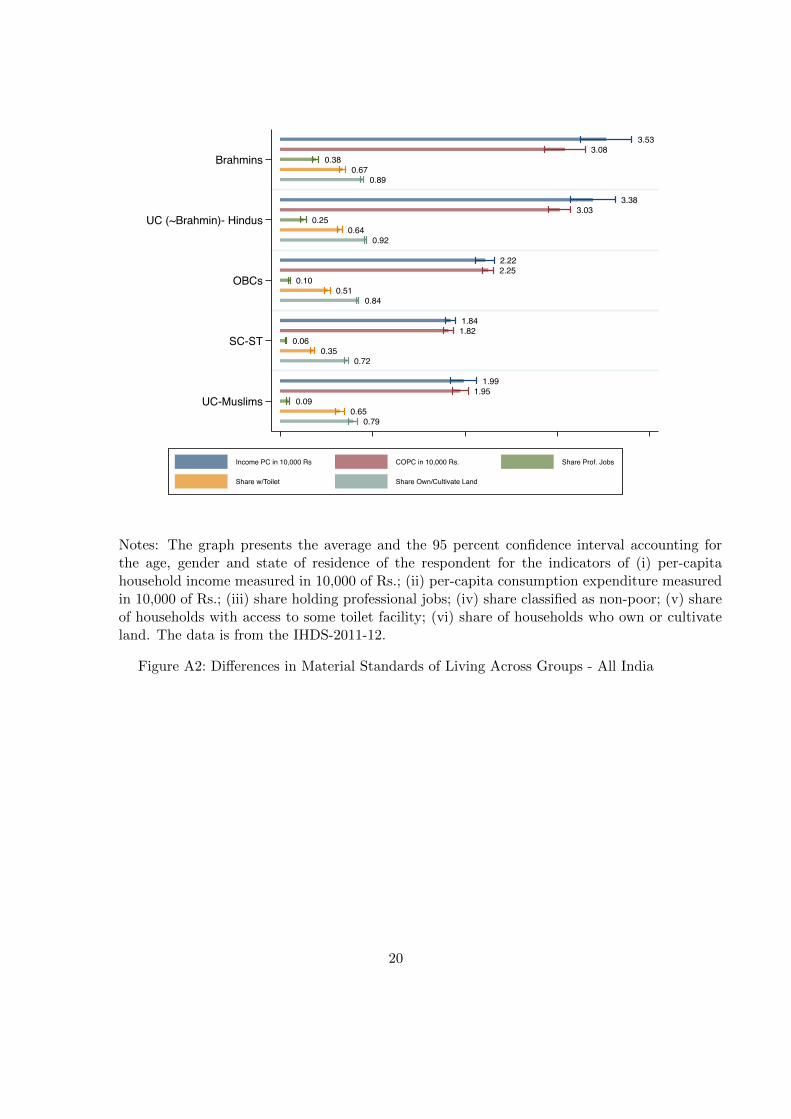
Figure A2 in the Appendix shows that the differences on the same six material stan-dards living indicators but now for all of India. We see that the ordering is maintainedthough the UC Muslims perform better than the SC-STs when the country is consideredas a whole.
Summary The evidence presented in Section 3 shows that the Brahmins do significantlybetter than the four other social groups in terms of both the human capital they possess,as well as the material outcomes in terms of income, consumption, occupation, poverty,access to sanitation and land. Moreover, this is true not only for the states of AndhraPradesh and Karnataka but for the country as whole. Thus, the Brahmins can not beconsidered a disadvantaged group in terms of any capabilities or on the material basisof life.
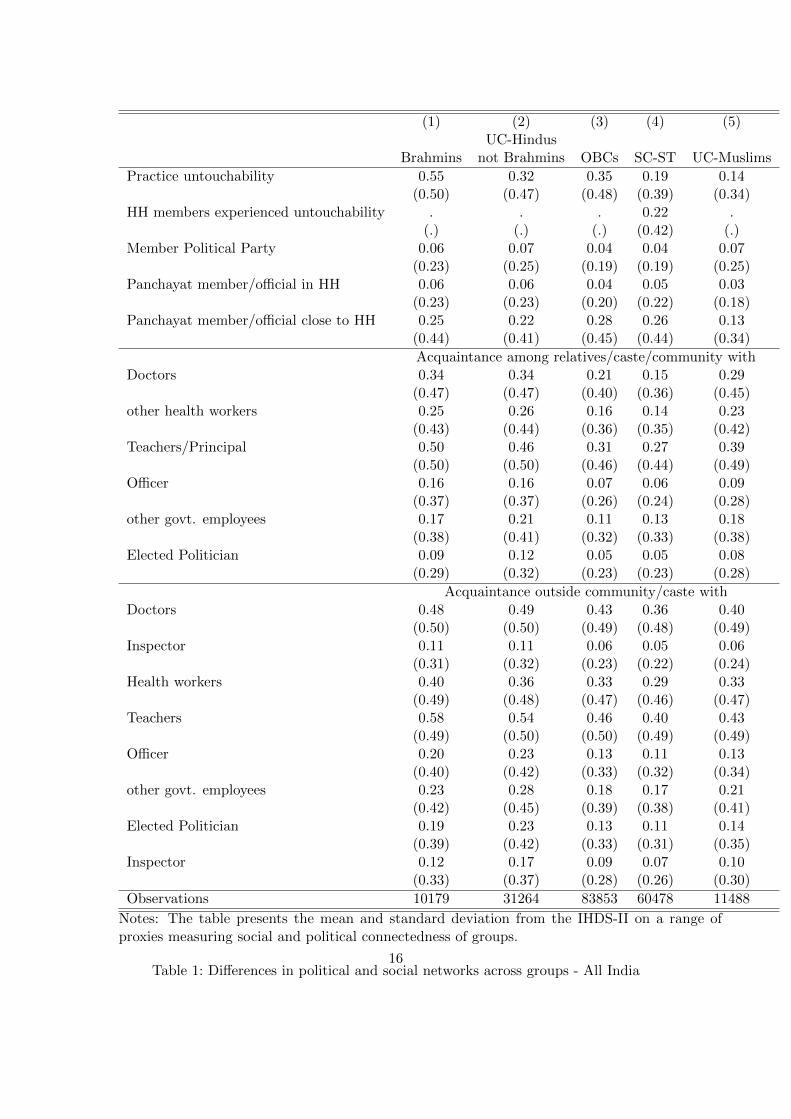
The reservation policy was designed to account for social disadvantages faced by groupsand to counter discrimination stemming from the caste system and the associated ritualsof untouchability. Table 1 shows that 55 percent of Brahmins self-report that they adhereto the practice of some form of untouchability. Moreover, 22 percent of SC-ST householdsrespond that some household members experienced untouchability in the last five years.Table 1 also shows that Brahmin households are also likely to possess superior politicaland social networks both within and outside their caste/community. For instance, theyare more likely to have acquaintance with doctors, teachers, elected politicians, officers,inspectors, other government employees and health workers both within and outsidetheir community/caste. Thus, Brahmins not only self-profess following practices thatdiscriminate against individuals from other social groups but are also seen to be betterconnected both socially and politically. In sum, the evidence suggests that there areneither social nor economic criteria that justify targeting benefits to Brahmins based ontheir group identity.
9

4 Are poor Brahmins worse off than the poor from othergroups?
The eligibility criteria of the schemes is often only the requirement of belonging to theBrahmin community though certain income thresholds have been fixed depending onthe scheme. One might thus wonder that though the share of poor among the Brahminsis 4 to 5 times lower than the SC-ST and the UC-Muslims is it the case that the pooramong the Brahmins are especially disadvantaged?
To explore this we restrict the sample to households classified as poor and residentin Andhra Pradesh and Karnataka and regress the 13 outcomes from Figures 1 and 2on a set of group dummies, as well as dummies for age, sex and state of residence andcluster the standard errors at the level of the primary sampling unit. The coefficientson the group dummies are shown in Table 2. We see that the picture emerging fromthe comparison of the poor from the five social groups is similar to the picture from thecomparison of the entire population; poor Brahmins are again at the top followed bythe non-Brahmin UC Hindus, OBCs, SC-ST and Upper Caste Muslims. For instance,Brahmins are 10, 14 and 21 percentage points more likely than non-Brahmin UC Hindus,SC-ST and UC Muslims to finish 12 or more years of schooling or have household percapita income that is greater by Rs. 8200 and Rs 5400 as compared to the non-BrahimUC Hindus and the SC-ST, respectively.
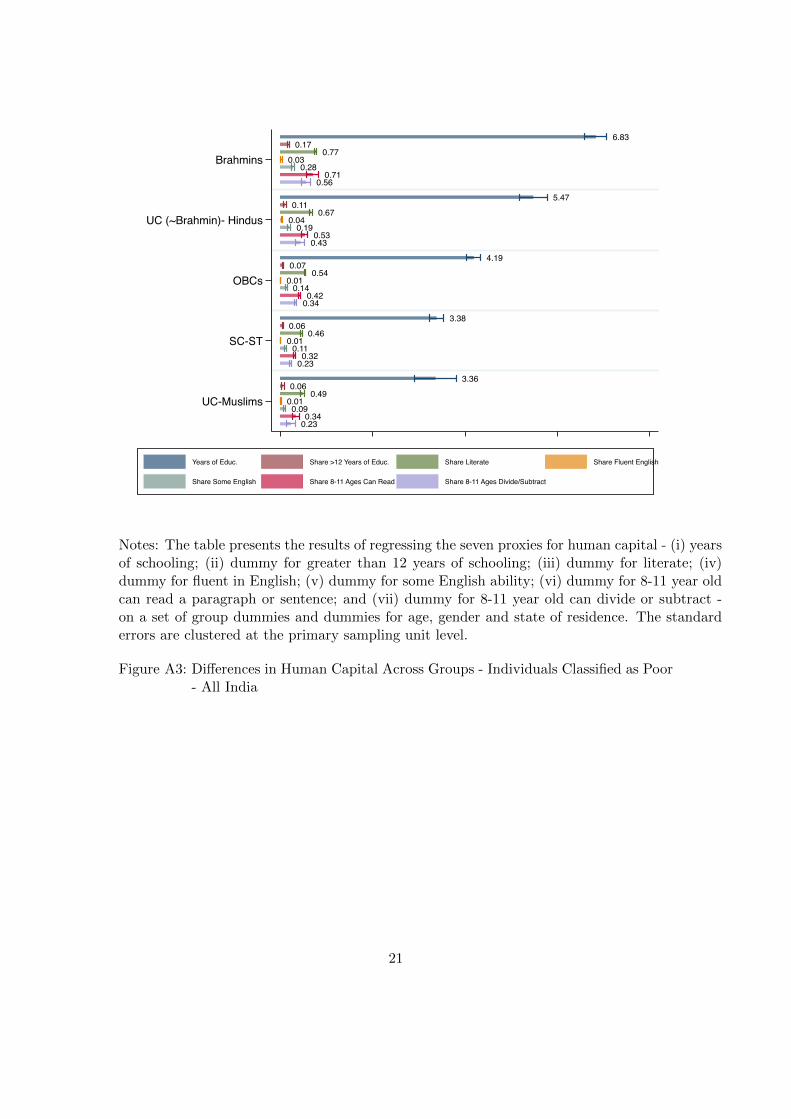
Our estimates on the poor in Andhra Pradesh and Karnataka reduces the sample tobetween 300 and 600 households. Therefore, we also explore the differences among theindividuals classified as poor across the five social groups, but at the all-India level.Here the larger sample allows for greater precision in the estimates. The results areshown in Figures A3 and A4. The patterns are very stark and again in favor of theBrahmins followed by the non-Brahmin UC Hindus and the OBCs, whereas the SC-STand Muslims are largely indistinguishable at the bottom of the pyramid. For instance,poor Brahmins have on an average 6.83 years of schooling, 17 percent have completed12 or more years of schooling and 77 percent are literate. Comparing these to Figure A1shows that the educational attainment of poor Brahmins is greater than the attainmentof all OBCs, SC-ST and UC-Muslims (poor and non-poor combined). Similarly, poorBrahmins are more likely to have access to a household toilet or hold a professional jobas compared to the sample of both poor and non poor SC-ST and UC-Muslims.
5 Discussion and Concluding Comments
Our analysis provides empirical demonstration of the reality that marks contemporaryIndia, viz., that Brahmins continue to be at the top across a range of socio-economicindicators. Whatever the churning in the caste system has been due to affirmative action
10
and the “Mandalisation” of politics that saw a sharp rise in political representation fromhitherto stigmatised caste groups, it has not upset the traditional position of Brahminsat the top of the caste hierarchy.
The thrust of all the Brahmin-specific welfare support schemes is financial assistancein a variety of ways to sections within the Brahmin community. Most schemes arelaudable in their objective, but there is absolutely no justification to excluding non-Brahmins from their purview. Making special and exclusive schemes for Brahmins goesagainst the promise of equality in the constitution, which aims to create a society wherethe accident of birth would not determine future life chances of any individual. Wehave noted that affirmative action and preferential policies targeted towards SC-STs aresubject to vicious opposition for many reasons, including the belief that these entrenchcaste consciousness, rather than weaken it. It is remarkable that none of the usualanti-reservation hysteria, decrying the death of merit or pandering to vote-banks or thepolitics of appeasement, has accompanied the announcement of these schemes. Even themainstream media is strangely silent; there have been only 2-3 articles on these highlysignificant policy measures that have been around for at least five years.
These measures should make us reflect on why group-based preferential schemes areneeded in the first place. Public policies should target groups qua groups when theirsocio-economic outcomes are adverse because of systemic or structural causes. In theUS, analysis points towards systemic racism preventing equalisation of Black-White out-comes.16 In India, the analogous institution that keeps caste hierarchy intact is Brah-manical Hinduism, which is the dominant version of Hinduism. Thus, not only areBrahmins not systematically persecuted or suppressed, but on the contrary, the versionof Hinduism that maintains their place at the top is the version that rules.
Groups at the bottom of the hierarchy are typically negatively stereotyped every-where in the world. Debates on Black-White disparities in the US hinge on whether thedisparities are caused by structural or systemic racism or by cultural or even geneticdeficiencies within Black communities (see the discussion in Small et al. 2010, as wellas other commentaries17). India has witnessed similar debates, where SCs (Dalits) aremocked as undue beneficiaries of reservations, ridiculed as “sarkari damaad” (sons-in-law of the state, i.e. living off largesses without doing any work), and suffer the stigmaof incompetence in addition to the ignominy of their “untouchable” status.
However, the stereotypes for Brahmins are the exact opposite, i.e. are extremelypositive. Indeed, the Telangana Brahmin Samkshema Parishad’s description of Brahminsmakes no bones about their belief and explicitly states that the community is superior,a description that can be read as a belief in innate or genetic superiority. Their homepage states “BRAHMIN stands for Broad and Brilliant in Thinking, Righteous and
16https://www.vox.com/2020/6/17/21284527/systemic-racism-black-americans-9-charts-explained17https://www.theatlantic.com/politics/archive/2014/04/the-source-of-black-poverty-isnt-black-
culture-its-american-culture/359937/
11
Religious in Livelihood, Adroit and Adventurous in Personality, Honesty and Humanityin Quality, Modesty and Morality in Character, Innovation and Industry in Performanceand Nobility and Novelty in Approach (sic)18. This description is dangerously close tothe White Supremacy argument, which consists of “beliefs and ideas purporting naturalsuperiority of the lighter-skinned, or “white,” human races over other racial groups”19.
Is poverty a problem among Brahmins? Indeed it is, but poverty does not afflictBrahmins exclusively. There are poor Brahmins, just as there are poor within everycommunity. Our argument is that all poor individuals should be able to avail of universalprogrammes that India has plenty of, such as rural employment guarantee or the publicdistribution system providing subsidised foodgrains. Are these universal programmessufficient in their reach and depth? The Covid-19 pandemic has brought to the fore theserious shortcomings of these programmes and proved that these are woefully inadequate.Therefore, it is clear that India needs to strengthen its welfare support system, whichwill benefit the poor among all communities, including Brahmins. There is absolutely nojustification for schemes exclusively targeted towards the Brahmins. As political scientistPratap Bhanu Mehta argues, these schemes are a “groteque perversion of constitutionalvalues20.”
The original contradiction, highlighted by Ambedkar, of the form of formal equalitybeing superimposed on a structure of substantive inequality remains persistent and seri-ous (Mosse, 2018; Deshpande and Ramachandran, 2019b), especially since the state hasmade no effort to sensitise society to caste-based discrimination by, for instance, inclu-sion of caste sensitivity training for bureaucrats or politicians or curriculum addressingcaste disparities and its origins at any level of education. The measures implementedby the three states are the exact opposite of what needs to be done to weaken thestranglehold of caste. These are possibly motivated by political, electoral or ideologicalconsiderations and unlike preferential schemes for SC-STs that provide a modicum ofsocial justice (albeit nowhere sufficient enough), these are quintessential appeasementpolicies that have no place in a modernising India that aspires to be a global superpoweror a “Vishwaguru” (teacher to the world).
18https://brahminparishad.telangana.gov.in/FirstPage.do19https://www.britannica.com/topic/white-supremacy20https://indianexpress.com/article/opinion/columns/brahmin-welfare-schemes-social-justice-7495186/
12

References
Azam, M., A. Chin, and N. Prakash (2013). The returns to english-language skills in India.Economic Development and Cultural Change 61 (2), 335–367.
Deshpande, A. (2013). Affirmative action in India. Oxford University Press.
Deshpande, A. and R. Ramachandran (2017). Dominant or backward? Political economy of thedemand for quotas by Jats, Patels and Marathas. Economic and Political Weekly 52 (19).
Deshpande, A. and R. Ramachandran (2019a). The 10% quota: Is caste still an indicator ofbackwardness? Economic and Political Weekly 30, 27–31.
Deshpande, A. and R. Ramachandran (2019b). Traditional hierarchies and affirmative action ina globalizing economy: Evidence from India. World Development 118, 63–78.
Mosse, D. (2018). Caste and development: Contemporary perspectives on a structure of discrim-ination and advantage. World Development 110, 422–436.
Sachar Committee (2007). High Level Committee report on social, economic, and educationalstatus of the Muslim community of India, November 2006. Akalank Publications.
Small, M. L., D. J. Harding, and M. Lamont (2010). Reconsidering culture and poverty. Annalsof the American Academy of Political and Social Sciences 629, 6–27.
Tendulkar, S. D. (2013). Expert group on methodology for estimation of poverty. PlanningCommission, Government of India.
13
9.490.41
0.870.22
0.630.640.64
7.260.23
0.740.09
0.330.530.64
5.840.17
0.660.05
0.270.450.57
4.700.13
0.530.04
0.210.400.44
4.480.06
0.550.02
0.180.28
0.59
Brahmins
UC (~Brahmin)- Hindus
OBCs
SC-ST
UC-Muslims
0.00 2.00 4.00 6.00 8.00 10.00
Years of Educ. Share >12 Years of Educ. Share Literate Share Fluent English
Share Some English Share 8-11 Ages Can Read Share 8-11 Ages Divide/Subtract
Panel A - Human Capital
Notes: The graph presents the average and the 95 percent confidence interval accounting for theage, gender and state of residence of the respondent for the indicators of (i) years of schooling;(ii) share greater than 12 years of schooling; (iii) share literate; (iv) share fluent in English;(v) share with some English ability; (vi) share of 8-11 year old’s that can read a paragraph orsentence; and (vii) share of 8-11 year old’s than can divide or subtract. The data is from theIHDS-2011-12.
Figure 1: Differences in Human Capital Across Groups - Andhra Pradesh and Karnatka
14
5.824.77
0.300.96
0.850.88
2.473.51
0.120.92
0.630.90
2.262.95
0.080.90
0.580.76
1.942.31
0.060.84
0.390.56
2.122.20
0.030.81
0.570.75
Brahmins
UC (~Brahmin)- Hindus
OBCs
SC-ST
UC-Muslims
0.00 2.00 4.00 6.00 8.00
Income PC in 10,000 Rs COPC in 10,000 Rs. Share Prof. Jobs
Share Non-Poor Share w/Toilet Share Own/Cultivate Land
Panel B - Material Standards
Notes: The graph presents the average and the 95 percent confidence interval accounting forthe age, gender and state of residence of the respondent for the indicators of (i) per-capitahousehold income measured in 10,000 of Rs.; (ii) per-capita consumption expenditure measuredin 10,000 of Rs.; (iii) share holding professional jobs; (iv) share classified as non-poor; (v) shareof households with access to some toilet facility; (vi) share of households who own or cultivateland. The data is from the IHDS-2011-12.
Figure 2: Differences in Material Standards of Living Across Groups - Andhra Pradeshand Karnatka
15
(1) (2) (3) (4) (5)UC-Hindus
Brahmins not Brahmins OBCs SC-ST UC-Muslims
Practice untouchability 0.55 0.32 0.35 0.19 0.14(0.50) (0.47) (0.48) (0.39) (0.34)
HH members experienced untouchability . . . 0.22 .(.) (.) (.) (0.42) (.)
Member Political Party 0.06 0.07 0.04 0.04 0.07(0.23) (0.25) (0.19) (0.19) (0.25)
Panchayat member/official in HH 0.06 0.06 0.04 0.05 0.03(0.23) (0.23) (0.20) (0.22) (0.18)
Panchayat member/official close to HH 0.25 0.22 0.28 0.26 0.13(0.44) (0.41) (0.45) (0.44) (0.34)
Acquaintance among relatives/caste/community withDoctors 0.34 0.34 0.21 0.15 0.29
(0.47) (0.47) (0.40) (0.36) (0.45)other health workers 0.25 0.26 0.16 0.14 0.23
(0.43) (0.44) (0.36) (0.35) (0.42)Teachers/Principal 0.50 0.46 0.31 0.27 0.39
(0.50) (0.50) (0.46) (0.44) (0.49)Officer 0.16 0.16 0.07 0.06 0.09
(0.37) (0.37) (0.26) (0.24) (0.28)other govt. employees 0.17 0.21 0.11 0.13 0.18
(0.38) (0.41) (0.32) (0.33) (0.38)Elected Politician 0.09 0.12 0.05 0.05 0.08
(0.29) (0.32) (0.23) (0.23) (0.28)
Acquaintance outside community/caste withDoctors 0.48 0.49 0.43 0.36 0.40
(0.50) (0.50) (0.49) (0.48) (0.49)Inspector 0.11 0.11 0.06 0.05 0.06
(0.31) (0.32) (0.23) (0.22) (0.24)Health workers 0.40 0.36 0.33 0.29 0.33
(0.49) (0.48) (0.47) (0.46) (0.47)Teachers 0.58 0.54 0.46 0.40 0.43
(0.49) (0.50) (0.50) (0.49) (0.49)Officer 0.20 0.23 0.13 0.11 0.13
(0.40) (0.42) (0.33) (0.32) (0.34)other govt. employees 0.23 0.28 0.18 0.17 0.21
(0.42) (0.45) (0.39) (0.38) (0.41)Elected Politician 0.19 0.23 0.13 0.11 0.14
(0.39) (0.42) (0.33) (0.31) (0.35)Inspector 0.12 0.17 0.09 0.07 0.10
(0.33) (0.37) (0.28) (0.26) (0.30)
Observations 10179 31264 83853 60478 11488
Notes: The table presents the mean and standard deviation from the IHDS-II on a range ofproxies measuring social and political connectedness of groups.
Table 1: Differences in political and social networks across groups - All India16

(1) (2) (3) (4) (5) (6) (7)
Panel A - Human Capital OutcomesDummy >=12 Dummy for
Yrs. of years of Literate English Some Can Can Divideeduc. educ. Literate Fluent English Read and Subt.
UC Hindus 0.50 -0.098* 0.035 -0.016 -0.24*** -0.58*** -0.24(not Brahmins) (1.49) (0.052) (0.20) (0.019) (0.083) (0.17) (0.17)
OBCs -0.66 -0.13*** -0.014 -0.015 -0.27*** -0.82*** -0.76***(0.91) (0.043) (0.10) (0.016) (0.072) (0.11) (0.11)
SC-ST -1.53 -0.14*** -0.13 -0.015 -0.26*** -0.88*** -0.92***(0.93) (0.039) (0.11) (0.019) (0.061) (0.10) (0.093)
UC-Muslims -1.87* -0.21*** -0.100 -0.030 -0.38*** -1.21*** -0.67(0.99) (0.039) (0.11) (0.019) (0.059) (0.16) (0.46)
Constant 5.16*** 0.20*** 0.60*** 0.028 0.39*** 1.20*** 1.11***(0.94) (0.041) (0.11) (0.017) (0.066) (0.095) (0.083)
Observations 2,349 2,353 2,348 2,349 2,349 168 167R-squared 0.306 0.079 0.276 0.069 0.153 0.188 0.250
Panel B - Material OutcomesHousehold Dummy for
Income Consum. Prof. HH Own/Cult.Per Capita Job Toilet Land
UC Hindus -0.82*** 0.37** -0.054 -0.64*** 1.04***(not Brahmins) (0.29) (0.14) (0.054) (0.20) (0.15)
OBCs -0.56 0.33** -0.053 -0.65*** 0.97***(0.40) (0.14) (0.054) (0.21) (0.14)
SC-ST -0.54 0.23* -0.039 -0.78*** 0.63***(0.34) (0.13) (0.062) (0.20) (0.16)
UC-Muslims -0.43 0.37** -0.074 -0.57** 0.73**(0.38) (0.15) (0.056) (0.25) (0.26)
Constant 1.72*** 0.65*** 0.079 0.98*** -0.15(0.34) (0.13) (0.054) (0.19) (0.15)
Observations 595 595 1,261 587 313R-squared 0.138 0.220 0.070 0.174 0.497
Age Dummies Yes Yes Yes Yes Yes Yes YesState Dummies Yes Yes Yes Yes Yes Yes YesGender Dummies Yes Yes Yes Yes Yes Yes Yes
*** p<0.01, ** p<0.05, * p<0.1
Notes: The table presents the results of regressing the seven proxies for human capital - (i) yearsof schooling; (ii) dummy for greater than 12 years of schooling; (iii) dummy for literate; (iv)dummy for fluent in English; (v) dummy for some English ability; (vi) dummy for 8-11 year oldcan read a paragraph or sentence; and (vii) dummy for 8-11 year old can divide or subtract -on a set of group dummies and dummies for age, gender and state of residence. The standarderrors are clustered at the primary sampling unit level.
Table 2: Differences in Human capital across groups - Sample of individuals classified aspoor in Andhra Pradesh and Karnataka
17

Online Appendix
Please turn to the next page.
18
9.230.36
0.890.12
0.470.73
0.638.21
0.310.82
0.110.40
0.650.59
5.890.16
0.670.05
0.250.53
0.464.68
0.110.56
0.030.19
0.420.34
4.920.13
0.600.05
0.210.45
0.37
Brahmins
UC (~Brahmin)- Hindus
OBCs
SC-ST
UC-Muslims
0.00 2.00 4.00 6.00 8.00 10.00
Years of Educ. Share >12 Years of Educ. Share Literate Share Fluent English
Share Some English Share 8-11 Ages Can Read Share 8-11 Ages Divide/Subtract
Panel A - Human Capital
Notes: The graph presents the average and the 95 percent confidence interval accounting for theage, gender and state of residence of the respondent for the indicators of (i) years of schooling;(ii) share greater than 12 years of schooling; (iii) share literate; (iv) share fluent in English;(v) share with some English ability; (vi) share of 8-11 year old’s that can read a paragraph orsentence; and (vii) share of 8-11 year old’s than can divide or subtract. The data is from theIHDS-2011-12.
Figure A1: Differences in Human Capital Across Groups - All India
19
3.533.08
0.380.67
0.89
3.383.03
0.250.64
0.92
2.222.25
0.100.51
0.84
1.841.82
0.060.35
0.72
1.991.95
0.090.65
0.79
Brahmins
UC (~Brahmin)- Hindus
OBCs
SC-ST
UC-Muslims
0.00 1.00 2.00 3.00 4.00
Income PC in 10,000 Rs COPC in 10,000 Rs. Share Prof. Jobs
Share w/Toilet Share Own/Cultivate Land
Panel B - Material Standards
Notes: The graph presents the average and the 95 percent confidence interval accounting forthe age, gender and state of residence of the respondent for the indicators of (i) per-capitahousehold income measured in 10,000 of Rs.; (ii) per-capita consumption expenditure measuredin 10,000 of Rs.; (iii) share holding professional jobs; (iv) share classified as non-poor; (v) shareof households with access to some toilet facility; (vi) share of households who own or cultivateland. The data is from the IHDS-2011-12.
Figure A2: Differences in Material Standards of Living Across Groups - All India
20
6.830.17
0.770.03
0.280.71
0.565.47
0.110.67
0.040.19
0.530.43
4.190.07
0.540.01
0.140.42
0.343.38
0.060.46
0.010.11
0.320.23
3.360.06
0.490.010.09
0.340.23
Brahmins
UC (~Brahmin)- Hindus
OBCs
SC-ST
UC-Muslims
0.00 2.00 4.00 6.00 8.00
Years of Educ. Share >12 Years of Educ. Share Literate Share Fluent English
Share Some English Share 8-11 Ages Can Read Share 8-11 Ages Divide/Subtract
Panel A - Human Capital
Notes: The table presents the results of regressing the seven proxies for human capital - (i) yearsof schooling; (ii) dummy for greater than 12 years of schooling; (iii) dummy for literate; (iv)dummy for fluent in English; (v) dummy for some English ability; (vi) dummy for 8-11 year oldcan read a paragraph or sentence; and (vii) dummy for 8-11 year old can divide or subtract -on a set of group dummies and dummies for age, gender and state of residence. The standarderrors are clustered at the primary sampling unit level.
Figure A3: Differences in Human Capital Across Groups - Individuals Classified as Poor- All India
21

1.720.65
0.080.98
-0.15
0.911.02
0.030.34
0.89
1.170.98
0.030.34
0.82
1.190.88
0.040.20
0.48
1.301.02
0.010.41
0.58
Brahmins
UC (~Brahmin)- Hindus
OBCs
SC-ST
UC-Muslims
-1.00 0.00 1.00 2.00 3.00
Income PC in 10,000 Rs COPC in 10,000 Rs. Share Prof. Jobs
Share w/Toilet Share Own/Cultivate Land
Panel B - Material Standards
Notes: The graph presents the average and the 95 percent confidence interval accounting for theage, gender and state of residence of the respondent for the indicators of (i) per-capita householdincome measured in 10,000 of Rs.; (ii) per-capita consumption expenditure measured in 10,000of Rs.; (iii) share holding professional jobs; (iv) share of households with access to some toiletfacility; (v) share of households who own or cultivate land. The data is from the IHDS-2011-12.
Figure A4: Differences in Material Standards of Living Across Groups - Individuals Clas-sified as Poor - All India
22