Embed Size (px)
Citation preview

Department of Health & Human Services


Regulatory impact statementSafe Drinking Water Regulations 2015
This Regulatory Impact Statement has been prepared in accordance with the requirements of the Subordinate Legislation Act 1994 and the Victorian Guide to Regulation.

AccessibilityTo receive this publication in an accessible format phone 1300 253 942, using the National RelayService 13 36 77 if required, or email: [email protected]
Authorised and published by the Victorian Government, 1 Treasury Place, Melbourne.
© State of Victoria, February, 2015
This work is licensed under a Creative Commons Attribution 3.0 licence (creativecommons.org/licenses/by/3.0/au). It is a condition of this licence that you credit the State of Victoria as
author. ISBN 978-0-9924829-9-2
Available at www.health.vic.gov.au/water
(1411030)

III
Executive summaryIntroduction
Access to reliable supplies of good quality drinking water is a basic human right and fundamental to community wellbeing.
In Victoria the viability of industry, particularly the manufacturing, food and tourism sectors, is underpinned by good-quality water supplies in both metropolitan and regional areas.
The Safe Drinking Water Act 2003 and the Safe Drinking Water Regulations 2005 provide a “catchment to tap” risk management framework to ensure the supply of safe drinking water across Victoria. The Act requires the state’s 25 water suppliers and storage managers to
• develop and implement risk management plans• report water incidents to the department• provide customers with water quality information through drinking water quality annual reports.The current Safe Drinking Water Regulations 2005 prescribe:
• what is needed in a risk management plan• approval criteria for risk management plan auditors• requirements for where to undertake water quality testing• water quality standards and the frequency of testing• requirement to report water testing results to the department• what is needed to be an accredited water analyst• the information that needs to be included in annual reportsThis framework has served Victoria very well. Water businesses and the department work collaboratively to meet the shared goal of ensuring safe drinking water supplies. Victoria has avoided waterborne outbreaks of disease and illness associated with public water supplies as incidents have been contained and controlled.
A sustained level of improvement has been achieved by water businesses over the last ten years. The rate of compliance by water businesses of their risk management plans under the framework has risen from 60 per cent to 92 per cent. Compliance with drinking waterstandards has also substantively improved and incident notifications to the department have declined. Smaller regional water supplies have also achieved similar compliance improvement.
The need for regulation
The need to regulate Victoria’s reticulated drinking water supply is a requirement that few people would argue with. The benefits are clear: Victorians can enjoy safe drinking water thatis free from hazards, therefore avoiding potential health risks. These benefits extend to industry and the environment.
The argument for this RIS must, however, focus on the implications of not having a safe drinking water regulatory framework; in other words: What would happen if we didn’t regulate the drinking water supply? The regulations perform a subsidiary role to the Act regarding safe drinking water. The problems addressed by the regulations are therefore of a residual, rather than substantial, nature.

The main residual problem to be addressed by the proposed regulations is the risk to public health from unsafe drinking water. A related residual problem is a lack of consumer confidence in reticulated drinking water supplies resulting in a consumer shift to alternatives.
Regulatory burden and equity across water consumers are other policy factors that need to be taken into account when addressing the problems of risks to public health and retention of community confidence in safe drinking water supplies.
Proposed new regulations – improving risk management
The current Safe Drinking Water Regulations, made in 2005, will expire, or “sunset” in July2015. The Department of Health & Human Services has therefore developed new regulations in consultation with water agencies and other stakeholders.
This opportunity has been taken to review the most recent and best available scientific evidenceon drinking water risk management and technology and to identify reductions in regulatory burden that can be achieved without compromising the safety of Victoria’s drinking water.
With this in mind the proposed regulations vary from the existing regulations by:
• Removal of the requirement for the department to approve water sampling points within watersampling localities.
• Requirement for a water sampling program in risk management plans.• Strengthened risk management plans by including a water sampling program, Critical Control
Points and critical limits, actions to improve employee training and the steps to quantify risk.
• Reduction of the drinking water standards to three parameters that reflect microbial, chemicaland physical water quality and align the microbial and physical standard more closely with the current Australian Drinking Water Guidelines. (There has been significant input from stakeholders into the development of the proposed standards during consultation).
• Requirement for samples to be analysed by National Association of Testing Authorities (NATA) laboratories. Remove the requirement for individual water analysts to be approved by the Secretary to the department.
• Requirement for detailed reports where standards have not been met.Remove the requirement for providing all monthly water quality data to the department.
The requirements to be retained from the existing regulations are for water sampling localities;risk management plan audit and auditor criteria and annual report requirements.
Regulatory Impact
In order to assess the cost benefit of the proposed regulations this Regulatory Impact Statement compares the costs and benefits of the proposed regulations (option B) against three other options:
• Option A: remake the existing regulations• Option B: proposed regulations that strengthen risk management plans and replace
9 water quality standards with 3 adjusted standards• Option C: a variation of Option B, which would strengthen risk management plans with
3 water quality standards that retain the existing standards for Escherichia coli and turbidity
• Option D: a variation of Option B, which would maintain existing risk management planarrangements and replace 9 water quality standards with 3 adjusted standards.
IV

V
The criteria used to evaluate the feasible options for regulations are:
• protection of public health• retention of public confidence• promotion of equity for consumers.These options were defined through consultation that identified some preference to retain the requirements in the existing regulations for risk management plans and water quality standards for Escherichia coli and turbidity.
Costs
All costs were estimated on an incremental basis against the base case and over a period of 10 years. Regulations assessed as having zero or a negligible incremental cost impact relative to the base case were not substantively analysed.
The cost analysis has shown that the likely incremental costs under Options B, C and Dare identical, with the greatest costs incurred under Option A as shown in the following table.
Summary of incremental 10-year costs under Options A, B, C and D, 2015–2024 (2014 dollars)
Existing Regulation Stakeholder Option A Option B Option C Option D
4 Government $77,123 $77,123 $77,123 $77,123
5 Government $87,620 $0 $0 $0
14 Government $87,620 $0 $0 $0
15 Water agencies $2,251,313 $2,251,313 $2,251,313 $2,251,313
15 Government $32,857 $32,857 $32,857 $32,857
10/Schedule 2 Water agencies $1,429,124 $540,476 $540,476 $540,476
10-year total PV cost $3,965,657 $2,901,770 $2,901,770 $2,901,770
Benefits
All options promote equal access to safe and good-quality water to consumers in rural, regional and metropolitan areas.
The critical differences explored in this document are therefore in relation to reduction of risks to public health and the related issue of consumer confidence.
The proposed regulations (option B) is the preferred option because it incorporates both enhanced risk management planning and updated water quality standards. The risk management plan details provide rigour to the risk assessment and management process and therefore reduce the likelihood of an event and the duration of it should it occur. The risk management plan details are the strongest method to achieve the desired public health outcome. The water quality standards provide a benchmark across the state as well as a level of consumer confidence that safe drinking wateris produced.
Opportunities to reduce regulatory burden without compromising the safety of Victoria’s drinking water supplies have also been incorporated.
ContentsExecutive summary III
1 Introduction 1
1.1 Background 1
1.2 Purpose 1
1.3 Stakeholder consultation 2
1.3.1 Proposal development 2
1.3.2 Discussion paper 3
1.3.3 RIS consultation 4
1.3.4 Other consultation 5
2 Achievements, issues and policy objectives 6
2.1 The Victorian water industry and drinking water legislation 6
2.1.1 Victoria’s water industry legislation 8
2.1.2 The safe drinking water framework 8
2.1.3 The Safe Drinking Water Act 9
2.1.4 Other relevant legislation 10
2.2 Recent outcomes and issues 11
2.3 The base case 14
2.4 The residual problems 15
2.4.1 Risks to public health from unsafe drinking water 17
2.4.2 Retention of community confidence in drinking water supplies 19
2.4.3 Sources of market failure 21
2.5 Policy objective 22
3 Identification of options 23
3.1 Alternate options 23
3.2 Options 24
4 Evaluation of costs and benefits 29
4.1 Cost-benefit methodology 29
4.2 Cost estimate assumptions 30
4.3 Options analysis 33
4.3.1 Net cost of compliance 33
4.3.2 Analysis of benefits 37

5 Preferred option 41
5.1 Identification of preferred option 41
5.2 Break-even analysis of preferred option 42
5.3 Comparison of Option B (the proposed regulations) and Option A (the existing regulations) 43
5.4 Competition assessment 44
5.5 Impact on small business 45
5.6 Comparison with other jurisdictions 47
6 Implementation and enforcement issues 49
7 Evaluation strategy 50
8 Conclusions 51
Appendix 1: Summary of water industry business data 52
Appendix 2: Estimation of incremental costs 56
Appendix 3: Estimation of quantifiable incremental benefits 65
Appendix 4: Summary of July 2014 online questions and survey results 69
Glossary of terms and abbreviations 78
References 80
Further reading 82

1
1 Introduction
1.1 BackgroundAccess to reliable supplies of good-quality drinking water is a basic human right and a fundamental requirement for community health and wellbeing. Communities expect their drinking water supplies to be affordable and that there are systems in place to ensure their health is protected (Department of Health 2014a).
In Victoria the viability of industry, particularly the manufacturing, food and tourism sectors, is underpinned by good-quality water supplies in both metropolitan and regional areas.
The Safe Drinking Water Act 2003 provides a risk management framework for the 25 water businesses (water suppliers and storage managers) that supply safe drinking water in Victoria.
Key to this framework are the Safe Drinking Water Regulations 2005, which support the Act by setting out drinking water quality standards, the requirements and frequency of collecting samplesfor analysis, the matters that are to be addressed in risk management plans and aspects of auditing.
Regulations in Victoria remain current for 10 years; therefore these regulations will sunset in July2015. The Victorian Department of Health & Human Services intends to replace the existing Regulations in 2015. In considering the future regulations the opportunity has been taken to review the most recent and best available scientific evidence on drinking water risk management and technology. Opportunities to reduce regulatory burden without compromising the safety of Victoria’s drinking water supplies have also been considered. The department has engaged with water agencies and other interested parties to develop a proposal for new regulations that support the Act in providing safe drinking water in the future.
1.2 PurposeThis regulatory impact statement (RIS) evaluates the proposed Safe Drinking Water Regulations2015. In accordance with the Subordinate Legislation Act 1994, the proposed regulations do not strictly trigger the requirement to do a RIS based on the expected impact of the regulations. However, the department has chosen to use the RIS framework to test decision making and analysis with the public. The proposed regulations are to be made under s. 56 of the Safe Drinking Water Act.
A RIS is a process for evaluating the feasible options available, including the possibility of regulation, to produce the greatest net benefit to society while simultaneously meeting the needs of government. To comply with the Victorian guide to regulation (Department of Treasury and Finance 2014) and focus on proportionate analysis, this RIS includes:
• the nature and extent of the problems to be addressed by the proposed regulations, including
relevant research and investigations
• the policy objectives of proposed solutions to the problems• key stakeholder consultation to date• the case for government intervention• the objectives, nature and effects of the proposed regulations• alternative options to the proposed regulations• a cost-benefit evaluation of the proposed regulations and alternative policy options• selection of a preferred option including its nature, effect, impacts on small

2
business,implementation and compliance issues

3
• a broad comparison of the proposed regulations with other jurisdictions• an assessment of the impact of the preferred option in terms of national competition policy• an evaluation strategy.In the case of sunsetting regulations, the RIS analysis is required to evaluate the incremental costs and benefits of the regulations. This requires consideration of which parts are primarily driven by the Act and other legislation or industry standards in order to apportion costs appropriately against the regulations.
The publication of this RIS is a major step in the consultation process, allowing the general community and stakeholders to comment on both the draft regulations and this document (as stipulated in the Victorian guide to regulation).
1.3 Stakeholder consultationThe preparation of a RIS provides for an informed process of consultation regarding the proposed regulations, alternative options and the costs and benefits associated with each option. Extensive consultation has taken place with government agencies, water businesses and other key stakeholders in developing the proposed regulations and this RIS.This consultation is summarised below.
1.3.1 Proposal developmentIn 2012 a stakeholder reference group was established and oversaw the development of a regulatory proposal outlined in the recently issued discussion paper The future of Victoria’s Safe Drinking Water Regulations (Department of Health 2014a). The group was chaired by a senior public health practitioner with representation from VicWater, the Department of Environment and Primary Industries (DEPI), the Essential Services Commission (ESC) and the Consumers Utilities Advocacy Centre (CUAC).
The stakeholder reference group was supported by three working groups with membership from a wide range of water-related agencies, which are listed in Appendix 1 of the background report to the discussion paper (Department of Health 2014b).
• The Existing Regulations Working Group reviewed the current regulations in terms of consistency with developing policy, good practice and effectiveness and made recommendations for regulations that could address regulatory gaps.
• The Operational Performance Working Group considered recent changes to the Australian drinking water guidelines (ADWG) that shift the emphasis of monitoring from end point testing at the consumer tap to operational monitoring of water treatment barriers identified as criticalcontrol points (CCP). This group also assisted with a survey to obtain information from all water businesses on current operational performance monitoring practices at water treatment plants (Department of Health 2013).
• The Health-based Targets Working Group considered international trends towardshealth-based targets for microbial safety, as they are likely to be adopted into the next version of the ADWG. This group assessed the implications of this change for Victoria’s drinking water regulatory framework and considered the practicality of health-based targets in Victoria.

4
The working groups steered the proposal of an enhanced risk management approach that considers the areas that require ongoing regulation and identified elements to support recent and future ADWG changes.
1.3.2 Discussion paperIn May 2014 the Department of Health issued a discussion paper The future of Victoria’s Safe Drinking Water Regulations and a technical background paper. Written feedback was sought until the end of June 2014. The discussion paper was also sent to the ministers who had responsibility for water businesses and the alpine resorts.
The discussion paper proposed an approach for future regulations that retains elements of the existing regulations. These elements, along with the changes proposed, are summarised in Table 1.
Table 1: Discussion paper proposal
Elements retained from existing regulations
Changes to water sampling
Changes to risk management plans
Changes to drinking water quality standards
Changes to sample analysis
Changes to results of analysis
Changes to annual reports
Water sampling localities;Risk management plan audit and auditor criteria
Remove the requirement for the department to approve water sampling points within water sampling localities. Require a water sampling program in risk management plans.
Strengthen risk management plans by including a water sampling program, CCPs and critical limits, actions to improve employee training and the steps to quantify risk.
Reduce to three parameters that reflect microbial, chemical and physical water quality. Change the microbial and physical standard to align more closely with the ADWG.
Require samples to be analysed by National Association of Testing Authorities (NATA) laboratories. Remove the requirement for individual water analysts to be approved by the Secretary to the department.
Require detailed reports where standards have not been met. Remove the requirement for providing all monthly water quality data to the department.
Enhance current requirements to include a review of the performance of CCPs and employee training.
5
During the consultation period on the discussion paper, the department also conducted four regional workshops with stakeholder agencies at Traralgon, Melbourne, Shepparton and Ballarat. These sessions were an opportunity to discuss the intention of the proposal and to identify problematic areas.
Written feedback in response to this discussion paper was received from 16 water suppliers, three water storage managers, three alpine resorts and three stakeholder groups.
All feedback indicated support for the thrust of the proposed regulations but highlighted areas where further information was required for water businesses to understand how the regulatory framework would function and be enforced.
Additionally, some businesses preferred to retain the existing water quality standards for Escherichia coli (E. coli) and turbidity, and requirements for risk management plans and annual reports.
The written submissions were very supportive of the opportunities to reduce administration such as changing the reporting requirements and removing analyst approvals.
1.3.3 RIS consultationThe RIS consultation initially focused on developing the options for consideration and collecting incremental cost-benefit data. The four regional workshops, held during the discussion paper consultation, introduced the RIS process and an online survey for water suppliers and storage managers.
The online survey determined which parts of the existing regulations are now regarded as ‘business as usual’ – that is, would be done anyway by the businesses without regulations – and collected data indicating the nature and extent of costs to meet regulations. All water businesses and mostof the alpine resorts responded to the survey.
The survey and workshops confirmed the contentious areas (those that generated the most variable comments and costs) of the proposed approach as the risk quantification component of risk management plans and changes to drinking water quality standards. These are explored furtherin section 4: Evaluation of costs and benefits.
The key concern in relation to a change in the drinking water quality standard was a potential impact on customer confidence from erroneous results for E. coli. The department has addressed this through a revision of the quality standards. The survey also identified that there could be inconsistent approaches to a sampling program in the absence of standards. This would be addressed through the audit process.
The issues of other water quality parameters, testing locations and testing frequencies did not emerge as contentious.
6
1.3.4 Other consultation
Prior to finalising the RIS the department further consulted with government agencies, water businesses and other key stakeholders to discuss their submissions to the discussion paper. Meetings and conversations were held with all water suppliers and storage managers, government agencies (including the Department of Environment, Land, Water and Planning) and the industry peak body VicWater. This was an opportunity to consider how the regulatory framework would function and be enforced and to discuss alterations to the approach outlined in the discussion paper due to the feedback.
The key revisions to the proposal were:
• Turbidity standardThis has been changed from one sample per week less than 5NTU to a standard that one sample per week must be collected and the 95th percentile of the 12-month dataset must be less than or equal to 5NTU. This change is proposed to recognise turbidity as an aesthetic indicator and for the standard applied to encourage a better approach for monitoring trends in variability.
• E. coli standard
This has been changed from one sample per week with no detection of E. coli to a standard designed to encourage a public health outcome of zero contamination in drinking water supplies, as is the case with other public safety frameworks such as those applicable to food safety. The proposed regulations are framed so that when testing of a water sample indicates the presence of E. coli, the water business may take steps to verify the initial test results in order to establish whether the drinking water supplied by the business does not comply, or is not likely to comply, with the standard.
• Annual reportA review of all CCPs and training activities will no longer be required in annual reports. The feedback indicated this was duplicating information that will be incorporated in risk management plans and the information would be available during the risk management plan audit.
7
2 Achievements, issues and policy objectives
The Safe Drinking Water Act provides a risk management framework for Victorian water suppliersand storage managers. The Act and other legislation and industry standards (as described in section2.1) perform the major role in ensuring Victoria’s drinking water is safe.
The provisions of the Act indicate an intention by parliament that certain matters of detail in the overall legislative scheme would be prescribed by regulation rather than by the Act, in accordance with the guidelines issued under the Subordinate Legislation Act. The regulations perform a subsidiary role to the Act regarding safe drinking water. The problems addressedby the regulations are therefore of a residual rather than substantial nature.
The nature and extent of these residual problems are investigated by exploring the potential Victorian water industry situation without regulations (the base case) and the likely consequences of this situation.
This part of the RIS describes the:
• water industry and relevant legislation• base case of no regulations• residual problems without regulations• policy objective• likely risks to safe drinking water without regulations.
2.1 The Victorian water industry and drinking water legislationThe Victorian water industry consists of 25 water businesses shown in Figure 1. Water businesses include water storage managers that act as water harvesters and wholesalers, and water suppliers that retail water to 95% of Victoria. Most water businesses produce drinking water through primary water treatment but not all do – that is, there are some water storage managers and water suppliers that do not provide primary treatment.
Water business customers include residential, commercial and industrial premises, depending on land uses in the areas served. The availability of good-quality drinking water is important for all Victorian communities but particularly for business where the quality of water has direct benefits.

8
Figure 1: Victorian water business boundaries
1
54
2
3
6
6
Water storage managersGoulburn-Murray Water
GWMWater* Melbourne Water Southern Rural Water
Water suppliersBarwon Water
Central Highlands Water
City West Water
Coliban Water
East Gippsland Water
Gippsland Water
Goulburn Valley Water
GWMWater
Lower Murray Water
North East Water
South East Water
South Gippsland Water
Wannon Water
Western Water
Westernport Water
Yarra Valley Water
1 Falls Creek Alpine Resort Management Board
2 Lake Mountain Alpine Resort Management Board (non-drinking water only)
3 Mount Baw Baw Alpine Resort Management Board
4 Mount Bullerand Mount Stirling Alpine Resort Management Board
5 Mount Hotham Alpine Resort Management Board
6 Parks Victoria
*GWM is both a water supplier and water storage manager

9
The following background information on the relevant provisions of the Act and other Victorian water legislation may help explain the residual problems within their legislative, economic andsocial context.
2.1.1 Victoria’s water industry legislationVictoria’s water businesses are established and regulated under various pieces of water legislation in addition to the Safe Drinking Water Act.
Water corporations are established under Part 6 of the Water Act 1989, which is administered by the Minister for Water. The Minister for Water has issued a statement of obligations to water corporations under s. 4I of the Water Industry Act 1994. The statement specifies water corporations’ obligationsin relation to performing their functions and exercising their powers, including risk management. Each corporation has its own customer base and, although they cannot compete directly for each other’s customers, they compete by comparison in the service they each offer their customers.
The alpine resort management boards are established under the Alpine Resorts (Management)Act 1997. Parks Victoria is established under the Parks Victoria Act 1998. These businesses supply water to residents and/or visitors to alpine resorts and parks, although this activity is not their core business. Unlike the other water businesses, they can compete against each other for customers because visitors can choose to go to different resorts or parks.
Certain aspects of the water industry are regulated by the ESC under the Essential Services Commission Act 2001. The ESC’s role focuses on price regulation, setting standards and conditions of service and supply, licensing and market conduct, rather than environmental, safety or social regulation.
Drinking water is regulated by the Department of Health & Human Services through the administration of the safe drinking water framework, which is aimed at protecting public health. The department is also required to promote industry and public awareness and understanding of drinking water quality issues and therefore provides guidance to water agencies regarding various matters dealt with in the Act and Regulations, including risk management plan audits and the content of annual reports.
The Environment Protection Authority (EPA) Victoria and the Department of Environment, Land, Water and Planning also have roles in planning, managing and regulating water agencies and water resources in Victoria.
2.1.2 The safe drinking water frameworkVictoria’s safe drinking water framework comprises three elements:
• the Act as outlined below• the Regulations, which are the subject of this RIS• guidance provided to the industry by the department.

10
2.1.3 The Safe Drinking Water ActPrior to 2004, drinking water in Victoria was regulated through the former Health Act 1958,1
the former Health (Quality of Drinking Water) Regulations 2002 and a number of subordinate contractual instruments and licences. This meant that water businesses in Victoria had no regulatory duty to comply with specific water quality standards, although standards were set via contractual and other arrangements.
The Safe Drinking Water Act came into effect on 1 July 2004 as the primary legislation for regulating drinking water and was the first in Australia to deal specifically with regulating drinking water supplies. The Act adopts a risk management approach from catchment-to-tap for drinking water quality management. This is consistent with the management framework that underpins the ADWG, noting that much of the content of the ADWG is drawn from guidance developed by the World Health Organization.
The Act applies to businesses involved in supplying drinking water to Victoria, which include:
• water storage managers: Melbourne Water and three regional water storage managers• water suppliers: three Melbourne metropolitan water retailers, the 15 regional urban water
suppliers and rural water authorities, drinking water supplies provided at alpine resorts and drinking water supplies managed by Parks Victoria.
The Act does not apply to private water supplies, the supply of packaged water or water for irrigation (Minister for Health 2003).
The purpose of the Act is to legislate for the supply of safe drinking water. In this context, the word ‘safe’ is interpreted to mean safe in terms of the health and wellbeing of consumers when consuming drinking water. The Act establishes the legislative framework and contains key obligations relating to risk management and public disclosure.
In outline, the Act:
(a) requires water suppliers and water storage managers to prepare and implement plans to manage risks in relation to drinking water and some types of non-potable water. This means that water suppliers and water storage managers must identify and assess the risks to the quality of the water and the risks that may be posed by the quality of the water. The risk management plan must set out the steps to be taken to manage those risks. The Act also states that the regulations may state the risks and other matters to be addressed in a risk management plan
(b) provides for the auditing of those plans by approved and independent auditors. The Act refers to the regulations for details of documents to be audited, the audit certificate and approval criteria of auditors
(c) requires water suppliers to ensure that the drinking water they supply meets quality standards specified by the regulations
(d) requires the provision of annual reports and that water suppliers disclose to the public information concerning the quality of drinking water. The details of annual reports are to be gazetted or provided in regulations
1 This Act was replaced on 1 January 2010 by the Public Health and Wellbeing Act 2008.

11
(e) provides for the variation, after community consultation, of water quality standards that relate only to aesthetic factors
(f) requires the reporting of known or suspected contamination of drinking water and compliance with water quality standards to the Secretary to the Department of Health & Human Services. The regulations provide further reporting details
(g) empowers the Secretary to enforce the Act.
Under the Act the Minister for Health is responsible for declarations, approval of variations, exemptions and conditions imposed as well as matters related to the administration levy.The Secretary to the department also has responsibility within the Act to protect public health, monitor and enforce compliance, report on performance and promote industry and public awareness of water quality issues. The regulations provide detail to the Act and assist with monitoring of performance and compliance.
2.1.4 Other relevant legislationSections 9 and 9A of Victoria’s Food Act 1984 applies to water suppliers or water storage managers and their employees when supplying water for human consumption through a reticulated water system. These provisions make it an offence for a person to sell food (including drinking water)that the person knows is unsafe, or the person should know is unsafe.
The Health (Fluoridation) Act 1973 regulates fluoride in drinking water supplies in Victoria. The Code of practice for fluoridation of drinking water supplies (Department of Human Services 2009) supports this and specifies the requirements for safe design and effective operation of a fluoridation plant.In undertaking these activities a water business must also make sure it integrates the managementof its fluoridation scheme within the requirements of the Safe Drinking Water Act.Victorian water businesses are subject to consumer law under the Competition and Consumer Act 2010. As of 1 January 2011, the Australian Consumer Law (Victoria) provides consumers with statutory consumer guarantees enabling a consumer to seek remedies against a supplieror manufacturer with respect to defective goods or services. Examples of consumer guarantees include:
• fitness for particular purpose• goods to be of acceptable quality• services provided with due care and skill.The test from 1 January 2011 is whether goods are of ‘acceptable quality’ (before 1 January 2011‘merchantable quality’). The Australian Consumer Law defines acceptable quality including:
• the reasonable, fully informed, consumer test• whether it is fit for its usual purpose• whether its appearance and finish are acceptable.

Rep
ortin
g pe
riod
12
2.2 Recent outcomes and issuesAnalysis of the water quality data collected since 2005 highlights achievements as well as those features that require ongoing regulation, enabling different options to be considered in this RIS.
The regulatory water quality standards applied since 2005 are used to indicate water has been produced to an appropriate standard. These standards have allowed regional areas to be benchmarked against the same standards as the Melbourne metropolitan area. This meets an expectation that all Victorians should have access to good-quality drinking water. The standards applied represent microbial, chemical and physical parameters. There is one microbiological standard (E. coli), six chemical standards derived from the disinfection method (bromate, formaldehyde, chloroacetic acid, dichloroacetic acid, trichloroacetic acid and trihalomethane), one chemical standard from the coagulation process (aluminium) and one physical standard (turbidity).
Regulations have achieved a sustainable level of improvement in smaller regional water supplies where their compliance has increased since 2005–06 by approximately 82%. Compliance with the drinking water quality standards overall has increased over time, from 82.5% in 2007–08 to 97%in 2013–14. The downward trend in the rate of noncompliance against the scheduled drinking water standards seen across the state is shown in Figure 2. This achievement is due primarily tothe chemical standards.
Figure 2: Water sampling locality compliance with the drinking water quality standards
2005–06 76
2006–07 78
2007–08 80
2008–09 61
2009–10 43
2010–11 60
2011–12 33
2012–13 18
2013–14 14
0 10 20 30 40 50 60 70 80 90 100
Number of drinking water localities
Noncompliant localities (metro) Noncompliant localities (small) Noncompliant localities (regional)
Note: Each water supplier covers a discrete geographic area that is divided into a number of ‘water sampling localities’. A water sampling locality is a defined area of similar water quality.

13
The department has reviewed the water quality data submitted by water suppliers. Five chemical standards have achieved a consistent high level of compliance and are related to disinfection processes (bromate, formaldehyde, chloroacetic acid, dichloroacetic acid and trichloroaceticacid). When a breach of these standards has occurred the breach has been low and well controlled and would not be considered a risk to human health. This indicates that businesses have good practices in place and continuing regulation of these standards may no longer be required.
Aluminium, a chemical standard, is associated with the coagulation treatment process. Treatments related to aluminium exceedances have also improved over time and elevated levels have been mainly of aesthetic concern. Where treatment using aluminium is applied, risk management plans are effective in analysing the risk of this event occurring and developing measures to monitor and manage.
Furthermore over the life of the regulations the Secretary has approved the variation to the sampling frequency of parameters in the regulations on 13 occasions for six water businesses.Of these variations, seven related to reducing the frequency of sampling for chemical parameters, with approval of the variation based on a risk assessment by the water business.
Trihalomethanes (THMs), another chemical standard, is related to disinfection and catchment condition and is the only chemical standard to be retained. From the department’s record of s. 18 notifications THMs continue to be an issue for water businesses and therefore requires ongoing oversight.
Turbidity is primarily an aesthetic standard within the distribution system. Analysis of the turbidity data indicated that the statistical construct being applied in the current regulations did not provide useful information on the performance of water sampling localities, with very few failures of this standard and only in extreme circumstances. This suggests a more appropriate standard is required to indicate the variability of turbidity at the customer tap.
E. coli, a microbiological standard, is critical to monitor the integrity of the distribution network and to ensure that the microbial quality of water is maintained through to the customer tap. A review of the requests to vary the frequency of sampling indicates a high proportion of requests to increase the frequency of sampling for E. coli. The ADWG provides recommendations to the minimum sampling frequency for E. coli based on population in the water sampling locality, which in many instances is greater than the frequency of sampling required by the regulations. The department recognises the importance of monitoring at an appropriate level to properly represent the water sampling locality. However, the number of samples collected currently impacts on what compliance with the regulatory standard means as the 98% of samples metric allows for a number of failed samples prior to afailure of the standard. The metric is being reviewed to deliver the outcome of zero contamination regardless of the number of samples collected.
From a water safety perspective, there has been a general downward trend in notifications related to known or suspected contamination of drinking water under s. 22 of the Safe Drinking Water Act shown in Figure 3. This notification is made where there is a potential risk to human health. Examples of this notification type include treatment failures, where chemicals are detected above health guideline values, and where pathogens are detected post treatment. A large proportion of these notifications are related to E. coli detections as it is an indicator of faecal contamination.
Rep
ortin
g pe
riod
14
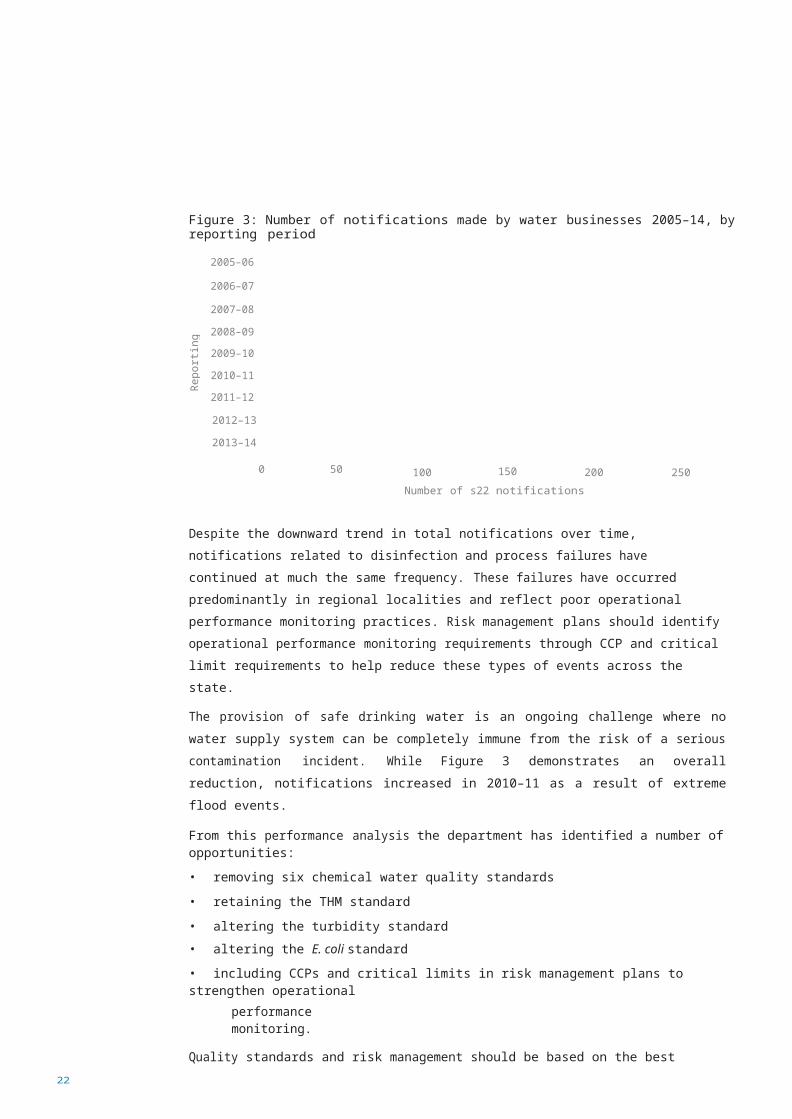
Figure 3: Number of notifications made by water businesses 2005–14, by reporting period
2005–06 193
2006–07 195
2007–08
2008–09 172
195
2009–10 156
2010–11 200
2011–12 127
2012–13 69
2013–14 69
0 50 100 150 200 250
Number of s22 notifications
Despite the downward trend in total notifications over time, notifications related to disinfection and process failures have continued at much the same frequency. These failures have occurred predominantly in regional localities and reflect poor operational performance monitoring practices. Risk management plans should identify operational performance monitoring requirements through CCP and critical limit requirements to help reduce these types of events across the state.
The provision of safe drinking water is an ongoing challenge where no water supply system can be completely immune from the risk of a serious contamination incident. While Figure 3 demonstrates an overall reduction, notifications increased in 2010–11 as a result of extreme flood events.
From this performance analysis the department has identified a number of opportunities:
• removing six chemical water quality standards• retaining the THM standard• altering the turbidity standard• altering the E. coli standard
• including CCPs and critical limits in risk management plans to strengthen operational
performance monitoring.
Quality standards and risk management should be based on the best available scientific evidence, which for drinking water are contained in the ADWG. The ADWG was revised in 2011 and further revisions are forecast in relation to health-based targets for microbial risk in order to determinethe effectiveness of treatment barriers. While the water sector is working on adopting these new concepts, health-based targets will not be specified by regulations. Instead, implementing measures to strengthen risk management plans can support their future adoption.

15
2.3 The base caseIn the case of sunsetting regulations, the term ‘base case’ means the situation that would applyif existing regulations were allowed to expire without replacement – in other words, no regulations. (The base case is used in the cost-benefit analysis as the benchmark for measuring incremental costs and benefits.) The various components of the base case for the Safe Drinking Water Regulations include:
1. Primary legislation such as the Safe Drinking Water Act, the Food Act and Australian Consumer Law (Victoria), which oblige water businesses to supply safe drinking water. The Health (Fluoridation) Act informs water businesses to add fluoride into drinking water supplies safely and effectively.
2. Statements of obligations issued under s. 4I of the Water Industry Act by the Minister for Water.Among other things, the current statement requires water corporations to develop and implement plans to manage risks to water quality.2
3. Consumer expectations for safe drinking water. These expectations are facilitated to some extent by publishing annual reports on drinking water quality, as required by the Act.
4. Training and competence in the water industry – that is, water treatment operator training plus professional standards and the incentive for water engineers and other industry professionals to be seen as competent.
5. The ADWG are based on the best available scientific information and a comprehensive risk management approach. They are therefore regarded as good practice by water engineers and other industry professionals.
6. Current water industry practices, as clarified by the online survey and the customer charterof each water business. These charters typically commit the water business to supplying safe and pleasant drinking water.
The safe drinking water regulations underpin the Safe Drinking Water Act by providing details required in risk management plans, specification of the risks to be addressed, the documents to be audited, the audit certificate to be issued, auditor approval criteria, the drinking water quality standards and annual report requirements. Under the base case, the majority of these functionscould not be implemented by alternate means and the incentive to meet voluntary standards would be based on individual business values. The likely outcomes in the absence of safe drinking water regulations are described in 2.4: The residual problems.
2 Parts 5-1 and 5-2 of the Statement of obligations dated 16/9/12.

16
2.4 The residual problemsThis part of the RIS describes the residual problems that would be likely to remain under the base case, in the absence of regulations or other effective alternatives.
Primary legislation would oblige water businesses to supply safe drinking water that is fit for purpose and inherently of acceptable quality. Water businesses would still be required to prepare risk management plans that identify, assess and manage risks, have those risk management plans audited and produce an annual report. The department would still be required to oversee the operation and performance of drinking water networks through auditing risk management plans and reviewing water business annual reports. The variable approaches between businesses in an unregulated environment are unlikely to provide a high level of transparency or confidence across the state.
The nature of the safe drinking water framework is that water businesses are responsible for developing risk management plans and implementing effective controls for the risks they have identified. Effective risk management requires steering a sensible course between the extremes of failing to act when action is required and taking action when none is necessary. Lack of action can seriously compromise public health, whereas excessive caution can have significant social and economic consequences.
The regulations largely provide additional detail to the Act and what businesses would or wouldn’t do without the regulations is related to business/financial/behavioural decisions about how much guidance they would adhere to. While the industry has the best of intentions this may be outweighed by short-term budget considerations. It would not be expected that industry would immediately change their behaviours, but there may be a gradual change and an increased variability in approaches across the state. It would be reasonable to conclude that the sustained improvementin compliance with standards and s. 22 notifications may not continue and inconsistent approaches to risk management may occur in the absence of regulations. This complacency can be highlighted in audits of risk management plans where failures by an individual business have occurred in non-consecutive audits. The base case, therefore, is unlikely to meet the objectives of the Act entirely due to a reliance on businesses to strike the right balance and adopt good practice of their own will.
Public health legislation has been in place in Victoria since 1854. Victoria has benefited from some form of regulation of drinking water since the former Health Act and developed specific drinking water legislation in 2003. The department considers that this situation has served the state very well in protecting public health, but it presents a difficulty for this RIS in that we have no local history of an ‘unregulated situation’ to compare against the proposed regulations and alternatives. In addition, past levels of compliance with mandatory regulations cannot provide a reliable guide as to the likely future levels of adherence to non-mandatory water quality guidelines in the hypothetical absence of regulations.
The key areas that are likely to be addressed variably by the industry in the absence of regulations and the value of these are explained further below.

17
• Drinking water quality standardsWithout regulations there would be no mandatory standards specifying the quality of drinking water to be provided, the water quality parameters to be monitored, or the frequency of sampling for key parameters. This would be compounded by an absence of criteria to ensure that a water sampling program is representative of the quality of water supplied to consumers, such as water sampling localities.
Testing of representative samples of drinking water within the reticulation system verifies the quality of water supplied to customers. It can also identify problems unique to the reticulation network such as asset integrity failures, consequences of maintenance activities, and network health. A poor water sampling program is unlikely to identify risks to public health in a timely manner.
Additionally, the specification of drinking water quality standards applicable to samples collected in the reticulation system through regulation has allowed water supplies across Victoria to be benchmarked against the same criteria, providing consumers with clear and consistent information.
• Risk management
Risk management plans are the most effective tool that water businesses use to minimise the risk to public health. Without regulations there would be no mandatory specification of the details to be included in risk management plans, or the risks that must be considered by water businesses. This is likely to introduce variability in the thoroughness and scope of the risk management plans thereby increasing the likelihood of risks to public health being realised.
• Audit
The Act requires risk management plan audits to be conducted by an approved auditor. However, without regulations there would be no criteria specified for approving auditors, impacting on the reputation of auditors and confidence in the audit process. Nor would there be any specificationof the documents to be included in the audits, making it difficult to assess all Victorian businesses. This could result in uneven audit outcomes and a poor review of water quality practices that are protective of health and wellbeing.
• Annual reports
The Act requires water businesses to provide the department with and make public annual reports on the issues relating to the quality of drinking water and regulated water, plus other details thatare required by the regulations or by the Secretary. Without regulations, issues or details would need to be specified in the gazette. Public disclosure is paramount to ensure accountability and to safeguard the integrity and trust in the state’s public water institutions.
The various components of the base case are likely to go at least part of the way towards achieving the Act’s purpose of providing for the supply of safe drinking water. However, in the absence ofsafe drinking water regulations or effective alternatives there are residual problems that need to be addressed.
The main problem is minimising risk to public health from unsafe drinking water. A related residual problem is retaining community confidence in safe drinking water supplies, both

18
discussed below.

High
Moderate
Low
Like
lihoo
d
19
2.4.1 Risks to public health from unsafe drinking waterRisk assessment has two dimensions and is the product of the likelihood of an adverse event occurring and the severity of the consequences if it does occur, as illustrated in Figure 4.
Figure 4: Assessing the level of risk
Medium risk High risk High risk
Low risk Medium risk High risk
Low risk Low risk Medium risk
Low Moderate High
Consequence
Source: Victorian Competition and Efficiency Commission 2006
Therefore, while the number of people affected by risks to public health from unsafe drinking water may seem an obvious measure, it fails to take into consideration: (a) whether or not a riskis ongoing; and (b) the impact of the risk on public health in terms of likely increases in both acute and chronic illnesses.
In Victoria and Australia there have been few waterborne disease outbreaks detected and most of those reported (78%) have been associated with recreational exposure rather than drinking water (Dale et al. 2010). Drinking water was the suspected source for 19% (10/54) of the Australian outbreaks in a 2010 study by Dale et al. The two most recent known waterborne disease outbreaks in Victoria occurred prior to the current regulatory framework in Sunbury in 1987 and in Kyabram in1997 (Department of Epidemiology and Preventive Medicine, Monash University, and National Centre for Epidemiology and Population Health 1997).
While incidents are rare and well controlled in Victoria, they demonstrate the potential for serious events and the need to avoid complacency. Victoria has not experienced serious disease outbreaks in part due to the safe drinking water framework and, in the absence of severe Australian case examples for this RIS, case studies have been used from developed countries to provide illustrative examples of the impacts from contaminated drinking water. Box 1 details specific outbreaks in the United States, Sweden and Canada and are used as case examples where a large proportion of inhabitants became ill or died due to contaminated drinking water.

20
The review of these outbreaks highlighted specific factors that contributed to the contamination, including concerns about inadequate water quality regulations and monitoring in these specific jurisdictions. While the specific circumstances and causes in each case may not be directly applicable to Victoria and in particular do not provide a basis to estimate the specific likelihood and impact of a water contamination event in Victoria, they indicate the risk to human health in the event of a waterborne disease outbreak.
Box 1: Case examples of waterborne disease outbreaks
Milwaukee, USA, April 1993
The largest documented waterborne disease outbreak in US history occurred in Milwaukee.It was caused by the chlorine-resistant parasite Cryptosporidium parvum and affected 403,000 people or 25% of Milwaukee’s population in 1993, leading to 69 confirmed deaths (Water Quality and Health 2014).
• This outbreak was a result of filtration failure and poor monitoring practices. Effective filtration
is a control measure for bacteria and protozoa.
• Water safety regulations were improved after this outbreak.Östersund, Sweden, November 2010
In Östersund, approximately 27,000 people (45% of its inhabitants) were affected by a waterborne outbreak of cryptosporidiosis. Identification of Cryptosporidium in human and environmental samples and consistent detection of oocysts in drinking water confirmed an insufficient reduction of parasites by the municipal water treatment plant. This outbreak showed that the ‘use of inadequate microbial barriers at water treatment plants can have serious consequences for public health and that risk can be minimized by optimizing control of raw water quality and employing multiple barriers that remove or inactivate all groups of pathogens’ (Widerström et al. 2014, p. 581).
• This outbreak highlighted the barriers in place were not appropriate to control the risks in the
raw water.
• This event identified unclear water regulations were in place.Walkerton, Canada, May 2000
Bacterial contamination of municipal water in Walkerton, Ontario, resulted in the worst public health outbreak involving municipal water in Canadian history, with seven people dead and2,300 ill. This outbreak was due to a dangerous strain of E. coli. This event demonstrated:
… the absence of criteria governing quality of testing, and the lack of provisions made for notification of results to multiple authorities all contributed to the crisis. The Ministry of the Environment (MOE) noted significant concerns 2 years before the outbreak; however, no changes resulted because voluntary guidelines as opposed to legally binding regulations governed water safety.
Salvadori et al. 2009, s. 33
• This outbreak highlighted chlorine disinfection failure among other numerous failures. Chlorine
disinfection is an effective control measure for bacterial hazards.

21
• This event demonstrated issues with voluntary guidelines.

22
During the recent regulatory period notifications to the Department of Health & Human Services have not resulted in known adverse health effects for consumers; however, there have been a number of‘near misses’. These have been studied carefully by the department and the affected businesses. Two studied events are summarised in Box 2 and demonstrate the potential for an incident thatcould lead to waterborne disease outbreaks.
Box 2: Recent Victorian near misses
1. A water treatment plant, treating water from an irrigation channel, had indications ofan impending failure of the disinfection process. The disinfection dosing plant was not identified as a CCP and therefore the performance indicators were acted upon too slowly. The eventual failure, coupled with the slow response to the issue, meant that the plantran without disinfection for approximately 10 hours. Chlorine disinfection is an effective control measure for bacterial and viral hazards; while no reports of illness were received, potentially unsafe drinking water was delivered to customers.
2. Water from an unprotected catchment was being passed through a water treatment plant that had filtration and disinfection processes. An underestimated rain event caused a significant increase in the raw water turbidity, which impacted on filtration performance. The filters were not able to cope, but water production was continued due to the potential for the town to run out of water. The result was undertreated and potentially contaminated water entering the drinking water supply system. Effective filtration is a control measurefor bacteria and protozoa; while no reports of illness were received, potentially unsafedrinking water was delivered to customers.
Department of Health 2014b
The Victorian case studies demonstrate how risks can change suddenly. Although these have not resulted in serious health outcomes, when multiple failures occur, as highlighted by the international incidents above, the impacts can be significant. Comparing Victorian incidents with the serious international outbreaks demonstrates that treatment process failures continue to occur.
2.4.2 Retention of community confidence in drinking water suppliesRelated to the problem of risks to public health (but separate to it) is the need to retain community confidence in drinking water supplies.
This problem considers potential risks to public health (from switching to less safe sources of drinking water in reticulated areas) and potential environmental costs from aversion to reticulated drinking water supplies (for example, waste disposal of discarded water bottles).
Community confidence in drinking water quality is important to industries as well as households, particularly small businesses that are unable to afford their own onsite water treatment processes. Confidence also underpins the sustainability of many value-adding industries in both metropolitan and regional Victoria, particularly the food and tourism sectors.

23
It should also be noted that public health failures that result in a substantial loss in public confidence in the water supply can contribute to legislative responses that impose increased standards, regulations and oversight (Department of Health 2014a). The department believes that the Act, together with the water quality standards and reporting requirements, has served to build consumer confidence in Victoria.
Potential health risk of reduced confidence in mains water supply
In the event of a waterborne incident or a noticeable deterioration in the appearance, taste or smell of reticulated water there is a potential health risk associated with a reduced confidence in themains water supply. This can be related to potential acute and chronic health issues associated with consuming other water supplies. In Australia, rainwater is currently used as a main drinking source by 3.2% of households in capital cities as opposed to 24.3% in rural and regional settings (CRCfor Water Quality and Treatment 2005). Rainwater may be contaminated by microbial pathogens originating from faecal contamination by birds, mammals, reptiles and amphibians, with risks of contamination likely to be similar in rural/regional and urban settings (CRC for Water Quality and Treatment 2005). Rainwater can also absorb airborne chemical contaminants, which, in urban settings, would arise from a greater influence of traffic emissions and industrial air pollution. In rural settings, chemical risks would mainly arise from contamination by agricultural chemicals such as pesticides and fertilisers (CRC for Water Quality and Treatment 2005).
The percentage of households that would switch to rainwater as a result of loss in confidence in drinking mains water remains unknown. However, while outbreaks are likely to occur more frequently in rainwater systems, they are likely to be contained to the individual(s) in question. For the purpose of this RIS, it is taken that the probability of health impacts from a reduction in consumer confidence and a switch to rainwater is likely to be high for an individual but of low consequence in terms of the population size affected. The department considers that where there is a reticulated water supply using rainwater tanks for drinking water should be discouraged to minimise potential health risk.
Indicative environmental costs of reduced confidence in mains water supply
The environmental cost of reduced confidence in mains drinking water as a result of an outbreak inVictoria is estimated to result in 2.83% more households consuming bottled water (see Appendix3.1.3). This would result in an estimated additional 68,706 households or 158,736 consumers3 of bottled water across Victoria as a consequence of reduced confidence in mains water.
Assuming that the average Australian consumer would drink 365 litres4 of water per year, and that158,736 consumers would have reduced confidence in mains water under the base case, this would mean an additional 57,938,811 litres of bottled water consumed per annum. While there are other costs associated with the production and transportation of bottled water, these are not consideredas incremental costs but rather transfers from consumers to producers by way of prices paid.
On the other hand, an estimated 60% of empty water bottles end up as landfill (Choice 2014) andthe environmental cost is considered to be a real opportunity cost under the base case. A landfill levy (municipal metropolitan and provincial) is used to provide additional and ongoing funding to support efforts by government, industry and the community to reduce waste (EPA Victoria 2014). The 10- year environmental costs of plastic water bottles going to landfill is estimated to be $780,000 or

24
$610,000 in 2014 present value dollars (see Appendix 3.1.3).
3 Assumes an average of 2.3 persons per household.4 Assumes 1 litre of water per day, 365 days a year.

25
2.4.3 Sources of market failureGenerally speaking, the economic rationale for government intervention in markets arises from the concept of market failure – that is, the existence of externalities and/or public goods. In other words, market forces alone would not solve the identified problems.
The water supply and storage industry is characterised by two major factors that do not satisfy the requirements for a perfectly competitive market and are likely to result in the market failure in relation to providing safe drinking water to the public. These factors are ‘natural monopolies’ and‘information asymmetry’. As a result of these factors, market forces on their own are unlikely to adequately mitigate the risks of poor water quality supply and storage to public health.
Consumers are unable to signal the level of water quality desired
Water businesses (including resorts) are characterised by natural monopolies arising from efficiency gains in infrastructure (for example, reservoirs and pipelines) being supplied by one entity that is controlled by legislation or publicly owned. Consumers also cannot switch to another provider if they suspect water quality is poor or another source (for example, bottled water, boiled water or rainwater) without considerable cost (Abt Associates Inc. 2000). The Productivity Commission has noted:
Consumers cannot signal the level of quality that they want provided in their drinking water because a single supplier of a uniform product services them. In a normal market consumers can determine the quality of good they wish to purchase through choice and the price paid. With a natural monopoly, even if consumers could make informed judgements about the quality of water they would like to receive, they could not change to another service provider.
Productivity Commission 2000, p. 34
Information asymmetry
With respect to drinking water quality, consumers and suppliers do not have the same level of information and consumers are unable to determine quality by its appearance alone. Therefore, consumers ‘may receive water of different quality than if they were better informed or had greater choice’ (Productivity Commission 2000, p. 34). There are, however, high ‘transaction’ costs associated with educating the public about water quality issues; that is, it would be costly to translate and analyse water quality data published in annual reports into language easily understoodby the public. This in turn has implications for the way consumer risk preferences are expressed (AbtAssociates Inc. 2000).
In the present case it is also clear that, because of the specific provisions of the Act, markets cannot prescribe matters that the Act specifies can only be prescribed by regulations. The potentially very serious risks coupled with market failure demonstrate that some form of government intervention is still necessary to safeguard the quality of drinking water supplies in Victoria.

26
2.5 Policy objectiveAccording to the Victorian guide to regulation, the policy objectives of a regulatory proposal are the ends to be achieved rather than the means of their achievement (Department of Treasury and Finance 2014). The policy objectives should have a discernible link with government policy that safe drinking water is also aesthetically pleasing to drink and should be closely related to the objectives of the Act authorising the regulations.
In addition to providing safe drinking water, the making of any new regulations should consider opportunities for reducing regulatory burden, especially administrative burden (record keeping and reporting).
The existing regulations have achieved improved compliance rates. The rate of compliance by water businesses with their risk management obligations has risen from 60% to 92%. A sustained level of improvement has also been achieved in smaller regional water supplies, demonstrating uniform safe drinking water quality across the state (Department of Health 2014b).
[Victoria’s] framework is concerned principally with the quality of drinking water supplies and aims to ensure a consistent, reliable supply of high-quality and safe drinking water to [all consumers] that have access to a reticulated supply.
Department of Health 2014c, p. 4
Having regard to purposes of the Act, the residual problems identified in section 2.4 and the above discussion, the policy objectives of the regulatory proposal are as follows.
Primary objective:
1. To ensure the safety of Victoria’s drinking water supplies while minimising regulatory burden where feasible and appropriate.
Secondary objectives:
2. To retain public confidence in the safe management of drinking water.3. To provide equal access to safe and good-quality water for consumers.
The main test for evaluating the proposed regulations and the feasible alternatives is net benefit for the community in terms of achieving these policy objectives. As part of the evaluation, there will be a need to ensure that the benefit of the preferred option justifies the costs.
27
3 Identification of options
In accordance with the Victorian guide to regulation (Department of Treasury and Finance 2014), a RIS is required to identify feasible alternatives to the proposed regulations. Conversely, a RIS is not required to identify alternatives that are not practicable, or where there are no significant cost burdens being imposed.
When considering alternative forms of intervention, the level of risk and impact from noncompliance is highly relevant. The higher risks of noncompliance and higher impacts from noncompliance generally justify stronger regulatory instruments. Conversely, where there are low risks of noncompliance with codes or standards and low impacts of noncompliance, less interventionist forms of regulation are warranted.
Viable options were identified by having regard to the needs to reduce regulatory burden where appropriate. The outcomes of this analysis are summarised in the following sections.
3.1 Alternate optionsNon-legislative options were explored in developing options for this RIS, however, were not considered effective in meeting the policy objectives. Additionally, consultation with water storage managers and water suppliers indicated support for the continuation of regulations as a partof the safe drinking water framework. The non-legislative options considered were:
• Voluntary guidelines – RISs often include an option of voluntary guidelines as a minimum intervention alternative to regulations. In this case the ADWG, which are guidelines based on the best available scientific information, are already part of the base case. There is no rational basis for developing separate Victorian drinking water guidelines.
• Co-regulation – Co-regulation involves industry developing its own code of conduct or accreditation or rating scheme with legislative backing and enforcement from government (Department of Treasury and Finance 2014). The problems to be addressed by the regulations are of a high risk to public health and therefore explicit government regulation is considered more suitable. The safe drinking water framework, however, drives a partnership between water corporations and the department.
• Ministerial statements of obligation – Although there is scope for some matters dealt with in
regulations to be included instead in ministerial statements of obligations, there are reasons ofboth principle and practice why this may not be appropriate. Regulations provide a greater degree of security and certainty than statements of obligations, which can be changed more readily than regulations. Second, although the matters dealt with may be technical and operational, as in the proposed regulations, they may have industry-wide application and define the appropriate balance between the private rights of citizens and the wider public interest. Unlike individual statements of obligations, regulations are subject to democratic processes, including RIS, parliamentary scrutiny and possible disallowance. A statement of obligations to individual businesses does not support the equal access objective to the same extent as regulations and may not go all the way towards addressing public health risk and promoting consumer confidence.
There is no case for introducing more onerous variations of the proposed regulations as this would be inconsistent with the ADWG and has not been suggested in any of the consultations.

28
3.2 OptionsRegulations are the most effective method to create transparency and consistency in how the primary objective, to protect public health, is being met. The key measures considered in developing options to meet the objectives are summarised in Table 2.
Table 2: Relationship between key measures and policy objectives
Key measures
To ensure the safetyof Victoria’s drinking watersupplies
To reduce administration and regulatory burden
To retain public confidencein the safe management ofdrinking water
To provide equal access to safe and good-quality water for consumers
Strengthening riskmanagement plans
X X X
Aligning water qualitystandards with the ADWG
X X X X
Water qualitytesting requirements
X X
Drinking water qualityreporting requirements
X X
Public interest disclosure X
The four options considered in this RIS combine the key measures above in varying combinations as follows:
A. remaking the existing regulationsB. the proposed approach as outlined in the discussion paperC. a variation of the proposed approach without addressing all changes to quality standardsD. a variation of the proposed approach without addressing a change in risk management
plan requirements.
The details of these options are summarised in Table 3.
29
Table 3: Options summary
Matters to address Option A Option B Option C Option D
RMP matters detailed in regulations X X X X
Water sampling localities X X X X
RMP audits X X X X
Audit certificate X X X X
Approval of RMP auditors X X X X
Frequency of sampling X X X X
Samples of water must be analysed X X X X
Additional details to beincluded in annual reports
X X X X
Drinking water standards – drinking water must not contain an algal toxin,pathogen, substance or chemical not X X X Xspecified in regulations that may pose a risk to human health
Additional matters for RMPs (CCPs,critical limits, employee training, water X Xsampling program, quantify treatment risk)
Water quality standards in a schedule– nine standards and existing criteria
X
Water quality standards in a schedule– three standards and existing criteria
X
Water quality standards in a schedule– three standards improve E. coli X X
and turbidity
Reduce regulatory burden X X X
SummaryExisting Strengthen
RMPs; strengthen water quality standards; reduce regulatory burden
Strengthen RMPs; reduce regulatory burden
Strengthen water quality standards; reduce regulatory burden
RMP = risk management plan

30
The options developed for the purpose of this RIS are regulations addressing the same scope as the existing regulations but with amendments as identified through consultation. The features of existing regulations common to all options include water sampling localities, audits and auditor requirements, further details about annual reports and the requirement that drinking water must not contain an algal toxin, pathogen, substance or chemical not specified in regulations that may pose a risk to human health.
The key areas of difference are the additional matters for risk management plans and water quality standard changes discussed below. The options include different combinations of these changes therefore the differences between each option are considered very marginal and most costs would be due to water quality standards.
Content of risk management plans
A key feature of the proposed approach relates to additional matters outlined in regulations that can strengthen risk management. As a part of risk assessment, the existing regulations refer to a requirement for businesses to include the method by which the risks to management activities and infrastructure have their effectiveness verified. The additions being proposed provide direction for water businesses to place greater focus on process risk management by quantifying hazards and controls throughout water treatment processes. This is aimed at improving the ability to considerall types of microbial risk (bacteria, virus and protozoa). The current regulations focus on E.coliis an indicator for bacterial hazards only. Quantifying hazards help determine the level and operation of treatment necessary to ensure safe water is distributed to customers.
This approach includes determining the critical limits and performance criteria for each CCPand will require an increased understanding of process, controls, alarms, reporting and mitigation procedures. These activities are already being undertaken by most businesses in some form,and inclusion of these in regulations will provide consistency in approach across the state. Other features include incorporating a water sampling program and employee competency and training requirements.
Options A and D do not adopt these additional requirements and assessment is based on the requirements in the current regulations.
Water quality standards
It is proposed to reduce the number of water quality standards required to be tested at a nominated frequency to those that are necessary to show that the aesthetic quality of the water is satisfactory and that public health is protected. It is expected that any water quality parameters removed from regulations would be assessed as part of a water supplier’s risk management process for developing a water sampling program and incorporated where appropriate. The requirement to ensure drinking water does not contain any toxin, pathogen, substance or chemical in such amounts that may posea risk to human health is to be retained.
The three parameters proposed as water quality standards represent microbial (E. coli), chemical (THM) and physical (turbidity) features. These standards outlined in Box 3 assist to confirm the effectiveness of the treatment in place and can be an indicator of the integrity of the reticulation system.

31
Box 3: Victoria’s drinking water quality standards
Victoria’s drinking water quality standards are consistent with the ‘guideline values’ foundin the ADWG. Values are based on the best available science. Safety or uncertainty factors are used to provide conservative values that are considered to be protective of public health. There are two types of guideline values:
• The health-related values are designed to protect public health. Health-related values
are levels of certain physical, chemical and microbiological ‘parameters’ of drinking water that will not result in any significant risk to people’s health over a lifetime of consumption.
• The aesthetic values relate to water that is pleasant to drink and free of objectionable
tastes and odours.
The presence of the bacterium E. coli in drinking water is an indicator of recent faecal contamination. It can result from inadequate treatment, post-treatment contamination of human or animal waste, or a failure of risk management in delivering safe drinking water. Any detection for E. coli should be thoroughly investigated.
Turbidity is a measure of the ‘cloudiness’ of water and can be used as an indicator during treatment for effective filtration and disinfection or with end point testing as an indicator of a problem in the reticulation network. Elevated turbidity that affects the appearance of the water is likely to weaken community confidence in the safety of drinking water supplies.
Trihalomethanes (THMs) can be present in drinking water as a result of disinfection treatment processes. A high level may indicate the presence of other chlorination by- products. The ADWG guideline value corresponds to continued exposure over a long period of time. Short-term events are unlikely to have health impacts.
The proposed regulations retain the same standard for THMs. Alternate standards for E. coli and turbidity are proposed.
The current arrangement for E. coli is for 98% of samples to be free of E. coli; however, the standard proposed better represents the ADWG, which requires all samples to be free of E. coli. The standard being proposed will alter the standard to 100% of samples to be free of E. coli while recognising the vulnerability of the sampling process, which can introduce false positives.
For turbidity the change proposed is to the statistical construct applied to the 95th percentile of the 12-month dataset. This will provide a better indication of variability as a part of ensuring well-managed network practices further to the discussion in section 1.3.4: Other consultation.
Options B and D analyse the regulations with these three proposed standards. Option C analyses three parameters with existing criteria, while Option A considers the current arrangements for nine water quality standards.

32
Reducing regulatory burden
It is proposed to remove the requirement to approve water analysts and replace it with a requirement for water suppliers to have their water samples analysed at a NATA-accredited laboratory that holds accreditation for the relevant parameters.
Ensuring reliable and accurate quality testing is an important element of the safe drinking water framework. The current regulatory burden associated with approving and reapproving water analysts is significant, relative to the regulatory benefit that is achieved.
It is also proposed to remove the requirement to provide the department with monthly reports on water quality data. Instead detailed reporting will be required following events, suspected events or non- compliance with standards. At least 95% of tested water samples are compliant with the water quality standards and providing monthly reports is considered an unnecessary burden to water suppliers and the department.
Current regulations also require formal requests to increase or decrease the frequency of sampling. It is proposed to adjust this regulation so that a formal request is only required for sampling less often than the frequency in the schedule. This is another opportunity to reduce regulatory burden.

33
4 Evaluation of costs and benefits
The purpose of this section of the RIS is to compare and contrast the costs and benefits of the proposed regulations and alternative options relative to the ‘base case’, as identified in section2.3. The base case provides the benchmark for measuring the incremental costs and benefits of the proposed regulations and other feasible options.
In particular, it is most important to separate costs to be imposed by the proposed regulationsand the costs that have already been imposed by the Act and other components of the base case. The following analysis must only evaluate the incremental costs of the regulatory options – not the Act or other base case components.
4.1 Cost-benefit methodologyThe evaluation of the relative benefits and costs for the proposed regulations and alternative options has been conducted in relation to how well the policy objectives identified in section 2.5 of this RIS are likely to be achieved.
The following criteria are used to assess the effectiveness of options in achieving the policy objective:
• criterion I: protection of public health (reduced costs of disease and mortality)• criterion II: retention of public confidence in the safe management of drinking water• criterion III: promotion of equity for consumers• criterion IV: net cost of compliance to water storage managers and water suppliers
and government.
The RIS has to assess the regulations in terms of incremental costs and benefits. In order to do this an online survey was designed to determine which parts of the regulations are ‘business as usual’ as well as aiming to gather data in terms of the nature and extent of costs across all water businesses. The survey also captured how each regulation is likely to benefit the community asa whole through businesses ranking the regulations against criteria I (protection of public health)and II (retention of public confidence).
Cost estimates in this RIS have been drawn from both the Department of Health & Human Services and the July 2014 industry online survey; however, while some data was utilised from the online survey, many of the resources reported in relation to the existing and proposed regulations werenot necessarily incremental to the base case. Data provided reflected not only the incremental cost of existing and proposed regulations but also, in many cases, the cost of labour and capital with respect to the base case. As an example, under the Act businesses are required to assess and manage risks to the quality of drinking water, therefore capital costs for treatment requiredto effectively manage these risks already form part of the base case. For this reason not all dataprovided in the online survey has been included for the purpose of estimating incremental costs.
Discounted5 quantitative estimates of costs are made over the life of the proposed regulations and other options, using stated reasonable assumptions to fill in any essential data gaps. Where sufficient benefit data has not been available, the evaluation has been made using a qualitative discussion of benefit criteria.

34
5 A discount factor of 4% is used for present value calculations in this RIS, as recommended by the Victorian Competition and Efficiency Commission (VCEC).
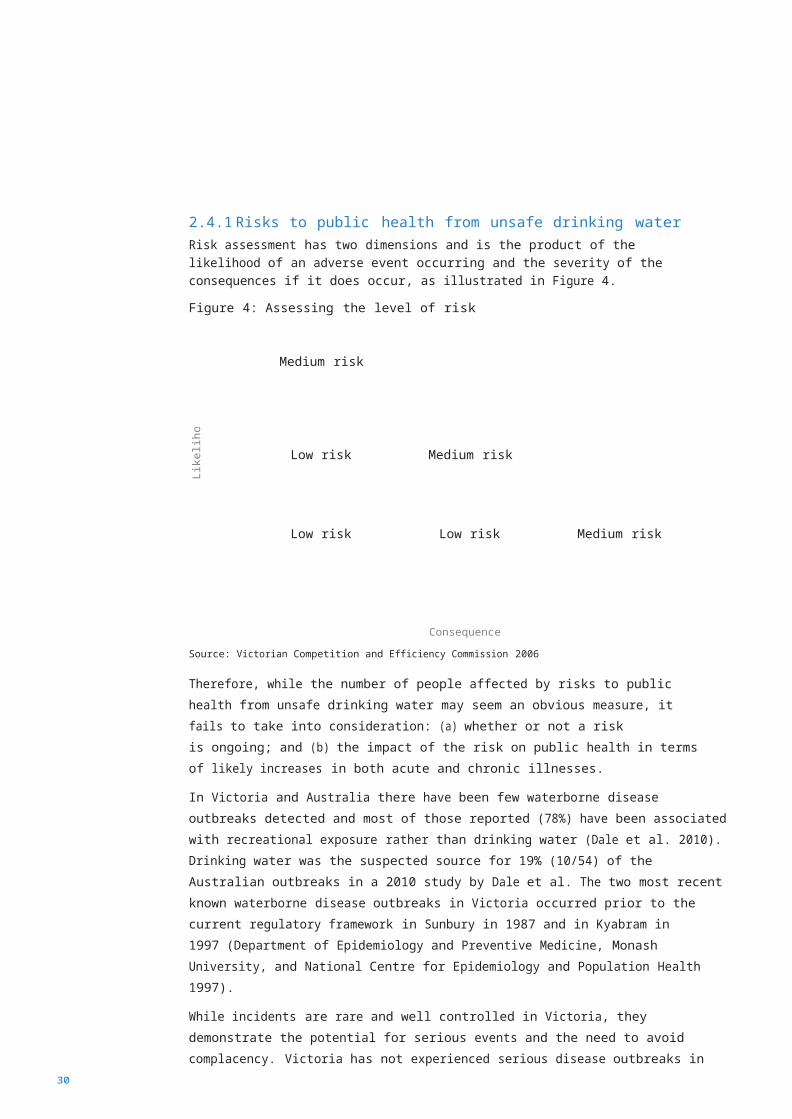
35
All incremental costs are also presented in terms of the size distribution of water businesses. The size distribution of water businesses is based on the Australian Bureau of Statistics (ABS) classification system for small (fewer than 20 employees), medium (20–200 employees) and large (more than 200 employees) (ABS 2001). None of the water businesses are a small business in terms of the strict ABS definition (fewer than 20 employees). However, some of the rural/regional water suppliers might be considered ‘small’ relative to other businesses (on the basis of the volume of water supplied and their customer base). Moreover, the water supply components of resorts could be viewed as ‘small’ operations within larger businesses; however, they are not small businesses in their own right.
4.2 Cost estimate assumptionsAll costs are estimated on an incremental basis against the base case and over a period of10 years. Regulations assessed as having a zero or negligible incremental cost impact relative to the base case have been excluded from the analysis on the basis of base case requirements outlined in Box 4.
Box 4: Base case requirement
1. Water quality standard parameters
Water businesses are already obliged to supply safe drinking water that is fit for purpose and of acceptable quality under primary legislation such as the Safe Drinking Water Act, the Food Act and Australian Consumer Law (Victoria). In addition water businesses definesafe drinking water by reference to the guideline values in the ADWG. There are also consumer expectations for safe drinking water, which are conveyed to water businesses via various feedback mechanisms. These existing obligations are reflected in current water industry practices, as demonstrated by the online survey and the customer charter of each water business. The proposed water quality standards are consistent with the ADWG. There is no incremental cost to meet the quality standards for E. coli and turbidity. However, in the caseof THMs there are some incremental costs as identified and quantified by the water businessesdue to the ADWG providing both chronic and acute values as health risks are less clear.
2. Water quality samples must be analysed
As a logical consequence of being required to supply safe drinking water, samples would be taken at representative locations and then analysed to ensure a reliable result. Consistent with these current industry practices, almost all water businesses responded in the online survey that they would have samples analysed by qualified laboratories anyway.

36
3. Risk management plan requirements
The Safe Drinking Water Act requires water businesses to prepare a risk management plan that (a) contains a detailed description of the system of supply; (b) identifies the risks to the quality of the water and the risks that may be posed by the quality of the water; (c) assesses those risks; (d) sets out the steps to be taken to manage those risks (including the development and implementation of preventive strategies); and (e) contains any other matters required bythe regulations. The current statement of obligations issued under s. 4I of the Water Industry Act by the Minister for Water requires water corporations to develop and implement plans to manage risks to water quality.6 The ADWG also provides guidance on risk management of drinking water systems. Current water industry practices reflect this embedded approach,as demonstrated by the online survey, where almost all businesses stated that they would include the matters required by the regulations anyway. While in the online survey many businesses responded with capital costs to meet this part of the proposed regulations, it is clear that these investments should be already identified by the requirements of the base case. Thus there are no incremental costs entailed in the proposed regulations regarding risk management plans.
4. Risk management plan audits
The Act requires risk management plan audits by an approved auditor to determine: (a) the water supplier has complied with the obligations imposed by s. 7(1) during the audit period;and (b) the water storage manager has complied with the obligations imposed by s. 8(1) during the audit period. The costs of an audit are therefore associated to the base case. Furthermore in conducting a risk management plan audit, the auditor must inspect all the documents that are specified by the regulations for the purposes of this section. Almost all water businesses responded in the online survey that they would provide the specified documents to auditorsanyway; thus there is no incremental cost entailed in these aspects of the proposed regulations.
5. Auditor appointment criteria
The Act requires auditors to be appointed by the Secretary if the Secretary is satisfied thatthe person meets the auditor approval criteria set out in the regulations. The proposed criteria are to either be accredited by a suitable institution or to demonstrate sufficient competenceto be appointed. As it is assumed that the Secretary would not appoint anyone who is neither accredited nor competent, there is no incremental cost entailed in this aspect of the proposedregulations.

37
6 Parts 5-1 and 5-2 of the statement of obligations dated 16/9/12.
Reg. 9
Reg. 11
Reg. 12
Reg. 13
38
Table 4 provides a cost association of the elements of the current regulations to the Act and regulations. The incremental costs applicable to the regulations can be determined through this table and the base case considerations above. Therefore the options assessed in this RIS consider incremental costs associated with water sampling localities, water sampling points, drinking water quality standards, sampling frequency, annual reporting and approval of analysts. Each of the options is likely to entail a different combination of incremental costs and benefits, as per the detailsof the four options in section 3.2.
Table 4: List of cost association of proposed changes to regulations
Safe Drinking Water Regulations 2005Cost
association
Incremental costs identified under any option
Part 1Preliminary
Part 2Management of risks to water supply
Reg. 1 Objective and outline None N/A
Reg. 2 Authorising provision None N/A
Reg. 3 Definitions None N/A
Reg. 4 Water sampling localities Regs Yes
Reg. 5 Water sampling points Regs Yes
Reg. 6 Risk management plan Act N/A
Reg. 7 Risk management plan audits Act N/A
Reg. 8/Schedule 1
Audit certificate Act N/A
Approval of riskmanagement plan auditors
Act N/A
Part 3Drinking
Reg. 10/ Schedule 2
Drinking water quality standards Regs Yes
water quality standards
Part 4Other matters
Frequency of samplingfor drinking water
Regs Yes
Samples of drinking watermust be analysed
Regs None
Results of analysis of drinkingwater must be provided
Regs Yes
Reg. 14 Approval of water analysts Regs Yes
Reg. 15 Annual reports Regs Yes
Further to the discussion in Box 4, the Department considers that most water businesses already substantively comply with the requirements of the proposed risk management plans, including having the business processes and other requirements necessary to implement the plans. However,in some cases, following the revision of risk management plans, some water businesses may decide to implement additional control measures as a part of their plan. The Department considers these measures to be driven by ongoing continuous improvement decisions where the majority will be optimisation focussed.

39
To the extent that this occurs, some water businesses will incur additional costs and, presumably benefits. Given the diverse nature of water businesses it is difficult to reliably determine and therefore quantify any such incremental impacts attributable to the regulations, but the Department considers them to be small given its understanding of the water businesses and stakeholder consultation to date.
4.3 Options analysis4.3.1 Net cost of complianceAssessing the cost of compliance has shown that the greatest cost is with the water quality standards. The four options have marginal differences except for the testing requirements for the water quality standards. Option A requires testing for nine standards and therefore has the greatest cost, while the other three options consider three standards and, irrespective of the changes to the standards of these parameters, create the same cost. It would not create a more frequent requirement for testing. Table 5 presents the incremental costs under all options.
Table 5: Summary of incremental 10-year costs under Options A, B, C and D, Victoria,2015–2024 (2014 dollars)7
Regulation Stakeholder Option A Option B Option C Option D
4 Government $77,123 $77,123 $77,123 $77,123
5 Government $87,620 $0 $0 $0
14 Government $87,620 $0 $0 $0
15 Water businesses $2,251,313 $2,251,313 $2,251,313 $2,251,313
15 Government $32,857 $32,857 $32,857 $32,857
10/Schedule 2 Water businesses $1,429,124 $540,476 $540,476 $540,476
10-year total PV cost $3,965,657 $2,901,770 $2,901,770 $2,901,770
7 See Appendix 2 for source of estimates.
40
Option A is estimated to be $3.97 million in present value dollars. Option B is estimated to be $2.9 million in present value dollars and identical to Options C and D. The total incremental 10-year cost of all options is mainly driven by the details required in annual reports, estimated to be $2.28 million over 10 years in 2014 dollars. Option A would entail remaking the existing regulations in their current form, particularly those regarding risk management plans, audits, the contents of annual reports and water quality standards. The difference in cost between Option A and Options B, C and D is driven by the variation in the number of water quality standards and the regulatory burden of approving water sampling points and water analysts by the Department of Health & Human Services.
In relation to ceasing monthly reports to the department, ss. 18 and 22 of the Act would continue to require notification of noncompliant results for any drinking water quality standards or knownor suspected contamination, respectively. It was determined that the costs of monthly reporting were minimal and aligned more with the Act, so there would be negligible additional savings over Option A.
With respect to water quality standards, there would be a lower additional cost of sampling under Options B, C and D as compared with Option A, as identified in the July 2014 online survey. Options B, C and D would have no explicit requirement for sampling apart from E. coli, turbidity and THMs, although water businesses may still undertake more sampling as a part of their risk management plans.
In considering the distribution of incremental cost between government, rural/regional water businesses and metropolitan water businesses, the following tables show where costs are incurred.
As shown in Table 6, the largest component of incremental 10-year cost is incurred by medium-sized rural/regional water suppliers in terms of annual reports and is estimated to be $1.39 million followed by large rural/regional water suppliers for water quality standards at an estimated $890,000 million in present value dollars. The incremental cost to government is estimated to be $290,000.
10/Schedule 2
Total cost
41
Table 6: Summary of distribution of incremental 10-year costs under Option A, 2015–2024 (2014 dollars)
Number of Number ofRegulation Stakeholder Medium businesses Large businesses Total
4 Government N/A N/A N/A N/A $77,123
5 Government N/A N/A N/A N/A $87,620
14 Government N/A N/A N/A N/A $87,620
15 Government N/A N/A N/A N/A $32,857
All regulations Government total 10-year cost N/A N/A N/A N/A $285,220
15 Water supplier (rural/regional) $692,712 8 $346,356 4 $1,039,068
Water storage manager15(rural/regional) $86,589 1 $86,589 1 $173,178
Water storage manager and15water supplier (rural/regional) $86,589 1 $0 0 $86,589
15 Resort manager (rural/regional) $519,534 6 $86,589 1 $606,123
15All rural/regional waterbusinesses subtotal $1,385,424 16 $519,534 6 $1,904,957
15 Water supplier (metropolitan) $0 0 $259,767 3 $259,767
Water storage manager15(metropolitan) $0 0 $86,589 1 $86,589
15All metropolitan waterbusinesses subtotal $0 0 $346,356 4 $346,356
10/Schedule 2 Water supplier (rural/regional) $437,988 5 $885,742 6 $1,323,730
Water storage manager10/Schedule 2
10/Schedule 2
(rural/regional)$0 0 $0 0 $0
Water storage manager andwater supplier (rural/regional)
$0 0 $0 0 $0
10/Schedule 2 Resort manager (rural/regional) $0 0 $0 0 $0
All rural/regional water10/Schedule 2
businesses subtotal $437,988 5 $885,742 6 $1,323,730
10/Schedule 2 Water supplier (metropolitan) $0 0 $105,442 1 $105,442
Water storage manager10/Schedule 2(metropolitan)
$0 0 $0 0 $0
All metropolitan waterbusinesses subtotal
$0 0 $105,442 1 $105,442
Rural/regional water businessesAll regulations
All regulations
total 10-year PV cost $1,823,412 $1,405,276 $3,228,688
Metropolitan water businesses$0 $451,798 $451,798 total 10-year PV cost
Government and waterbusinesses 10 year PV cost
$1,823,412 $1,857,073 $3,965,705

15
$0 $0 $0
10/Schedule 2
Total cost
42
Table 7 summarises the distribution of incremental cost between government, rural/regional water businesses and metropolitan water businesses under Options B, C and D. The largest component of incremental 10-year cost is incurred by medium-sized rural/regional water suppliers in termsof annual reports and is estimated to be $1.39 million. In comparison with the distribution underOption A, the incremental costs associated with water quality standards and the incremental cost to government is a lot less.
Table 7: Summary of distribution of incremental 10-year costs under Options B, C and D,2015–2024 (2014 dollars)
Regulation Stakeholder Medium Large Total
4 Government N/A N/A $77,123
15 Government N/A N/A $32,857
All regulations Government total 10-year cost N/A N/A $109,981
15 Water supplier (rural/regional) $692,712 $346,356 $1,039,068
15 Water storage manager (rural/regional) $86,589 $86,589 $173,178
Water storage manager and15water supplier (rural/regional)
$86,589 $0 $86,589
15 Resort manager (rural/regional) $519,534 $86,589 $606,123
15 All rural/regional waterbusinesses subtotal
$1,385,424 $519,534 $1,904,957
15 Water supplier (metropolitan) $0 $259,767 $259,767
15 Water storage manager (metropolitan) $0 $86,589 $86,589
All metropolitan waterbusinesses subtotal
$0 $346,356 $346,356
10/Schedule 2 Water supplier (rural/regional) $105,442 $435,035 $540,476
10/Schedule 2 Water storage manager (rural/regional) $0 $0 $0
Water storage manager and10/Schedule 2water supplier (rural/regional)
$0 $0 $0
10/Schedule 2 Resort manager (rural/regional) $0 $0 $0
All rural/regional waterbusinesses subtotal
$105,442 $435,035 $540,476
10/Schedule 2 Water supplier (metropolitan) $0 $0 $0
10/Schedule 2 Water storage manager (metropolitan) $0 $0 $0
10/Schedule 2 All metropolitan water businesses subtotal
Rural/regional water businessesAll regulations
All regulations
total 10-year PV cost $1,490,865 $954,569 $2,445,434
Metropolitan water businessestotal 10-year PV cost
$0 $346,356 $346,356
Government and water businesses10 year PV cost
$1,490,865 $1,300,924 $2,901,770

43
4.3.2 Analysis of benefitsUndertaking a cost-benefit analysis for replacing the sunsetting regulations requires quantification of the extent of the problem in the absence of regulation. However, this can be very difficultwhere existing regulations or a form of regulation has been in place for some time. Considering this difficulty, as well as a lack of direct observable data, means there is a degree of uncertainty regarding quantification of the problem and, as a result, the benefits of a regulatory proposal relative to a base case.
Alternatively, analysis of the impacts and outcomes of a waterborne incident can help shed light on likely benefits that may occur if it is assumed that regulations can play some part in reducing the likelihood of contaminated water that could cause a waterborne incident.
Figure 5 outlines the main direct potential impacts that could result from reducing the likelihood of contaminated water. Impacts include reducing public health risks (including reduced loss oflife and illness) and increased consumer confidence (leading to reduced costs as a result of fewer substitution effects and behavioural changes).
Figure 5: Potential impacts resulting from a reduction in the likelihood of contaminated water
Reduced likelihood of
contaminated water
Reduced public
health risk
Increased consumer confidence
Reduced loss of life
Reduced illness
Reduced consumption of bottled water
Reduced behaviour change leading to
boiling water before consumption
Reduced consumer preferences for
home purification systems
Reduced environmental
costs from bottles in landfill
Reduced other costs
Reduced substitution to other sources
44
These impacts, which can be categorised under two main areas of reduced public health risk and increased consumer confidence, could suggest that corresponding benefits from the regulations (to the extent that they reduce or avoid adverse impacts) that could be analysed include:
• a reduction in public health and mortality costs associated with the risks of a waterbornedisease outbreak (criterion I)
• a reduction in costs associated with reduced consumer confidence as a result of a waterbornedisease outbreak (criterion II).
It should be noted that community confidence in safe drinking water is also linked to the food and beverage manufacturing and export and tourism industries. The value of having an accountable, transparent and consistent regulatory scheme that can ensure these sectors continue to support Victoria is important but difficult to measure.
Estimating the magnitude of the benefits
It is difficult to quantify the magnitude of the incremental benefits of the options due to the unknown likelihood of a waterborne outbreak occurring in the base case. As a result, a qualitative assessment of the additional ‘residual’ benefits under an option relative to the base case has been undertaken and informed by an online survey in July 2014.
The online survey captured information about benefits to determine how regulations (and particular components of the regulations) are likely to benefit the community as a whole against protection of public health (criterion I) and retention of public confidence (criterion II).
Protection of public health (criterion I)
As seen in Figure 6, the results from the July 2014 online survey generally showed the highest mean scores related to the value of risk management plans, where industry considers these to be a key aspect of mitigating the risk of outbreaks. In particular, questions regarding current risk management plan regulations and reforms to risk management plan regulations achieved the highest meanscore with respect to combined criteria of protection of public health and better protection against risks of outbreaks. This supports the department’s view that effective risk management plans are a significant factor in protecting public health.
The online survey indicated reforms to risk management plans are the most significant factors in promoting protection of public health (criterion I). The industry considered current risk management plans to be less effective in relation to risks of outbreaks than the proposed regulations. Reforms such as identifying CCPs and the appropriate critical limits are proactive measures that can improve operational performance monitoring in order to address hazards before significant consequences occur. These additional risk management plan requirements were outlined in Options B and C.

Mea
n sc
ore
45
Figure 6: Mean scores for protection of public health and better protection against risks of outbreaksCriterion I
4.504.20 4.11 4.11
4.00 3.95 3.98
3.50
3.00
2.50
2.00 1.80
1.50
1.00
1.66
2.56
2.02
3.64
2.89
3.553.34
3.00
1.60
3.122.88 2.81
2.572.25
2.56
1.58
3.12
1.78
3.40
2.58 2.58
2.052.47
0.50
0.00116 117 118 119 120 121 122 123 124 125 126 127 128 129 130 131 132 133 134 135 136 137 138 139 140 141 142 143
144
Survey questions Source: July 2014 online survey
Retention of community confidence (criterion II)
The highest scores with respect to community confidence in drinking water (criterion II), as shownin Figure 7, related to a number of features. These include requirements for risk management plans, current water quality standards, reforms to approval of water analysts and current requirements for annual reports.8
In the survey, questions regarding risk management plans were again considered to be most important in relation to community confidence. However, the category of community confidence in the survey was too general in nature and did not relate the issue of community confidence to awaterborne disease outbreak situation. Therefore, analysis on this question is not used in assessing options; however, the survey results support the importance of risk management plans and water quality standards for retaining community confidence.
Even though the survey indicated the current arrangement of nine standards provide confidence in the quality of water delivered, the department considers that a reduction of standards can achieve the same outcome as long as they measure appropriate parameters necessary to show the aesthetic quality of the water is satisfactory and that public health is protected. In order to reduce the number of standards it is important to consider that the standards being applied and the proposed tighter alterations to two standards (E. coli and turbidity) should continue to achieve community confidence as they better represent information on water quality to consumers. Three standards with the tighter values for E. coli and turbidity were used in Options B and D.
8 Proposed reforms for annual reports also scored high under question 142; however, these were eventually disregarded by the Department of Health & Human Services. See 1.3.4 Other consultation
Mea
n sc
ore
46
Figure 7: Incremental benefit score responses for retention of community confidence in drinking water supplies
Criterion II
4.00
3.50
3.00
2.50 2.29
2.002.25 2.37
2.00
3.623.36
3.00 3.05
2.12
3.623.41
3.59
3.32 3.102.84
3.45
3.65
3.00 2.952.61
2.72
2.24
3.48
2.05
3.62 3.76 3.62
3.33 3.22
1.50
1.00
0.50
0.00116 117 118 119 120 121 122 123 124 125 126 127 128 129 130 131 132 133 134 135 136 137 138 139 140 141 142 143
144
Survey questionsSource: July 2014 online survey
Equity (criterion III)
Regulations provide equitable access for all Victorian consumers to good-quality drinking water. While Option A requires testing of an increased number of parameters, it doesn’t provide a different water quality outcome as businesses take a risk-based approach to water testing. There are no discernible differences between the options in terms of equity of outcomes for Victorians.

47
5 Preferred option
The decision rule used in this RIS for selecting the preferred option is consistent with the Victorian guide to regulation’s emphasis on a proportionate approach to analysis, and the relatively low impact of the options considered. Given this consideration and the uncertainty regarding benefit estimate assumptions, the choice of option is based on a qualitative discussion of which option is expectedto have the greatest reduction of risks of residual problems occurring under the base case.
5.1 Identification of preferred optionThe cost analysis has shown that the likely incremental costs under Options B, C, D are identical, with greatest costs under Option A (see Table 5). Identification of the preferred option is therefore based on a qualitative analysis of which option is expected to have the greatest reduction of risks to public health and promotion of consumer confidence. This analysis was informed by the results of the July 2014 online survey.
The benefits of the regulations are difficult to quantify due to uncertainty of the likelihood of waterborne disease outbreaks occurring under the base case and the severity of any such event. Although the incidence of contamination of water supplies is relatively low, the consequences to public health can be very high, including serious illnesses and death, indicating a need for effective preventive action. To delay such action until serious illnesses or deaths occur would, of course, be irresponsible and unacceptable.
The risk management plan details provide rigour to the risk assessment and management process and therefore reduce the likelihood of an event and the duration of it should it occur. The risk management plan details are the strongest method to achieve the desired public health outcome.
The water quality standards provide a benchmark across the state as well as a level of consumer confidence that safe drinking water is produced.
Option A is not preferred because it does not adopt the additional risk management plan details considered necessary to protect public health. Reporting on standards that have achieved an ongoing high level of compliance is also considered to be a regulatory burden and produces the highest cost of the options proposed.
Options C and D have the same costs as the preferred option; however, the options contain weaknesses either regarding risk management plans or the standard applied to the three parameters.
In conclusion, Option B is seen as the most effective in dealing with the residual problems identifiedin section 2.4 both by requiring additional factors to be included in relation to risk management plans and, to a lesser degree, by requiring more stringent requirements in relation to the water quality standards with respect to E. coli and turbidity while reducing regulatory burden.

48
5.2 Break-even analysis of preferred optionWhere there is some uncertainty (unknown probabilities) as to whether the proposed regulations (Option B) will actually generate the expected benefits, particularly in relation to criteria I and II, further analysis has been undertaken to illustrate the break-even point of the preferred option in terms of deaths and illnesses.
Break-even analysis can be undertaken in relation to reduced public health risks (criterion I)by assuming that the cost of an infectious intestinal disease (IID) from a waterborne incident is estimated to have a societal cost of $267.84 per person affected, and the cost of mortality to society is estimated to be $4,216,724, using a value of statistical life. While increased consumer confidence (criterion II) is likely to reduce environmental and other costs, they are difficult to quantify and have not been taken into account in the break-even analysis9.
The cost of the preferred option would break even and is worthwhile if the option prevents just one (0.69) death in present value terms over the life of the regulations, even if the rate of IID across the rest of the community is not affected. Alternatively, the preferred option would alsobreak even if it can prevent 10,834 people from contracting an IID, even if no deaths are prevented across the community.
To get a sense of the likely adverse outcomes that the regulations could play a part in preventing, Box 5 shows previous examples of waterborne outbreaks in similar (developed) countries. These examples are used to illustrate the potential costs incurred in the event of a waterborne outbreak. While the likelihood of a waterborne outbreak occurring in Victoria is uncertain, this information can help to highlight the relative cost of the preferred option against the cost of a potential outbreak, and the instances in which the regulations would break even if they can help avoid these examples of waterborne outbreaks.
9 The Department did attempt to estimate a likely reduced environmental cost relating to bottled water in landfill. This is provided in Appendix 3.1.3 but has not been included in the break-even analysis due to the difficulty in quantifying other related reduced costs resulting from increased consumer confidence.

49
Box 5: Analysis of the preferred option under different scenarios
The outbreak in Milwaukee 1993 is used as a specific case example of a scenario where a significant proportion of inhabitants became ill or died. Translating the cost of this incident to the Victorian context requires adjustment to population figures. In addition, other scenarios using outcomes from outbreaks in Walkerton and Östersund are also considered as part of the analysis to illustrate potential outcomes and the costs that result from a waterborne incident.
The outcomes and costs of a Milwaukee-, Walkerton- and Östersund-type event are outlined in Table 8.
Table 8: Number of changes required: Costs of various waterborne outbreaks
Milwaukee-type event Walkerton-type event Östersund-type event
Number of people affected
Cost($2014)
Number of people affected
Cost($2014)
Number of people affected
Cost($2014)
IID 435,000 $116,510,400 2,300 $616,032 27,000 $7,231,680
Deaths 1.22 $5,144,403 7 $29,517,068 0 0
Total cost10 $121,654,803 $30,133,100 $7,231,680
The likelihood of these scenarios is difficult to determine but these events are less likely given the combined effect of incentives on water businesses and a well-performing regulatory framework (including the Safe Drinking Water Act, ADWG and proposed Regulations). Given the cost ofthe preferred option is $2,901,770, they would more than break even if they help to prevent a Milwaukee-, Walkerton- and Östersund-type event from occurring. To summarise, regulations can provide a relatively low cost option that can strengthen the overall legislative and regulatory framework to help prevent incidents from contaminated water developing into serious events.
5.3 Comparison of Option B (the proposed regulations)and Option A (the existing regulations)The following comparison between the existing regulations (Option A) and the proposed regulations(Option B) is not part of the cost-benefit evaluation because all costs and benefits are required to be measured relative to the base case. It is provided at the request of the water industry for the information of those stakeholders looking to implement the preferred option (Option B) in the event that it may be eventually adopted by the Victorian Government.
The proposed regulations (Option B) are designed to maintain the elements of the existing regulations that worked well, to strengthen risk management and to remove administrative burden where appropriate. It also is an opportunity to reform the water quality standards.
10 Costs do not include costs incurred as a result of reduced public confidence due to their difficultly to quantify.Inclusion of these costs would increase the total cost of the outbreak.
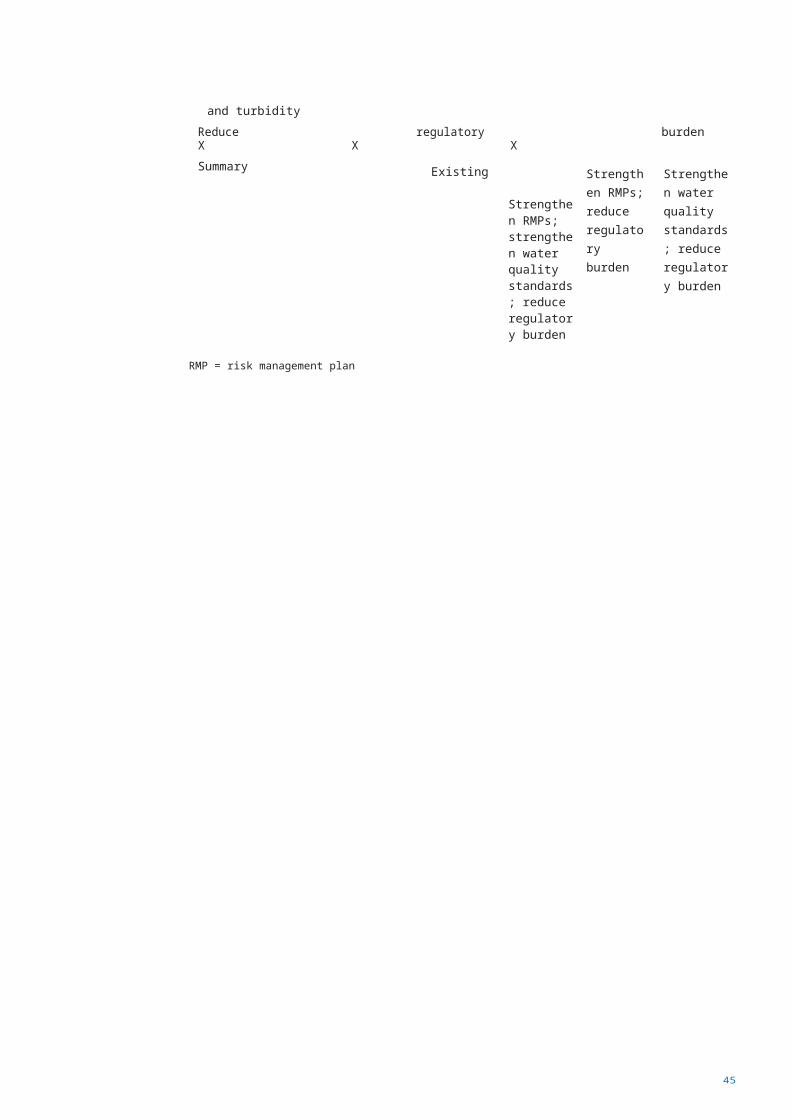
50
In particular, the removal of six standards currently set out in Schedule 2 (chloroacetic acid, dichloroacetic acid, trichloroacetic acid, bromate, formaldehyde and aluminium) would enable water businesses to more appropriately manage these hazards through the risk management process. The retention of three standards, are those that are necessary to show the aestheticquality of the water is satisfactory and that public health is protected. This is seen as an appropriate means of assessing risk management activities at the point of supply, and provides a level of accountability to consumers and the department on the operation of the system as a whole (Department of Health 2014a).
As shown in Table 9, the incremental cost savings of going from the existing regulations to Option B is $1.06 million, with the largest savings for water businesses with respect to water quality standards.
Table 9: Comparison of incremental costs of Option B (proposed regulations) and Option A (existing regulations), 2015–24 (2014 dollars)
Regulation/criterion Stakeholder Incremental 10-year costs/benefits
4 Government $0
5 Government –$87,620
14 Government –$87,620
15 Water businesses $0
15 Government $0
10/Schedule 2 Water businesses –$888,647
Total –$1,063,887
5.4 Competition assessmentAs part of this assessment it is necessary to:
• identify the restriction on competition, if any• show that the restriction, if any exists, is necessary to achieve the objective• assess whether the benefits of the restriction outweigh the costs.The markets affected by the proposed regulations include the markets for both water storage and water supply,11 which are monopolies and not subject to any possible further restriction of competition. Other markets are for alpine resorts, which are open to competition for visitors. In Victoria there are five resort businesses and Parks Victoria. The proposed regulations would not reduce competition as costs imposed by the proposed regulations for annual reports are imposed equally on all resort businesses and represent only $10,676 per annum, which is only 0.19% ofthe annual turnover of the smallest resort business (see Table 10 and Table A1.6 of Appendix 1).
51
11 There is no market as yet for water suppliers to buy water from different storage managers.

52
Table 10: Summary of size and category distribution of water businesses12
Category of water business(metropolitan/rural/regional) Medium Large Total
% of water businesses
Water storage managers (metropolitan) 0 1 1 4.0%
Water storage managers (rural/regional) 1 1 2 8.0%
Water suppliers (metropolitan) 0 3 3 12.0%
Water suppliers (rural/regional) 8 4 12 48.0%
Water storage manager/water supplier (rural/regional) 1 0 1 4.0%
Resort managers (regional) 5 1 6 24.0%
Total 15 10 25 100.00%
The other market identified is the market for auditors where the Act requires the Secretary’s approval of auditors and the regulations specify criteria for the approval. In the absence of regulations, it would be unreasonable for the Secretary to appoint a person as an auditor without adequate evidence of the person’s competence. Hence, it logically follows that there would be no incremental cost entailed in an applicant becoming sufficiently competent to be appointed as an auditor. Consequently, the proposed regulations would not reduce the level of competition.
As discussed in section 2.4.2, the potential competition to reticulated drinking water from bottled water and rainwater is very limited, provided that community confidence in reticulated water is retained.
5.5 Impact on small businessNone of the water businesses are a small business in terms of the strict ABS definition (fewer than20 employees). However, some of the rural/regional water suppliers might be considered ‘small’ relative to other businesses (on the basis of the volume of water supplied and their customer base). Table 11 summarises the volume of water supplied by rural/regional water suppliers and annual revenue. Given that the average volume (ML) of water supplied per annum in rural/regional Victoria (not including resorts) is 18,125, this is used as a relative measure of size. That is to say there are eight businesses that supply less than the industry average in rural/regional Victoria. These eight businesses make up 66.67% of rural/regional water suppliers.
12 See Appendix 1 for the source of these estimates.
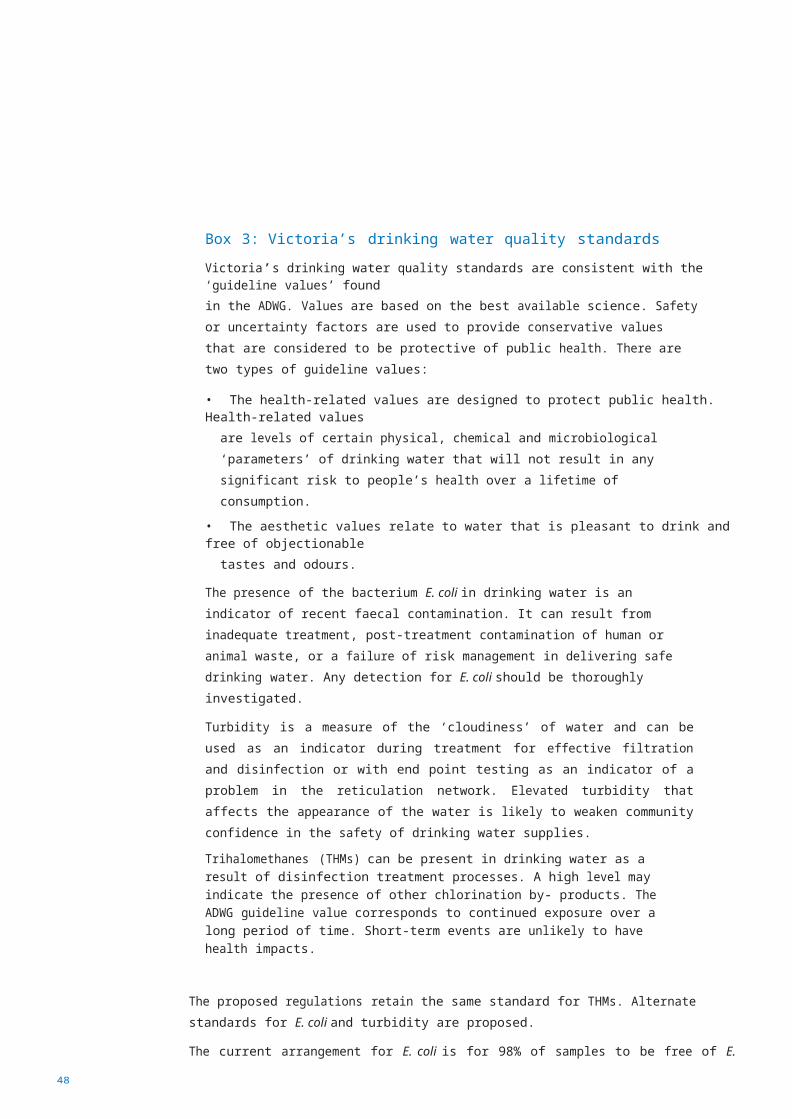
53
Table 11: Relative size distribution of rural/regional water suppliers by volume of water supplied and annual revenue13
Volume of waterWater supplier Annual revenue supplied (ML) per annum
Relatively ‘smaller’ supplied (ML) per annum
Westernport Water $20,626,000 1,802South Gippsland Water $27,918,000 4,719East Gippsland Water $32,523,000 4,812Wannon Water $76,680,000 11,620Central Highlands Water $90,140,000 12,397Western Water $82,261,000 12,830North East Water $63,412,000 14,687Lower Murray Water $65,291,000 18,090
Relatively ‘larger’
Coliban Water $98,515,000 18,757Goulburn Valley Water $73,682,000 26,220Barwon Water $200,551,000 30,726Gippsland Water $128,944,000 60,842
Average of both categories $80,045,250 18,125
Annual reports would not have any significant impact on any of these ‘smaller’ businesses,as the entire annual incremental cost for this category of water business would be $128,108,14
which represents only 0.62% of the annual revenue for the smallest business as shown in Table 11 ($20.63 million).
Similarly, the entire annual incremental cost for water quality standards for this category of water business would be $19,21615 and represents only 0.09% of the annual revenue for the smallest business as shown in Table 11 ($20.63 million). Therefore, this regulation would not be seen to have any significant impact.
Moreover, the water supply components of resorts could be viewed as ‘small’ operations within larger businesses; however, they are not small businesses in their own right. Annual reports would not have a significant impact on any of these ‘smaller’ businesses, as the entire annual incremental cost for this category of water business would be $74,72916 and represents only 1.34% of the annual revenue for the smallest business ($5.56 million17).
13 See Appendix 1 for the source of these estimates.14 See Appendix 2 for the source of this estimate.15 See Appendix 2 for the source of this estimate.16 See Appendix 2 for the source of this estimate.17 See Table A1.6 of Appendix 1 for the source of this estimate

54
5.6 Comparison with other jurisdictionsAlthough the legislative regimes of other states, in general, provide a similar broad range of requirements relating to the quality of drinking water, the structures of corresponding Actsand Regulations do not allow easy or direct comparisons with the Victorian legislative regime. The relevant Acts, Regulations and other laws are set out in Table 12.
Table 12: Equivalent legislation in other Australian states
Jurisdiction Relevant Act Relevant Act
New South Wales Public Health Act 2010 Public Health Regulation 2012
Public Health Act 2005, Water SupplyQueensland(Safety and Reliability) Act 2008
Public Health Regulation 2005
South Australia Safe Drinking Water Act 2011 Safe Drinking Water Regulations 2012
Drinking Water Quality GuidelinesTasmania Public Health Act 1997issued under the Act (some enforceable)
Health Act 1911 Economic Operating licences under the EconomicWestern Australia
Regulation Authority Act 2003 Regulation Authority Act 2003
The NSW Public Health Act 2010 requires all drinking water suppliers to implement a quality assurance program for the safe supply of drinking water. The NSW Government has endorsed the ADWG. Under r. 34 of the Public Health Regulation, a quality assurance program must address the elements of the ‘Framework for management of drinking water quality’ (as set out in the ADWG)that are relevant to the operations of the supplier of drinking water concerned. A supplier of drinking water must provide the Director-General with a copy of its most recent quality assurance program. The Director-General may arrange for a drinking water supplier’s quality assurance program to be reviewed at any time.
Under the Queensland Public Health Act 2005, a drinking water service provider must not supply drinking water that the provider knows, or reasonably ought to know, is unsafe (similar to the Victorian Food Act). The drinking water standards set under the Public Health Regulation are nilE. coli/100 mL in any sample. If this standard is not met, a follow-up sample must be taken and tested. There is also an annual standard of nil E. coli/100 mL found in 98% of the samples taken for a 12-month period.
The Queensland Water Supply (Safety and Reliability) Act 2008 also applies to all drinking water service providers. In general this includes all councils or businesses involved in treating, transmitting or reticulating water for drinking purposes. Each provider is required to have a drinking water quality management plan in place, and comply with the details of the plan.
Under the South Australian Safe Drinking Water Act 2011, the items listed below are required under the Act and apply to all drinking water providers:
• registration as a drinking water provider• implementation of a risk management plan• provision of water quality results to consumers• audits and inspections• water quality testing carried out by an approved laboratory.

55
Regulation 4 of the South Australian Safe Drinking Water Regulations imposes a general obligation on drinking water providers to observe the ADWG.
In Tasmania, public drinking water is primarily provided by TasWater. Managing drinking water is in accordance with s. 128 of the Public Health Act 1997, which requires drinking water suppliers to manage water in a manner that does not pose a threat to public health. Tasmania’s Drinking water quality guidelines establish best practice frameworks for controlling authorities to effectively manage drinking water quality. Water suppliers must monitor the quality of their drinking water supplies and take corrective action if drinking water quality is, or is likely to become, a threat to public health. Some of these guidelines are legally enforceable. One of these is for drinking water ‘not to be considered a threat to public health it must comply with the health guideline values contained inthe ADWG’. Each year water suppliers submit a report to the Director of Public Health detailing monitoring and management activities which is published annually.
The Western Australian Department of Health regulates drinking water in that state. All drinking water service providers must comply with the ADWG, as a requirement of operating licences issued bythe Economic Regulation Authority (The water industry is a regulated industry under the Economic Regulation Authority Act 2003). The department requires drinking water service providers in the state to monitor their systems and report the results to the department.
The proposed Victorian regulations are therefore in line with other jurisdictions in Australia as the standards that must be met are in accordance with the ADWG. The key difference between the proposed Victorian regulations and other states is the minimum sampling requirements for three parameters, which only a few businesses identified in the July 2014 survey as beyond what they would do under the base case.
It is important to note that Victorian water businesses are under state government ownership rather than local government or private ownership as occurs in some other states. This has enabled Victoria to move to a process-based regulatory approach, delivering more benefits in terms of lower risks to public health at a modest incremental cost and facilitating shared responsibility betweenthe government regulator and the government corporations. Victoria’s provisions for public interest disclosures about performance and noncompliance is paramount to ensure accountability and to safeguard the integrity of the state’s public water supply.

56
6 Implementation and enforcement issues
New regulations will be drafted to commence on the day following expiration of the current regulations. New regulations, however, can provide certain provisions to come into effect at some specified date later than the beginning of the regulations. Elements of the proposed regulations that may require administrative changes will specify an appropriate lead-in time before they begin operation. The proposed regulations will allow a lead-in time for the inclusion of a methodologyto quantify microbial risk in risk management plans. This is an administrative function and the lead-in time will enable water businesses to plan and adjust appropriately to the changes. The department will provide advice and guidance as necessary to assist water businesses in implementing proposed changes.
The main methods of ensuring compliance with the proposed regulations will be through monitoring water quality sampling results, reporting and auditing risk management plans, which is established by the Act.
If necessary under s. 29 of the Act, the department may, by written notice, require a water supplier or water storage manager to give the Secretary any specified information that the Secretary reasonably requires to enable the Secretary to carry out his or her functions under this Act. This includes specified information in relation to the action taken by the supplier to comply with any water quality standards that apply to the supplier. A water supplier or water storage manager must comply with a requirement within the time specified by the Secretary.
Also, if necessary, under s. 31 of the Act, the department may give a water supplier or water storage manager a written notice requiring it, within a reasonable time specified in the notice, to take, or to refrain from taking, any action specified in the notice. A water supplier or a water storage manager must comply with the requirement, unless it has a reasonable excuse for not doing so.
57
7 Evaluation strategy
According to the Victorian guide to regulation:
An important feature of best practice regulation is that it is reviewed regularly to transparently assess whether it still represents the most appropriate means of meeting the specified objectives. If the objectives are not being met, then consideration should be given to changing the design, implementation or enforcement of the regulation, or to relying on other measuresto achieve the desired outcomes. The evaluation of regulations that are due to sunset is particularly important to make sure that suboptimal regulation is not rolled over.
Department of Treasury and Finance 2014, p. 35
The review of the current regulations has identified a number of elements that have achieved their purpose and have been altered or removed from proposed regulations.
Over the next 10 years, the effectiveness of the proposed regulations in meeting the policy objectives should be evaluated, and any unintended consequences should be identified using the following indicators:
• incidence of any outbreaks of acute disease from drinking water supplies• evidence of any chronic waterborne illnesses• levels of compliance with the regulations and drinking water standards• levels of public complaints regarding water quality• equity in costs to water businesses• equal access to safe and good-quality water for consumers.The detailed design and implementation of such studies will, of course, be subject to budgetary considerations.

58
8 Conclusions
The main conclusions and findings of the RIS are as follows:
1. The main residual problem to be addressed by the proposed regulations is risk to public health from unsafe drinking water. A related problem is the retention of community confidence in safe drinking water supplies. Although not a ‘problem’ in its own right, regulatory burden needs to be considered when addressing the problems of risk to public health and retention of community confidence in safe drinking water supplies.
2. Having regard to the purposes of the Act and the above discussion, to solve the problems identified in this RIS the following overarching policy objectives of the regulatory proposal are identified as:Primary objective:
• To ensure the safety of Victoria’s drinking water supplies while minimising regulatory burden
where feasible and appropriate.Secondary objectives:
• To retain public confidence in the safe management of drinking water.• To provide equal access to safe and good-quality water for consumers.
3. Remaking the existing regulations (Option A) will incur the highest incremental costs of $3.97 million. The other options considered (Options B, C and D) have identical incremental costs of$2.9 million in 2014 dollars.
4. The RIS demonstrates Option B is a very low cost legislative instrument that provides a net benefit to society. Based on a qualitative analysis Option B is seen as the most effective in dealing withthe residual problems both in relation to risk management plans by requiring additional information and, to a lesser degree, by requiring more stringent requirements in relation to the water quality standards with respect to E. coli and turbidity.
5. The qualitative analysis of the RIS also demonstrates the importance of these mechanisms required to adequately protect public health, which supports the case to continue regulating this activity.
6. In terms of providing equitable access for consumers to good quality drinking water, Option Bprovides the same level of equity as all of the options.
7. The markets affected by the proposed regulations include the markets for both water storage and water supply, which are monopolies and not subject to any possible further restriction of competition. Other markets are for resorts, which are open to competition for visitors.
8. None of the water businesses are a small business in terms of the strict ABS definition. However, some of the rural/regional water suppliers might be considered ‘small’ in relative terms on the basis of the volume of water supplied and their customer base. There are eight water businesses that supply less than the industry average in rural/regional Victoria. Moreover, water supply components of resorts could be viewed as ‘small’ operations within larger businesses; however, they are not small businesses in their own right. The proposed regulations would not significantly impact on any type of these ‘smaller’ businesses.

59
Appendix 1: Summary of water industrybusiness data
A1.1 Summary industry statisticsA breakdown of the Victorian water storage and water supply industry is given in Table A1.1. As shown, the majority of businesses are classified as water suppliers (retailers to consumers). The size distribution of water businesses is based on Australian Bureau of Statistics (ABS) classificationsystem for small (fewer than 20 employees), medium (20–200 employees) and large (more than 200 employees) (ABS 2001) businesses. A summary of this distribution is given in Table A1.2. The size of an organisation may not necessarily reflect the scope of its operations with respect to water supplyper se, such as with Parks Victoria. However, size does reflect the ability of an organisation to absorbadditional costs.
Table A1.1: Distribution of water businesses by category and size
Metro/ruralCategory of business18 Name of business regional19 Employees20 Size
Water supplier Westernport Water Regional 60 Medium
Water supplier East Gippsland Water Regional 88 Medium
Water supplier South Gippsland Water Regional 90 Medium
Water supplier Western Water Regional 106 Medium
Water supplier Coliban Water Regional 137 Medium
Water supplier North East Water Regional 151 Medium
Water supplier Lower Murray Water Rural 164 Medium
Water supplier Central Highlands Water Regional 188 Medium
Water supplier Goulburn Valley Water Regional 201 Large
Water supplier Gippsland Water Regional 262 Large
Water supplier City West Water Metropolitan 372 Large
Water supplier Barwon Water Regional 417 Large
Water supplier South East Water Metropolitan 598 Large
Water supplier Wannon Water Regional 217 Large
Water supplier Yarra Valley Water Metropolitan 693 Large
Water storage manager Southern Rural Water Rural 162 Medium
Water storage manager Goulburn-Murray Water Regional 702 Large
Water storage manager(water treatment)
Water storage manager and supplier
Melbourne Water Metropolitan 834 Large
Grampians Wimmera Mallee Water Regional 185 Medium
Resort manager Mount Hotham Alpine Resort Regional 24 Medium
Mount Buller andResort manager Regional 31 Medium
Mount Stirling Alpine Resort
Resort manager Falls Creek Alpine Resort Regional 34 Medium Resort manager Lake Mountain Alpine Resort Regional 106 Medium Resort manager Mount Baw Baw Alpine Resort Regional 118 Medium Resort manager Parks Victoria Regional 1109 Large
18 Categories based on industry survey (June 2014)19 See Department of Environment and Primary Industries 201420 Business websites and annual reports 2011–12

60
As shown in Table A1.2 the majority of water businesses are medium-sized rural/regional watersuppliers. There are four metropolitan water businesses and 21 rural/regional water businesses.
Table A1.2: Summary of size and category distribution of water businesses
Category of water business
(metropolitan/rural/regional)Medium
(a)Large
(b)
Total(c) = (a)
+ (b)
% of water businesses
(d)
Water storage managers (metropolitan) 0 1 1 4.0%
Water storage managers (rural/regional) 1 1 2 8.0%
Water suppliers (metropolitan) 0 3 3 12.0%
Water suppliers (rural/regional) 8 4 12 48.0%
Water storage manager/water supplier (rural/regional) 1 0 1 4.0%
Resort managers (regional) 5 1 6 24.0%
Total 15 10 25 100.00%
The annual revenue, volume of water supplied, customers supplied and population supplied is summarised in Table A1.3. Total annual revenue for water suppliers is estimated to be around $2.91 billion. City West Water, South East Water and Yarra Valley Water serve a combined estimated population of approximately 4.21 million (roughly 75% of the total Victorian population supplied with drinking water).

61
Table A1.3: Summary of water supply industry, 2012–13
Water supplierAnnual
revenue21
Volume water
supplied (ML)22
Customers supplied23
Population supplied24
% of population supplied
Barwon Water $200,551,000 30,726 142,494 295,799 5.26%
Central Highlands Water $90,140,000 12,397 63,934 130,000 2.31%
City West Water $477,877,000 103,231 389,551 867,799 15.44%
Coliban Water $98,515,000 18,757 70,852 130,000 2.31%
East Gippsland Water $32,523,000 4,812 25,135 36,400 0.65%
Gippsland Water $128,944,000 60,842 64,000 150,000 2.67%
Goulburn Valley Water $73,682,000 26,220 58,823 129,000 2.30%
Lower Murray Water $65,291,000 18090 32,261 137,076 2.44%
North East Water $63,412,000 14,687 47,499 118,967 2.12%
South East Water $706,742,000 140627 682,450 1,600,000 28.47%
South Gippsland Water $27,918,000 4,719 19,237 27,980 0.50%
Wannon Water $76,680,000 11,620 41,550 80,000 1.42%
Western Water $82,261,000 12,830 55,481 158,290 2.82%
Westernport Water $20,626,000 1,802 15,561 17,679 0.31%
Yarra Valley Water $763,077,000 149,635 723,256 1,740,000 30.97%
Total $2,908,239,000 610,995 2,432,084 5,618,990 100.00%
The annual revenue and volume of water supplied to water suppliers by water storage managers is summarised in Table A1.4. Total revenue for water storage managers is estimated to be around$1.49 billion per annum. There is one combined water storage manager and supplier in Victoria andrevenue is around $56.5 million per annum (see Table A1.5).
Table A1.4: Summary of water storage managers, 2012–13
Water business name Annual revenue25 Volume water supplied (ML)26
Goulburn-Murray Water $185,545,000 $1,751,000
Melbourne Water $1,270,805,000 $404,260
Southern Rural Water $30,461,000 $184,088
Total $1,486,811,000 2,339,348
21 Data obtained from 2012–13 annual reports.22 Data obtained from 2010–13 annual reports.23 Data obtained from 2012–13 annual reports.24 Data obtained from water business websites.25 Data obtained from 2012–13 annual reports26 Data obtained from 2012–13 annual reports

62
Table A1.5: Summary of water storage manager and water supplier, 2012–13
Water business name Annual revenue27 Volume water supplied (ML)28
Grampians Wimmera Mallee Water $56,499,000 69,671
Total $56,499,000 69,671
Resort managers generate a combined income of $303 million per annum, of which 85%goes to Parks Victoria (see Table A1.6).
Table A1.6: Summary of resorts, 2012–1329
Resort Annual revenue
Falls Creek Alpine Resort $10,175,035
Lake Mountain Alpine Resort $5,564,779
Mount Baw Baw Alpine Resort $6,980,322
Mount Buller and Mount Stirling Alpine Resort $12,466,000
Mount Hotham Alpine Resort $10,091,000
Parks Victoria $257,933,000
Total $303,210,136
27 Data obtained from 2012–13 annual reports28 Data obtained from 2012–13 annual reports29 Data obtained from 2012–13 annual reports
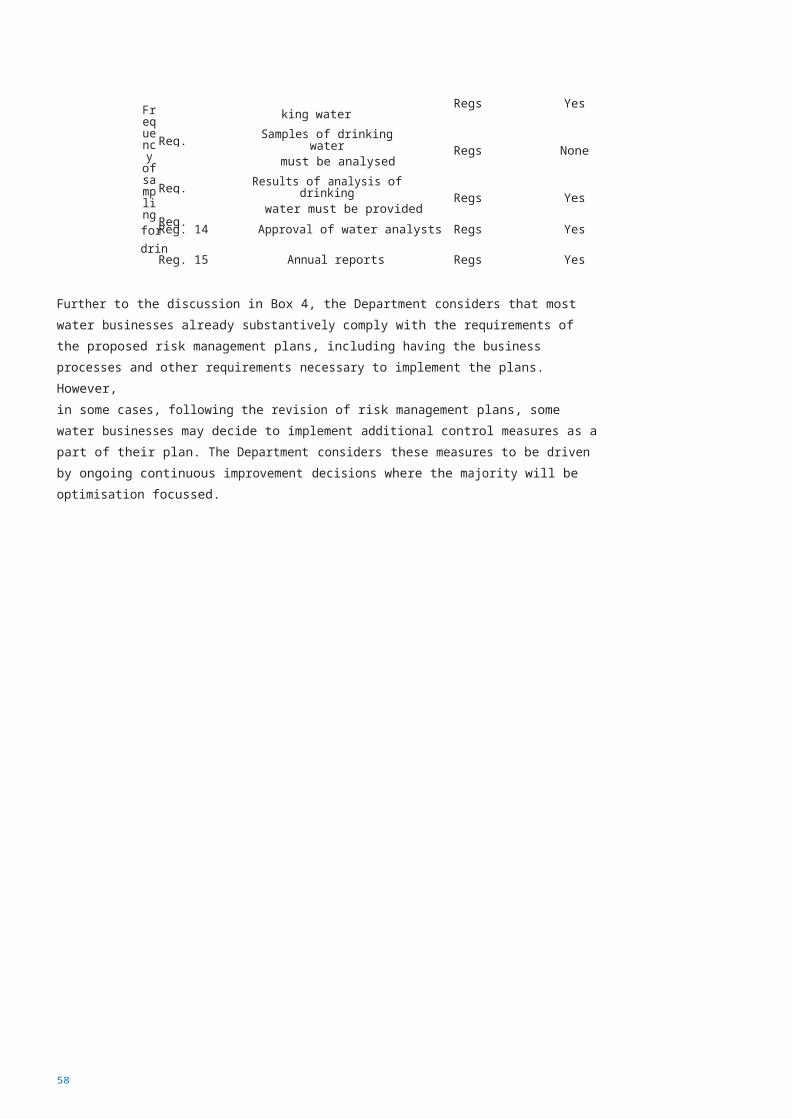
63
Appendix 2: Estimation of incremental costs
Appendix 2 provides the basis of cost estimation under each of the options including assumptions behind each of the cost estimates.
A2.1 Incremental costs of Option A– remaking the existing regulationsOption A would entail remaking of the existing regulations and all incremental costs considered are in relation to the base case.
A2.1.1 Estimated incremental annual costs of gazettal of water sampling localitiesThe department estimates the annual incremental cost of gazettal of water sampling localities based on one day’s work (7.6 hours) for a gazettal and two days’ work (15.2 hours) for a complex gazettal. The department processes around seven gazettals every three years or around 2.33 gazettals per annum, with one complex gazettal each year. The weighted average number of hours for each gazettal per annum is therefore 10.86 hours:
1/2.33 x15.2 + 1.33/2.33 x 7.6 = 10.86 hrs
An hourly rate of $88.84 per hour is calculated as follows:
Hourly rate = Annual earnings / (Annual weeks worked x average weekly hours) x on-cost multiplier × overhead cost multiplier = $88.84
Where:
Annual earnings = $85,000/annum Annual weeks worked = 44 weeks Average weekly hours = 38hrs30
On-cost multiplier = 1.165Overhead cost multiplier = 1.5
Given that each gazettal takes a weighted average of 10.86 hours to process at a charge of $8931
per hour, the annual staff cost is given as approximately $2,252:
10.86hrs × 2.33 × $88.84/hr = $2,251.53
Apart from staff time, actual gazettal cost for the department across seven applications of $21,77132 provides an average cost of $3,110.16 per unit. Given that there are 2.33 gazettals per annum this would make the non-staff related gazettal cost equal to $7,257 per annum. The total incremental gazettal cost to government is therefore estimated to be $9,509 per annum. Over 10 years and in present value dollars this would be $77,123, as shown in Table A2.1.
30 Guarantee of maximum ordinary hours in the Commonwealth Workplace Relations Act 1996.31 This is rounded for presentation purposes only and all calculations are performed on $88.84.32 Value provided by the department.
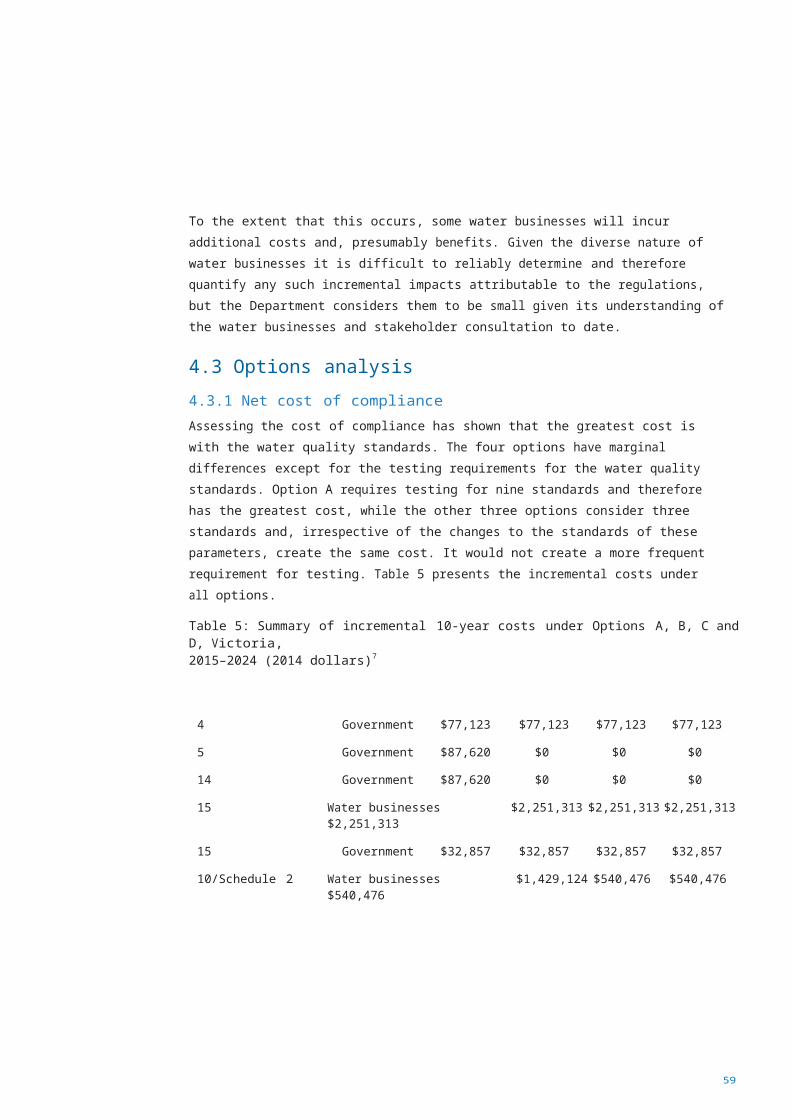
64
Table A2.1: Incremental cost of gazettal of water sampling localities to the department under Option A
Category Annual gazettal cost
Government $9,509
10-year cost $95,086
10-year PV cost (4% discount) $77,123
The July 2014 online survey determined the activity of gathering information about localities by businesses as being part of the base case. That is to say in order to provide safe drinking water, water businesses would need to know their water sampling points and the localities in whichwater sampling points occurred. The actual cost to water businesses of providing that information to the department for an average of 2.33 gazettals of water sampling localities per annum is takento be the cost of sending existing information via email and is therefore determined to be a negligible cost to regulation.
A2.1.2 Estimated incremental annual cost of approval of water sampling points The estimated annual incremental cost of maintaining a register of water sampling points would involve 16 days of work for a salary of $85,000. Given an estimated hourly rate of $88.84 and7.6 hours per day the following annual cost of $10,803 is estimated:
7.6hrs × 16 days × $88.84 = $10,802.73
Over 10 years and in present value dollars this would be $87,620, as shown in Table A2.2.
Table A2.2: Incremental cost of maintaining a register of water sampling points to the department under Option A
Category Annual gazettal cost
Government $10,803
10-year cost $108,027
10-year PV cost (4% discount) $87,620

65
A2.1.3 Estimated incremental annual cost of approval of water analysts Approval of water analysts would involve 16 days of work for a salary of $85,000. Given an estimated hourly rate of $88.84 and 7.6 hours per day the following annual cost of $10,803is estimated:
7.6hrs × 16 days × $88.84 = $10,802.73
Over 10 years and in present value dollars this would be $87,620, as shown in Table A2.3.
Table A2.3: Incremental cost of approval of water analysts under Option A
Category Annual gazettal cost
Government $10,803
10-year cost $108,027
10-year PV cost (4% discount) $87,620
A2.1.4 Estimated incremental cost for annual reportsFor the purpose of estimation it has been noted that the annual cost of supplying additional details includes the following assumptions:
• 70% of an annual salary of $48,000 for the relevant staff member ($33,600)• hourly rate of $35.12/hr (including on-costs and overhead costs and using the same
multipliers as under section 2.1.1 of Appendix 2)
• eight weeks per annum dedicated to preparing the details for the annual report(38hrs × 8 = 304hrs).
The estimated annual cost of preparing additional details to be included in annual reports is therefore $10,676 (304hrs × $35.12/hr) per water supplier, water storage manager or resort manager. As shown in Table A2.4, the incremental cost to water businesses of preparing details for annual reports is estimated to be $277,567 or $2.25 million over 10 years in present value2014 dollars.
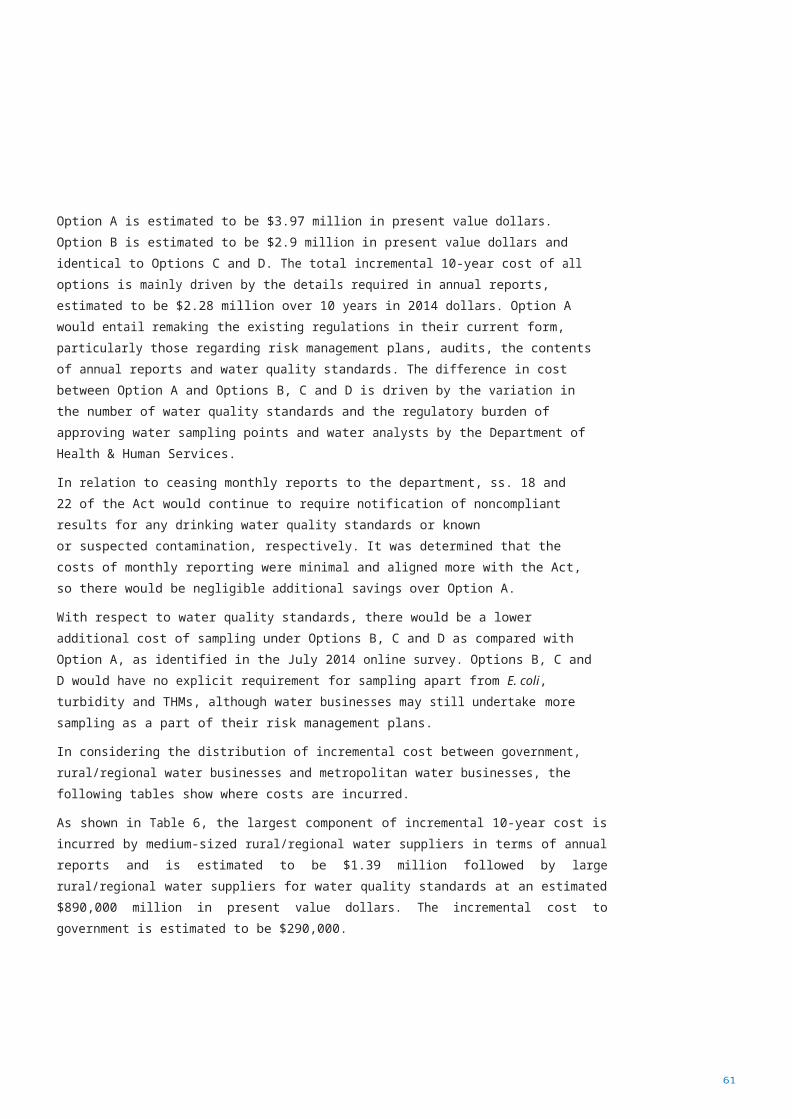
66
Table A2.4: Distribution of incremental cost of preparing annual reports under Option A
Category of water business(metropolitan/rural/regional)
Medium(d) = (a)33 ×
$10,676
Large(e) = (b)34 ×
$10,676
Total cost of details for annual report (f)
= (d) + (e)
Water storage managers (metropolitan) $0 $10,676 $10,676
Water storage managers (rural/regional) $10,676 $10,676 $21,351
Water suppliers (metropolitan) $0 $32,027 $32,027
Water suppliers (rural/regional) $85,405 $42,703 $128,108
Water storage manager/water supplier(rural/regional) $10,676 $0 $10,676
Resort managers (regional) $64,054 $10,676 $74,729
Total $170,810 $106,756 $277,567
10-year PV cost (4% discount rate) $1,385,424 $865,890 $2,251,313
This also requires government staff to cross-check data on the annual reports including collation (38 hours) and checking off information (7.6 hours) at an annual salary of $85,000 per annum, not including on-costs and overhead costs. The total annual cost of cross-checking annual reports for government is estimated to be $4,051:
38hrs × $88.84/hr + 7.6hrs × $88.84/hr = $4,051
As shown in Table A2.5, the incremental annual cost to government of checking details of annual reports is estimated to be $32,857 over 10 years in present value 2014 dollars.
Table A2.5: Incremental cost of checking annual reports under Option A
Category of business Annual cost of gazettal
Government $4,051
10-year cost $40,510
10-year PV cost (4% discount) $32,857
A2.1.5 Estimated incremental cost of sampling for meeting water quality standardsThere are several water businesses that have identified additional resources required for sampling in order to meet water quality standards, under Option A. The additional annual and one-off resource requirements for meeting the standard are illustrated in Table A2.6.
33 See Table A1.2 for source of estimates.34 See Table A1.2 for source of estimates.
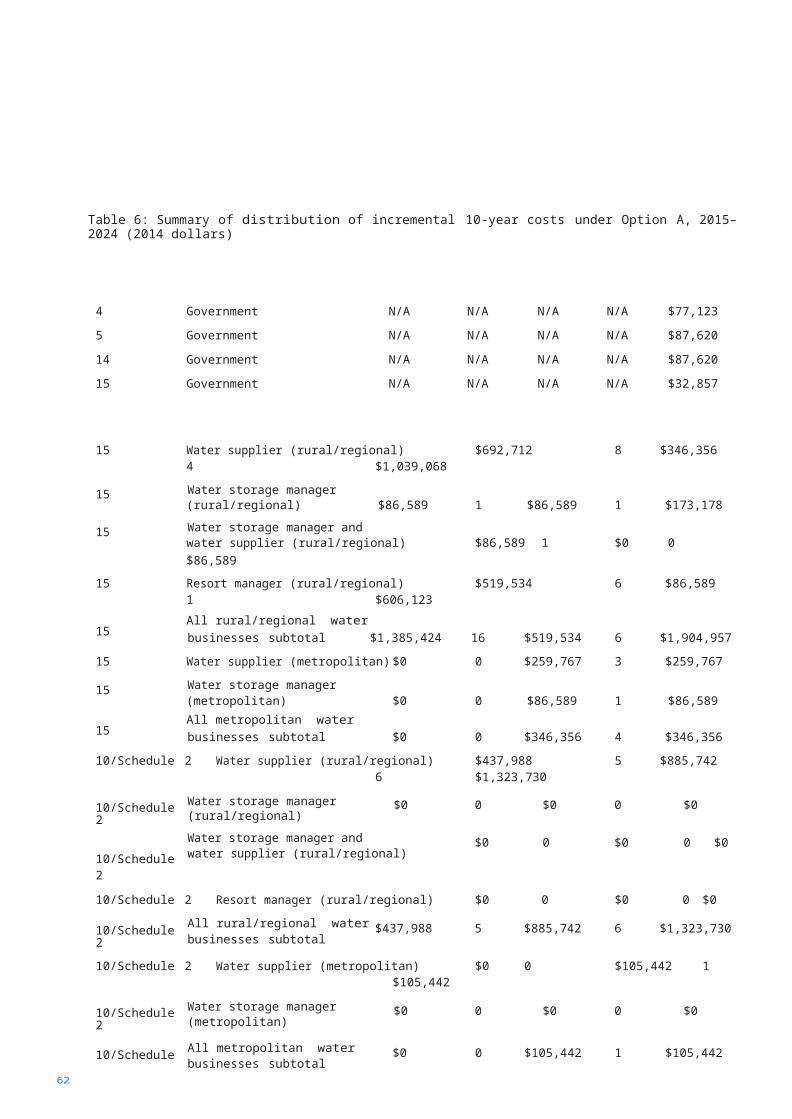
67
Table A2.6: Resource requirements and incremental cost for meeting water quality standards under Option A35
Type of water business/ Schedule2 element
Equipment/activity
Salary or unit cost (g)
Salary with on-costs
and overheads
% allocation
(h)
No. of activity/
equipment (i)
Annual one-off
cost
Cost (j)=(g) × (h) × (i) or (g)
with on/overhead
costs × (h) × (i)
E. coli
None None None None None None None None
Turbidity
Medium regional water supplier Sampling $5,000 N/A 5.00% 52 Annual $13,000
Large regional water supplier Sampling $70,000 $122,325 5.00% 1 Annual $6,116
Trihalomethanes (THMs)
Large regional water supplier Sampling $100 N/A 100.00% 1 Annual $100
Large regional water supplier Capital36 $26,667 N/A 100.00% 15 One-off $400,000
Chloroacetic acid
Medium regional water supplier Sampling $5,000 N/A 5.00% 12 Annual $3,000
Large metropolitan water supplier Sampling $3,250 N/A 100.00% 4 Annual $13,000
Dichloroacetic acid
Medium regional water supplier Sampling $5,000 N/A 5.00% 52 Annual $13,000
Trichloroacetic acid
Medium regional water supplier Sampling $5,000 N/A 5.00% 52 Annual $13,000
Aluminium
Medium regional water supplier Sampling $1,000 N/A 100.00% 12 Annual $12,000
Large regional water supplier Sampling $70,643 $123,449 5.00% 1 Annual $6,172
Large regional water supplier Sampling $59 N/A 100% 416 Annual $24,700
Algal toxin37
Large regional water supplier Sampling $70,643 $123,449 20.00% 1 Annual $24,690
As shown in Table A2.7, the incremental cost of sampling to meet existing water quality standards under Schedule 2 is estimated to be $1.43 million over 10 years in present value 2014 dollars.
35 All data obtained from the July 2014 online survey.36 Capital cost confirmed by Department of Health & Human Services as required by business to meet sampling requirements
under existing water quality standards.37 Algal toxin, pathogen, substance or chemicals a water business tested for would be a function of the risk
assessment for each individual water supply system, and the frequency of testing would be based on advice in the ADWG.

68
Table A2.7: Distribution of incremental cost of meeting water quality standards under Option A
Category of water business(metropolitan/rural/regional) Medium Large Total
Water storage managers (metropolitan) $0 $0 $0
Water storage managers (rural/regional) $0 $0 $0
Water suppliers (metropolitan) $0 $13,000 $13,000
Water suppliers (rural/regional) $54,000 $61,778 $115,778
Water storage manager/water supplier (rural/regional) $0 $0 $0
Resort managers (regional) $0 $0 $0
Total annual cost $54,000 $74,778 $128,778
Total one-off cost $0 $400,000 $400,000
10-year PV cost (4% discount rate) $437,988 $991,135 $1,429,124
As shown in Table A2.8, the incremental 10-year cost of remaking the existing regulations underOption A is estimated to be $3.97 million in present value 2014 dollars.
Table A2.8: Summary of incremental 10-year costs under Option A (2014 dollars)
Regulationnumber Description
Gazettal of water
Cost imposed on Medium Large Total
4sampling localities
Government N/A N/A $77,123
Approval of water5sampling points
Government N/A N/A $87,620
Approval of14water analysts
Government N/A N/A $87,620
Details of15annual reports
Water businesses $1,385,424 $865,890 $2,251,313
Details of15annual reports
Government N/A N/A $32,857
Schedule 2 Water standards Water businesses $437,988 $991,135 $1,429,124
10-year PV cost(4% discount rate)
$1,823,412 $1,857,025 $3,965,657

69
Table A2.9 summarises the distribution of incremental cost between government, rural/regional water businesses and metropolitan water businesses.
Table A2.9: Summary of distribution of incremental 10-year costs under Option A (2014 dollars)
Regulation Stakeholder Medium Large Total
4 Government N/A N/A $77,123
5 Government N/A N/A $87,620
14 Government N/A N/A $87,620
15 Government N/A N/A $32,857
All regulations Government total 10-year cost N/A N/A $285,220
15 Water supplier (rural/regional) $692,712 $346,356 $1,039,068
15 Water storage manager (rural/regional) $86,589 $86,589 $173,178
15 Water storage manager and water supplier(rural/regional) $86,589 $0 $86,589
15 Resort manager (rural/regional) $519,534 $86,589 $606,123
15 All rural/regional water businesses subtotal $1,385,424 $519,534 $1,904,957
15 Water supplier (metropolitan) $0 $259,767 $259,767
15 Water storage manager (metropolitan) $0 $86,589 $86,589
15 All metropolitan water businesses subtotal $0 $346,356 $346,356
10/Schedule 2 Water supplier (rural/regional) $437,988 $885,694 $1,323,682
10/Schedule 2 Water storage manager (rural/regional) $0 $0 $0
10/Schedule 2 Water storage manager and water supplier (rural/regional) $0 $0 $0
10/Schedule 2 Resort manager (rural/regional) $0 $0 $0
10/Schedule 2 All rural/regional water businesses subtotal $437,988 $885,694 $1,323,682
10/Schedule 2 Water supplier (metropolitan) $0 $105,442 $105,442
10/Schedule 2 Water storage manager (metropolitan) $0 $0 $0
10/Schedule 2 All metropolitan water businesses subtotal $0 $105,442 $105,442
All regulations Rural/regional water businesses total 10-year PV cost $1,823,412 $1,405,227 $3,228,639
All regulations Metropolitan water businesses total 10-year PV cost $0 $451,798 $451,798
Total cost Government and water businesses 10 year PV cost $1,823,412 $1,857,025 $3,965,657

70
A2.2 Incremental costs of Option B, C and D– proposed regulationsOptions B, C and D are variations of the proposed regulations.
A2.2.1 Estimated incremental cost of sampling for water quality standards There are several water businesses that have identified additional resources required for sampling in order to meet the proposed water quality standards for E. coli, turbidity and THMs. However,the department advises that despite responses by several water businesses, the minimum cost ofthis under Option B would be related to costs of frequency of sampling should a business say they would not sample at that frequency anyway in the absence of regulations. So this means that itis expected that under Options B, C and D the cost of sampling in relation to E. coli, turbidity and THMs to be the same as the cost of the three parameters in Option A. The department does not believe an increase in the sampling would enable a business to better meet the quality standard.
Subsequently, the additional estimated annual and one-off resource requirements for meeting the water quality standards under Options B, C and D are illustrated in Table A2.10.
Table A2.10: Resource requirements and estimated incremental cost for water quality standards under Options B, C and D38
Type of water business/ Schedule2 element
Equipment/activity
Salary or unit cost (g)
Salary with on-costs
and overheads
% allocation
(h)
No. of activity/
equipment (i)
Annual one-off
cost
Cost (j)=(g) × (h) × (i) or (g)
with on/overhead
costs × (h) × (i)
E. coli
None None None None None None None None
Turbidity
Medium regional water supplier Sampling $5,000 N/A 5.00% 52 Annual $13,000
Large regional water supplier Sampling $70,000 $122,325 5.00% 1 Annual $6,116
Trihalomethanes (THMs)
Large regional water supplier Sampling $100 N/A 100.00% 1 Annual $100
Large regional water supplier Capital39 $26,667 N/A 100.00% 15 One-off $400,000
38 All data obtained from the July 2014 online survey.39 Capital cost confirmed by the department as required by business to meet sampling requirements under existing water
quality standards.
71
As shown in Table A2.11, the incremental 10-year cost of the proposed regulations under Options B, C and D is estimated to be $2.9 million in present value 2014 dollars. As compared with Option A, there would be savings in terms of the government no longer needing to approve water sampling points or water analysts. In regard to monthly reporting, government would rely on ss. 18 and 22 of the Act to manage the notification of noncompliant results for any drinking water quality standards. This cost is aligned with the Act so the cost of regulations to businesses for monthly reportingwere considered negligible, so there would be only negligible additional savings over Option A. With respect to Schedule 2, there would be a lower additional incremental cost of sampling under Options B, C and D, as compared with Option A. Algal toxin, pathogen, substance or chemicals a water business tested for would be a function of the risk assessment for each individual water supply system, and the frequency of testing would be based on advice in the ADWG. Options B, C and Dwould have no additional requirements for sampling for E. coli, turbidity and THMs.
Table A2.11: Summary of incremental 10-year costs under Options B, C and D (2014 dollars)
Regulation number Cost imposed on Medium Large Total
4 Government N/A N/A $77,123
15 Water businesses $1,385,424 $865,890 $2,251,313
15 Government N/A N/A $32,857
Schedule 2 Water businesses $105,442 $435,035 $540,476
10-year PV cost (4% discount rate) $1,490,865 $1,300,924 $2,901,770

41
72
Appendix 3: Estimation of quantifiableincremental benefits
A3.1 Quantifiable incremental benefitsThe estimation of quantifiable benefits in this RIS is based on incremental cost savings arising from protection of public health in the form of reducing the risk of gastroenteritis outbreaks/cases.
In order to establish the incremental benefits under the options the following health and mortality cost assumptions have been made:
• The societal cost of an epidemic outbreak would be $163.64 per person in 1995 prices, based
on a Monash University and ANU report on an outbreak on a town of 11,000 people (Department of Epidemiology et al .1997).This is equivalent to $267.84 per person in 2014 prices40.
• The cost of a death to society is based on a value of statistical life (VSL), which represents how much society is willing to pay to reduce the risk of death. The VSL estimate demonstrates the financial value society places on reducing the average number of deaths by one and is given as$3.5 million in 2007 (OBPR 2008). This is equivalent to $4,216,724 in 2014 prices.
A3.1.1 Potential health costs of an outbreakCase studies from similar (developed) countries with inadequate water quality regulations and monitoring help to provide the magnitude of what could potentially happen with an outbreak. The following specific outbreaks in Milwaukee, Östersund and Walkerton are used as examples where people become ill or die.
These cases of specific outbreaks are summarised in Table A3.1. The average number of people becoming ill with IID (infectious intestinal disease) in an outbreak is around 144,100, with around39.31% of the total population affected on average. The risk of death is more prevalent in thosewith suppressed immune systems.
Table A3.1: Specific outbreaks in developed countries as a result of inadequate regulation and monitoring of water quality
Country/location Study Year
Population affected by
IIDPathogen
behind outbreak
Population affected as% of totalpopulation Deaths
No. deaths as% of those
affected
USA/Milwaukee Mackenzieet al. 1994
1993 403,000 Cryptosporidium 25.00% 69 0.017%
Canada/Walkerton
Sweden/Östersund
Salvadoriet al. 2009
2000 2,300 Campylobacter jejuni 47.92% 7 0.304%
Widerströmet al. 2014
2010 27,000 Cryptosporidium 45.00% 0 0.000%
Average 144,100 39.31% 25 0.107%
40 Conversion to 2014 dollars based on CPI index of 64.7 and 105.9 for June 1995 and June 2014, respectively (see ABS2014b)

73
41 Sixty-nine deaths, of which 93% occurred in people with AIDS. See more at <http://www.waterandhealth.org/milwaukee-1993-largest-documented-waterborne-disease-outbreak-history/#sthash.tUjX6qJv.dpuf>.2014b)

74
A3.1.2 Estimated costs of a Milwaukee-type scenario in a Victorian context In the Milwaukee 1993 outbreak, where Cryptosporidium had contaminated the city’s public water supply, approximately 64 people or 93% of the 69 deaths in 1993 involved people withAIDS. Another waterborne outbreak in 1994 in Las Vegas, Nevada led to the deaths of 41 AIDSpatients (Goldstein et al. 1996). This is used to consider the impacts on people with compromised immune systems.
In order to estimate the cost of mortality during an outbreak in a Victorian setting the following assumptions are made:
• The population served by the largest water supplier in Victoria is estimated to be 1.74 millionand represents 30.97% of the total population of an estimated 5.62 million.42
• In 2011 the number of AIDS patients in Victoria was 2,282.43
• AIDS patients who died in Milwaukee in 1993 (64) as a proportion of total populationof AIDS patients in 1995 (653 ) is estimated to be 9.8%.44
• The total population of AIDS patients in Victoria affected by an outbreak is estimatedto be 69 (2,282 × 30.97% × 9.8% = 69).
• The probability of an outbreak occurring is 1.75%.45
• The estimated number of mortalities from a waterborne outbreak is 1.22 (69 × 1.75%).• The VSL as at June 2014 is estimated to be $4,216,724.46
The cost of mortality during an outbreak in Victoria is therefore estimated to be $4,216,724 × 1.22 mortalities = $5.12 million or $4.21 million in 2014 present value dollars.
A3.1.3 Estimated environmental costs from reduced confidence in the water supplyWhile direct and indirect costs from reduced community confidence are not quantified in the estimates in sections 4 and 5, the Department has attempted to estimate the environmental costs from reduced confidence in the water supply leading to an increased quantity of plastic water bottles in landfill due to increased bottled water consumption.
Approximately 334,300 Victorians purchased bottled water in 2007, representing 16.8% of households (ABS 2007). Of notable interest is the discrepancy in the percentage of households consuming bottled water in Victoria as compared with NSW, as shown in Figure A3.1.
42 See Table A1.3 in Appendix 1.43 http://www.avert.org/australia-hiv-aids-statistics.htm44 http://www.cdc.gov/hiv/pdf/statistics_hivsur91.pdf (AIDS statistics not available for 1993)45 See discussion in section A3.1.1 of Appendix 3.46 Equal to the $3.5 million estimate in 2007 provided by OBPR adjusted using CPI index for 2007 and 2014 of 87.9 and

75
105.9, respectively.

Jan-
95
Jan-
96
Jan-
97
Jan-
98
Jan-
99
Jan-
00
Jan-
01
Jan-
02
Jan-
03
Jan-
04
Jan-
05
Jan-
06
Jan-
07
76
Figure A3.1: Comparison of percentage of households consuming bottled water, Victoria and NSW, 1995–2007
30.00
25.00
20.00
15.00
10.00
5.00
Victoria
New South Wales
0.00 Source: ABS 2007
The percentage of households consuming bottled water in the two states in March 1995 is similar at 1.3% and 2.5% for Victoria and NSW, respectively. By March 1998 the percentages were almost identical at around 10.5 for both states. However, a sharp divergence is seen post-March 1998, coinciding with the Sydney ‘boil water’ alerts. The Sydney boil water alerts in July to September1998 highlighted the scale of the impact that a system failure can have on an area (Department of the Environment 2001). An increased demand for bottled water started in 1998 when the Sydney drinking water scare forced the government to recommend bottled water or boiling tap water to avoid getting ill, resulting in a significant increase of sales in Sydney, and elsewhere, until tap water was deemed safe again (The Age National 2008).
Between 1998 and 2004 there was an increasing divergence between Victoria and NSW and convergence around March 2007, with percentages for Victoria and NSW at 16.8% and 18.5%, respectively. Holding all other demand factors constant and notwithstanding the decline in the percentage of households consuming bottled water in 2004, perhaps due to efforts to curb consumption for environmental reasons,47 confidence in the quality of drinking water is assumed to be an important factor in this divergence between Victoria and NSW during 1998 and 2007. The average divergence in the percentage of households drinking bottled water between Victoria and NSW between March 1998 and March 2007 is estimated to be 2.83%.
For the purpose of estimating the environmental cost of reduced confidence in mains drinking water as a result of an outbreak, it is assumed that for Victoria there would be 2.83% more households consuming bottled water. Taking the number of water supply customers (2,432,084) in Table A1.1as an approximate for the number of households in Victoria, a 2.83% increase under the base case would mean an additional 68,706 households or 158,736 consumers48 of bottled water as a consequence of reduced confidence in mains water.
47 The NSW town of Bundanoon, the University of Canberra, the Southbank campus of the Victorian College of Arts and the Monte Sant Angelo Mercy College in Sydney had bans on bottled water (see http://www.roymorgan.com/findings/bottled- water-consumption-slows-201304290244).
48 Assumes an average of 2.3 persons per household.
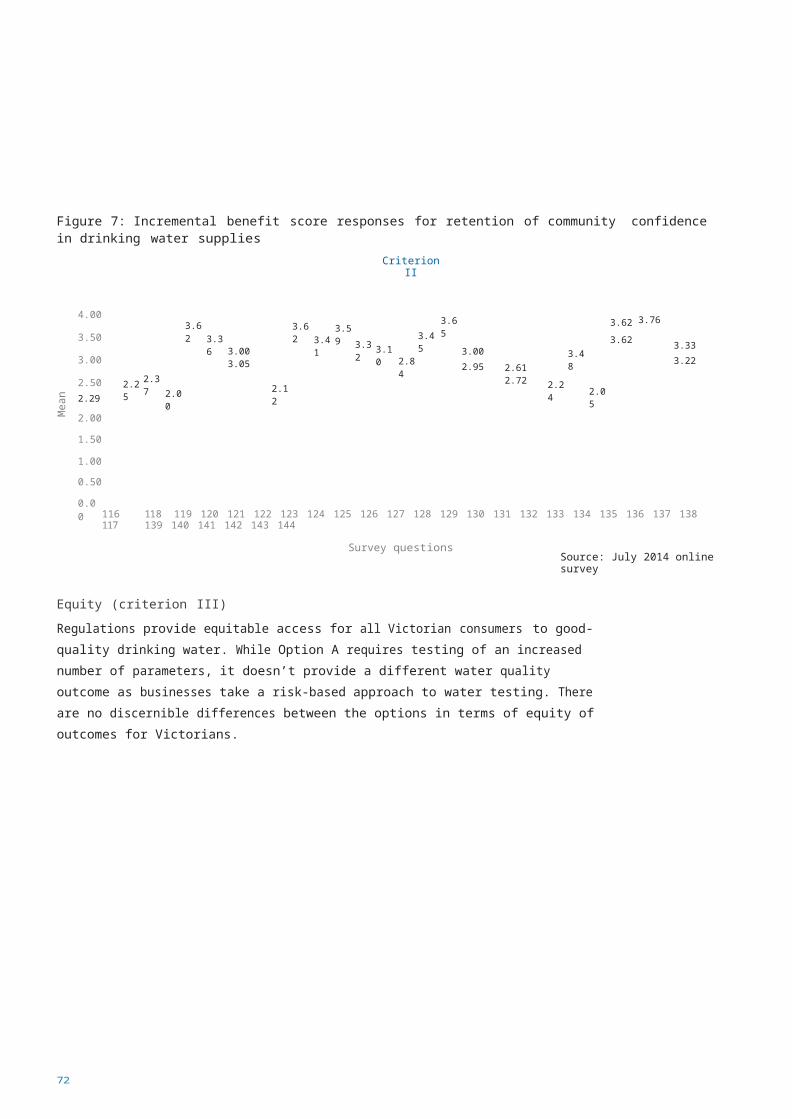
77
Taking that the average Australian consumer would drink 365 L49 of water per year, and that158,736 consumers would have reduced confidence in mains water, this would mean an additional57,938,811 L bottles of water consumed per annum as a consequence of reduced confidence in mains water. While there are costs associated with the production and transportation of bottled water, these are not considered as incremental costs but rather transfers from consumers to producers by way of prices paid. On the other hand, an estimated 60% of empty water bottles end up as landfill (Choice 2014) and the environmental cost is considered to be a real opportunitycost under the base case. A landfill levy (municipal and provincial) is used to provide additional and ongoing funding to support efforts by government, industry and the community to reduce waste (EPA Victoria 2014). This levy is used as a proxy measure for the social cost to the community ofadditional plastic waste from bottled water going into landfill. A schedule of levies based on a $58.50 per tonne – escalated by 10% per annum – is provided in Table A3.2.
Taking the average weight of a 1 L bottle to be 21.75 g,50 the estimated annual environmental costof reduced confidence with mains drinking water post fear of severe outbreak is therefore calculated as: 60% × 57,938,811 1 L bottles of water × 21.75 g × levy per tonne = 756 t × levy per tonne
As shown in Table A3.2, the 10-year risk adjusted environmental costs of plastic water bottles going to landfill is therefore estimated to be $13,614 or $10,709 in 2014 present value dollars.
Table A3.2: Estimated risk adjusted incremental cost of landfill waste arising from increased bottled water use, 2015–2024 (2014 dollars)
Year
Projected levy/tonne of landfill waste(r) = $58.50
in 2014 incrementedat 10% per annum
Estimated annual cost of landfill waste
(s) = (r) × 756 t
Risk adjusted annual cost of landfill waste
(t) = (s) × 1.75%
2015 $64.40 $48,693 $854
2016 $70.80 $53,532 $939
2017 $77.90 $58,900 $1,033
2018 $85.70 $64,798 $1,137
2019 $94.30 $71,300 $1,251
2020 $103.70 $78,408 $1,376
2021 $114.10 $86,271 $1,514
2022 $125.50 $94,891 $1,665
2023 $138.00 $104,342 $1,831
2024 $151.90 $114,852 $2,015
Total 10-year cost $775,987 $13,614
Total 10-year cost PV $610,425 $10,709
49 Assumes 1 L of water per day 365 days a year.50 A 2 L PET bottle weighs 42–45 g (see http://petresin.org/sustainability.asp). A 600 mL PET bottle weighs 12.8 g (see
http:// ccamatil.com/InvestorRelations/md/2012/Mount%20Franklin%20Easy%20Crush%20230412.pdf). The ratio of litre size and gram size between 2 L bottles and 600 mL bottles are both constant at around 3.33. Therefore the average weight of a 2 L bottle is taken to be 43.5 g and for a 1 L bottle, half that at 21.75 g.

78
Appendix 4: Summary of July 2014 onlinequestions and survey results
This appendix presents the questions and survey results with respect to cost and benefits components of the July 2014 online survey. One submission was provided per business. All data provided was grouped and de-identified for the purpose of the RIS.
A4.1 Survey outlineThis survey was designed in two parts to capture data (inputs) for the purpose of estimating incremental costs and ranking incremental benefits of the proposed regulations (current regulations and reforms) in relation to the ‘base case’. For the purpose of estimation and ranking, the base case was strictly defined as ‘the situations in which there are no safe drinking water regulations’.
To estimate incremental costs water businesses were asked the question ‘In the ABSENCE of any Safe Drinking Water Regulations (the base case) would you undertake particular activities administrative or other ANYWAY, necessary to demonstrate compliance with an element of the proposed regulations?’. This is detailed in Table A4.1.
Options provided in relation to incremental costs in the survey included:
• N/A – not applicable• yes – incremental cost is zero• no – details regarding resource requirements were required.When considering the proposed regulations in terms of costs, the following broad categories where considered:
• administrative compliance costs – for example, record keeping, reporting• other compliance costs – for example, machinery/equipment, training.Questions relating to incremental costs of existing and proposed regulations are summarised inTable A4.1.

79
Table A4.1: Incremental cost questions
Referencenumber Question
Water sampling localities
Would you undertake activities to specify a water sampling locality for the purpose1 of informing a water sampling program, in the ‘ABSENCE’ of any Safe Drinking
Water Regulations?
Approval of water sampling points
Would you seek to determine the distribution and appropriateness of water2 sampling points for risk management purposes, in the ‘ABSENCE’ of any Safe
Drinking Water Regulations?
Required content of risk management plans
Would you establish names, contact details, positions held by persons responsible3 for managing hazards and risks to water quality as part of your risk
management plan in the ‘ABSENCE’ of any Safe Drinking Water Regulations?
Would you undertake activities and measures to manage hazards and risks including4 developing a method for verification of the effectiveness of such activities and
measures in the ‘ABSENCE’ of any Safe Drinking Water Regulations?
5 Would you undertake activities and measures to manage hazards and risks including developing a method for verification of the effectiveness of such activities and measures including:
• developing operational procedures and process controls at each CCP• developing water sampling program• actions taken to improve employee awareness and training, including training
of water treatment operators and water sampling officers– in the ‘ABSENCE’ of any Safe Drinking Water Regulations?
Would you include features designed to assist in the management of risks to water6 quality, and methods for verifying the effectiveness of these features in the ‘ABSENCE’
of any Safe Drinking Water Regulations?
Would you include features designed to assist in the management of risks to water quality, and methods for verifying the effectiveness of these features and establish
7 critical control points (CCPs) within a treatment plant in the ‘ABSENCE’ of any SafeDrinking Water Regulations?
As a water supplier would you undertake consultation with water storage managers and other water suppliers for the purpose of achieving agreement on the hazards
8 and risks to quality of the water supplied in the ‘ABSENCE’ of any Safe DrinkingWater Regulations?
Would you develop procedures and management systems for: ensuring that amount/purity chemicals added to drinking water does not adversely affect the quality of that
9 water/pose risk to human health; and controlling residue or chemical by-products imparted to drinking water as a result of the addition of chemicals – in the ‘ABSENCE’ of any Safe Drinking Water Regulations?
Would you include emergency management arrangements/procedures for dealing with10 an incident (details of person and public communication information
dissemination method) in the ‘ABSENCE’ of any Safe Drinking Water Regulations?
80
Referencenumber Question
11 Would you address risks of pathogenic micro-organisms, inorganic/organic chemicals, radiological parameters and algal toxins: to human health; entering or being present due to an incident or event; and/or being transferred in water being supplied – in the‘ABSENCE’ of any Safe Drinking Water Regulations?
12 Would you address risks of pathogenic micro-organisms, inorganic/organic chemicals, radiological parameters and algal toxins: to human health; entering or being present due to an incident or event; and/or being transferred in water being supplied – plus quantify and analyse the risk of each hazard identified – in the ‘ABSENCE’ of any Safe Drinking Water Regulations?
Documents to be reviewed as part of a risk management plan
13 Would you prepare documents or operating manuals, procedures or protocols created pursuant or containing material relating to the content a risk management plan – in the‘ABSENCE’ of any Safe Drinking Water Regulations?
14 Would you prepare a training and competency manual relating to the responsibilitiesof the staff of the water supplier or water storage manager – in the ‘ABSENCE’ of anySafe Drinking Water Regulations?
Approval criteria for risk management plan auditors
15 Would you ensure that RMP auditors:
• hold accreditation by an institution making you suitable for approval as a risk
management plan auditor
• demonstrate experience, qualifications and skills necessary to independently
conduct audits of RMPs
• provide a written declaration that you have no conflict of interest that would
impinge on your ability to objectively conduct an audit of an RMP– in the ‘ABSENCE’ of any Safe Drinking Water Regulations?
Compliance with drinking water quality standards
16 Would you ensure that drinking water samples tested for Escherichia coli (E. coli) complied with the water quality standard of at least 98% of all samples of drinking water collected in any 12-month period contain no E. coli per 100 mL of drinking– in the ‘ABSENCE’ of any Safe Drinking Water Regulations?
17 Would you take reasonable steps to ensure 100% of samples are free of E. coli, based on weekly sampling including undertaking the following rigorous response to each detection:
• urgent action to identify and rectify any barrier breaches, and ensure that all the barriers are working continually and the system is safe, including checking disinfectant residuals
• collect further samples to confirm the presence of E. coli and determine possible sources and distribution, including a repeat sample from the point where thenon-conforming sample was collected and, as appropriate, an upstream
81
sample (for example, a service reservoir or system entry point) and a downstream or adjacent sample (for example, a nearby sampling location)

82
Referencenumber Question
17 • initiate an investigation immediately to identify the underlying cause(s) of any barrier breaches or unexplained results, and put in place corrective actions to prevent future faecal contamination and detection of E. coli
• undertake further sampling to verify that the corrective actions have been effective• document all actions taken in relation to the detection
– in the ‘ABSENCE’ of any Safe Drinking Water Regulations?
18 Would you ensure that drinking water samples tested for turbidity complied withthe water quality standard of 95% UCL of the mean of the samples collected in any12-month period must be less than or equal to 5NTU – in the ‘ABSENCE’ of anySafe Drinking Water Regulations?
19 Would you ensure that all samples tested for turbidity are equal to or less than a turbidity of 5NTU, based on weekly sampling – in the ‘ABSENCE’ of any Safe Drinking Water Regulations?
20 Would you ensure that drinking water samples tested for THM complied with the drinking water quality standard of 0.25mg/L – in the ‘ABSENCE’ of any Safe Drinking Water Regulations?
21 Would you ensure that drinking water samples tested for chloroacetic acid complied with the drinking water quality standard of 0.15 mg/L – in the ‘ABSENCE’ of any Safe Drinking Water Regulations?
22 Would you ensure that drinking water samples tested for dichloroacetic acid complied with the drinking water quality standard of 0.1 mg/L – in the ‘ABSENCE’ of any Safe Drinking Water Regulations?
23 Would you ensure that drinking water samples tested for trichloroacetic acid complied with the drinking water quality standard of 0.1mg/L – in the ‘ABSENCE’ of any Safe Drinking Water Regulations?
24 Would you ensure that drinking water samples tested for bromate complied with the drinking water quality standard of 0.02 mg/L – in the ‘ABSENCE’ of any Safe Drinking Water Regulations?
25 Would you ensure that drinking water samples tested for formaldehyde complied with the drinking water quality standard of 0.5 mg/L – in the ‘ABSENCE’ of any Safe Drinking Water Regulations?
26 Would you ensure that drinking water samples tested for aluminium complied with the drinking water quality standard of 0.2 mg/L – in the ‘ABSENCE’ of any Safe Drinking Water Regulations?
27 Would you ensure that drinking water does not contain any algal toxin, pathogen, substance or chemical, whether alone or in combination with another toxin, pathogen, substance or chemical, in such amounts that may pose a risk to human health – in the‘ABSENCE’ of any Safe Drinking Water Regulations?
Frequency of sampling for drinking water
28 If you are a water supplier would you collect or cause to be collected, a sample of drinking water at a relevant water sampling point located within each water sampling locality to a per-determined frequency by your organisation – in the ‘ABSENCE’ of any Safe Drinking Water Regulations?

83
Referencenumber Question
Requirements relating to water sample analysis
29 Would you ensure that every sample of drinking water collected within a water sampling locality should be analysed for parameters in excess of the current drinking water standards – in the ‘ABSENCE’ of any Safe Drinking Water Regulations?
30 Would you ensure that every sample of drinking water collected within a water sampling locality should be analysed for E. coli, turbidity and THMs as per reformed drinking water standards – in the ‘ABSENCE’ of any Safe Drinking Water Regulations?
Results of analysis given to the Secretary
31 If you are a water supplier, would you ensure that a written summary of the resultsof every analysis of a sample of drinking water collected is reported to the Secretary no later than the end of the first month after the month in which the sample was collected – in the ‘ABSENCE’ of any Safe Drinking Water Regulations?
32 If you are a water supplier, would you ensure that a written summary of the results of analysis of a sample of drinking water collected is reported to the Secretary on an exception basis under ss. 18 and 22 of the Safe Drinking Water Act 2003 –in the ‘ABSENCE’ of any Safe Drinking Water Regulations?
Approval of water analysts
33 If you are a water supplier, would you have your water samples analysed at aNATA-accredited laboratory that holds accreditation for the relevant parameters– in the ‘ABSENCE’ of any Safe Drinking Water Regulations?
Content of annual reports
34 If you are a water supplier, would you provide in your annual reports:
• evidence of compliance or noncompliance with drinking water quality standards
and frequency of sampling
• actions taken when a drinking water quality standard has not been met• actions taken in respect of each emergency, incident or event
that has arisen that has affected the quality of drinking water generally, where it has posed a risk to health
• analysis of water sample information, data and results for quality of drinking water supplied and a comparison with water sample information, data and results from the previous two financial years
• a summary of every:– variation in aesthetic standards under s. 19 and conditions under s. 20 of the Act
– exemption from a water quality standard under s. 20 and conditions under s. 21 of the Act
– written undertaking under s. 30 of the Act
• a summary of complaints with a summary of the responses and any analysis of
the issues arising from the complaints
• a summary of the process by which the drinking water supplied is disinfected or treated and any other processes applied to the water and any issues arising out of the application of those processes
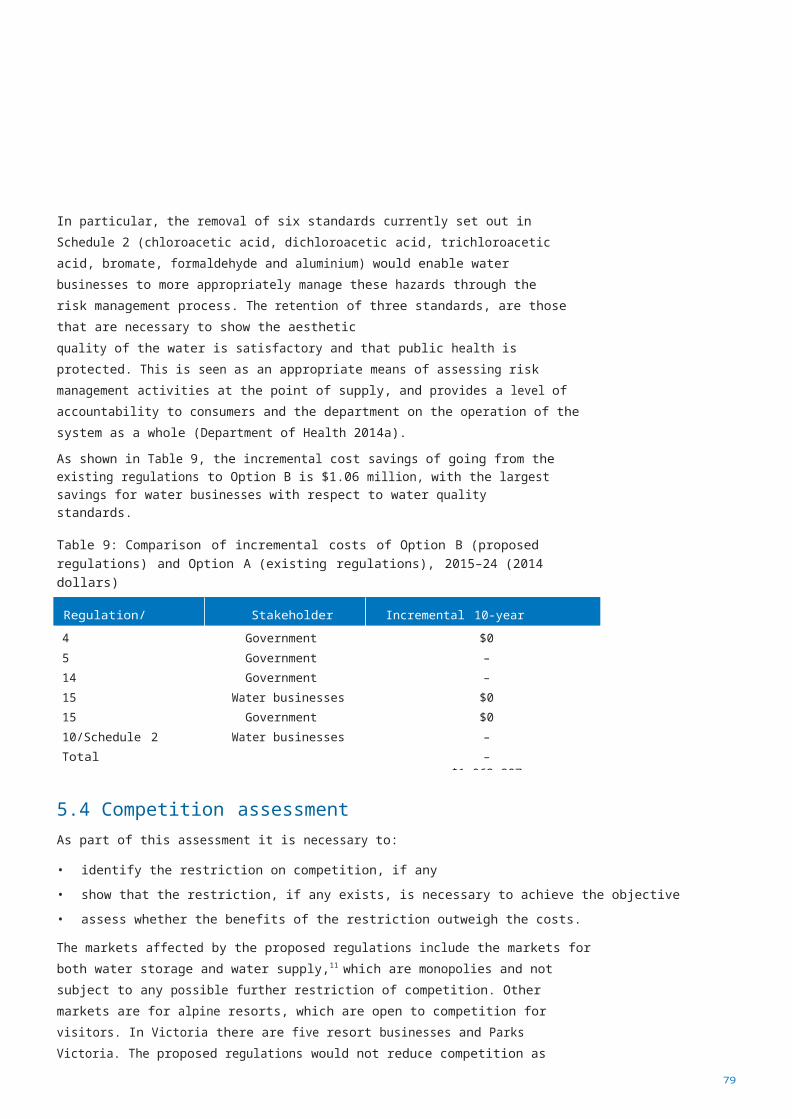
84
• a list of all the chemicals and other substances, and any processes, used by the
water supplier to disinfect or treat the drinking water supplied by it

85
Referencenumber Question
34 • steps taken to manage the aesthetic characteristics including steps taken to
manage the taste, odour, clarity and pH of the drinking water supplied
• details of any regulated water supplied and the declaration under s. 6 of theAct in respect of that regulated water
• details of the steps taken in accordance with s. 25 of the Act• a summary of the findings of the most recent risk management plan audit and any
issues that the approved auditor raised during the risk management plan audit
– in the ‘ABSENCE’ of any Safe Drinking Water Regulations?
35 If you are a water supplier, would you provide in addition to the requirements in the prior question: an annual review of the performance of CCPs; and information on employee training activities – in the ‘ABSENCE’ of any Safe Drinking Water Regulations?
36 If you are a water storage manager, would you provide in your annual reports:
• actions taken in respect of each emergency, incident or event that has arisen that has affected the quality of drinking water generally, where it has posed a risk to health
• any issues that may have arisen out of the actions• a summary of:
– exemption under s. 8 of the Act and any condition imposed in relation to every exemption
– written undertaking under s. 30 of the Act
• a summary of the process by which the water supplied is disinfected or treated and any other processes applied to the water and any issues arising out of the application of those processes
• a list of all the chemicals and other substances, and any processes, to disinfector treat the water supplied, or to be supplied, by it for drinking purposes
• a summary of the findings of the most recent risk management plan audit andany issues that the approved auditor raised during the risk management plan audit
– in the ‘ABSENCE’ of any Safe Drinking Water Regulations?
37 If you are a water storage manager, would you provide in addition to the requirements in the prior question: an annual review of the performance of CCPs; and information on employee training activities – in the ‘ABSENCE’ of any Safe Drinking Water Regulations?
To assess benefits, businesses were asked to score elements of the proposed regulations (on a scale of 1 to 5) in order of their likelihood of being most beneficial to least beneficial to the community as a whole, with:
• ‘5’ representing ‘likely to be most beneficial’• ‘1’ representing ‘likely to be least beneficial’.
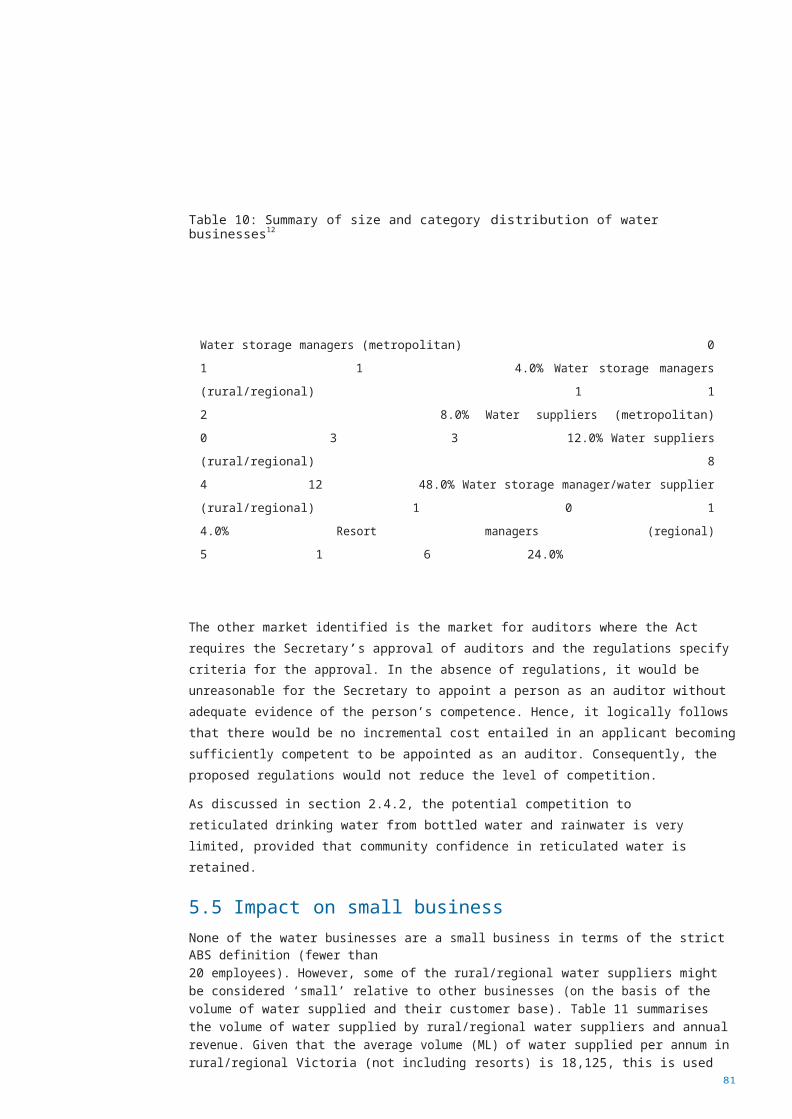
86
When scoring proposed regulations in terms of their incremental costs businesses were askedto refer to the following criteria:
Criterion Benefit criterion description
I Protection of public health (chronic disease)
II Retention of community confidence in drinking water supplies
III Better understanding of risks and better protection against drinking water outbreaks(acute disease)
IV Improved consistency and equity across different systems
A4.2 Survey resultsCosts
As shown in Table A4.2, the highest frequency of additional resources that were required in relation to existing/proposed regulations included those against reference numbers 12 (33 resources for content of risk management plans in relation to analysis of risks), 19 (19 resources for compliance with water quality standards in relation to turbidity), 30 (17 resources for requirements relating to water sample analysis), 31 (17 resources for results of analysis given to the Secretary) and 35 (17 resources for providing information on performance of CCPs and training activities).
In regard to the type of resources required, the highest frequency was for ongoing administration costs (102 resources requirements), followed by ongoing sampling resources (40 resource requirements). This was followed by one-off administrative costs (33 resource requirements) and one-off and ongoing other costs (29 and 27 resource requirements reported, respectively).
With respect to administrative costs, the highest frequency of resource requirements was ongoing and related to reference numbers 12, 19 and 31 and 35. With respect to sampling costs, these were most prevalent with respect to reference numbers 12 and 30. One-off capital/equipment costs were prevalent with respect to reference numbers 12 and 4.

87
Table A4.2: Incremental cost responses (number of additional resources to comply with existing/proposed regulations)
Capital/Admin Sampling Training equipment Other
Reference One-off | Ongoing One-off | Ongoing One-off | Ongoing One-off | Ongoing One-off | Ongoing
1 1 – – – – – – – – –
2 – 1 – – – – – – – –
3 2 2 – – – – – – – 1
4 – 1 – – – – – – – –
5 2 1 – – – – – – – –
6 – 1 – – – – – – – 1
7 1 2 – 1 – 1 1 – – –
8 – 2 – – – – – – – 1
9 1 2 – 1 – 1 – 1 – 1
10 1 – – 1 – – – – – –
11 1 1 1 – – – – – – –
12 2 9 1 6 1 1 6 – 3 4
13 – 3 – – – 1 – – – –
14 1 2 – – – 1 – – – 1
15 3 – – – – – – – 1 1
16 3 4 – – – – 1 – – 1
17 2 2 1 2 – 1 2 – 2 2
18 1 6 – 2 – – 1 – 1 1
19 – 6 – 2 1 – 4 – 1 5
20 1 1 1 – – – 1 – 3 1
21 1 2 – 2 – – 1 – 3 1
22 2 1 – 2 – – 1 – 1 –
23 1 1 1 2 – – 1 – 2 –
24 – 1 – – – – – – 2 –
25 – – – – – – – – 2 –
26 – 2 – 2 – – – – – 1
27 – 1 – 1 – – 1 – 1 –
28 – – – – – – – – – –
29 1 3 – 4 – 1 1 – 1 1
30 2 3 – 9 – – – 1 1 1
31 2 13 – – – – – – 1 1
32 – 3 – – – – – – 1 –
33 – 1 – 2 – – – – – –
34 – 6 – – – – – – 2 –
35 – 13 – – – – 1 – 1 2
36 1 3 – – – – – – – –
37 1 4 – 1 – – – – – –

Mea
n sc
ore
88
Benefits
The highest scores in the survey were in relation to criteria I (protection of public health – chronic) and III (better understanding of risks and better protection against acute outbreaks) combined. These were in relation to questions that dealt with existing and proposed reforms to regulations regarding risk management plans.
The highest score regarding retention of community confidence in drinking water was with respect to questions related to requirements for risk management plans, current water quality standards, reforms to approval of water analysts, current requirements for annual reports and proposed reforms to requirements for annual reports.
Finally, the highest scores for improved consistency and equity across different systems were provided against risk management plan questions and reforms to approval of water analysts. This is displayed in Figure A4.1.
Figure A4.1: Incremental benefit score responses for improved consistency and equity across different systems
4.003.68 3.72
Consistency and equity
3.623.50
3.00
2.50 2.32
2.00
1.50
1.00
1.902.30
1.76
3.50 3.483.20
2.89 2.863.00
2.56
1.80
2.91 2.79
2.452.55
2.24
2.65
1.55
3.10
1.95
3.50
3.052.74 2.89 3.00
0.50
0.00116 117 118 119 120 121 122 123 124 125 126 127 128 129 130 131 132 133 134 135 136 137 138 139 140 141 142 143
144
Survey questions
In summary the survey showed that water businesses rated risk management plans (current and reforms) as high across all of the four criteria when ranking benefits.

89
Glossary of terms and abbreviations
Act Safe Drinking Water Act 2003
ABS Australian Bureau of Statistics
ADWG Australian drinking water guidelines
base case The situation that would exist if there were no replacement regulations or other alternatives in place after the existing regulations expire.
co-regulation A method of sharing responsibility between business and government.
critical control point A key point, step or procedure at which control can be applied(CCP) and which is essential to prevent or eliminate a hazard or reduce
it to an acceptable level.
drinking water Water that is intended for human consumption or for purposes connected with human consumption, such as the preparation of food or the making of ice for consumption or for the preservation of unpackaged food, whether or not the water is used for other purposes.
market An organisation in which the coordination of specialised economic units occurs as a consequence of individual businesses and households interacting as buyers and sellers for the purposeof facilitating exchange.
market failure The situation that occurs when freely functioning markets, operating without government intervention, fail to deliver an efficient or optimal allocation of resources.
monitoring Systemically keeping track of something, including sampling or collecting information and documentation.
monopoly A market structure where one firm supplies the entire market.
NATA National Association of Testing Authorities, Australia
negligible So small or unimportant as to be not worth considering; insignificant.
operational A planned sequence of measurements and observations to assess performance and confirm the performance of preventive measures such as water monitoring treatment processes. Measurements are of operational parameters
that will indicate whether processes are functioning effectively
pathogen A disease-causing organism (for example viruses, protozoa and bacteria).
potable water Water suitable for human consumption.
prescribed Specified by regulations made under an Act.

90
public good A good or service that will not be produced in private markets because there is no way for the producer to keep those who do not pay for the good or service from using it.
regulatory burden Costs imposed on businesses over and above business-as-usual costs.
restriction of competition Something that prevents firms in a market or potential entrants to a market from undertaking the process of economic rivalry.
reticulation The network of pipelines used to take water into areas of consumption. Includes residential districts and individual households.
RIS Regulatory impact statement
social cost The total of all costs of a particular economic activity borne by all economic agents in society, including consumers, producers and government.
water storage manager (a) the Melbourne Water Corporation constituted under theWater Act 1989
(b) a water corporation within the meaning of the Water Act (other than the Melbourne Water Corporation constituted under that Act) that supplies water to a water supplier
(c) any other person or body declared by the regulations to be a storage manager for the purposes of this Act.
water supplier Any of the following that supplies drinking water or regulated water to the public…
(b) an authority within the meaning of the Water Act 1989(c) Parks Victoria established under the Parks Victoria Act 1998 (d) an alpine resort management board established under the
Alpine Resorts (Management) Act 1997(e) any other person or body declared by the regulations to be
a water supplier for the purposes of this Act.

91
References
Abt Associates Inc. 2000, Proposed arsenic in drinking water rule regulatory impact analysis, Prepared for the Office of Ground Water and Drinking Water, US Environmental Protection Agency, EPA 815-R-00-013.
Australian Bureau of Statistics (ABS) 2001, Small business in Australia, Cat. 1321.0, ABS, Canberra.
Australian Bureau of Statistics (ABS) 2007, Environmental issues: people’s views and practices, Cat.no. 4602.0, ABS, Canberra.
Australian Bureau of Statistics (ABS) 2014a, Australian Health Survey: Nutrition first results – foods and nutrients, 2011–12 – Australia, Cat.no. 4364.0.55.007 ABS, Canberra.
Australian Bureau of Statistics (ABS) 2014b, Consumer price index, Australia, Cat.no. 6401, ABS, Canberra.
Australian Institute of Health and Welfare 2012, Australia’s food and nutrition 2012. Cat. no. PHE 163, AIHW, Canberra.
Choice 2014, The cost of bottled water, viewed 15 December, <http://www.choice.com.au/reviews- and-tests/food-and-health/food-and-drink/beverages/bottled-water.aspx>.
Craun G, Brunkard J, Yoder J, Roberts V, Carpenter T, Calderon J, Beach M, Roy S 2010,‘Causes of Outbreaks Associated with Drinking Water in the United States from 1971 to 2006,’ Clinical Microbiology Reviews, American Society for Microbiology, July, pp. 507–528.
CRC for Water Quality and Treatment 2005, Public health aspects of rainwater tanks in urbanAustralia, Occasional Paper 10.
Dale K, Kirk M, Sinclair M 2010, ‘Reported waterborne outbreaks of gastrointestinal disease in Australia are predominantly associated with recreational exposure’, Australian and New Zealand Journal Of Public Health, vol. 34, no. 5 pp. 527–530.
Department of Environment and Primary Industries 2014, Water Corporations, viewed 17 December2014, <http://www.depi.vic.gov.au/water/governing-water-resources/water-corporations>.
Department of Epidemiology & Preventive Medicine, Monash University, and National Centre for Epidemiology & Population Health 1997, Drinking water quality: risk assessment – cost benefit analysis report, Australian National University, Canberra.
Department of Health 2013, Operational performance monitoring survey, State Government ofVictoria, Melbourne.
Department of Health 2014a, The future of Victoria’s Safe Drinking Water Regulations, Discussion paper, Department of Health, Melbourne.
Department of Health 2014b, The future of Victoria’s Safe Drinking Water Regulations, Technical report – background to proposed regulations, State Government of Victoria, Melbourne.
Department of Health 2014c, Annual report on drinking water quality in Victoria 2012-13, StateGovernment of Victoria, Melbourne
Department of Human Services 2009, Code of practice for fluoridation of drinking water supplies, Health (Fluoridation) Act 1973, State Government of Victoria, Melbourne.
Department of the Environment 2001, Human settlements theme report, viewed 15 December 2014,<http://www.environment.gov.au/node/21834>.

92
Department of Treasury and Finance 2014, Victorian guide to regulation, State Government ofVictoria, Melbourne.
EPA Victoria 2014, Landfill and prescribed waste levies, viewed 15 December,<http://www.epa.vic.gov.au/your-environment/waste/landfills/landfill-and-prescribed-waste-levies>.
Goldstein ST, Juranek DD, Ravenholt O, et al. 1996, ‘Cryptosporidiosis: An outbreak associated with drinking water despite state-of-the-art water treatment’, Annals of Internal Medicine, no. 124, pp. 459–468.
Mackenzie WR, Hoxie NJ, Proctor ME, Gradus MS, Blair KA, Peterson DE, Kazmierczak JJ,Addiss DG, Fox KR, Rose JB, Davis JP 1994, ‘A massive outbreak in Milwaukee of Cryptosporidium infection transmitted through the public water supply’, New England Jouranl of Medicine, no. 331, pp. 161–167.
Minister for Health 2003, Victoria, Legislative Assembly 2003, Debates, Book 4, pp. 981–983.
NHMRC, NRMMC 2011, Australian drinking water guidelines Paper 6 National water quality management strategy, National Health and Medical Research Council, National Resource Management Ministerial Council , Commonwealth of Australia, Canberra.
Productivity Commission 2000, Arrangements for setting drinking water standards, InternationalBenchmarking, AusInfo, Canberra, p. 34.
Salvadori, MI, Sontrop JM, Garg AX, Moist LM, Suri RS, Clark WF 2009, ‘Factors that led to theWalkerton tragedy’, Kidney International Supplements (112): S33–34.
The Age National, June 28, 2008, viewed 23 December 2014 <http://www.theage.com.au/national/- and-heres-how-to-bottle-water-20080627-2y58.html#ixzz3BIuz9JQG>.
Victorian Competition and Efficiency Commission 2006, Guidance note on suggested default methodology and values for staff time in BIA/RIS Analysis, Melbourne, p. 3.
Water Quality and Health 2014, Milwaukee, 1993: The largest documented waterborne disease outbreak in US history, viewed 17 December 2014, <http://www.waterandhealth.org/milwaukee-1993-largest-documented-waterborne-disease-outbreak-history/>.
Widerström M, Schönning C, Lilja M, Lebbad M, Ljung T, Allestam G, et al. 2014, ‘Large outbreak of Cryptosporidium hominis infection transmitted through the public water supply, Sweden’, Emerging Infectious Diseases, vol. 20, no. 4, pp. 581–589.

93
Further reading
Andersson Y, De Jong B, Studahl A 1997, ‘Waterborne Campylobacter in Sweden: the cost of an outbreak’, Water Science and Technology, vol. 35, no. 11–12, pp. 11–14.
Crampton A, Ragusa AT 2008, ‘A Tale of Two Cities: Who has the cleanest drinking water, Melbourne or Sydney?’ The Australian Sociological Association (TASA) Conference, p. 2.
Department of Health and the Victorian Water Industry Association 2010, Victorian framework for water treatment operator competencies – Best practice guidelines, State Government of Victoria, Melbourne.
Department of Human Services 2004, Regulatory impact statement for the Safe Drinking WaterRegulations 2004, State Government of Victoria, Melbourne.
Food Standards Australia New Zealand 2003, Food Standards: The 20th Australian Total DietSurvey, FSANZ, Barton.
Garthright WE, Archer DL, Kvenberg JE 1988, ‘Estimates of incidence and costs of intestinal infectious diseases’, Public Health Reports, no. 103, pp. 107–116.
Hrudey, SE, Hrudey EJ 2004, Safe drinking water: lessons from recent outbreaks in affluent nations, IWA Publishing, London.
Office of Best Practice Regulation (OBPR) 2008, Best practice regulation guidance note: value of statistical life, OBPR, Brisbane.
Payment P 1997, ‘Epidemiology of endemic gastrointestinal and respiratory diseases – incidence, fraction attributable to tap water and costs to society’, Water Science and Technology, no. 35,pp. 7–10.
Payment P, Hunter PR 2001, ‘Endemic and epidemic infectious intestinal disease and its relationship to drinking water’. In: L Fewtrell, J Bartram (eds), Water quality: guidelines, standards and health, London, International Water Association Publishing, pp. 61–88.
Public Health Group 2004, Drinking water quality regulatory framework for Victoria, Public HealthGroup, Melbourne.
Roy Morgan Research 2012, Bottled water consumption slows, viewed 23 December 2014,<http://www.roymorgan.com/findings/bottled-water-consumption-slows-201304290244>.
Water Research Australia 2014, Health effects of drinking water from rainwater tanks, viewed 23December 2014, <http://www.waterra.com.au/project-details/4#sthash.IlZpgkQI.dpuf>.