Embed Size (px)
Citation preview

2012-2013 School Improvement Plan (SIP)-Form SIP-1
FLORIDA DEPARTMENT OF EDUCATION
DRAFT School Improvement Plan (SIP)Form SIP-1
Proposed for 2012-2013
August 2012Rule 6A-1.099811Revised April 29, 2011 1

2012-2013 School Improvement Plan (SIP)-Form SIP-1
2012-2013 SCHOOL IMPROVEMENT PLAN
PART I: CURRENT SCHOOL STATUS
School Information School Name: Mt. Dora Middle School District Name: Lake
Principal: Albert Larry Superintendent: Dr. Susan Moxley
SAC Chair: Chris DeLibro Date of School Board Approval:
Student Achievement Data and Reference Materials: The following links will open in a separate browser window. School Grades Trend Data (Use this data to complete Sections 1-4 of the reading and mathematics goals and Sections 1 and 2 of the writing and science goals.)Florida Comprehensive Assessment Test (FCAT)/Statewide Assessment Trend Data (Use this data to inform the problem-solving process when writing goals.)High School Feedback Report K-12 Comprehensive Research Based Reading Plan
AdministratorsList your school’s administrators and briefly describe their certification(s), number of years at the current school, number of years as an administrator, and their prior performance record with increasing student achievement at each school. Include history of School Grades, FCAT/statewide assessment performance (percentage data for achievement levels, learning gains, Lowest 25%), and ambitious but achievable annual measurable objective (AMO) progress.
Position Name Degree(s)/Certification(s)
Number of Years at
Current School
Number ofYears as an
Administrator
Prior Performance Record (include prior School Grades, FCAT/statewide assessment Achievement Levels, learning gains, lowest 25%), and AMO progress, along with the associated school year)
Principal Albert Larry B.S. Business Administration,B.S. Psychology,M.Ed. Educational Leadership
0 18Principal of Eustis High School:2011-2012Grade Not yet awarded : meeting high standards in reading 50%: did not meet AMO Target of 53%, math 53%; met AMO Target of 33%, writing 80%; science NA. Reading gains for lowest 25% was 45% Math gains for lowest 25% was 46%. Principal of Eustis High School:2010-2011Grade B: Increased graduation rate from 85% in 2009 to 87% in
August 2012Rule 6A-1.099811Revised April 29, 2011 2

2012-2013 School Improvement Plan (SIP)-Form SIP-12010. White subgroup graduation rate increased from 87% in 2009 to 89% in 2010. Economically disadvantage graduation rate decreased from 82% in 2009 to 81% in 2010. Decreased Graduation Rate from 84% in 2009 for the Black subgroup to 77% in 2010.Based on School Grades Data meeting high standards in reading 46%; math 71%; writing 68%; science 42%. AYP: white, black, & economically disadvantaged students did not make AYP in reading. Black and economically disadvantaged students did not make AYP in math. Writing proficiency was met.Principal of Eustis High School:2009-2010Grade B: Increased Graduation Rate from 55% in 2007 for the Black subgroup to 84% in 2009. White subgroup graduation rate increased from 75% in 2007 to 87% in 2009. Economically disadvantage graduation rate increased from 51% in 2007 to 82% in 2009.Meeting high standards in reading 46%; math 77%; writing 83%; science 43%. AYP: white, black, & economically disadvantaged students did not make AYP in reading. Black and economically disadvantaged students did not make AYP in math. Writing proficiency was met.Principal, Eustis High School:2008-2009Grade D: meeting high standards in reading 49%; math 76%; writing 76%; science 46%. AYP: 79%, white, black, economically disadvantaged students did not make AYP in reading. Black and economically disadvantaged students did not make AYP in math. Writing proficiency was not met; however, graduation criterion was met.Principal, Eustis High School:2007-2008Grade C: meeting high standards in reading 46%; math 78%; writing 86%; science 41%. AYP: 85%, white, black and economically disadvantaged students did not make AYP in reading. Black students did not make AYP in math. Writing proficiency was met; however, graduation criterion was not met.Principal, Eustis Middle School:2006-2007Grade A: meeting high standards in reading 69%, math 72%, writing 90%, science 48%. AYP 90%. Black, Hispanic, economically disadvantaged and students with disabilities did not make AYP. Writing proficiency was met.
August 2012Rule 6A-1.099811Revised April 29, 2011 3

2012-2013 School Improvement Plan (SIP)-Form SIP-1Principal, Eustis Middle School:2005-2006Grade A: meeting high standards in reading 70%, math 74%, writing 89%. , with disabilities did not make AYP in reading or math. Writing proficiency was met.
AssistantPrincipal
I
Karen Oates M.Ed., Educational Leadership,B.S.
Certifications:AgriculturalEducation andMiddle GradesScience, PrincipalESOL 60 hours
1 11Assistant Principal, Mt. Dora Middle School2011-2012School Grade B - 55% Reading: met AMO Reading Target if 55%, 47% Math: did not meet AMO Math Target of 51%, 80% Writing, 43% Science, 65% Learning Gains in Reading, 59% Learning Gains in Math, 73% Lowest 25% Gains in Reading, 58% Lowest 25% MathAssistant Principal, Tavares High School 2010-2011 School Grade A: 48% reading proficiency, 80% Math proficiency, 76% writing proficiency, 45% science proficiency, 50% learning gains in reading, 77% learning gains in Math, 46% lowest 25% learning gains in reading, 63% lowest 25% learning gains in Math, did not make AYP.Assistant Principal, Tavares High School2009-2010 School Grade A: 51% reading proficiency,76% math proficiency, 83% writing proficiency, 45% scienceproficiency, 56% reading learning gains, 74% math learning gains, 53% lowest 25% reading gains, 62% lowest 25% math gains; did not make AYP. Assistant Principal, Tavares High School2007-2008 School Grade B: 50% reading proficiency, 79% math proficiency, 82% writing proficiency, 39% science proficiency; 58% reading learning gains, 77% math learning gains; 57% lowest 25% reading gains, 72% lowest 25% math gains; did not make AYP.Assistant Principal, Tavares High School2008-2009 School Grade B: 48% reading proficiency, 76% math proficiency, 79% writing proficiency, 44% science proficiency; 48% reading learning gains, 76% math learning gains; 48% lowest 25% in reading, 66% lowest 25% in math; did not make AYP.
August 2012Rule 6A-1.099811Revised April 29, 2011 4

2012-2013 School Improvement Plan (SIP)-Form SIP-1
AssistantPrincipal
II
Karen Hart M.Ed., Educational Leadership,B.S. Elementary Education K-6
Certifications:GiftedESOL EndorsementEarly Childhood
0 02011-2012: Lost Lake Elementary - A school2010-2011: Lost Lake Elementary - A school2009-2010: Lost Lake Elementary - A school2008-2009: Lost Lake Elementary - A school, AYP2007-2008: Lost Lake Elementary - A school, AYP
Instructional Coaches
List your school’s instructional coaches and briefly describe their certification(s), number of years at the current school, number of years as an instructional coach, and their prior performance record with increasing student achievement at each school. Include history of School Grades, FCAT/statewide assessment performance (percentage data for achievement levels, learning gains, Lowest 25%), and ambitious but achievable annual measurable objective (AMO) progress. Instructional coaches described in this section are only those who are fully released or part-time teachers in reading, mathematics, or science and work only at the school site.
SubjectArea Name Degree(s)/
Certification(s)
Number of Years at
Current School
Number of Years as an Instructional
Coach
Prior Performance Record (include prior School Grades, FCAT/Statewide Assessment Achievement Levels, Learning Gains, Lowest 25%), and AMO progress along with the associated school year)
Reading/Literacy Coach
Craig A. Cosden Master in Educational AdministrationReading Endorsed
1 9Literacy Coach, Mt. Dora Middle School2011-2012School Grade B: 55% Reading, 47% Math, 80% Writing, 43% Science, 65% Learning Gains in Reading, 59% Learning Gains in Math, 73% Lowest 25% Gains in Reading, 58% Lowest 25% Math
Effective and Highly Effective TeachersDescribe the school-based strategies that will be used to recruit and retain high quality, effective teachers to the school.
August 2012Rule 6A-1.099811Revised April 29, 2011 5

2012-2013 School Improvement Plan (SIP)-Form SIP-1
Description of Strategy Person Responsible Projected Completion Date
1. Each candidate is screened and interviewed, and careful consideration is given to recommendations and references. All teachers employed at Mount Dora Middle School are highly qualified under the guidelines outlined by the Florida Department of Education. Administration will hire Highly Qualified Teachers.
Principal, Assistant Principals, and Department Chairs
Ongoing
2. Provide PLC’s to assist with developing highly effective lessons.
Principal and Assistant Principals, Reading Coach
Ongoing
3. Provide meeting time weekly for cross curriculum teams to meet collaboratively.
Principal, Assistant Principals, Team Leaders
Ongoing
4. Provide Instructional support through in house staff development.
Principal, Assistant Principals, Literacy Leadership Team, Department Chairs
Ongoing
5. Provide Positive Reinforcement of Highly Effective Teaching through PBS incentives and school wide recognition.
Principal, Assistant Principal, and Teachers
Ongoing
August 2012Rule 6A-1.099811Revised April 29, 2011 6

2012-2013 School Improvement Plan (SIP)-Form SIP-1Non-Highly Effective InstructorsProvide the number of instructional staff and paraprofessionals that are teaching out-of-field and who received less than an effective rating (instructional staff only). *When using percentages, include the number of teachers the percentage represents (e.g., 70% [35]).
Number of instructional staff and paraprofessionals that are teaching out-of-field and/or who received less than
an effective rating (instructional staff only).
Provide the strategies that are being implemented to support the staff in becoming highly effective
Staff DemographicsPlease complete the following demographic information about the instructional staff in the school.
*When using percentages, include the number of teachers the percentage represents (e.g., 70% [35]).
Totalnumber of
Instructional Staff
% of first-year teachers
% of teachers with 1-5 years of
experience
% of teachers with 6-14 years of experience
% of teachers with 15+ years of experience
% of teachers with Advanced
Degrees
% of teachers with an
Effective rating or higher
% of Reading Endorsed Teachers
% of National Board
Certified Teachers
% of ESOL EndorsedTeachers
57 1% (8) 37% (20) 35% (19) 35% (19) 41% (22) 81% (44) 20% (11) 4% (2) 30% (16)
Teacher Mentoring Program/PlanPlease describe the school’s teacher mentoring program/plan by including the names of mentors, the name(s) of mentees, rationale for the pairing, and the planned mentoring activities.
Mentor Name Mentee Assigned Rationale for Pairing Planned Mentoring Activities
Auren Alvelo Stephanie Lindberg Former Literacy Coach Personal meetings as needed
Luke Cain Patrick Scully Veteran Teacher Personal meetings as needed
Beverly Brown Linda Trybulec Veteran Teacher Personal meetings as needed
August 2012Rule 6A-1.099811Revised April 29, 2011 7

2012-2013 School Improvement Plan (SIP)-Form SIP-1
Bonnie Gordon Treecie Hargroves Veteran Teacher Personal meetings as needed
Richard Paquette Kerri Dean LA teacher Personal meetings as needed
Andrew Porter Phillip Porter Veteran Teacher Personal meetings as needed
Fredericka Mack Michelle Long Veteran ESE Teacher Personal meetings as needed
Natalie Taylor Kim Lowery Veteran Teacher Personal meetings as needed
Multi-Tiered System of Supports (MTSS) /Response to Instruction/Intervention (RtI).
August 2012Rule 6A-1.099811Revised April 29, 2011 8

2012-2013 School Improvement Plan (SIP)-Form SIP-1School-Based MTSS/RtI Team
Identify the school-based MTSS leadership team.
Al Larry PrincipalKaren Oates Assistant PrincipalKaren Hart Assistant PrincipalRene’ Holt Guidance CounselorSuzanne Goulder Guidance CounselorCraig Cosden Literacy CoachAnne Schutz School PsychologistLaura Wright ESE School SpecialistSheena McFadden School Social WorkerToni Renna Speech/Language Pathologist
Describe how the school-based MTSS leadership team functions (e.g., meeting processes and roles/functions). How does it work with other school teams to organize/coordinate MTSS efforts?
The function of the RtI Leadership Team is to review student information regarding students who are not successful in the overall school program, and collect and analyze data to develop intervention strategies that will increase student success. In addition, the team has the responsibility to review the school as a whole to monitor potential problems to determine if the problems are individual or systemic. Bi-weekly meetings are held by assistant principals, counselors and teams for Tier I data collection and intervention. The results of these meetings are shared with the overall leadership team on a monthly basis for additional review, consultation, and advisement.
Describe the role of the school-based MTSS leadership team in the development and implementation of the school improvement plan (SIP). Describe how the RtI problem-solving process is used in developing and implementing the SIP?
Principal: The role of the principal is to provide a common vision for the use of data-based decision making, ensure that the school and student based RtI team is implementing appropriate procedures, ensures appropriate professional development activities to implement RtI, and communicates with parents regarding school based RtI plans and activities.
Assistant Principals: The role of the Assistant Principals is to support the role of the principal and become an active participant in RtI meetings and interventions for students assigned to them.
Guidance Counselors and School Social Worker: The role of the guidance counselor and school social worker is to coordinate and support the efforts of all other members of the RtI team, provide expertise on both school and community resources, and maintain an open line of communication among the school, the student and the family of the student.August 2012Rule 6A-1.099811Revised April 29, 2011 9

2012-2013 School Improvement Plan (SIP)-Form SIP-1
Speech/Language Pathologist: The role of the Speech/Language Pathologist is to educate and assist the team in the role language plays in curriculum, instruction and assessment as a basis for interventions and/or program design, assists in the selection of screening methods, and helps identify systemic patterns of student need with respect to language skills.
Literacy Coach: The Literacy Coach will provide guidance on the school wide reading plan, facilitate and support data collection processes, assist in data analysis, provide instructional strategies as appropriate for the RtI process, provide professional development and technical assistance to teachers as it pertains to data based instructional planning, and support the implementation of Tiers I, II, and III intervention plans.
ESE School Specialist and ESE Teachers: The ESE specialist and ESE teachers will participate in student data collection and analysis, integrate core curriculum with Tier II and Tier III instruction, and collaborate with general education teachers through consultation, support facilitation, and/or co-teaching once students are identified ESE.
School Psychologist: The role of the school psychologist is to participate in the collection and analysis of data, facilitate the development of intervention plans, support RtI process for intervention fidelity and documentation, provide professional development and technical assistance for problem solving activities including data collection, data analysis, intervention planning, and program evaluation, and facilitates the RtI data based decision making process.
August 2012Rule 6A-1.099811Revised April 29, 2011
10

2012-2013 School Improvement Plan (SIP)-Form SIP-1MTSS Implementation
Describe the data source(s) and the data management system(s) used to summarize data at each tier for reading, mathematics, science, writing, and behavior.
The School Based RtI Leadership Team plays an on-going role in the review of student progress to determine if lack of student success is systemic to the school or specific to the student. The school improvement plan is designed to address problems that widespread throughout the school as well as the problems that are particular to individual students and/or specific sub groups. The RtI leadership team meets regularly with the School Advisory Council (SAC) to provide data on Tier I, II, III targets, address both the academic and social/emotional needs of students, set clear expectations for academic success, develop systematic approaches to education that align with the requirements of Differentiated Accountability.
Data Sources Include the following:
Baseline Data: Progress Monitoring and Reporting Network (PMRN) EduSoft, Florida Assessment for Instruction in Reading (FAIR), FCAT, Discipline reports from AS400, FIDO and PBS monitoringProgress Monitoring: EduSoft, PMRN, Curriculum Based Measurement (CBM) PRS (clickers), Discipline reports from AS400, FIDO and PBS monitoringMidyear Assessment: FAIR and EduSoft, Diagnostic Assessment for Reading (DAR), Early Reading Diagnostic Assessment (ERDA), Discipline reports from AS400, FIDO and PBS monitoringEnd of the Year: FAIR and FCAT, Discipline reports from AS400, FIDO and PBS monitoring
Describe the plan to train staff on MTSS.
The RtI Team will provide Professional development to all teachers during their common plan time and through whole school professional development meetings. Small group and individual assistance will be provided as needed.
Describe the plan to support MTSS.
The MTTS/RTI Team will review available data at the bi-weekly meetings and provide support as needed.
August 2012Rule 6A-1.099811Revised April 29, 2011
11

2012-2013 School Improvement Plan (SIP)-Form SIP-1Literacy Leadership Team (LLT)
School-Based Literacy Leadership TeamIdentify the school-based Literacy Leadership Team (LLT).
The LLT is composed of 12 cross-curricular elective, content and miscellaneous positions to include librarian, ELL specialist, principal, and a parent representative.Craig Cosden, Instructional Reading CoachAl Larry, PrincipalKaren Oates, Assistant PrincipalKaren Hart, Assistant PrincipalDeborah Merkle, Reading TeacherLinda Evans, Social StudiesKarla Clark, Social Studies Kerri Dean, ELAStephanie Lindberg, Reading TeacherSandra Sellers, Math TeacherCaroline Vanhorn, Media SpecialistSannye Jones, Language Arts Teacher
Describe how the school-based LLT functions (e.g., meeting processes and roles/functions).
The Reading Coach will function as the chair for the LLT. The team meets bi-monthly to assess data and develop an action plan to support school wide initiatives.
What will be the major initiatives of the LLT this year?
To increase parental involvement within the school setting. Secondly to assist and support teacher implementation of content area instructional programs such as SQ4R, CIS, and SpringBoard.
*Grades 6-12 Only Sec. 1003.413 (2)(b) F.SFor schools with grades 6-12, how does the school ensure that every teacher contributes to the reading improvement of every student?
Professional development will be provided during LCS Professional Development Day, faculty meetings, and before and after school as needed. August 2012Rule 6A-1.099811Revised April 29, 2011
12

2012-2013 School Improvement Plan (SIP)-Form SIP-1
The Literacy Leadership Team will provide each teacher with on-site professional development opportunities, direct classroom assistance, and technical and research based assistance across all curriculum areas. The administrative team will provide oversight through classroom walkthroughs and observations.
PART II: EXPECTED IMPROVEMENTS
Reading Goals* When using percentages, include the number of students the percentage represents (e.g., 70% [35]).
Reading Goals Problem-Solving Process to Increase Student AchievementBased on the analysis of student achievement data and reference to “Guiding Questions,” identify and define areas in need of improvement for the following group:
Anticipated Barrier Strategy Person or Position Responsible for Monitoring
Process Used to Determine Effectiveness of Strategy
Evaluation Tool
1A. FCAT 2.0: Students scoring at Achievement Level 3 in reading.
1A.1.Supporting teacher understanding regarding the tentative situation of students at level 3.
Without great instructional care, concern and student rehearsal those students scoring at level 3 may fall to non-proficiency
1A.1.Increase rigorous reading across all the content areas by providing scaffolded support to the students. This support will center upon SBRR practices as SQ4R, CIS and SpringBoard implementationImplementation of ARP
1A.1.Administrative TeamInstructional Coach Classroom TeachersCollaborative effort
1A.1.Administrative team analysis of classroom monitoring dataContent area department evaluation of strategiesTeacher analysis of student classroom performance both informal and formal
1A.1.Outcome assessmentsStudent GPA differentialTeacher surveyReading Goal #1A:
Increase the number of students levels at 3 and above by 3% at each grade level.
2012 Current Level of Performance:*
2013 Expected Level of Performance:*
6th 32% (71)7th 32% (88)8th 27% (72)
6th 35%7th 35%8th 32%
1A.2. 1A.2.Guide professional learning focus to assist teachers on current best reading practices and how to implement such practices in the classroom.
1A.2. 1A.2. 1A.2.
1A.3. 1A.3. 1A.3. 1A.3. 1A.3.
1B. Florida Alternate Assessment: Students scoring at Levels 4, 5, and 6 in reading.
1B.1. 1B.1. 1B.1. 1B.1. 1B.1.
August 2012Rule 6A-1.099811Revised April 29, 2011
13

2012-2013 School Improvement Plan (SIP)-Form SIP-1Reading Goal #1B:
Enter narrative for the goal in this box.
2012 Current Level of Performance:*
2013 Expected Level of Performance:*
Enter numerical data for current level of performance in this box.
Enter numerical data for expected level of performance in this box.
1B.2. 1B.2. 1B.2. 1B.2. 1B.2.
1B.3. 1B.3. 1B.3. 1B.3. 1B.3.
Based on the analysis of student achievement data and reference to “Guiding Questions,” identify and define areas in need of improvement for the following group:
Anticipated Barrier Strategy Person or Position Responsible for Monitoring
Process Used to Determine Effectiveness of Strategy
Evaluation Tool
2A. FCAT 2.0: Students scoring at or above Achievement Levels 4 in reading.
2A.1. Staff acceptance of the more rigorous CCSS
Assisting teacher in “ramping up” the rigor in the advanced classes.
How will the advanced classes clearly set a more rigorous expectation for student achievement?
2A.1.Add advanced level courses for the academic year. Increase from 3 to 28 advanced courses. This represents an 90%+ increase in advanced course work.
2A.1.Administrative Team
2A.1.Student gradesTeacher evaluationVertical collaborative discussions with HS.
2A.1.FCAT 2.0EOC Student surveysTeacher surveys
Reading Goal #2A:
Increase the number of students scoring at or above level 4 in reading by 3% at each grade level.
2012 Current Level of Performance:*
2013 Expected Level of Performance:*
6th 27% (60)7th 22% (60)8th 22% (59)
6th 30%7th 25%8th 25%
2A.2. 2A.2. 2A.2. 2A.2. 2A.2.
2A.3. 2A.3. 2A.3. 2A.3. 2A.3.
2B. Florida Alternate Assessment: Students scoring at or above Level 7 in reading.
2B.1. 2B.1. 2B.1. 2B.1. 2B.1.
Reading Goal #2B:
Enter narrative for the goal in this box.
2012 Current Level of Performance:*
2013 Expected Level of Performance:*
Enter numerical data for current
Enter numerical data for expected
August 2012Rule 6A-1.099811Revised April 29, 2011
14

2012-2013 School Improvement Plan (SIP)-Form SIP-1level of performance in this box.
level of performance in this box.
2B.2. 2B.2. 2B.2. 2B.2. 2B.2.
2B.3. 2B.3. 2B.3. 2B.3. 2B.3.
Based on the analysis of student achievement data and reference to “Guiding Questions,” identify and define areas in need of improvement for the following group:
Anticipated Barrier Strategy Person or Position Responsible for Monitoring
Process Used to Determine Effectiveness of Strategy
Evaluation Tool
3A. FCAT 2.0: Percentage of students making learning gains in reading.
3A.1.Supporting teacher understanding regarding the tentative situation of students at level 3.
Without great instructional care, concern and student rehearsal those students scoring at level 3 may fall to non-proficiency
Guide professional learning focus to assist teachers on current best reading practices and how to implement such practices in the classroom.
3A.1.Increase rigorous reading across all the content areas by providing scaffolded support to the students. This support will center upon SBRR practices as SQ4R, CIS and SpringBoard implementationImplementation of ARP (Academic Recovery Program)
3A.1.Administrative TeamInstructional Coach Classroom TeachersCollaborative effort
3A.1.Administrative team analysis of classroom monitoring dataContent area department evaluation of strategiesTeacher analysis of student classroom performance both informal and formal
3A.1.Outcome assessmentsStudent GPA differentialTeacher surveyReading Goal #3A:
Increase the number of students making learning gains in reading by 3%
2012 Current Level of Performance:*
2013 Expected Level of Performance:*
66% 69%
1A.2. 3A.2. 1A.2. 1A.2. 1A.2. 3A.2.
3A.3. 3A.3. 3A.3. 3A.3. 3A.3.
3B. Florida Alternate Assessment: Percentage of students making learning gains in reading.
3B.1. 3B.1. 3B.1. 3B.1. 3B.1.
Reading Goal #3B:
Enter narrative for the goal in this box.
2012 Current Level of Performance:*
2013 Expected Level of Performance:*
Enter numerical data for current level of
Enter numerical data for expected level of
August 2012Rule 6A-1.099811Revised April 29, 2011
15

2012-2013 School Improvement Plan (SIP)-Form SIP-1performance in this box.
performance in this box.
3B.2. 3B.2. 3B.2. 3B.2. 3B.2.
3B.3. 3B.3. 3B.3. 3B.3. 3B.3.
August 2012Rule 6A-1.099811Revised April 29, 2011
16

2012-2013 School Improvement Plan (SIP)-Form SIP-1Based on the analysis of student achievement data and reference to “Guiding Questions,” identify and define areas in need of improvement for the following group:
Anticipated Barrier Strategy Person or Position Responsible for Monitoring
Process Used to Determine Effectiveness of Strategy
Evaluation Tool
4. FCAT 2.0: Percentage of students in lowest 25% making learning gains in reading.
4A.1. Careful selection of students for Academic Recovery Program (ARP)
4A.1Mentoring Program (continued)Implement ARP targeted for students who scored level 1 or 2, retained students and any student in need of academic support or assistance. Mentoring Program
4A.1. Administrative TeamLiteracy CoachGuidance CounselorsTeachers working in the program
4A.1. Classroom academic performanceTeacher and student surveys
4A.1. Outcome assessmentssurveys Student GPA differentialReading Goal #4:
Increase the number of students making learning gains by 3% within the lowest 25%
2012 Current Level of Performance:*
2013 Expected Level of Performance:*
74% 77%
4A.2. 4A.2. 4A.2. 4A.2. 4A.2.
4A.3. 4A.3. 4A.3. 4A.3. 4A.3.
Based on ambitious but achievable Annual Measurable Objectives (AMOs), identify reading and mathematics
performance target for the following years
2011-2012 2012-2013 2013-2014 2014-2015 2015-2016 2016-2017
5A. In six years school will reduce their achievement gap by 50%.
Baseline data2010-2011
55% 59% 63% 67% 71% 76%
Reading Goal #5A:
Reduce the school’s achievement gap by increasing the percentage of students scoring satisfactory by 4% over the next four years and by 5% in 2016-17.
Based on the analysis of student achievement data and reference to “Guiding Questions,” identify and define
areas in need of improvement for the following subgroups:
Anticipated Barrier Strategy Person or Position Responsible for Monitoring
Process Used to Determine Effectiveness of Strategy
Evaluation Tool
August 2012Rule 6A-1.099811Revised April 29, 2011
17

2012-2013 School Improvement Plan (SIP)-Form SIP-15B. Student subgroups by ethnicity (White, Black, Hispanic, Asian, American Indian) not making satisfactory progress in reading.
5B.1.Ensuring that the ARP provides differentiated academic programs aligned to the specific needs of student subgroups
5B.1.AdministrationLiteracy CoachGuidance Counselors
5B.1.AdministrationLiteracy CoachGuidance Counselors
5B.1.Assessment OutcomesStudent GPA DifferentialWeekly Formal and Informal AssessmentsTeacher and Student Surveys
5B.1.Assessment OutcomesStudent GPA Differential
Reading Goal #5B:
Decrease in the number of student subgroups by ethnicity not making satisfactory gains by 3%
2012 Current Level of Performance:*
2013 Expected Level of Performance:*
White: 36%Black: 64%Hispanic: 60%
White:33%Black:61%Hispanic:57%
5B.2. 5B.2. 5B.2. 5B.2. 5B.2.
5B.3. 5B.3. 5B.3. 5B.3. 5B.3.
August 2012Rule 6A-1.099811Revised April 29, 2011
18

2012-2013 School Improvement Plan (SIP)-Form SIP-1Based on the analysis of student achievement data and reference to “Guiding Questions,” identify and define
areas in need of improvement for the following subgroup:
Anticipated Barrier Strategy Person or Position Responsible for Monitoring
Process Used to Determine Effectiveness of Strategy
Evaluation Tool
5C. English Language Learners (ELL) not making satisfactory progress in reading.
5C.1. Language barrier
Ensuring that the ARP provides differentiated academic programs aligned to the specific needs of student subgroups
5C.1.Mentoring Program Implement ARP targeted for students who scored level 1 or 2, retained students and any student in need of academic support or assistance.
5C.1.AdministrationLiteracy CoachGuidance Counselors
5C.1.Assessment OutcomesStudent GPA DifferentialWeekly Formal and Informal AssessmentsTeacher and Student Surveys
5C.1.Assessment OutcomesStudent GPA Differential
Reading Goal #5C:
Decrease the number of ELL students not making satisfactory progress in reading by 3%
2012 Current Level of Performance:*
2013 Expected Level of Performance:*
60% (13) 57%
5C.2. 5C.2. 5C.2. 5C.2. 5C.2.
5C.3. 5C.3. 5C.3. 5C.3. 5C.3.
Based on the analysis of student achievement data and reference to “Guiding Questions,” identify and define
areas in need of improvement for the following subgroup:
Anticipated Barrier Strategy Person or Position Responsible for Monitoring
Process Used to Determine Effectiveness of Strategy
Evaluation Tool
5D. Students with Disabilities (SWD) not making satisfactory progress in reading.
5D.1. Ensuring that the ARP provides differentiated academic programs aligned to the specific needs of student subgroups
5D.1.Mentoring Program (continued)Implement ARP targeted for students who scored level 1 or 2, retained students and any student in need of academic support or assistance. Mentoring Program
5D.1.AdministrationLiteracy CoachGuidance Counselors
5D.1.Assessment OutcomesStudent GPA DifferentialWeekly Formal and Informal AssessmentsTeacher and Student Surveys
5D.1.Assessment OutcomesStudent GPA Differential
Reading Goal #5D:
Decrease the number of SWD not making satisfactory progress by 3%
2012 Current Level of Performance:*
2013 Expected Level of Performance:*
70% 67%
5D.2. 5D.2. 5D.2. 5D.2. 5D.2.
5D.3. 5D.3. 5D.3. 5D.3. 5D.3.
August 2012Rule 6A-1.099811Revised April 29, 2011
19

2012-2013 School Improvement Plan (SIP)-Form SIP-1Based on the analysis of student achievement data and reference to “Guiding Questions,” identify and define
areas in need of improvement for the following subgroup:
Anticipated Barrier Strategy Person or Position Responsible for Monitoring
Process Used to Determine Effectiveness of Strategy
Evaluation Tool
5E. Economically Disadvantaged students not making satisfactory progress in reading.
5E.1. Ensuring that the ARP provides differentiated academic programs aligned to the specific needs of student subgroups
5E.1.Mentoring Program Implement ARP targeted for students who scored level 1 or 2, retained students and any student in need of academic support or assistance.
5E.1.AdministrationLiteracy CoachGuidance Counselors
5E.1.Assessment OutcomesStudent GPA DifferentialWeekly Formal and Informal AssessmentsTeacher and Student Surveys
5E.1.Assessment OutcomesStudent GPA Differential
Reading Goal #5E:
Decrease the percentage of students not making gains by 3%
2012 Current Level of Performance:*
2013 Expected Level of Performance:*
57% 54%
5E.2. 5E.2. 5E.2. 5E.2. 5E.2.
5E.3. 5E.3. 5E.3. 5E.3. 5E.3.
Reading Professional DevelopmentProfessional Development (PD) aligned with Strategies through Professional Learning Community (PLC) or PD Activities
Please note that each strategy does not require a professional development or PLC activity.
PD Content/Topicand/or PLC Focus
Grade Level/ Subject
PD Facilitatorand/or
PLC Leader
PD Participants(e.g., PLC, subject, grade level,
or school-wide)
Target Dates (e.g., early release) and Schedules (e.g., frequency of
meetings)Strategy for Follow-up/Monitoring Person or Position Responsible
for Monitoring
SpringBoard 6th, 7th, & 8th / Reading Craig Cosden Reading Teachers September Lesson Plans, Classroom Observations Administration, Literacy Coach and
Department Heads
NGCAR-PD 6th, 7th, & 8th /Social Studies Craig Cosden Social Studies Teachers September Lesson Plans, Classroom Observations Administration, Literacy Coach and
Department Heads
Deliberate Practice All Staff Craig Cosden All Staff October Lesson Plans, Classroom Observations Administration and Literacy Coach
Common Core All Staff Craig Cosden All Staff On-going Lesson Plans, Classroom Observations Administration and Literacy Coach
CIS All Staff Craig Cosden All Staff On-going Lesson Plans, Classroom Observations Administration and Literacy Coach
August 2012Rule 6A-1.099811Revised April 29, 2011
20

2012-2013 School Improvement Plan (SIP)-Form SIP-1
Reading Budget (Insert rows as needed)Include only school funded activities/materials and exclude district funded activities/materials.Evidence-based Program(s)/Materials(s)Strategy Description of Resources Funding Source AmountSpringBoard Reading SpringBoard Workbook for each Student District Office/MDMSNGCAR-PDARP Teacher provided before, after and Sat. SAI $29,000
Subtotal:TechnologyStrategy Description of Resources Funding Source Amount
Subtotal:Professional DevelopmentStrategy Description of Resources Funding Source AmountSpringBoard Training for Reading Teachers
Trainer on staff and Substitutes MDMS/MDMS SAC $2100
NGCAR-PD Training for Social Studies Teachers
Trainer on staff MDMS $0
CIS Training for all teachers Trainer on staff MDMS $0Subtotal:
OtherStrategy Description of Resources Funding Source AmountCommon Lesson Plans w/CCSS imbedded
Literacy Coach $0
Subtotal: Total: 32,000
End of Reading Goals
August 2012Rule 6A-1.099811Revised April 29, 2011
21

2012-2013 School Improvement Plan (SIP)-Form SIP-1
Comprehensive English Language Learning Assessment (CELLA) Goals* When using percentages, include the number of students the percentage represents (e.g., 70% [35]).
CELLA Goals Problem-Solving Process to Increase Language AcquisitionStudents speak in English and understand spoken English at grade level in a manner similar to non-ELL students.
Anticipated Barrier Strategy Person or Position Responsible for Monitoring
Process Used to Determine Effectiveness of Strategy
Evaluation Tool
1. Students scoring proficient in listening/speaking.
1.1. English is a 2nd language
1.1.Provide ELL Teacher AssistantTeachers Endorsed or Certified in ESOLRosetta Stone
1.1.Administration
1.1.Staff reviewStudent CELLA Score Improvements
1.1.Assessment OutcomesStudent GPA Differential
CELLA Goal #1:
Increase the number of students scoring proficient in listening and speaking by 3%
2012 Current Percent of Students Proficient in Listening/Speaking:6th 33% (3)7th 58% (5)8th 40% (2)
1.2. 1.2. 1.2. 1.2. 1.2.
1.3. 1.3. 1.3. 1.3. 1.3.
Students read grade-level text in English in a manner similar to non-ELL students.
Anticipated Barrier Strategy Person or Position Responsible for Monitoring
Process Used to Determine Effectiveness of Strategy
Evaluation Tool
2. Students scoring proficient in reading. 2.1. English is a 2nd language
2.1.Provide ELL Teacher AssistantTeachers Endorsed or Certified in ESOLRosetta Stone
2.1.Administration
2.1.Staff reviewStudent CELLA Score Improvements
2.1.Assessment OutcomesStudent GPA Differential
CELLA Goal #2:
Increase the number of students scoring proficient in reading by 3%
2012 Current Percent of Students Proficient in Reading:6th 11% (1)7th 44% (4)8th 20% (1)
2.2. 2.2. 2.2. 2.2. 2.2.
2.3. 2.3. 2.3. 2.3. 2.3.
August 2012Rule 6A-1.099811Revised April 29, 2011
22

2012-2013 School Improvement Plan (SIP)-Form SIP-1Students write in English at grade level in a manner
similar to non-ELL students.Anticipated Barrier Strategy Person or Position
Responsible for MonitoringProcess Used to Determine Effectiveness of Strategy
Evaluation Tool
3. Students scoring proficient in writing. 2.1. English is a 2nd language
2.1.Provide ELL Teacher AssistantTeachers Endorsed or Certified in ESOLRosetta Stone
2.1.Administration
2.1.Staff reviewStudent CELLA Score Improvements
2.1.Assessment OutcomesStudent GPA Differential
CELLA Goal #3:
Increase the number of students scoring proficient in writing by 3%
2012 Current Percent of Students Proficient in Writing :6th 11% (1)7th 56% (5)8th 40% (2)
2.2. 2.2. 2.2. 2.2. 2.2.
2.3. 2.3. 2.3. 2.3. 2.3.
August 2012Rule 6A-1.099811Revised April 29, 2011
23

2012-2013 School Improvement Plan (SIP)-Form SIP-1
CELLA Budget (Insert rows as needed)Include only school-based funded activities/materials and exclude district funded activities/materials.Evidence-based Program(s)/Materials(s)Strategy Description of Resources Funding Source Amount
Subtotal:TechnologyStrategy Description of Resources Funding Source Amount
Subtotal:Professional DevelopmentStrategy Description of Resources Funding Source Amount
Subtotal:OtherStrategy Description of Resources Funding Source Amount
Subtotal: Total:
End of CELLA Goals
August 2012Rule 6A-1.099811Revised April 29, 2011
24

2012-2013 School Improvement Plan (SIP)-Form SIP-1
Middle School Mathematics Goals* When using percentages, include the number of students the percentage represents (e.g., 70% [35]).
Middle School Mathematics Goals Problem-Solving Process to Increase Student AchievementBased on the analysis of student achievement data and
reference to “Guiding Questions,” identify and define areas in need of improvement for the following group:
Anticipated Barrier Strategy Person or Position Responsible for Monitoring
Process Used to Determine Effectiveness of Strategy
Evaluation Tool
1A. FCAT 2.0: Students scoring at Achievement Level 3 in mathematics.
1A.1. Training for teachersTeaching Methods
1A.1. Coaching and mentoring of CCSSPENDAGradual Release MethodSmall Group InstructionContent Area Specific Vocab.Achieves Minis – 6th, 7th, and 8th
AVID
1A.1. Administration Instructional Coach
1A.1. Lesson PlansAdministrative team analysis of classroom monitoring dataContent area department evaluation of strategiesTeacher analysis of student classroom performance both informal and formal
1A.1. Assessment OutcomesStudent GPA Differential
Mathematics Goal #1A:
Increase the number of students scoring at 3 and above by 6% for 6th and 7th and 4% at 8th
2012 Current Level of Performance:*
2013 Expected Level of Performance:*
6th 29% (64)7th 27% (74)8th 28% (75)
6th 35%7th 33%8th 32%
1A.2. 1A.2. 1A.2. 1A.2. 1A.2.
1A.3. 1A.3. 1A.3. 1A.3. 1A.3.
1B. Florida Alternate Assessment: Students scoring at Levels 4, 5, and 6 in mathematics.
1B.1. 1B.1. 1B.1. 1B.1. 1B.1.
Mathematics Goal #1B:
Enter narrative for the goal in this box.
2012 Current Level of Performance:*
2013 Expected Level of Performance:*
Enter numerical data for current level of performance in this box.
Enter numerical data for expected level of performance in this box.
1B.2. 1B.2. 1B.2. 1B.2. 1B.2.
1B.3. 1B.3. 1B.3. 1B.3. 1B.3.
August 2012Rule 6A-1.099811Revised April 29, 2011
25

2012-2013 School Improvement Plan (SIP)-Form SIP-1Based on the analysis of student achievement data and
reference to “Guiding Questions,” identify and define areas in need of improvement for the following group:
Anticipated Barrier Strategy Person or Position Responsible for Monitoring
Process Used to Determine Effectiveness of Strategy
Evaluation Tool
2A. FCAT 2.0: Students scoring at or above Achievement Levels 4 and 5 in mathematics.
2A.1. Training for teachersTeaching Methods
2A.1. PENDASpringBoard MathCoaching and mentoring of CCSSGradual Release MethodSmall Group InstructionContent Area Specific Vocab.Achieves Minis – 6th, 7th, and 8th
AVID
2A.1. Administration and Instructional Coach
2A.1. Lesson PlansAdministrative team analysis of classroom monitoring dataContent area department evaluation of strategiesTeacher analysis of student classroom performance both informal and formal
2A.1. Assessment OutcomesStudent GPA Differential
Mathematics Goal #2A:
Increase current percentage levels for levels 4 and 5 at each grade level by 7%
2012 Current Level of Performance:*
2013 Expected Level of Performance:*
6th 18% (40)7th 18% (49)8th 16% (43)
6th 25%7th 25%8th 23%
2A.2. 2A.2. 2A.2. 2A.2. 2A.2.
2A.3. 2A.3. 2A.3. 2A.3. 2A.3.
2B. Florida Alternate Assessment: Students scoring at or above Level 7 in mathematics.
2B.1. 2B.1. 2B.1. 2B.1. 2B.1.
Mathematics Goal #2B:
Enter narrative for the goal in this box.
2012 Current Level of Performance:*
2013 Expected Level of Performance:*
Enter numerical data for current level of performance in this box.
Enter numerical data for expected level of performance in this box.
2B.2. 2B.2. 2B.2. 2B.2. 2B.2.
2B.3. 2B.3. 2B.3. 2B.3. 2B.3.
August 2012Rule 6A-1.099811Revised April 29, 2011
26

2012-2013 School Improvement Plan (SIP)-Form SIP-1Based on the analysis of student achievement data and
reference to “Guiding Questions,” identify and define areas in need of improvement for the following group:
Anticipated Barrier Strategy Person or Position Responsible for Monitoring
Process Used to Determine Effectiveness of Strategy
Evaluation Tool
3A. FCAT 2.0: Percentage of students making learning gains in mathematics.
3A.1. Training for teachersTeaching Methods
3A.1. PENDASpringBoard MathCoaching and mentoring of CCSSGradual Release MethodSmall Group InstructionContent Area Specific Vocab.Achieves Minis – 6th, 7th, and 8th
AVIDAcademic Recovery Program (ARP) Before/After School and Saturdays
3A.1. Administration and Instructional Coach
3A.1. Lesson PlansAdministrative team analysis of classroom monitoring dataContent area department evaluation of strategiesTeacher analysis of student classroom performance both informal and formal
3A.1. Assessment OutcomesStudent GPA Differential
Mathematics Goal #3A:
Increase the number of students making learning gains by 3%
2012 Current Level of Performance:*
2013 Expected Level of Performance:*
60% 63%
3A.2. 3A.2. 3A.2. 3A.2. 3A.2.
3A.3. 3A.3. 3A.3. 3A.3. 3A.3.
3B. Florida Alternate Assessment: Percentage of students making learning gains in mathematics.
3B.1. 3B.1. 3B.1. 3B.1. 3B.1.
Mathematics Goal #3B:
Enter narrative for the goal in this box.
2012 Current Level of Performance:*
2013 Expected Level of Performance:*
Enter numerical data for current level of performance in this box.
Enter numerical data for expected level of performance in this box.
3B.2. 3B.2. 3B.2. 3B.2. 3B.2.
3B.3. 3B.3. 3B.3. 3B.3. 3B.3.
August 2012Rule 6A-1.099811Revised April 29, 2011
27

2012-2013 School Improvement Plan (SIP)-Form SIP-1Based on the analysis of student achievement data and
reference to “Guiding Questions,” identify and define areas in need of improvement for the following group:
Anticipated Barrier Strategy Person or Position Responsible for Monitoring
Process Used to Determine Effectiveness of Strategy
Evaluation Tool
4. FCAT 2.0: Percentage of students in lowest 25% making learning gains in mathematics.
4A.1. Teacher TrainingTeaching Methods
4A.1. ARP Before/After/SaturdaysCoaching and mentoring of CCSSPENDAGradual Release MethodSmall Group InstructionContent Area Specific Vocab.Achieves Minis – 6th, 7th, and 8th
4A.1. Administration and Instructional Coach
4A.1. Lesson PlansAdministrative team analysis of classroom monitoring dataContent area department evaluation of strategiesTeacher analysis of student classroom performance both informal and formal
4A.1. Assessment OutcomesStudent GPA Differential
Mathematics Goal #4:
Increase the number of students identified as the lowest 25% making learning gains in math by 5%
2012 Current Level of Performance:*
2013 Expected Level of Performance:*
58% 63%
4A.2. 4A.2. 4A.2. 4A.2. 4A.2.
4A.3. 4A.3. 4A.3. 4A.3. 4A.3.
August 2012Rule 6A-1.099811Revised April 29, 2011
28

2012-2013 School Improvement Plan (SIP)-Form SIP-1Based on ambitious but achievable Annual Measurable Objectives (AMOs), identify reading and mathematics
performance target for the following years
2011-2012 2012-2013 2013-2014 2014-2015 2015-2016 2016-2017
5A. In six years, school will reduce their achievement gap by 50%.
Baseline data 2010-2011 51% 56% 60% 65% 69% 74%
Mathematics Goal #5A:
Reduce the achievement gap by 50% in math by 23% over the next five years.
Based on the analysis of student achievement data and reference to “Guiding Questions,” identify and define areas
in need of improvement for the following subgroups:
Anticipated Barrier Strategy Person or Position Responsible for Monitoring
Process Used to Determine Effectiveness of Strategy
Evaluation Tool
5B. Student subgroups by ethnicity (White, Black, Hispanic, Asian, American Indian) not making satisfactory progress in mathematics.
5B.1.Ensuring that the ARP provides differentiated academic programs aligned to the specific needs of student subgroups
5B.1.ARPCoaching and mentoring of CCSSPENDAGradual Release MethodSmall Group InstructionContent Area Specific Vocab.Achieves Minis – 6th, 7th, & 8th AVID
5B.1.AdministrationLiteracy CoachGuidance Counselors
5B.1.Weekly Formal and Informal AssessmentsTeacher and Student Surveys
5B.1.Assessment OutcomesStudent GPA Differential
Mathematics Goal #5B:
Reduce the number of students by ethnicity not making satisfactory progress in math 4% in 6th, 5% in 7th, and 6% in 8th
2012 Current Level of Performance:*
2013 Expected Level of Performance:*
White: 43%Black: 75%Hispanic: 67%
White: 39%Black: 70%Hispanic:61%
5B.2. 5B.2. 5B.2. 5B.2. 5B.2.
5B.3. 5B.3. 5B.3. 5B.3. 5B.3.
August 2012Rule 6A-1.099811Revised April 29, 2011
29

2012-2013 School Improvement Plan (SIP)-Form SIP-1Based on the analysis of student achievement data and
reference to “Guiding Questions,” identify and define areas in need of improvement for the following subgroup:
Anticipated Barrier Strategy Person or Position Responsible for Monitoring
Process Used to Determine Effectiveness of Strategy
Evaluation Tool
5C. English Language Learners (ELL) not making satisfactory progress in mathematics.
5C.1. Lack of a differentiated academic program aligned to the specific needs of student subgroups
5C.1.ARPPENDACoaching and mentoring of CCSSGradual Release MethodSmall Group InstructionContent Area Specific Vocab.Achieves Minis – 6th, 7th, & 8th AVID
5C.1.AdministrationLiteracy CoachGuidance Counselors
5C.1.Weekly Formal and Informal AssessmentsTeacher and Student Surveys
5C.1.Assessment OutcomesStudent GPA Differential
Mathematics Goal #5C:
Decrease the number of ELL students not making satisfactory progress in math by 7%.
2012 Current Level of Performance:*
2013 Expected Level of Performance:*
88% 81%
5C.2. 5C.2. 5C.2. 5C.2. 5C.2.
5C.3. 5C.3. 5C.3. 5C.3. 5C.3.
Based on the analysis of student achievement data and reference to “Guiding Questions,” identify and define areas
in need of improvement for the following subgroup:
Anticipated Barrier Strategy Person or Position Responsible for Monitoring
Process Used to Determine Effectiveness of Strategy
Evaluation Tool
5D. Students with Disabilities (SWD) not making satisfactory progress in mathematics.
5D.1. Lack of differentiated academic program aligned to the specific needs of student subgroups
5D.1.ARPPENDACoaching and mentoring of CCSSGradual Release MethodSmall Group InstructionContent Area Specific Vocab.Achieves Minis – 6th, 7th, & 8th
5D.1.AdministrationLiteracy CoachGuidance Counselors
5D.1.Weekly Formal and Informal AssessmentsTeacher and Student Surveys
5D.1.Assessment OutcomesStudent GPA Differential
Mathematics Goal #5D:
Decrease the number of SWD not making satisfactory progress in math.
2012 Current Level of Performance:*
2013 Expected Level of Performance:*
74% 64%
5D.2. 5D.2. 5D.2. 5D.2. 5D.2.
5D.3. 5D.3. 5D.3. 5D.3. 5D.3.
August 2012Rule 6A-1.099811Revised April 29, 2011
30

2012-2013 School Improvement Plan (SIP)-Form SIP-1Based on the analysis of student achievement data and
reference to “Guiding Questions,” identify and define areas in need of improvement for the following subgroup:
Anticipated Barrier Strategy Person or Position Responsible for Monitoring
Process Used to Determine Effectiveness of Strategy
Evaluation Tool
5E. Economically Disadvantaged students not making satisfactory progress in mathematics.
5E.1. Ensuring that the ARP provides differentiated academic programs aligned to the specific needs of student subgroups
5E.1.Coaching and mentoring of CCSSPENDAGradual Release MethodSmall Group InstructionContent Area Specific Vocab.
5E.1.AdministrationLiteracy CoachGuidance Counselors
5E.1.Weekly Formal and Informal AssessmentsTeacher and Student Surveys
5E.1.Assessment OutcomesStudent GPA Differential
Mathematics Goal #5E:
Decrease the number of ED students not making satisfactory progress in math by 10%
2012 Current Level of Performance:*
2013 Expected Level of Performance:*
60% 50%
5E.2. 5E.2. 5E.2. 5E.2. 5E.2.
5E.3. 5E.3. 5E.3. 5E.3. 5E.3.
End of Middle School Mathematics Goals
August 2012Rule 6A-1.099811Revised April 29, 2011
31

2012-2013 School Improvement Plan (SIP)-Form SIP-1
Algebra 1 End-of-Course (EOC) Goals (this section needs to be completed by all schools that have students taking the Algebra I EOC)* When using percentages, include the number of students the percentage represents (e.g., 70% [35]).
Algebra 1 EOC Goals Problem-Solving Process to Increase Student AchievementBased on the analysis of student achievement data and reference to “Guiding Questions,” identify and define areas in need of improvement for the following group:
Anticipated Barrier Strategy Person or Position Responsible for Monitoring
Process Used to Determine Effectiveness of
Strategy
Evaluation Tool
1. Students scoring at Achievement Level 3 in Algebra 1.
1.1. Teacher effectiveness in teaching CCSS
1.1.PENDACoaching and Mentoring CCSSAVIDGraduated Release ModelSmall group instructionContent Specific Vocab.
1.1.AdministrationInstructional Coach
1.1Lesson PlansInformal and formal teacher observations
1.1.Assessment OutcomesStudent GPA Differential
Algebra 1 Goal #1:
Increase the number of students scoring at 3 or higher on the Algebra 1 EOC by 8%
2012 Current Level of Performance:*
2013 Expected Level of Performance:*
80% 88%
1.2. Increasing the number of higher level courses offered
1.2.Add additional classes to the master schedule
1.2.Administration and Guidance
1.2.AS400 and FIDO Data
1.2.Assessment OutcomesStudent GPA Differential
1.3. 1.3. 1.3. 1.3. 1.3.
Based on the analysis of student achievement data and reference to “Guiding Questions,” identify and define areas in need of improvement for the following group:
Anticipated Barrier Strategy Person or Position Responsible for Monitoring
Process Used to Determine Effectiveness of Strategy
Evaluation Tool
2. Students scoring at or above Achievement Levels 4 and 5 in Algebra 1.
2.1. Teacher effectiveness in teaching CCSS
2.1.PENDACoaching and Mentoring CCSSAVIDGraduated Release ModelSmall group instructionContent Specific Vocab.
2.1.AdministrationInstructional Coach
2.1Lesson PlansInformal and formal teacher observations
2.1.Assessment OutcomesStudent GPA Differential
Algebra Goal #2:Increase the number of students scoring at or above Achievement levels 4 and 5 on the Algebra 1 EOC by 8%
2012 Current Level of Performance:*
2013 Expected Level of Performance:*
17% 25%
2.2. Increasing the number of higher level courses offered
2.2.Add additional classes to the master schedule
2.2.Administration and Guidance
2.2.AS400 and FIDO Data
2.2.Assessment OutcomesStudent GPA Differential
2.3. 2.3. 2.3. 2.3. 2.3.
August 2012Rule 6A-1.099811Revised April 29, 2011
32

2012-2013 School Improvement Plan (SIP)-Form SIP-1
August 2012Rule 6A-1.099811Revised April 29, 2011
33

2012-2013 School Improvement Plan (SIP)-Form SIP-1Based on ambitious but achievable Annual Measurable Objectives (AMOs), identify reading and mathematics
performance target for the following years
2011-2012 2012-2013 2013-2014 2014-2015 2015-2016 2016-2017
3A. In six years, school will reduce their achievement gap by 50%.
Baseline data 2010-2011
Algebra 1 Goal #3A:
.
Based on the analysis of student achievement data and reference to “Guiding Questions,” identify and define
areas in need of improvement for the following subgroups:
Anticipated Barrier Strategy Person or Position Responsible for Monitoring
Process Used to Determine Effectiveness of Strategy
Evaluation Tool
3B. Student subgroups by ethnicity (White, Black, Hispanic, Asian, American Indian) not making satisfactory progress in Algebra 1.
3B.1.White:Black:Hispanic:Asian:American Indian:
3B.1. 3B.1. 3B.1. 3B.1.
Algebra 1 Goal #3B:
Enter narrative for the goal in this box.
2012 Current Level of Performance:*
2013 Expected Level of Performance:*
Enter numerical data for current level of performance in this box.White:Black:Hispanic:Asian:American Indian:
Enter numerical data for expected level of performance in this box.White:Black:Hispanic:Asian:American Indian:
3B.2. 3B.2. 3B.2. 3B.2. 3B.2.
3B.3. 3B.3. 3B.3. 3B.3. 3B.3.
August 2012Rule 6A-1.099811Revised April 29, 2011
34

2012-2013 School Improvement Plan (SIP)-Form SIP-1Based on the analysis of student achievement data and reference to “Guiding Questions,” identify and define
areas in need of improvement for the following subgroup:
Anticipated Barrier Strategy Person or Position Responsible for Monitoring
Process Used to Determine Effectiveness of Strategy
Evaluation Tool
3C. English Language Learners (ELL) not making satisfactory progress in Algebra 1.
3C.1. 3C.1. 3C.1. 3C.1. 3C.1.
Algebra 1 Goal #3C:
Enter narrative for the goal in this box.
2012 Current Level of Performance:*
2013 Expected Level of Performance:*
Enter numerical data for current level of performance in this box.
Enter numerical data for expected level of performance in this box.
3C.2. 3C.2. 3C.2. 3C.2. 3C.2.
3C.3. 3C.3. 3C.3. 3C.3. 3C.3.
Based on the analysis of student achievement data and reference to “Guiding Questions,” identify and define
areas in need of improvement for the following subgroup:
Anticipated Barrier Strategy Person or Position Responsible for Monitoring
Process Used to Determine Effectiveness of Strategy
Evaluation Tool
3D. Students with Disabilities (SWD) not making satisfactory progress in Algebra 1.
3D.1. 3D.1. 3D.1. 3D.1. 3D.1.
Algebra 1 Goal #3D:
Enter narrative for the goal in this box.
2012 Current Level of Performance:*
2013 Expected Level of Performance:*
Enter numerical data for current level of performance in this box.
Enter numerical data for expected level of performance in this box.
3D.2. 3D.2. 3D.2. 3D.2. 3D.2.
3D.3. 3D.3. 3D.3. 3D.3. 3D.3.
August 2012Rule 6A-1.099811Revised April 29, 2011
35

2012-2013 School Improvement Plan (SIP)-Form SIP-1Based on the analysis of student achievement data and reference to “Guiding Questions,” identify and define
areas in need of improvement for the following subgroup:
Anticipated Barrier Strategy Person or Position Responsible for Monitoring
Process Used to Determine Effectiveness of Strategy
Evaluation Tool
3E. Economically Disadvantaged students not making satisfactory progress in Algebra 1.
3E.1. 3E.1. 3E.1. 3E.1. 3E.1.
Algebra 1 Goal #3E:
Enter narrative for the goal in this box.
2012 Current Level of Performance:*
2013 Expected Level of Performance:*
Enter numerical data for current level of performance in this box.
Enter numerical data for expected level of performance in this box.
3E.2. 3E.2. 3E.2. 3E.2. 3E.2.
3E.3. 3E.3. 3E.3. 3E.3. 3E.3.
End of Algebra 1 EOC Goals
August 2012Rule 6A-1.099811Revised April 29, 2011
36

2012-2013 School Improvement Plan (SIP)-Form SIP-1
Geometry End-of-Course Goals (this section needs to be completed by all schools that have students taking the Geometry EOC)* When using percentages, include the number of students the percentage represents (e.g., 70% [35]).
Geometry EOC Goals Problem-Solving Process to Increase Student AchievementBased on the analysis of student achievement data and reference to “Guiding Questions,” identify and define areas in need of improvement for the following group:
Anticipated Barrier Strategy Person or Position Responsible for Monitoring
Process Used to Determine Effectiveness of Strategy
Evaluation Tool
1. Students scoring at Achievement Level 3 in Geometry.
1.1. 1.1. 1.1. 1.1. 1.1.
Geometry Goal #1:
Enter narrative for the goal in this box.
2012 Current Level of Performance:*
2013 Expected Level of Performance:*
Data not available
Enter numerical data for expected level of performance in this box.
1.2. 1.2. 1.2. 1.2. 1.2.
1.3. 1.3. 1.3. 1.3. 1.3.
Based on the analysis of student achievement data and reference to “Guiding Questions,” identify and define areas in need of improvement for the following group:
Anticipated Barrier Strategy Person or Position Responsible for Monitoring
Process Used to Determine Effectiveness of Strategy
Evaluation Tool
2. Students scoring at or above Achievement Levels 4 and 5 in Geometry.
2.1. 2.1. 2.1. 2.1. 2.1.
Geometry Goal #2:
Enter narrative for the goal in this box.
2012 Current Level of Performance:*
2013 Expected Level of Performance:*
Enter numerical data for current level of performance in this box.
Enter numerical data for expected level of performance in this box.
2.2. 2.2. 2.2. 2.2. 2.2.
2.3. 2.3. 2.3. 2.3. 2.3.
August 2012Rule 6A-1.099811Revised April 29, 2011
37

2012-2013 School Improvement Plan (SIP)-Form SIP-1Based on ambitious but achievable Annual Measurable Objectives (AMOs), identify reading and mathematics
performance target for the following years
2012-2013 2013-2014 2014-2015 2015-2016 2016-2017
3A. In six years, school will reduce their achievement gap by 50%.
Baseline data 2011-2012
Geometry Goal #3A:
Enter narrative for the goal in this box.
Based on the analysis of student achievement data and reference to “Guiding Questions,” identify and define
areas in need of improvement for the following subgroups:
Anticipated Barrier Strategy Person or Position Responsible for Monitoring
Process Used to Determine Effectiveness of Strategy
Evaluation Tool
3B. Student subgroups by ethnicity (White, Black, Hispanic, Asian, American Indian) not making satisfactory progress in Geometry.
3B.1.White:Black:Hispanic:Asian:American Indian:
3B.1. 3B.1. 3B.1. 3B.1.
Geometry Goal #3B:
Enter narrative for the goal in this box.
2012 Current Level of Performance:*
2013 Expected Level of Performance:*
Enter numerical data for current level of performance in this box. White:Black:Hispanic:Asian:American Indian:
Enter numerical data for expected level of performance in this box.White:Black:Hispanic:Asian:American Indian:
3B.2. 3B.2. 3B.2. 3B.2. 3B.2.
3B.3. 3B.3. 3B.3. 3B.3. 3B.3.
August 2012Rule 6A-1.099811Revised April 29, 2011
38

2012-2013 School Improvement Plan (SIP)-Form SIP-1Based on the analysis of student achievement data and reference to “Guiding Questions,” identify and define
areas in need of improvement for the following subgroup:
Anticipated Barrier Strategy Person or Position Responsible for Monitoring
Process Used to Determine Effectiveness of Strategy
Evaluation Tool
3C. English Language Learners (ELL) not making satisfactory progress in Geometry.
3C.1. 3C.1. 3C.1. 3C.1. 3C.1.
Geometry Goal #3C:
Enter narrative for the goal in this box.
2012 Current Level of Performance:*
2013 Expected Level of Performance:*
Enter numerical data for current level of performance in this box.
Enter numerical data for expected level of performance in this box.
3C.2. 3C.2. 3C.2. 3C.2. 3C.2.
3C.3. 3C.3. 3C.3. 3C.3. 3C.3.
Based on the analysis of student achievement data and reference to “Guiding Questions,” identify and define
areas in need of improvement for the following subgroup:
Anticipated Barrier Strategy Person or Position Responsible for Monitoring
Process Used to Determine Effectiveness of Strategy
Evaluation Tool
3D. Students with Disabilities (SWD) not making satisfactory progress in Geometry.
3D.1. 3D.1. 3D.1. 3D.1. 3D.1.
Geometry Goal #3D:
Enter narrative for the goal in this box.
2012 Current Level of Performance:*
2013 Expected Level of Performance:*
Enter numerical data for current level of performance in this box.
Enter numerical data for expected level of performance in this box.
3D.2. 3D.2. 3D.2. 3D.2. 3D.2.
3D.3. 3D.3. 3D.3. 3D.3. 3D.3.
August 2012Rule 6A-1.099811Revised April 29, 2011
39

2012-2013 School Improvement Plan (SIP)-Form SIP-1Based on the analysis of student achievement data and reference to “Guiding Questions,” identify and define
areas in need of improvement for the following subgroup:
Anticipated Barrier Strategy Person or Position Responsible for Monitoring
Process Used to Determine Effectiveness of Strategy
Evaluation Tool
3E. Economically Disadvantaged students not making satisfactory progress in Geometry.
3E.1. 3E.1. 3E.1. 3E.1. 3E.1.
Geometry Goal #3E:
Enter narrative for the goal in this box.
2012 Current Level of Performance:*
2013 Expected Level of Performance:*
Enter numerical data for current level of performance in this box.
Enter numerical data for expected level of performance in this box.
3E.2. 3E.2. 3E.2. 3E.2. 3E.2.
3E.3. 3E.3. 3E.3. 3E.3. 3E.3.
End of Geometry EOC Goals
Mathematics Professional DevelopmentProfessional Development (PD) aligned with Strategies through Professional Learning Community (PLC) or PD Activities
Please note that each strategy does not require a professional development or PLC activity.
PD Content/Topicand/or PLC Focus
Grade Level/ Subject
PD Facilitatorand/or
PLC Leader
PD Participants(e.g., PLC, subject, grade level,
or school-wide)
Target Dates (e.g., early release) and Schedules (e.g., frequency of
meetings)Strategy for Follow-up/Monitoring Person or Position Responsible
for Monitoring
SpringBoard Math 8th Craig Cosden Algebra 1 Teachers October 2012 Lesson Plans and Classroom Observations Administration and Instructional Coach
PENDA 6th, 7th, and 8th Sandra Sellers Math teachers in 6th, 7th, and 8th October 2012 Lesson Plans and Classroom Observations Administration and Instructional Coach
Mini Achieves 6th, 7th, and 8th Karen Hart Math teachers in 6th, 7th, and 8th November 2012 Lesson Plans and Classroom Observations Administration and Instructional Coach
August 2012Rule 6A-1.099811Revised April 29, 2011
40

2012-2013 School Improvement Plan (SIP)-Form SIP-1
Mathematics Budget (Insert rows as needed)
Include only school-based funded activities/materials and exclude district funded activities /materials.Evidence-based Program(s)/Materials(s)Strategy Description of Resources Funding Source AmountAcademic Recovery Program Instructional Personnel SAI $7250
Subtotal:TechnologyStrategy Description of Resources Funding Source AmountPENDA Computer Based Recovery District $0
Subtotal:Professional DevelopmentStrategy Description of Resources Funding Source AmountSQ4R Refresher Text based instruction MDMS
Gradual Release Model Scientifically Based Research (SBR) – Instructional Practices MDMS 0
Common Core State Standards Aligned with national standards in math MDMS 0Achieves Minis Aligned with national standards in math MDMS 0
Subtotal:OtherStrategy Description of Resources Funding Source Amount
Subtotal: Total:
End of Mathematics Goals
August 2012Rule 6A-1.099811Revised April 29, 2011
41

2012-2013 School Improvement Plan (SIP)-Form SIP-1
Elementary and Middle School Science Goals* When using percentages, include the number of students the percentage represents (e.g., 70% [35]).
Elementary and Middle Science Goals
Problem-Solving Process to Increase Student Achievement
Based on the analysis of student achievement data and reference to “Guiding Questions,” identify and define areas in need of improvement for the following group:
Anticipated Barrier Strategy Person or Position Responsible for Monitoring
Process Used to Determine Effectiveness of Strategy
Evaluation Tool
1A. FCAT 2.0: Students scoring at Achievement Level 3 in science.
1A.1. Students demonstrate difficulty with analyzing and applying scientific information previously learned.
1A.1. Use daily IFCR’s
Use of PENDA Learning, Science FCAT Explorer, and Curriculum Pathways via Moodle.
AVID implemented in 7th & 8th grades.
Advanced science classes in all grade levels implemented (132 students).
Progress monitor science tests administered 3 times/year.
Springboard implemented.
1A.1. Department Chair, Administration.
1A.1. Lesson plan reviewFormal and Informal Teacher Observations
1A.1. FCAT science resultsTeacher made assessmentsProgress Monitoring testsMini Assessments with IFC
Science Goal #1A:
Increase the number of students scoring at level 3 and above by 4%
2012 Current Level of Performance:*
2013 Expected Level of Performance:*
8th 32% (85) 8th 36%
1A.2. Students struggle with thinking and applying skills based on informational non-fiction scientific reading.
1A.2. Utilize interactive word walls to learn how to synthesize the meaning of science vocabulary through conversation, direct instruction, & reading.
Use Cornell notes to recall main idea, organize discussion information, & summarize what the student understood about the lesson.
SQ4R used to interpret science information.
Use of NGSS, FCAT 2.0, & common core standards.
Cooperative small groups.
Use of the gradual release model.
1A.2. Department Chair,Administration.
1A.2. Lesson plan reviewClassroom walkthroughs
1.2FCAT science resultsTeacher made assessmentsProgress Monitoring tests.
August 2012Rule 6A-1.099811Revised April 29, 2011
42

2012-2013 School Improvement Plan (SIP)-Form SIP-1
Utilize literacy in science fiction books & the DBQ model.
Provide additional reading materials, i.e., magazines, high-interest books in the classroom for students to read when finished with assigned class work.
Provide real-world application via homework assignments and labs.
1A.3. Students lack the ability to formulate predictions, organize & interpret data, and communicate results when engaged in hands-on activities.
1A.3. Use inquiry based lesson plans that allow students to generate questions about a topic & design their own investigations with write ups 8 per 9 weeks.
Webb’s DOK Levels 3 & 4 terms/concepts emphasized in lesson delivery and in student responses.
Provide relevant real-world science experiences and engaging activities, i.e., Webquests.
1A.3. Department / PLC chairScience teachers
1A.3. PLC meetingsLesson plan reviewClassroom walkthroughsLab document forms
1A.3.FCAT science resultsTeacher made assessmentsProgress Monitoring tests
1B. Florida Alternate Assessment: Students scoring at Levels 4, 5, and 6 in science.
1B.1. 1B.1. 1B.1. 1B.1. 1B.1.
Science Goal #1B:
Enter narrative for the goal in this box.
2012 Current Level of Performance:*
2013 Expected Level of Performance:*
Enter numerical data for current level of performance in this box.
Enter numerical data for expected level of performance in this box.
1B.2. 1B.2. 1B.2. 1B.2. 1B.2.
1B.3. 1B.3. 1B.3. 1B.3. 1B.3.
Based on the analysis of student achievement data and reference to “Guiding Questions,” identify and define areas in need of improvement for the following group:
Anticipated Barrier Strategy Person or Position Responsible for Monitoring
Process Used to Determine Effectiveness of Strategy
Evaluation Tool
August 2012Rule 6A-1.099811Revised April 29, 2011
43

2012-2013 School Improvement Plan (SIP)-Form SIP-12A. FCAT 2.0: Students scoring at or above Achievement Levels 4 and 5 in science.
2A.1.Difficulty in applying information previously learned
Number of higher level courses offered
2A.1.IFCRCCSSInquiry LessonsPENDAAVIDSQ4RAchieves MinisIncrease the number of higher level Courses offered
2A.1.AdministrationLiteracy Coach
2A.1.PLC meetingsLesson plan reviewClassroom walkthroughsLab document forms
2A.1.FCAT science resultsTeacher made assessmentsProgress Monitoring testsScience Goal #2A:
Increase the number of students scoring at level 4 and 5 by 8%.
2012 Current Level of Performance:*
2013Expected Level of Performance:*
8th 9% (24) 8th 17%
2A.2. 2A.2. 2A.2. 2A.2. 2A.2.
2A.3. 2A.3. 2A.3. 2A.3. 2A.3.
2B. Florida Alternate Assessment: Students scoring at or above Level 7 in science.
2B.1. 2B.1. 2B.1. 2B.1. 2B.1.
Science Goal #2B:
Enter narrative for the goal in this box.
2012 Current Level of Performance:*
2013Expected Level of Performance:*
Enter numerical data for current level of performance in this box.
Enter numerical data for expected level of performance in this box.
2B.2. 2B.2. 2B.2. 2B.2. 2B.2.
2B.3. 2B.3. 2B.3. 2B.3. 2B.3.
End of Elementary and Middle School Science Goals
August 2012Rule 6A-1.099811Revised April 29, 2011
44

2012-2013 School Improvement Plan (SIP)-Form SIP-1
Biology 1 End-of-Course (EOC) Goals (this section needs to be completed by all schools that have students taking the Biology I EOC)* When using percentages, include the number of students the percentage represents (e.g., 70% [35]).
Biology 1 EOC Goals Problem-Solving Process to Increase Student AchievementBased on the analysis of student achievement data and reference to “Guiding Questions,” identify and define areas in need of improvement for the following group:
Anticipated Barrier Strategy Person or Position Responsible for Monitoring
Process Used to Determine Effectiveness of Strategy
Evaluation Tool
1. Students scoring at Achievement Level 3 in Biology 1.
1.1. 1.1. 1.1. 1.1. 1.1.
Biology 1 Goal #1:
Enter narrative for the goal in this box.
2012 Current Level of Performance:*
2013 Expected Level of Performance:*
Enter numerical data for current level of performance in this box.
Enter numerical data for expected level of performance in this box.
1.2. 1.2. 1.2. 1.2. 1.2.
1.3. 1.3. 1.3. 1.3. 1.3.
Based on the analysis of student achievement data and reference to “Guiding Questions,” identify and define areas in need of improvement for the following group:
Anticipated Barrier Strategy Person or Position Responsible for Monitoring
Process Used to Determine Effectiveness of Strategy
Evaluation Tool
2. Students scoring at or above Achievement Levels 4 and 5 in Biology 1.
2.1. 2.1. 2.1. 2.1. 2.1.
Biology 1 Goal #2:
Enter narrative for the goal in this box.
2012 Current Level of Performance:*
2013 Expected Level of Performance:*
Enter numerical data for current level of performance in this box.
Enter numerical data for expected level of performance in this box.
2.2. 2.2. 2.2. 2.2. 2.2.
2.3. 2.3. 2.3. 2.3. 2.3.
End of Biology 1 EOC Goals
August 2012Rule 6A-1.099811Revised April 29, 2011
45

2012-2013 School Improvement Plan (SIP)-Form SIP-1
Science Professional DevelopmentProfessional Development (PD) aligned with Strategies through Professional Learning Community (PLC) or PD Activity
Please note that each Strategy does not require a professional development or PLC activity.PD Content /Topicand/or PLC Focus Grade
Level/Subject
PD Facilitatorand/or
PLC Leader
PD Participants (e.g. , PLC, subject, grade level, or
school-wide)
Target Dates (e.g. , Early Release) and Schedules (e.g.,
frequency of meetings)Strategy for Follow-up/Monitoring Person or Position Responsible for
Monitoring
SQ4R Refresher Science MDMS Science Department Fall 2012 Administration, LCGradual Release Model Science MDMS Science Department Fall 2012 Administration, LC
Common Core State Standards Science MDMS Science Department Fall 2012 Administration, LC
Achieves Minis Science MDMS Science Department Fall 2012 Administration, LC
Science Budget (Insert rows as needed)Include only school-based funded activities/materials and exclude district funded activities/materials.Evidence-based Program(s)/Materials(s)Strategy Description of Resources Funding Source Amount
Subtotal:TechnologyStrategy Description of Resources Funding Source Amount
Subtotal:Professional DevelopmentStrategy Description of Resources Funding Source Amount
Subtotal:OtherStrategy Description of Resources Funding Source Amount
Subtotal: Total:
August 2012Rule 6A-1.099811Revised April 29, 2011
46

2012-2013 School Improvement Plan (SIP)-Form SIP-1End of Science Goals
August 2012Rule 6A-1.099811Revised April 29, 2011
47

2012-2013 School Improvement Plan (SIP)-Form SIP-1
Writing Goals* When using percentages, include the number of students the percentage represents (e.g., 70% [35]).
Writing Goals Problem-Solving Process to Increase Student AchievementBased on the analysis of student achievement data and
reference to “Guiding Questions,” identify and define areas in need of improvement for the following group:
Anticipated Barrier Strategy Person or Position Responsible for Monitoring
Process Used to Determine Effectiveness of Strategy
Evaluation Tool
1A. FCAT: Students scoring at Achievement Level 3.0 and higher in writing.
1A.1.Student Motivation
Teacher inability to teach the writing process
1A.1.Incorporate daily writing strategies in all curriculum areas raising the level of expectations in classes.
Inclusion of CIS instructional model – based on text analysis and the writing process
On 10/1 SpringBoard ELA has been implemented in all LA classes
Deepen the understanding of the FCAT scoring rubric by teachers and students
Utilize peer coaching, editing, and scoring.
Explicit instruction of writing as a process
1A.1.AdministrationLiteracy Coach
1A.1.Lesson Plans Informal and Formal Teacher Observations
1A.1.Assessment OutcomesStudent GPA Differential
Writing Goal #1A:
Increase the number of students scoring at 3.0 and higher in writing by 3%
2012 Current Level of Performance:*
2013 Expected Level of Performance:*
80% (211)
83%
1A.2. 1A.2. 1A.2. 1A.2. 1A.2.
1A.3. 1A.3. 1A.3. 1A.3. 1A.3.
1B. Florida Alternate Assessment: Students scoring at 4 or higher in writing.
1B.1. 1B.1. 1B.1. 1B.1. 1B.1.
Writing Goal #1B:
Enter narrative for the goal in this box.
2012 Current Level of Performance:*
2013 Expected Level of Performance:*
August 2012Rule 6A-1.099811Revised April 29, 2011
48

2012-2013 School Improvement Plan (SIP)-Form SIP-1Enter numerical data for expected level of performance in this box.
1B.2. 1B.2. 1B.2. 1B.2. 1B.2.
1B.3. 1B.3. 1B.3. 1B.3. 1B.3.
August 2012Rule 6A-1.099811Revised April 29, 2011
49

2012-2013 School Improvement Plan (SIP)-Form SIP-1
Writing Professional DevelopmentProfessional Development (PD) aligned with Strategies through Professional Learning Community (PLC) or PD Activity
Please note that each Strategy does not require a professional development or PLC activity.PD Content /Topicand/or PLC Focus Grade
Level/Subject
PD Facilitatorand/or
PLC Leader
PD Participants (e.g. , PLC, subject, grade level, or
school-wide)
Target Dates (e.g. , Early Release) and Schedules (e.g.,
frequency of meetings)Strategy for Follow-up/Monitoring Person or Position Responsible for
Monitoring
SpringBoard 6th, 7th, & 8th Cosden/Colarossi 6th, 7th, & 8th ELA Sept/Oct Classroom Visitation Process Admin and Instructional Coach
CIS Development 6th, 7th, & 8th Cosden/Colarossi
6th, 7th, & 8th Social Studies & Reading Sept/Nov Classroom Visitation Process Admin and Instructional Coach
Writing Budget (Insert rows as needed)Include only school-based funded activities/materials and exclude district funded activities/materials.Evidence-based Program(s)/Materials(s)Strategy Description of Resources Funding Source AmountSpringBoard Teacher Training SAC/DistrictCIS Teacher Training SAC/District
Subtotal:TechnologyStrategy Description of Resources Funding Source Amount
Subtotal:Professional DevelopmentStrategy Description of Resources Funding Source AmountSpringBoard Teacher Training SAC/DistrictCIS Teacher Training SAC/District
Subtotal:OtherStrategy Description of Resources Funding Source Amount
Subtotal: Total:
August 2012Rule 6A-1.099811Revised April 29, 2011
50

2012-2013 School Improvement Plan (SIP)-Form SIP-1End of Writing Goals
August 2012Rule 6A-1.099811Revised April 29, 2011
51

2012-2013 School Improvement Plan (SIP)-Form SIP-1
Civics End-of-Course (EOC) Goals (required in year 2014-2015) * When using percentages, include the number of students the percentage represents (e.g., 70% [35]).
Civics EOC Goals Problem-Solving Process to Increase Student AchievementBased on the analysis of student achievement data and reference to “Guiding Questions,” identify and define areas in need of improvement for the following group:
Anticipated Barrier Strategy Person or Position Responsible for Monitoring
Process Used to Determine Effectiveness of Strategy
Evaluation Tool
1. Students scoring at Achievement Level 3 in Civics.
1.1. 1.1. 1.1. 1.1. 1.1.
Civics Goal #1:
Enter narrative for the goal in this box.
2012 Current Level of Performance:*
2013 Expected Level of Performance:*
Enter numerical data for current level of performance in this box.
Enter numerical data for expected level of performance in this box.
1.2. 1.2. 1.2. 1.2. 1.2.
1.3. 1.3. 1.3. 1.3. 1.3.
Based on the analysis of student achievement data and reference to “Guiding Questions,” identify and define areas in need of improvement for the following group:
Anticipated Barrier Strategy Person or Position Responsible for Monitoring
Process Used to Determine Effectiveness of Strategy
Evaluation Tool
2. Students scoring at or above Achievement Levels 4 and 5 in Civics.
2.1. 2.1. 2.1. 2.1. 2.1.
Civics Goal #2:
Enter narrative for the goal in this box.
2012 Current Level of Performance:*
2013 Expected Level of Performance:*
Enter numerical data for current level of performance in this box.
Enter numerical data for expected level of performance in this box.
2.2. 2.2. 2.2. 2.2. 2.2.
2.3. 2.3. 2.3. 2.3. 2.3.
August 2012Rule 6A-1.099811Revised April 29, 2011
52

2012-2013 School Improvement Plan (SIP)-Form SIP-1
Civics Professional Development
Professional Development (PD) aligned with Strategies through Professional Learning Community (PLC) or PD ActivityPlease note that each Strategy does not require a professional development or PLC activity.
PD Content /Topicand/or PLC Focus Grade
Level/Subject
PD Facilitatorand/or
PLC Leader
PD Participants (e.g. , PLC, subject, grade level, or
school-wide)
Target Dates (e.g. , Early Release) and Schedules (e.g.,
frequency of meetings)Strategy for Follow-up/Monitoring Person or Position Responsible for
Monitoring
Civics Budget (Insert rows as needed)Include only school-based funded activities/materials and exclude district funded activities /materials.Evidence-based Program(s)/Materials(s)Strategy Description of Resources Funding Source Amount
Subtotal:TechnologyStrategy Description of Resources Funding Source Amount
Subtotal:Professional DevelopmentStrategy Description of Resources Funding Source Amount
Subtotal:OtherStrategy Description of Resources Funding Source Amount
Subtotal: Total:
End of Civics Goals
August 2012Rule 6A-1.099811Revised April 29, 2011
53

2012-2013 School Improvement Plan (SIP)-Form SIP-1
U.S. History End-of-Course (EOC) Goals (required in year 2013-2014) * When using percentages, include the number of students the percentage represents (e.g., 70% [35]).
U.S. History EOC Goals Problem-Solving Process to Increase Student AchievementBased on the analysis of student achievement data and reference to “Guiding Questions,” identify and define areas in need of improvement for the following group:
Anticipated Barrier Strategy Person or Position Responsible for Monitoring
Process Used to Determine Effectiveness of Strategy
Evaluation Tool
1. Students scoring at Achievement Level 3 in U.S. History.
1.1. 1.1. 1.1. 1.1. 1.1.
U.S. History Goal #1:
Enter narrative for the goal in this box.
2012 Current Level of Performance:*
2013 Expected Level of Performance:*
Enter numerical data for current level of performance in this box.
Enter numerical data for expected level of performance in this box.
1.2. 1.2. 1.2. 1.2. 1.2.
1.3. 1.3. 1.3. 1.3. 1.3.
Based on the analysis of student achievement data and reference to “Guiding Questions,” identify and define areas in need of improvement for the following group:
Anticipated Barrier Strategy Person or Position Responsible for Monitoring
Process Used to Determine Effectiveness of Strategy
Evaluation Tool
2. Students scoring at or above Achievement Levels 4 and 5 in U.S. History.
2.1. 2.1. 2.1. 2.1. 2.1.
U.S. History Goal #2:
Enter narrative for the goal in this box.
2012 Current Level of Performance:*
2013 Expected Level of Performance:*
Enter numerical data for current level of performance in this box.
Enter numerical data for expected level of performance in this box.
2.2. 2.2. 2.2. 2.2. 2.2.
2.3. 2.3. 2.3. 2.3. 2.3.
August 2012Rule 6A-1.099811Revised April 29, 2011
54

2012-2013 School Improvement Plan (SIP)-Form SIP-1
U.S. History Professional DevelopmentProfessional Development (PD) aligned with Strategies through Professional Learning Community (PLC) or PD Activity
Please note that each Strategy does not require a professional development or PLC activity.PD Content /Topicand/or PLC Focus Grade
Level/Subject
PD Facilitatorand/or
PLC Leader
PD Participants (e.g. , PLC, subject, grade level, or
school-wide)
Target Dates (e.g. , Early Release) and Schedules (e.g.,
frequency of meetings)Strategy for Follow-up/Monitoring Person or Position Responsible for
Monitoring
U.S. History Budget (Insert rows as needed)Include only school-based funded activities/materials and exclude district funded activities /materials.Evidence-based Program(s)/Materials(s)Strategy Description of Resources Funding Source Amount
Subtotal:TechnologyStrategy Description of Resources Funding Source Amount
Subtotal:Professional DevelopmentStrategy Description of Resources Funding Source Amount
Subtotal:OtherStrategy Description of Resources Funding Source Amount
Subtotal: Total:
End of U.S. History Goals
August 2012Rule 6A-1.099811Revised April 29, 2011
55

2012-2013 School Improvement Plan (SIP)-Form SIP-1
Attendance Goal(s)* When using percentages, include the number of students the percentage represents (e.g., 70% [35]).
Attendance Goal(s) Problem-solving Process to Increase AttendanceBased on the analysis of attendance data and reference to “Guiding Questions,” identify and define areas in need of
improvement:
Anticipated Barrier Strategy Person or Position Responsible for Monitoring
Process Used to Determine Effectiveness of Strategy
Evaluation Tool
1. Attendance 1.1.Student SupportTeacher/student relationships
1.1.Positive Behavior System- (PBS)Academic Recovery ProgramBEST Relationship BuildingBehavior Groups
1.1.AdministrationPBS LeadershipGuidanceSchool Social Worker
1.1.AS400 and FIDO Data
1.1.AS400 and FIDO Data
Attendance Goal #1:
Increase attendance rate by 2%
2012 Current Attendance Rate:*
2013 Expected Attendance Rate:*
93% 95%2012 Current Number of Students with Excessive Absences (10 or more)
2013 Expected Number of Students with Excessive Absences (10 or more)
324 300
2012 Current Number of Students with Excessive Tardies (10 or more)
2013 Expected Number of Students with Excessive Tardies (10 or more)
1.2. 1.2. 1.2. 1.2. 1.2.
1.3. 1.3. 1.3. 1.3. 1.3.
August 2012Rule 6A-1.099811Revised April 29, 2011
56

2012-2013 School Improvement Plan (SIP)-Form SIP-1
Attendance Professional DevelopmentProfessional Development (PD) aligned with Strategies through Professional Learning Community (PLC) or PD Activity
Please note that each Strategy does not require a professional development or PLC activity.PD Content /Topicand/or PLC Focus Grade
Level/Subject
PD Facilitatorand/or
PLC Leader
PD Participants (e.g. , PLC, subject, grade level, or
school-wide)
Target Dates (e.g. , Early Release) and Schedules (e.g.,
frequency of meetings)Strategy for Follow-up/Monitoring Person or Position Responsible for
Monitoring
Literacy Leadership Team All Staff LLT School -Wide On-going Parent Participation Administration
Literacy CoachPBS All Staff Administration School-Wide On-going Rewards for Students, AS400 Data Administration
Attendance Budget (Insert rows as needed)Include only school-based funded activities/materials and exclude district funded activities /materials.Evidence-based Program(s)/Materials(s)Strategy Description of Resources Funding Source AmountMovie Night Popcorn MDMSMuffins with Moms Muffins MDMSCurriculum Night Teaching Staff MDMSDonuts with Dads Donuts MDMS
Subtotal:TechnologyStrategy Description of Resources Funding Source Amount
Subtotal:Professional DevelopmentStrategy Description of Resources Funding Source Amount
Subtotal:OtherStrategy Description of Resources Funding Source Amount
Subtotal:
August 2012Rule 6A-1.099811Revised April 29, 2011
57

2012-2013 School Improvement Plan (SIP)-Form SIP-1 Total:
End of Attendance Goals
August 2012Rule 6A-1.099811Revised April 29, 2011
58

2012-2013 School Improvement Plan (SIP)-Form SIP-1
Suspension Goal(s)* When using percentages, include the number of students the percentage represents next to the percentage (e.g. 70% (35)).
Suspension Goal(s) Problem-solving Process to Decrease SuspensionBased on the analysis of suspension data, and reference to “Guiding
Questions,” identify and define areas in need of improvement:Anticipated Barrier Strategy Person or Position
Responsible for Monitoring
Process Used to Determine Effectiveness of
Strategy
Evaluation Tool
1. Suspension 1.1.Some students are unwilling to follow the LCS Board Code of Student Conduct
1.1.ARP Academic Recovery ProgramContinue and expand promotion of PBS strategies to recognize and reward positive behavior.
Teach and practice code of conduct
Grade level meetings with students
Administration to continually review the school culture expectations
1.1.Administration, faculty and staff
1.1.AS400and FIDO Data
1.1.AS400 and FIDO Data
Suspension Goal #1:
Currently MDMS does not have an in-school suspension program
To reduce the number of out-of-school suspensions by 10%
2012 Total Number of In –School Suspensions
2013 Expected Number of In- School Suspensions
NA NA2012 Total Number of Students Suspended In-School
2013 Expected Number of Students Suspended In -School
NA NA2012 Total Number of Out-of-School Suspensions
2013 Expected Number of Out-of-School Suspensions
231 2082012 Total Number of Students Suspended Out- of- School
2013 Expected Number of Students Suspended Out- of-School
208 1151.2. Continue and expand promotion of PBS strategies to recognize and reward positive behavior.
1.2.Expand PBS activities
1.2.AdministrationAchievement LiaisonBEST teachers
1.2.Increase in the number of students who receive in house incentives and in house Eagle Bucks
1.2.Student suspension data, AS 400, FIDO
1.3.Inconsistency in classroom expectations leading to ineffective disciplinary procedures
1.3.Develop a school wide discipline ladder for all classes as well as school wide expectations for common areas such as hallways, walkways,
1.3.AdministrationAll teachers and staffGuidance
1.3.Classroom walkthroughsTeacher collection of discipline data
1.3.Student suspension data, AS 400, FIDO
August 2012Rule 6A-1.099811Revised April 29, 2011
59
2012-2013 School Improvement Plan (SIP)-Form SIP-1and lunchroom. Consistently teach the expectations in all classes and common areas.
Incorporate an introduction to the common school culture for new enrollees.
August 2012Rule 6A-1.099811Revised April 29, 2011
60

2012-2013 School Improvement Plan (SIP)-Form SIP-1
Suspension Professional DevelopmentProfessional Development (PD) aligned with Strategies through Professional Learning Community (PLC) or PD Activity
Please note that each Strategy does not require a professional development or PLC activity.PD Content /Topicand/or PLC Focus Grade
Level/Subject
PD Facilitatorand/or
PLC Leader
PD Participants (e.g. , PLC, subject, grade level, or
school-wide)
Target Dates (e.g. , Early Release) and Schedules (e.g.,
frequency of meetings)Strategy for Follow-up/Monitoring Person or Position Responsible for
Monitoring
School Wide Expectations and PBS 6-8 Administration All teachers and staff Week of Aug 13 and on-
going
Team and PLC meetings Administration
Suspension Budget (Insert rows as needed)Include only school-based funded activities/materials and exclude district funded activities /materials.Evidence-based Program(s)/Materials(s)Strategy Description of Resources Funding Source Amount
Subtotal:TechnologyStrategy Description of Resources Funding Source Amount
Subtotal:Professional DevelopmentStrategy Description of Resources Funding Source Amount
Subtotal:OtherStrategy Description of Resources Funding Source Amount
Subtotal: Total:
End of Suspension Goals
August 2012Rule 6A-1.099811Revised April 29, 2011
61

2012-2013 School Improvement Plan (SIP)-Form SIP-1
August 2012Rule 6A-1.099811Revised April 29, 2011
62

2012-2013 School Improvement Plan (SIP)-Form SIP-1
Dropout Prevention Goal(s) Note: Required for High School- F.S., Sec. 1003.53
* When using percentages, include the number of students the percentage represents next to the percentage (e.g. 70% (35)). Dropout Prevention Goal(s) Problem-solving Process to Dropout Prevention
Based on the analysis of parent involvement data, and reference to “Guiding Questions,” identify and define areas in need of
improvement:
Anticipated Barrier Strategy Person or Position Responsible for
Monitoring
Process Used to Determine Effectiveness of
Strategy
Evaluation Tool
1. Dropout Prevention 1.1. 1.1 1.1. 1.1. 1.1.
Dropout Prevention Goal #1:
Enter narrative for the goal in this box.
*Please refer to the percentage of students who dropped out during the 2011-2012 school year.
2012 Current Dropout Rate:*
2013 Expected Dropout Rate:*
Enter numerical data for dropout rate in this box.
Enter numerical data for expected dropout rate in this box.
2012 Current Graduation Rate:*
2013 Expected Graduation Rate:*
Enter numerical data for graduation rate in this box.
Enter numerical data for expected graduation rate in this box.
1.2. 1.2. 1.2. 1.2. 1.2.
1.3. 1.3. 1.3. 1.3. 1.3.
Dropout Prevention Professional DevelopmentProfessional Development (PD) aligned with Strategies through Professional Learning Community (PLC) or PD Activity
Please note that each Strategy does not require a professional development or PLC activity.PD Content /Topicand/or PLC Focus Grade
Level/Subject
PD Facilitatorand/or
PLC Leader
PD Participants (e.g. , PLC, subject, grade level, or
school-wide)
Target Dates (e.g. , Early Release) and Schedules (e.g.,
frequency of meetings)Strategy for Follow-up/Monitoring Person or Position Responsible for
Monitoring
August 2012Rule 6A-1.099811Revised April 29, 2011
63

2012-2013 School Improvement Plan (SIP)-Form SIP-1
Dropout Prevention Budget (Insert rows as needed)Include only school-based funded activities/materials and exclude district funded activities /materials.Evidence-based Program(s)/Materials(s)Strategy Description of Resources Funding Source Amount
Subtotal:TechnologyStrategy Description of Resources Funding Source Amount
Subtotal:Professional DevelopmentStrategy Description of Resources Funding Source Amount
Subtotal:OtherStrategy Description of Resources Funding Source Amount
Subtotal:Total:
End of Dropout Prevention Goal(s)
August 2012Rule 6A-1.099811Revised April 29, 2011
64
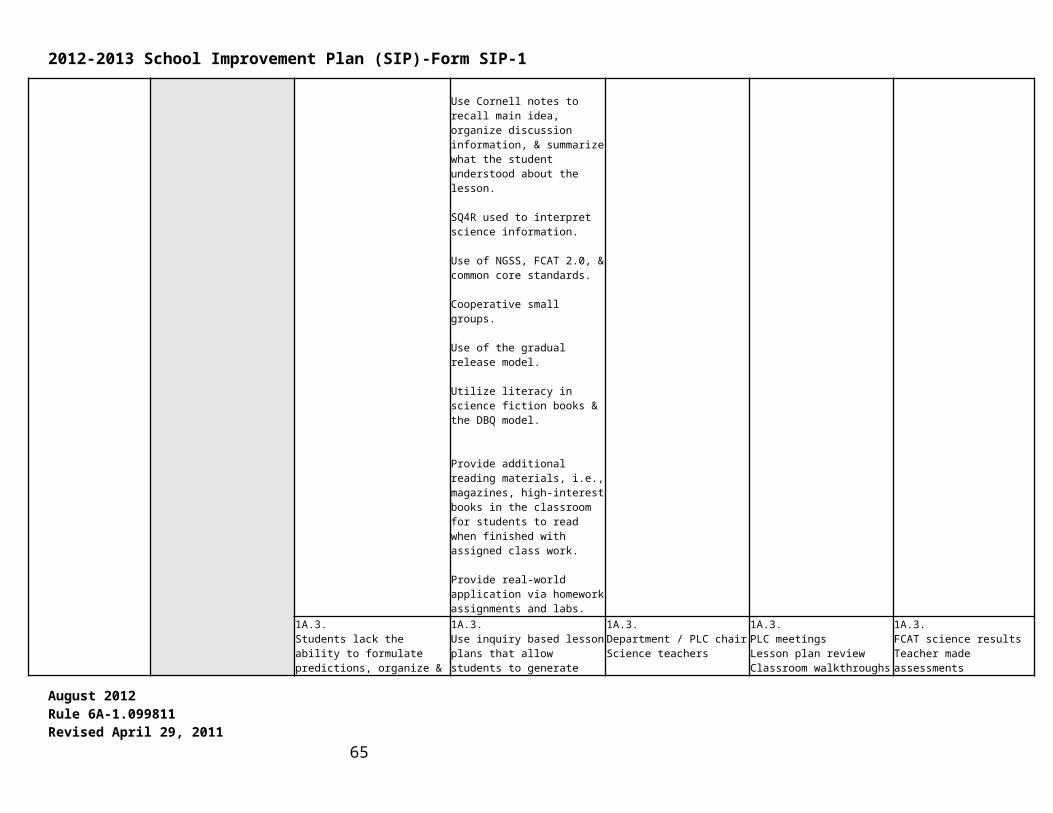
2012-2013 School Improvement Plan (SIP)-Form SIP-1
Parent Involvement Goal(s)Upload Option-For schools completing the Parental Involvement Policy/Plan (PIP) please include a copy for this section. Online Template- For schools completing the PIP a link will be provided that will direct you to this plan.* When using percentages, include the number of students the percentage represents next to the percentage (e.g. 70% (35)).
Parent Involvement Goal(s) Problem-solving Process to Parent InvolvementBased on the analysis of parent involvement data, and reference to
“Guiding Questions,” identify and define areas in need of improvement:
Anticipated Barrier Strategy Person or Position Responsible for
Monitoring
Process Used to Determine Effectiveness of
Strategy
Evaluation Tool
1. Parent Involvement 1.1.
CommunicationTime ConstraintsMinimal Opportunities for parental support
1.1.
LLT Parent/Student Evening Activities: Eagle CampMovie NightActive PTOActive SACMentoring/Volunteer ProgramParent ConferencesUtilize Synergy-Voice technology more frequently to invite parents to participate in school events.
Update school website frequentlySchool MarqueeSchool Newsletter
1.1.
AdministrationLLT
1.1.Increase in participation statistics
1.1.Sign in sheets
Parent Involvement Goal #1:
Our goal is to increase the number of families that participate in school functions by 10%
2012 Current Level of Parent Involvement:*
2013 Expected Level of Parent Involvement:*
18% 28%
1.2.Scheduling of parent conferences takes significant time. Conferences are not always scheduled in a timely manner due to time constraints.
1.2.Reinforce to teachers the importance of regular parent contact.
Improve communication between team leaders and guidance counselors so that all parent communications are shared in both directions.
1.2.Guidance AdministrationTeam leadersClassroom teachers
1.2.Increase in participation statistics
1.2.Increase in participation statistics
1.3. 1.3. 1.3. 1.3. 1.3.
Parent Involvement Professional DevelopmentAugust 2012Rule 6A-1.099811Revised April 29, 2011
65

2012-2013 School Improvement Plan (SIP)-Form SIP-1
Professional Development (PD) aligned with Strategies through Professional Learning Community (PLC) or PD ActivityPlease note that each Strategy does not require a professional development or PLC activity.
PD Content /Topicand/or PLC Focus Grade
Level/Subject
PD Facilitatorand/or
PLC Leader
PD Participants (e.g. , PLC, subject, grade level, or
school-wide)
Target Dates (e.g. , Early Release) and Schedules (e.g.,
frequency of meetings)Strategy for Follow-up/Monitoring Person or Position Responsible for
Monitoring
August 2012Rule 6A-1.099811Revised April 29, 2011
66

2012-2013 School Improvement Plan (SIP)-Form SIP-1Parent Involvement BudgetInclude only school-based funded activities/materials and exclude district funded activities /materials.Evidence-based Program(s)/Materials(s)Strategy Description of Resources Funding Source Amount
Subtotal:TechnologyStrategy Description of Resources Funding Source Amount
Subtotal:Professional DevelopmentStrategy Description of Resources Funding Source Amount
Subtotal:OtherStrategy Description of Resources Funding Source Amount
Subtotal:Total:
End of Parent Involvement Goal(s)
August 2012Rule 6A-1.099811Revised April 29, 2011
67

2012-2013 School Improvement Plan (SIP)-Form SIP-1
Science, Technology, Engineering, and Mathematics (STEM) Goal(s)
STEM Goal(s) Problem-Solving Process to Increase Student AchievementBased on the analysis of school data, identify and define
areas in need of improvement:Anticipated Barrier Strategy Person or Position
Responsible for Monitoring
Process Used to Determine Effectiveness of
Strategy
Evaluation Tool
STEM Goal #1: 1.1. 1.1. 1.1. 1.1. 1.1
1.2. 1.2. 1.2. 1.2. 1.2.
1.3. 1.3. 1.3. 1.3. 1.3.
STEM Professional Development Professional Development (PD) aligned with Strategies through Professional Learning Community (PLC) or PD Activity
Please note that each Strategy does not require a professional development or PLC activity.PD Content /Topicand/or PLC Focus Grade
Level/Subject
PD Facilitatorand/or
PLC Leader
PD Participants (e.g. , PLC, subject, grade level, or
school-wide)
Target Dates (e.g. , Early Release) and Schedules (e.g.,
frequency of meetings)Strategy for Follow-up/Monitoring Person or Position Responsible for
Monitoring
August 2012Rule 6A-1.099811Revised April 29, 2011
68

2012-2013 School Improvement Plan (SIP)-Form SIP-1STEM Budget (Insert rows as needed)Include only school-based funded activities/materials and exclude district funded activities /materials.Evidence-based Program(s)/Materials(s)Strategy Description of Resources Funding Source Amount
Subtotal:TechnologyStrategy Description of Resources Funding Source Amount
Subtotal:Professional DevelopmentStrategy Description of Resources Funding Source Amount
Subtotal:OtherStrategy Description of Resources Funding Source Amount
Subtotal: Total:
End of STEM Goal(s)
August 2012Rule 6A-1.099811Revised April 29, 2011
69

2012-2013 School Improvement Plan (SIP)-Form SIP-1
Career and Technical Education (CTE) Goal(s)
CTE Goal(s) Problem-Solving Process to Increase Student AchievementBased on the analysis of school data, identify and define
areas in need of improvement:Anticipated Barrier Strategy Person or Position
Responsible for Monitoring
Process Used to Determine Effectiveness of
Strategy
Evaluation Tool
CTE Goal #1: 1.1 1.1. 1.1. 1.1. 1.1.
1.2. 1.2. 1.2. 1.2. 1.2.
1.3. 1.3. 1.3. 1.3. 1.3.
CTE Professional Development Professional Development (PD) aligned with Strategies through Professional Learning Community (PLC) or PD Activity
Please note that each Strategy does not require a professional development or PLC activity.PD Content /Topicand/or PLC Focus Grade
Level/Subject
PD Facilitatorand/or
PLC Leader
PD Participants (e.g. , PLC, subject, grade level, or
school-wide)
Target Dates (e.g. , Early Release) and Schedules (e.g.,
frequency of meetings)Strategy for Follow-up/Monitoring Person or Position Responsible for
Monitoring
August 2012Rule 6A-1.099811Revised April 29, 2011
70

2012-2013 School Improvement Plan (SIP)-Form SIP-1
CTE Budget (Insert rows as needed)Include only school-based funded activities/materials and exclude district funded activities /materials.Evidence-based Program(s)/Materials(s)Strategy Description of Resources Funding Source Amount
Subtotal:TechnologyStrategy Description of Resources Funding Source Amount
Subtotal:Professional DevelopmentStrategy Description of Resources Funding Source Amount
Subtotal:OtherStrategy Description of Resources Funding Source Amount
Subtotal: Total:
End of CTE Goal(s)
August 2012Rule 6A-1.099811Revised April 29, 2011
71

2012-2013 School Improvement Plan (SIP)-Form SIP-1
Additional Goal(s)* When using percentages, include the number of students the percentage represents next to the percentage (e.g. 70% (35)).
Additional Goal(s) Problem-Solving Process to Increase Student AchievementBased on the analysis of school data, identify and define
areas in need of improvement:Anticipated Barrier Strategy Person or Position
Responsible for Monitoring
Process Used to Determine Effectiveness of
Strategy
Evaluation Tool
1. Additional Goal 1.1.Parental perception of importance of participating in seminars and assemblies.
Funding for incentives, Safe School Ambassadors program, and guest speakers
1.1.Schedule 2 parent nights to include motivational presentations on stopping bullying.
1.1.GuidancePTOAdministration
1.1.Parent and student feedback.Lack of bullying incidents
1.1.Teacher, student, parent surveysAdditional Goal #1:
Maintain “0” referrals for bullying and continue to increase student awareness of the issues and dangers of bullying, creating a safer school environment for all students.
2012 Current Level :*
2013 Expected Level :*
Maintain the level 2011-12 zero bullying referrals
Maintain a zero level of bullying referrals through proactive measures.
1.2 Efficient time to implement strategies.
1.2.Second Step lessons taught in the Social Studies classroom.
1.2.Social Studies TeachersAdministration
1.2.Teacher/Student feedback Classroom observations
1.2.Teacher lesson plansClassroom observations
1.3. Instructional implementation with fidelity.
1.3.Small behaviorally focused groups.
1.3.GuidanceAssistant Principal
1.3.Decrease in bullying complaints about participating students
1.3.Session attendance sheetsReferrals
Additional Goal #2
Technology: Increase the infusion of technology within the teaching process.
2.1 Lack of available technology for classroom use
2.1Provide teachers with document cameras and provide training on equipment such as clickers and smart boards.
Provide training on current school programs such as Penda and Moodle
2.1AdministrationILS
2.1
Teachers completion of staff development sessions
Teacher’s implementation of technology in their daily teaching process.
2.1
Edusoft dataeSembler reportsMoodle dataPenda reportsClassroom Walkthrough data
August 2012Rule 6A-1.099811Revised April 29, 2011
72

2012-2013 School Improvement Plan (SIP)-Form SIP-1
Additional Goals Professional DevelopmentProfessional Development (PD) aligned with Strategies through Professional Learning Community (PLC) or PD Activity
Please note that each Strategy does not require a professional development or PLC activity.PD Content /Topicand/or PLC Focus Grade
Level/Subject
PD Facilitatorand/or
PLC Leader
PD Participants (e.g. , PLC, subject, grade level, or
school-wide)
Target Dates (e.g. , Early Release) and Schedules (e.g.,
frequency of meetings)Strategy for Follow-up/Monitoring Person or Position Responsible for
Monitoring
Penda 6th, 7th, 8th
Math Sandra Sellers 6th, 7th, and 8th Math Teachers Fall 2012
Review data from formal assessments such as FCAT,
Benchmark mini assessments and Benchmark Assessments
Administration
August 2012Rule 6A-1.099811Revised April 29, 2011
73

2012-2013 School Improvement Plan (SIP)-Form SIP-1
Additional Goal(s) Budget (Insert rows as needed)Include only school-based funded activities/materials and exclude district funded activities /materials.Evidence-based Program(s)/Materials(s)Strategy Description of Resources Funding Source Amount
Subtotal:TechnologyStrategy Description of Resources Funding Source Amount
Subtotal:Professional DevelopmentStrategy Description of Resources Funding Source Amount
Subtotal:OtherStrategy Description of Resources Funding Source Amount
Subtotal: Total:
End of Additional Goal(s)
August 2012Rule 6A-1.099811Revised April 29, 2011
74
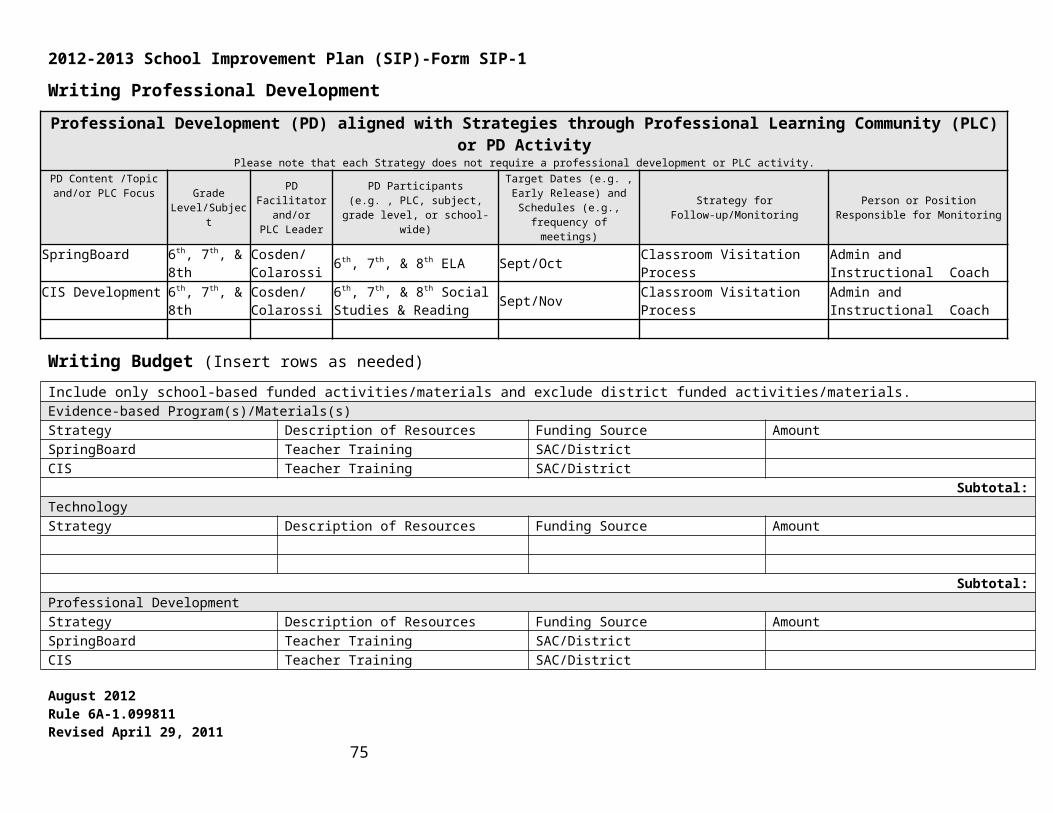
2012-2013 School Improvement Plan (SIP)-Form SIP-1
Final Budget (Insert rows as needed)Please provide the total budget from each section. Reading Budget
Total: 33,000CELLA Budget
Total:Mathematics Budget
Total: 7,250Science Budget
Total:Writing Budget
Total:Civics Budget
Total:U.S. History Budget
Total:Attendance Budget
Total:Suspension Budget
Total:Dropout Prevention Budget
Total:Parent Involvement Budget
Total:STEM Budget
Total:CTE Budget
Total:Additional Goals
Total: 3,300
Grand Total: 43,550
August 2012Rule 6A-1.099811Revised April 29, 2011
75

2012-2013 School Improvement Plan (SIP)-Form SIP-1
Differentiated Accountability
School-level Differentiated Accountability (DA) CompliancePlease choose the school’s DA Status. (To activate the checkbox: 1. Double click the desired box; 2.When the menu pops up, select Checked under “Default value” header; 3. Select OK, this will place an “x” in the box.)
School Differentiated Accountability StatusPriority Focus Prevent
Are you reward school? Yes No(A reward school is any school that has improved their letter grade from the previous year or any A graded school.)
Upload a copy of the Differentiated Accountability Checklist in the designated upload link on the Upload page
School Advisory Council (SAC)SAC Membership ComplianceThe majority of the SAC members are not employed by the school district. The SAC is composed of the principal and an appropriately balanced number of teachers, education support employees, students (for middle and high school only), parents, and other business and community members who are representative of the ethnic, racial, and economic community served by the school. Please verify the statement above by selecting Yes or No below.
Yes NoIf No, describe the measures being taken to comply with SAC requirements.
Describe the activities of the SAC for the upcoming school year.Assist in writing the SIP. Support staff by supporting the two prong approach: Staff Development and Student Materials. SAC will provide financial support for staff development.
Describe the projected use of SAC funds. AmountProvide funding for staff development on the SpringBoard program. $3300.00
August 2012Rule 6A-1.099811Revised April 29, 2011
76