Embed Size (px)
Citation preview
9th trapca annual Conference 2014
“Unlocking Export Competitiveness: The Role of Trade Facilitation”
20 – 21 November 2014
Arusha, Tanzania
SELF-FINANCING TRADE FACILITATION
1. Introduction
Examining all the measures in the WTO’s Trade Facilitation Agreement and considering the
implementation costs as revealed in literature by UNCTAD1 and the World Bank2, it is without doubt
that financial resources will be needed in order for member countries to be able to reach the
capacity to be fully compliant with the measures. It is important to state that not all the measures
will require financial resources before they could be implemented. Some of the measures would
definitely require high costs to implement while others would also require low costs to be
implemented. For example, it is estimated that implementation costs for single window range from
4.5 to 10 million USD and Test Procedures range from 3.4 to 8.1 million USD, whereas the costs of
implementing Penalty Disciplines is 1,100 USD and that of Interval Public Entry ranges from 2,400
USD to 24,000 USD.3
However, if the Trade Facilitation measures are implemented correctly and strategically, they will
pay for themselves. This can happen in a broad and narrow sense. In a broader sense, Trade
Facilitation will generate wider economic benefits as a result of lower trade costs, increased
competitiveness, and higher volumes of trade. In a narrow sense, Trade Facilitation measures that
improve transparency and simplify procedures will reduce contact with customs officials and other
bureaucrats and cut the scope for corrupt practices. Hence, the government will be able to retain
revenue that was otherwise leaking out.
1 UNCTAD (2013) The New Frontier of Competitiveness in Developing Countries: Implementing Trade Facilitation. P. 33, available at http://unctad.org/en/PublicationsLibrary/dtltlb2013d2_en.pdf2 World Bank (2006) Needs, Priorities and Costs Associated with Technical Assistance and Capacity Building for Implementation of a WTO Trade Facilitation Agreement. A Comparative Study Based on Six Developing Countries. Available at http://siteresources.worldbank.org/INTTLF/Resources/Needs_and_Priorities.pdf3 See UNCTAD (2013), p.35

Achieving these potential benefits will however require substantial investment to modernize
customs and other border-related services.4 The ability of developing countries to maximize these
benefits will also depend on the existence of complementary policies such as education policy and
macroeconomic policy.5 Measures to actively facilitate trade are increasingly seen as essential to
assist developing countries in expanding trade and benefiting from globalisation.6
The WTO website defines trade facilitation as ‘the simplification and harmonisation of international
trade procedures … for collecting, presenting, communicating and processing data required for the
movement of goods in international trade’. In reference to trade facilitation, the Doha Declaration
refers to ‘expediting the movement of, release and clearance of goods, including goods in-transit’. In
different contexts (e.g. World Bank and APEC), trade facilitation refers to a much broader spectrum
of issues including technical barriers to trade (TBT), competition policy, government procurement
and transparency in general. Following the existing empirical literature, a relatively narrow definition
of trade facilitation (TF) which focuses on measures that essentially ease and speed the process of
importation (e.g. reforms to valuation and Customs procedures) and exportation will be adopted in
this research within the framework of the WTO Trade Facilitation Agreement.
2. Trade Facilitation and the Need for Financial Resources
The WTO Trade Facilitation Agreement is arguably costly to implement due to a number of reasons
as some critics of the agreement have noted. First of all, the need for financial resources is also
dependent on the level of development of the member countries concerned. Unlike the developed
countries, many of the developing countries and the least-developed countries (LDCs) do not have
the capacity to fully implement the TF Agreement. A study of 26 countries by UNCTAD suggests that
less than 50 per cent of the considered trade facilitation measures are currently fully implemented in
the majority of the participating developing countries.7 None of the countries considered that it had
reached the level of full implementation8 of all the analysed measures. Mostly, the LDCs have
requested for financial assistance in order to be able to reach the full implementation level of the TF
measures. Secondly, most of the developed countries already have in place good infrastructure,
strong institutions and legislations, as well as financial capacity to implement the TF measures. A few
4 Ibid5 Ibid6 Milner C. et al (2008) Trade Facilitation in Developing Countries, available at http://www.nottingham.ac.uk/credit/documents/papers/08-05.pdf
7 UNCTAD (2013), p.128 According to UNCTAD, the full implementation is defined here as meaning that all measures included in the WTO draft consolidated negotiating text are implemented in a manner to achieve compliance.

of the developing countries have also embarked on customs reforms and modernization
programmes where they may already have the legislative framework, institutions, and the
infrastructure and therefore may not require huge financial resources to fully implement the all the
measures. However, from the WTO Needs Assessment programme carried out by some countries,
most of the LDCs do not already have in place single window system and test procedures, which are
the two most expensive TF measures to implement, according to UNCTAD (2013). This therefore
calls for technical assistance in the form of financial resources to assist these developing and LDCs to
be able to implement the TF measures.
2.1 The Financial Implementation Costs
During the work on the national implementation plans, UNCTAD and the trade facilitation
stakeholders in the participating countries assessed the implementation costs of the WTO Trade
Facilitation measures. While in some participating countries the monetary cost of the analysed trade
facilitation measures could not be estimated, 10 out of 26 countries seized the opportunity to
investigate the financial costs of reaching full compliance with the WTO Trade Facilitation
Agreement, as demonstrated in figures 1 and 2 below. It is important to note that this
implementation cost assessments were undertaken prior to the conclusion of negotiations of the
WTO Trade Facilitation Agreement in Bali, 2013: therefore, the current cost of full implementation of
the TF measures might change, probably lesser than what is discussed here.
According to the UNCTAD report, the estimated total costs of reaching the full implementation
status of the considered trade facilitation measures range widely, going from $136,000 to $15.4
million.9 It is said that being an LDC does not seem to have a decisive impact on the total
implementation costs and of course, this does not mean that the required financial resources,
however modest in size, are easily mobilized.10
Figure 1. Estimated total implementation costs (LDCs and non-LDCs) (millions of $)
9 See UNCTAD (2013), p.3310 Ibid

Source: UNCTAD (2013), p.34
From the estimation, the costs were estimated to be under $10 million for six countries; for two
countries between $10 million and $15 million; and for two slightly above $15 million.
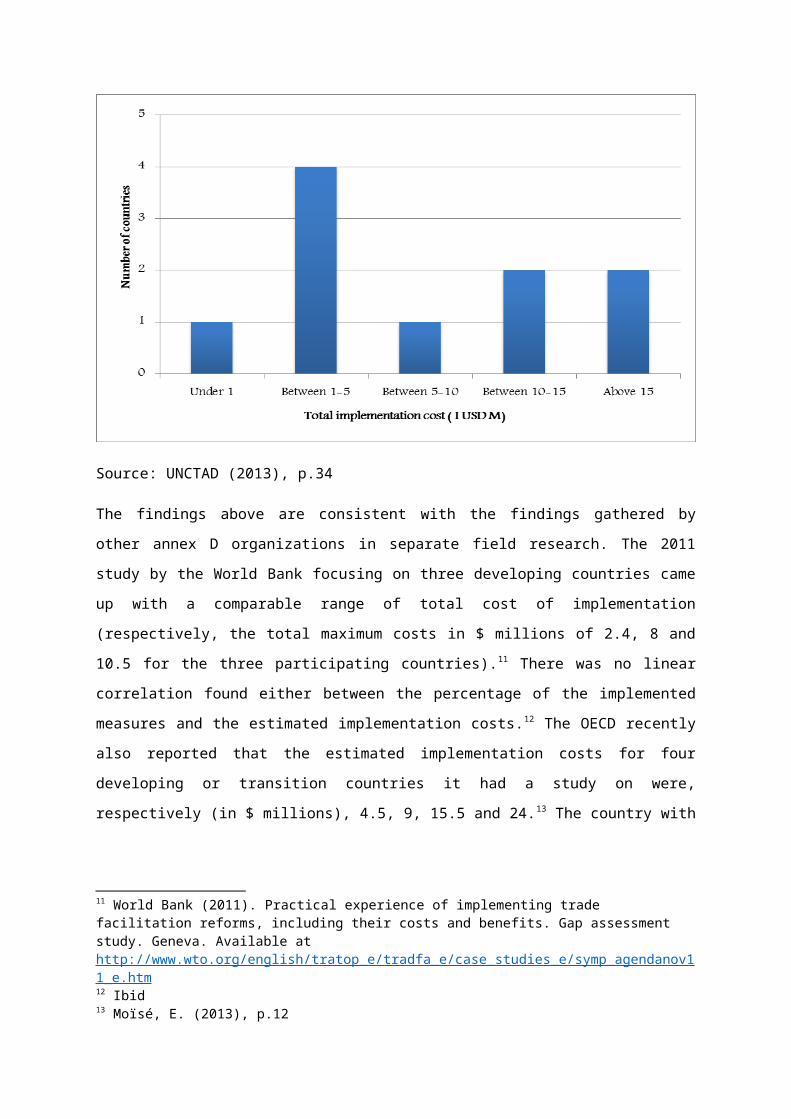
Figure 2. Distribution of the estimated total costs (millions of $, number of countries)
Source: UNCTAD (2013), p.34
The findings above are consistent with the findings gathered by other annex D organizations in
separate field research. The 2011 study by the World Bank focusing on three developing countries

came up with a comparable range of total cost of implementation (respectively, the total maximum
costs in $ millions of 2.4, 8 and 10.5 for the three participating countries).11 There was no linear
correlation found either between the percentage of the implemented measures and the estimated
implementation costs.12 The OECD recently also reported that the estimated implementation costs
for four developing or transition countries it had a study on were, respectively (in $ millions), 4.5, 9,
15.5 and 24.13 The country with the lowest estimated costs was an LDC and the country with the
highest estimates was not an LDC.14
From the UNCTAD report, there is no linear correlation between the level of the current
implementation and the total implementation costs. There is also no established tendency for
overall costs to become higher if more ambitious implementation times are considered, as shown in
figure 3.
Figure 3. Estimated costs and the level of compliance
Source: UNCTAD (2013)
As in the case of the estimated implementation times, the costs of implementing the individual trade
facilitation measures vary largely depending on the country. Moreover, the costs of implementation
11 World Bank (2011). Practical experience of implementing trade facilitation reforms, including their costs and benefits. Gap assessment study. Geneva. Available at http://www.wto.org/english/tratop_e/tradfa_e/case_studies_e/symp_agendanov11_e.htm12 Ibid13 Moïsé, E. (2013), p.1214 Ibid
for some of the trade facilitation measures will be far higher than others and will require relatively
high financial resources to be able to reach full implementation, as shown in the table below.
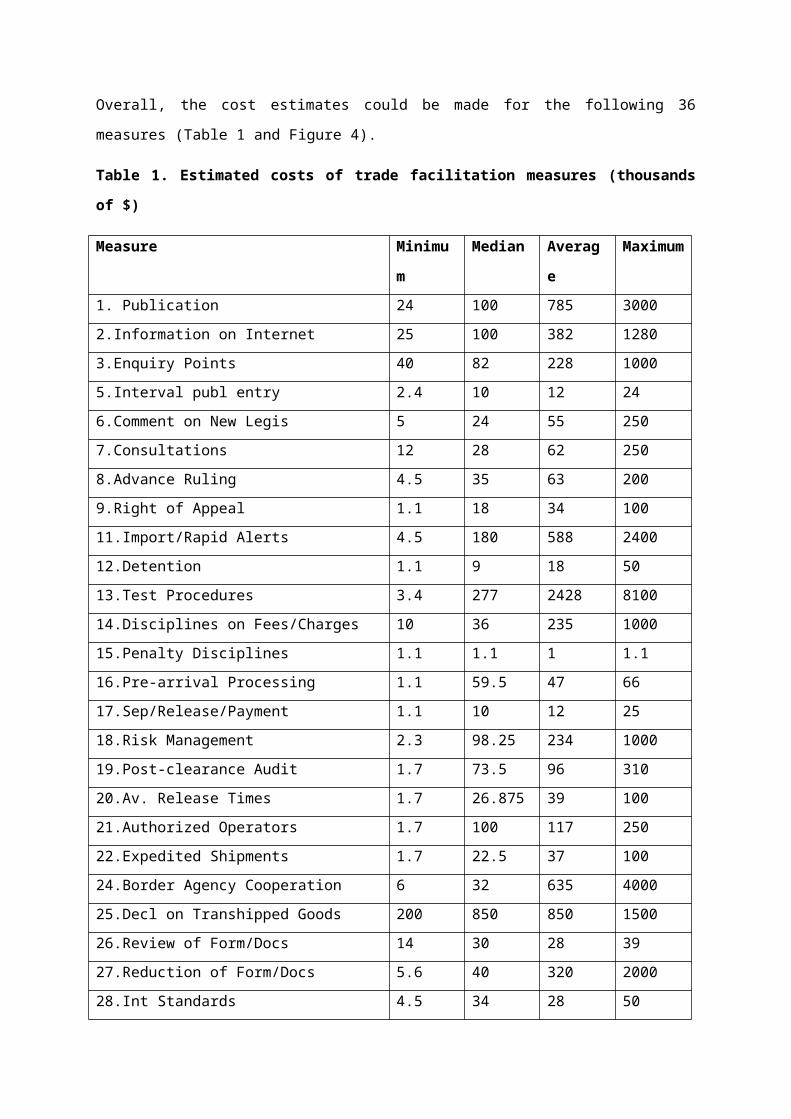
Overall, the cost estimates could be made for the following 36 measures (Table 1 and Figure 4).
Table 1. Estimated costs of trade facilitation measures (thousands of $)
Measure Minimum Median Average Maximu
m
1. Publication 24 100 785 3000
2.Information on Internet 25 100 382 1280
3.Enquiry Points 40 82 228 1000
5.Interval publ entry 2.4 10 12 24
6.Comment on New Legis 5 24 55 250
7.Consultations 12 28 62 250
8.Advance Ruling 4.5 35 63 200
9.Right of Appeal 1.1 18 34 100
11.Import/Rapid Alerts 4.5 180 588 2400
12.Detention 1.1 9 18 50
13.Test Procedures 3.4 277 2428 8100
14.Disciplines on Fees/Charges 10 36 235 1000
15.Penalty Disciplines 1.1 1.1 1 1.1
16.Pre-arrival Processing 1.1 59.5 47 66
17.Sep/Release/Payment 1.1 10 12 25
18.Risk Management 2.3 98.25 234 1000
19.Post-clearance Audit 1.7 73.5 96 310
20.Av. Release Times 1.7 26.875 39 100
21.Authorized Operators 1.7 100 117 250
22.Expedited Shipments 1.7 22.5 37 100
24.Border Agency Cooperation 6 32 635 4000
25.Decl on Transhipped Goods 200 850 850 1500
26.Review of Form/Docs 14 30 28 39
27.Reduction of Form/Docs 5.6 40 320 2000
28.Int Standards 4.5 34 28 50
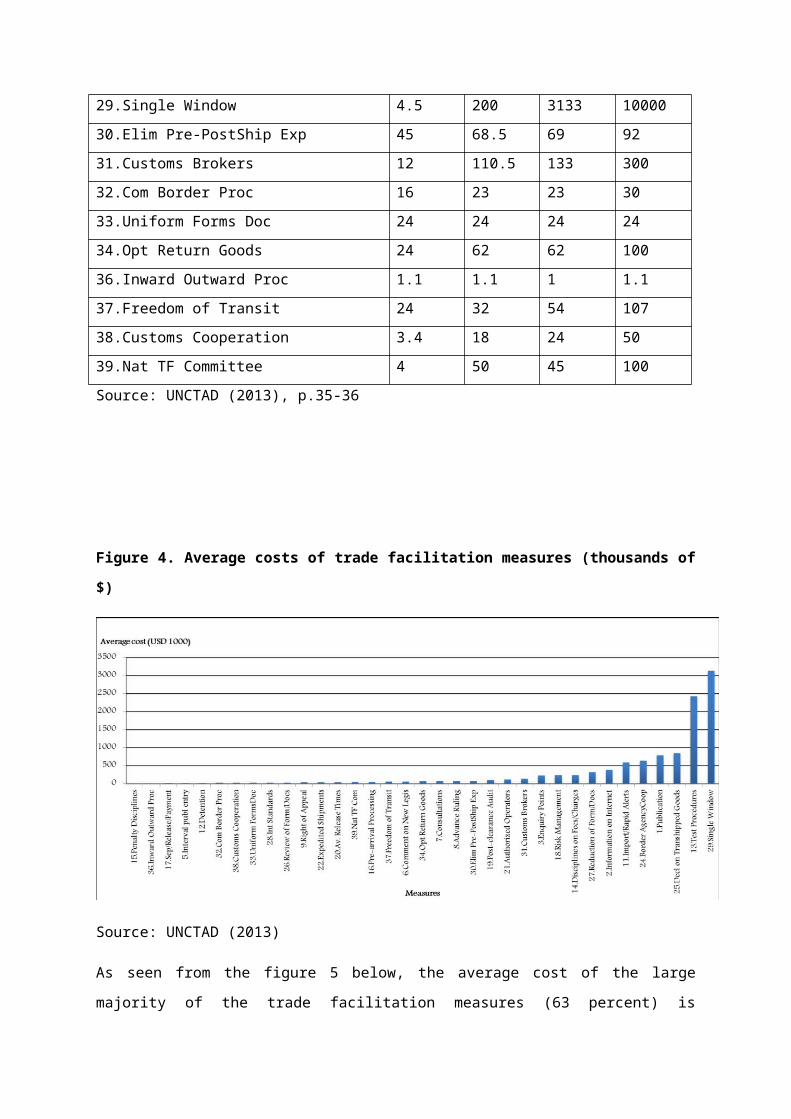
29.Single Window 4.5 200 3133 10000
30.Elim Pre-PostShip Exp 45 68.5 69 92

31.Customs Brokers 12 110.5 133 300
32.Com Border Proc 16 23 23 30
33.Uniform Forms Doc 24 24 24 24
34.Opt Return Goods 24 62 62 100
36.Inward Outward Proc 1.1 1.1 1 1.1
37.Freedom of Transit 24 32 54 107
38.Customs Cooperation 3.4 18 24 50
39.Nat TF Committee 4 50 45 100
Source: UNCTAD (2013), p.35-36
Figure 4. Average costs of trade facilitation measures (thousands of $)
Source: UNCTAD (2013)
As seen from the figure 5 below, the average cost of the large majority of the trade facilitation
measures (63 percent) is estimated at less than $100,000, but to implement two of them (6 percent
of the total) investments ranging from $2 million to $4 million may be needed. These two measures
are single window and test procedures (including, for the latter, test equipment and facilities as
required).
Figure 5. Distribution of measures based on their average costs (thousands of $)
Source: UNCTAD (2013), p.36
The following measures, which again represent a combination of the measures requiring intensive
domestic, cross-border or regional cooperation and/or infrastructure and ICT investments, were
estimated to be the most costly to fully implement (see table 2 below).
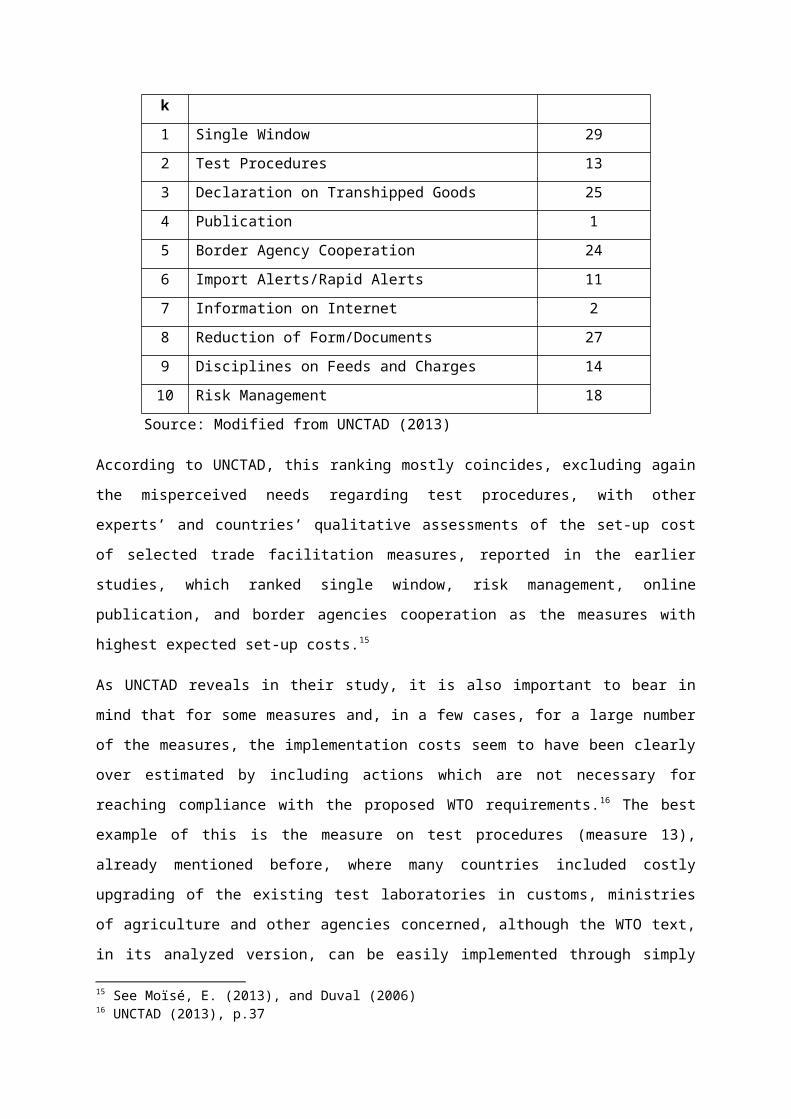
Table 2. Ten measures with the highest estimated implementation costs (average)
Rank Measure Measure No.
1 Single Window 29
2 Test Procedures 13
3 Declaration on Transhipped Goods 25
4 Publication 1
5 Border Agency Cooperation 24
6 Import Alerts/Rapid Alerts 11
7 Information on Internet 2
8 Reduction of Form/Documents 27
9 Disciplines on Feeds and Charges 14
10 Risk Management 18
Source: Modified from UNCTAD (2013)
According to UNCTAD, this ranking mostly coincides, excluding again the misperceived needs
regarding test procedures, with other experts’ and countries’ qualitative assessments of the set-up
cost of selected trade facilitation measures, reported in the earlier studies, which ranked single
window, risk management, online publication, and border agencies cooperation as the measures
with highest expected set-up costs.15
As UNCTAD reveals in their study, it is also important to bear in mind that for some measures and, in
a few cases, for a large number of the measures, the implementation costs seem to have been
clearly over estimated by including actions which are not necessary for reaching compliance with the
proposed WTO requirements.16 The best example of this is the measure on test procedures
(measure 13), already mentioned before, where many countries included costly upgrading of the
existing test laboratories in customs, ministries of agriculture and other agencies concerned,
although the WTO text, in its analyzed version, can be easily implemented through simply adjusting
the existing procedures regarding the administrative acceptance of the results of a confirmatory test
in an existing accredited test laboratory.
From UNCTAD’s study, most of the countries considered themselves to be in a position to implement
all the measures within a five-year period.17 In addition to UNCTAD’s estimates for the costs of full
implementation of the WTO TF measures, which range from US$136,000 to US$15.4 million, the
World Bank has also provided estimates for the implementation of the trade facilitation measures.
Ensuring compliance with the Trade Facilitation Agreement itself will imply limited costs; according
to a World Bank study, these would be in the range of €123,000 - €970,000 per country for capacity
building and technical assistance (not including equipment and staff).18 However, in order to benefit
from the full potential of trade facilitation measures, the Organisation for Economic Cooperation and
Development (OECD) estimates funding needs from €3.5 to €19.7 million over 3-5 years (i.e. €11.6
million on average). The bulk of the cost (70-90%) would be linked to the establishment of a single
window for submission of documents, notably costs for staff and equipment. Costs related to
procedural issues would be unlikely to exceed an estimated €1 million per country.19 Based on the
WTO's estimate of two thirds of its membership being developing countries (approximately 100
countries, including emerging economies and commodities-rich countries), one can extrapolate that
€100 million worth of funding is needed to implement the procedural elements of the Trade
15 See Moïsé, E. (2013), and Duval (2006)16 UNCTAD (2013), p.3717 Ibid18 World Bank (2006) Needs, Priorities and Costs Associated with Technical Assistance and Capacity Building for Implementation of a WTO Trade Facilitation Agreement. A Comparative Study Based on Six Developing Countries. Available at http://siteresources.worldbank.org/INTTLF/Resources/Needs_and_Priorities.pdf19 Moïsé, E. (2013)

Facilitation Agreement. Also taking into account the cost of staff and equipment, funding needs
would climb to a total of roughly €1 billion over five years.20
2.2 Initiatives to Finance Implementation Costs
Funding has been one of the main challenges facing the implementation of the TF Agreement,
according to Capaldo 2014.21 The WTO has promised to help countries obtain funding from other
sources and that it will offer some financial support but only when other sources fail to materialize
and only for investments in “soft” infrastructure of up to $200,000.22 Three main initiatives were
identified earlier on, including the WTO Trade Facility Agreement Facility, the World Bank Trade
Facilitation Support Programme, and other international organizations, including the OECD and the
UN Agencies.
2.2.1 WTO’s Trade Facilitation Agreement Facility (TFAF)
To prove WTO’s support to offer technical assistance to developing countries and LDCs for the
implementation of the TFA, it has launched a new Trade Facilitation Agreement Facility (TFAF) with
contributions coming from some international organizations, including ITC, UNCTAD, World Bank,
OECD, WCO, etc.23 According to the WTO Director General, through this Facility the WTO will
enhance technical assistance programs, support coordination between donors and recipients, and
provide a source of funding for countries that are not able to access the assistance they require. In
this way the Facility will ensure that LDCs and developing countries receive the support they need in
order to reap the full benefits of the Trade Facilitation Agreement, said the Director General.24
The new Facility will complement existing efforts by regional and multilateral agencies, bilateral
donors, and other stakeholders to provide Trade Facilitation-related technical assistance and
capacity-building support. It will act as a focal point for implementation efforts. It will become
operational when the protocol to insert the Trade Facilitation Agreement into the existing regulatory
framework is adopted by WTO Members. The functions of the Facility will include:
Supporting LDCs and developing countries to assess their specific needs and identify possible
development partners to help them meet those needs20 EC Press Release, Brussels, December 6, 201321 Jeronim Capaldo (2014), “Support to WTO Trade Facilitation Agreement is Insufficient or Misdirected”, Global Development and Environment Institute, Tufts University, available at http://www.ase.tufts.edu/gdae/Pubs/rp/Capaldo_TF_Facility.pdf22 Jeronim Capaldo (2014), see footnote 1723 WTO (2014), Azevêdo launches new WTO Trade Facilitation Agreement Facility to deliver support to LDCs and developing countries, available at http://www.wto.org/english/news_e/news14_e/fac_22jul14_e.htm24 WTO (2014)
Ensuring the best possible conditions for the flow of information between donors and
recipients through the creation of an information sharing platform for demand and supply of
Trade Facilitation-related technical assistance
Disseminating best practice in implementation of Trade Facilitation measures
Providing support to find sources of implementation assistance, including formally
requesting the Director-General to act as a facilitator in securing funds for specific project
implementation
Providing grants for the preparation of projects in circumstances where a Member has
identified a potential donor but has been unable to develop a project for that donor’s
consideration, and is unable to find funding from other sources to support the preparation
of a project proposal
2.2.2 The World Bank Trade Facilitation Support Programme
The World Bank Trade Facilitation Support Program offers US$30 million to help countries
“devise and implement large scale reform[s]”. Consistently, the World Bank estimates that
“hard” infrastructure, such as ports and other large facilities, will be the main source of the gains
from trade facilitation.25
On June 10, 2014 the World Bank Group (WBG) Office in Geneva, together with the European
Commission, the United States Agency for International Development (USAID), Canada,
Switzerland, the Australian Department of Foreign Affairs and Trade, and the Norwegian
Ministry of Foreign Affairs announced the establishment of a new Trade Facilitation Support
Program (TFSP), which will help countries reform their trade facilitation practices in a manner
consistent with the main components of the new TFA. The Program will focus on the effective
implementation of trade facilitation reforms in developing countries to enhance private sector
competitiveness, thus leading to increased trade, investments and job creation. It will have two
main components – the provision of Technical Assistance (TA), where the WBG will help
developing countries reform their trade facilitation laws, procedures, processes and systems in a
manner consistent with the WTO TFA; the second component will focus on Knowledge, Learning
and Measurement.26
25 Jeronim Capaldo (2014 B), “Support to WTO Trade Facilitation Agreement is Insufficient or Misdirected”, Global Development and Environment Institute, Tufts University, available at http://www.ase.tufts.edu/gdae/Pubs/rp/Capaldo_TF_Facility.pdf26 World Bank, available at http://www.worldbank.org/en/news/feature/2014/06/12/new-trade-facilitation-support-program-to-provide-technical-assistance-for-developing-countries
Bank Group trade facilitation projects typically align closely with TFA measures:27
• Trade Information Portals and National Single Window systems
• Legal and regulatory framework review and modernization
• Procedural simplification and harmonization
• National Trade Facilitation Committees – to improve inter-agency coordination and public/private dialogue
It is important to mention that the World Bank Trade Facilitation Support Programme is often
part of broader trade and transport projects.
2.2.3 Other International Organizations Support
Other international organizations, including OECD and various branches of the United Nations,
offer coordinated assistance for implementation of the WTO Trade Facilitation Agreement. This
initiative provides technical assistance in designing the multiple policies required to implement
the Agreement.28
On 22 July 2014, a group of major international organizations came together to recognize the
development potential of the Trade Facilitation Agreement and to offer their assistance to WTO
members in implementing their commitments under the Agreement. In a joint statement the
organizations declared their intention to work together to assist developing and least-developed
Members through a range of technical assistance and capacity-building initiatives. The
organizations declared:
“(T)his coordinated and integrated approach will greatly assist developing, transition and
least-developed countries to reap real and sustainable benefits from the Agreement and will
result in stronger economic development for their citizens”.29
The statement was signed by the following organizations: ITC, OECD, UNCTAD, UNECE, World
Bank Group, and World Customs Organization.
2.2.4 European Union Donor Support
27 World Bank (2014) Trade Facilitation Support Programme, available at http://www.worldbank.org/content/dam/Worldbank/Highlights%20&%20Features/WesternEurope/Geneva/2014/06/Trade_Facilitation_Support_Program_(TFSP).pdf28 Jeronim Capaldo (2014 B)29 WTO (2014), available at http://www.wto.org/english/news_e/news14_e/fac_22jul14_e.htm
As part of the initiatives to provide technical assistance and capacity building to enable developing
countries and LDCs implement the trade facilitation measures, a number of developed countries
have promised to provide assistance.
In a move to support the timely implementation of the World Trade Organisation (WTO) Trade
Facilitation Agreement, which will help developing countries by simplifying, harmonising and
modernising international border procedures, Development Commissioner, Andris Piebalgs and
Trade Commissioner, Karel De Gucht, on December 6, 2013 committed to cover a significant share of
the funding needs of developing countries to implement the Agreement.30 The EU's support, worth
some €400 million over five years, responds to demands for help from countries most in need in
order to comply with and draw the full benefit of the deal for growth and development. 31 Within this
amount, it also stands ready to make a contribution of up to €30 million to a dedicated WTO
international trade facilitation facility for the most urgent actions for aligning legislation and
procedures in developing countries to the new agreement. EU’s Development Commissioner, Andris
Piebalgs said:
"Investment in trade is fundamental to boosting the growth and development of a country.
EU support to trade has helped to lift millions of people out of poverty in the last decade and
will remain key to our development work. We want make sure that every country can enjoy
the benefits that implementation of the Trade Facilitation Agreement can offer; that’s why
we are ready to go the extra mile and help our partner countries which needs it to reach their
full potential through trade.”32
The EU’s Trade Commissioner Karel De Gucht also added:
“The EU wants to send a decisive message that swift implementation of this Trade
Facilitation Agreement is essential for developing countries. The agreement will make it
easier and cheaper for developing countries to trade, with the biggest gains realised in south-
south trade, thereby facilitating their integration into regional and global value chains.
Returns on a relatively modest up-front investment will be considerable in terms of growth,
jobs and development”.33
EU support will be provided in the framework of its regular Trade-Related Assistance to developing
countries. The EU issued this press release at the time it was working on the allocation of its
30 EC Press Release, Brussels, December 6, 2013, viewed at http://europa.eu/rapid/press-release_IP-13-1224_en.htm31 Ibid32 Ibid33 See the EC Press Release in Footnote 30
development aid for the period 2014-2020, and it said that the time was therefore ripe for
developing countries to reflect their trade needs, including for trade facilitation, into their
development strategies and include them in their priorities for EU aid for the period 2014-2020. EU
aid will be financed partly from the EU budget, subject to the approval of the necessary legal
instruments and partly from the European Development Fund (EDF), currently in the process of
ratification by EU Member States.
3. Aid for Trade Facilitation
This section is work in progress.
4. Self-Financing Trade Facilitation
Trade Facilitation, if properly planned and implemented, could actually generate revenue and hence,
finance itself. It is argued that this can happen in both broad and narrow sense, but this paper
focuses more on the latter.
In a broad sense, trade facilitation initiatives and the related reforms of customs procedures in
developing countries could contribute to their development through the expansion of trade,
improvements in the environment for Foreign Direct Investment (FDI), improvements in customs
integrity, more effective and selective border controls, and more efficient revenue collection.34
Extensive empirical evidence suggests that trade facilitation can give a significant boost to both
regional and bilateral trade, export diversification, and economic welfare, and end up paying for the
cost of implementing the WTO Trade Facilitation agreement at the country level.35 Although most
papers focus on quantifying the benefits of trade facilitation, those that also take into account the
investment dimension uniformly find that although the up-front costs can be substantial, they are
34 UNECE, Sharing the Gains of Globalization in the New Security Environment: The Challenges to Trade Facilitation, available at http://books.google.ch/books?id=BYXlIPZNfeQC&pg=PA135&lpg=PA135&dq=Self+financing+trade+facilitation&source=bl&ots=tbzd08jdiX&sig=4OtaLiIZPw8ebDWn7j3JOAA--80&hl=en&sa=X&ei=0gXzU4zmEYal0QXg8IGYDQ&ved=0CDQQ6AEwBA#v=onepage&q=Self%20financing%20trade%20facilitation&f=false
35 Hoekman B. and Shepherd B. (2013) Who Profits From Trade Facilitation Initiatives? P.2, available at http://www10.iadb.org/intal/intalcdi/PE/2013/12982a03.pdf

significantly outweighed by the benefits.36 Trade facilitation is therefore a “good deal” for all
countries, irrespective of the level of development. Although trade facilitation can be expected to
have a significant net benefit for reforming countries in aggregate terms, there is a question as to
how those gains are distributed, especially in the context of global value chains (GVCs) that may be
dominated by large “lead” firms that are headquartered in developed nations. One possibility is that
all firms in the value chain gain from better trade facilitation, because lead firms and their suppliers
are all able to operate with lower costs and overall turnover expands. Another possibility that has
been discussed in the literature, however, is that the gains from trade cost reductions are
appropriated as rents by lead firms, because these firms have market power and/or suppliers are
locked into dealing with specific lead firms. The result is that large/lead firms capture most of the
gains, and workers in (owners of) supplying firms do not share in the benefits. 37 Although there is
some variation in results according to sector, general findings by Hoekman and Shepherd (2013)
suggest that the gains from trade facilitation accrue to large and small firms alike: all size classes of
firms export more in response to improved trade facilitation.
According to Hoekman and Shepherd (2013), the mechanisms by which trade facilitation can
promote economic gains are well known. Taking the broad definition—in which trade facilitation is
any policy action that reduces trade costs—shows that the key lies in an understanding of the factors
that impede bilateral trade. Trade costs drive a wedge between export and import prices. As a result
of this wedge, producers export less than they would in a world with lower trade costs, and
consumers purchase less of each traded product, as well as a narrower range of products, than they
otherwise would. Trade facilitation, which reduces the size of this wedge, therefore brings producers
and consumers in different countries into closer contact, and tends to increase producer surplus in
exporting countries, and consumer surplus in importing countries. Trade facilitation supports the
process of economic integration through trade, which can, under appropriate circumstances, lead to
rising national incomes, faster productivity growth, and poverty reduction.38
There are two types of empirical evidence showing that improved trade facilitation can have
significant economic benefits: econometric analyses and computable general equilibrium models.
Econometric analyses use different measures of trade facilitation, with many of the more recent
36 Ibid37 See e.g., Milberg and Winkler (2010), Barrientos et al. (2011), Berhardt and Milberg (2011), and Gereffi (2013)38 Hoekman and Shepherd 2013

papers using either the World Bank’s Doing Business database or the World Bank’s Logistics
Performance Indicators (Arvis et al. 2012). Much of the econometric research employs gravity
regression models. A representative example is Djankov Freund and Pham (2010) who use export
time as measured by the World Bank’s Doing Business project as an indicator of national trade
facilitation performance. This measure includes document preparation, inland transit, passage
through customs and other border agencies, and port and terminal handling. It therefore captures a
number of important elements of trade facilitation in both the broad and narrow senses. They
estimate a gravity model for 98 countries in which the dependent variable is the value of bilateral
trade. In addition to standard gravity model control variables, they include the Doing Business time
to export measure. They find that it is a significant determinant of bilateral trade flows. Concretely,
an extra day’s delay is associated with a reduction in bilateral trade of at least one percent.
In a narrow sense of self-financing trade facilitation, it is believed that trade facilitation measures
that improve transparency and simplify customs procedures will reduce contact with customs
officials and other bureaucrats and cut the scope for corrupt practices. This narrow sense of the
trade facilitation is closely linked to the WTO Trade Facilitation measures which provides the
framework for allowing trade to happen quickly by eliminating or the customs related barriers
associated to trade. The WTO Trade Facilitation Agreement seeks to remove the bottlenecks and
impediments associated to border trade. Most developing countries have very cumbersome and
complex procedures clearing goods at the border which delays trade. The Agreement on Trade
Facilitation aims to solve this problem for members of WTO so that trade can happen quick among
member countries. Today, there is a yawning gap between developed and developing countries
when it comes to border procedures. On average, OECD countries demand five documents at
customs and it takes 10 days to clear goods at a cost of about €735 per container. In contrast,
African countries require on average twice as many documents, up to 35 days to clear exports and
44 days to clear imports, at an average cost per container of €1,285 for exports and €1,535 for
imports.39 The OECD estimates that reducing global trade costs by 1% would increase world-wide
income by more than USD 40 billion (€29.6 billion), 65% of which would go to developing countries.40
39 OECD (2008) The Global Enabling Trade Report, viewed at http://books.google.ch/books?id=PRq2n50PqSYC&pg=PT68&lpg=PT68&dq=%E2%80%A2%09The+OECD+countries+require+on+average+about+5+separate+documents+and+clearing+the+goods+in+an+average+of+10+days+at+an+average+cost+of+about+US%24950+per+container.+In+contrast,+in+sub-Saharan+Africa+almost+double+the+number+of+documents+are+required:+goods+t&source=bl&ots=j1tcPH12XR&sig=JJi1VfXjUydVuBOd5od4KSu-OiE&hl=en&sa=X&ei=8DUKUd64DsaWhQfPsIGwCw&redir_esc=y#v=onepage&q&f=false40 OECD (2009) Overcoming Border Bottlenecks: the Costs and Benefits of Trade Facilitation

According to Hoekman and Shepherd 2013, trade facilitation to some extent involves the elimination
of resource waste – e.g., duplicative procedural requirements and paperwork – in contrast to trade
liberalization (e.g., lowering tariffs), which mainly reallocates resources and in the process generates
efficiency gains. Trade facilitation lowers costs and hence prices, both to consumers and to firms that
import production inputs, and therefore increases real disposable incomes and/or profits. A more
recent CGE-based analysis, WEF (2013), incorporates econometric estimates of the impacts of a
number of specific trade facilitation-related variables, and concludes that if countries pursue
ambitious improvements in trade facilitation the national income effects from improved trade
facilitation can be up to five or more. Using a sample of 118 developing countries, Dennis and
Shepherd (2011) find that a 10% reduction in the costs associated with the aspects of trade
facilitation considered by Djankov, Freund and Pham (2010) is associated with a 3% increase in the
number of products exported. Trade facilitation therefore not only promotes greater bilateral trade
between countries, but also makes it easier for developing countries to export a wider range of
products—which is an important development goal.
According to the 2011 Global Aid for Trade Review, customs reform in Cameroon increased revenues
by 12%; in Mozambique the figure was 50% in two years despite big tariff cuts. In Mozambique
goods now clear customs in two to five days compared to 30 days before. In Sub-Saharan Africa
cutting time spent at the border by 5% could achieve a 10% increase in formal intra-regional trade
and revenue losses from inefficient border procedures are put at over 5% of GDP. Some of these
examples of self-financing trade facilitation is discussed further in this paper.
In relation to the evidence on the cost-benefit balance of trade facilitation, Mirza (2009) finds that
there is a strong net benefit from trade facilitation in economic welfare terms, even when the initial
investment costs are netted out. Concretely, an improvement of about 1% in Sub-Saharan Africa’s
logistics performance requires an up-front investment of around $18bn. The estimated welfare gains
from this improvement are much larger, on the order of $70bn. The benefit-cost balance is therefore
strongly positive even in a general equilibrium setting. More generally, the net returns of trade
facilitation measures will be a function of how trade facilitation is defined. Under the WTO it will
mostly involve border management process-related measures such as the use of information
technology; risk assessment; etc. that do not involve a need for major investment in infrastructure.

Estimates of the likely costs of implementing a WTO agreement are much lower than the costs
associated with transport infrastructure upgrading and are expected to be in the US$5-20 million
range depending on initial conditions (McLinden, 2011; OECD, 2012). Many types of trade facilitation
initiatives are low cost to implement. The fact that assessments that consider major investments in
hard infrastructure conclude that the net return is positive and substantial in magnitude therefore
suggests that the conclusion that there are large payoffs to trade facilitation is robust.
4.1 Country Case Studies
4.1.1 Ethiopia
Ethiopia had a Public Sector Reform Programme (PSCAP) in place managed by the Ministry for
Capacity Building. A major part of this programme was a tax reform programme to which a Customs
reform component was included in 2003. According to OECD and WTO report, the reform
programme to date has resulted in rationalization of tariff rates, reduction in documentary
requirements, simplification of procedures and computerization.41 This has achieved a dramatic
reduction in clearance times, an increase in revenue collection and the elimination of systemic
corruption.42
41 OECD (2011), Customs Reform and Trade Facilitation in Ethiopia, p.2, available at http://www.oecd.org/aidfortrade/47799254.pdf42 Ibid

Table 3. Summary of Ethiopia’s Case Study
Objectives Pursued Problems Encountered Success Factors Results AchievedThe overall objective is to improve the
efficiency and effectiveness of Ethiopian
Revenue and Customs to meet
Government expectations, the national
economic and trade needs, and
international standards and rules
The specific objectives are:
•Strategic Planning: Accession to the
Revised Kyoto Convention and other
International Conventions and reinforce
regional and international integration
•HR & Capacity Building
•Technological Enhancements
•Communication: Develop the Tax
Payers Awareness and Customer Care
Attitude of the Staff
•Enforcement and Prosecution Risk
Management Strategy in balance with
Facilitation
•Revenue Collection: Secure the
Economic Development along with the
Facilitation Climate translated by an
Increased Revenue/GDP ratio
•Change Management: by the time
the WCO conducted the diagnostic
mission, there were a number of
project and initiatives in course
without a proper coordination and
prioritization. The administration
was facing difficulties to cope with
all changes being implemented and
to meet the human resources and
financial requirements to sustain
the development process
•Human Resources Management:
Skills, Knowledge, Attitude
•Data management: Lack of proper
collection, process efficiently to
ensure quality
•Technological Enhancements:
Lack of resources to access to latest
Technology and maximise
application
•Public Attitude: low level of
positive and compliant attitude
•Political will
•Leadership
•Focus on Capacity building: “3
T’s – Training, Training, Training”
(Ethiopian slogan)
•Internal and External
Communication: “3 C’s –
Communication, Communication,
Communication“
•Systematic automation,
computerization and advanced
technologies
•Partnership and Cooperation:
National: Educate and advise
each other, accountability
between ERCA and the Public
External: WCO, donors, regional
and international level
Efficiency: (Volume)Import transactionsServiced increased from 37.24 B. Birr in 2005/2006 to 107.92 B. Birr in 2009/2010 at 187.92 percent.
Export transactionsServiced increased from 8.83 B. Birr in 2005/2006 to 26.43 B. Birr in 2009/2010 at 199.14.
TimeTransit time of 3.47hr in 2007/2008 was planned to reduce to 40mm, but achieved an actual transit time of 14mins.
Customs clearance import was 7 days and was reduced to: Green 10mins: Yellow 2:30hrs: Red 6-8hrs
Export time was also reduced from 5-8hrs to 15mins
Personal effects took 4hrs and was reduced to 45mins
Investigation use to take 397 days but reduced to 5 days
Effectiveness•Improved data quality•Improved level of compliance•Improved productivity•Revenues:Increased by 51.38% (from 23 to 35.78 billion Birr)
•Increased supporters of change(Internal – tax becomes a topic of discussion for public - ERCA reform became a benchmark for other Agencies) and External – Increased interest for providing support to ERCA reform.
Source: OECD (2011) with modifications
1.1.1 Ghana’s Experience
Ghana’s Customs Exercise and Preventive Services (CEPS), which is now integrated into the Ghana Revenue
Authority as part of a customs reform introduced by the Government has faced several challenges dealing
with trade facilitation at the border.
From a case study conducted by De Wulf (2004) on Ghana’s Customs Reform, during the 1990s, Ghana
introduced a number of reform initiatives to improve capacity and efficiency at its customs authority and the
country also started to implement a more open trade policy agenda.43 In early 2001, Ghana introduced a
customs ICT network based on a model of Singapore’s TradeNet. The customs system was initiated as a
public-private partnership with a number of stakeholders offering experience and competence while sharing
costs and risks. According to the study, in mid-2003, the network covered 90 percent of Ghana’s total trade
flows and government revenue collected from airport traffic had increased by approximately 30 percent on a
yearly basis when checked for currency changes and an increase in imports.44 In addition, customs clearing
times were also significantly reduced. For example, at the main international airport, average customs
clearance time was down from three days to four hours.45 The Single Window - SW (GCNet) was established
following stakeholders concerns with slow and cumbersome port clearance procedures that were expensive
and restrictive. The SW concept was established to enhance the competitiveness of Ghanaian business by
removing constraints to legitimate trade development and facilitation while ensuring that collection of trade-
related government revenue was not compromised.46 The Ghana system is based on an adaptation primarily
of the Mauritian model which itself was developed based on the Singaporean model. After having decided
which system to adopt, a lengthy process of review and modification of the Mauritian system was
undertaken. In parallel, a full review of processes and procedures was undertaken in order to avoid
computerising inefficient processes. The system was then customised and deployed in phases, starting with a
pilot site that was used for testing. Each site was then rolled-out in sequence. The GCNet processes
approximately 350,000 Customs declarations per annum (1,000 to 1,500 per day representing 98% of total
number of declarations – balance being some minor land borders) and 6,000 manifests per annum
(representing 100% of manifests).47
43De Wulf, L. (2004), ‘Ghana’, in L. De Wulf and J.B. Sokol (eds.), Customs Modernization Initiatives: Case Studies, The World Bank, Washington, DC – Ghana, p. 19, available at https://openknowledge.worldbank.org/bitstream/handle/10986/14911/301120PAPER0Customs0case0studies.pdf?sequence=144 Ibid45 Ibid46 UNECE (2009) Single Window Cases: Ghana, available at http://www.unece.org/fileadmin/DAM/cefact/single_window/sw_cases/Download/Ghana.pdf
47 Ibid, p. 2
Objectives Pursued Problems Encountered Success Factors Results Achieved
To enhance the competitiveness of
Ghanaian business by removing
constraints to legitimate trade
development and facilitation while
ensuring that collection of trade-related
government revenue was not
compromised
•Human factor, managing change
•Overcoming reticence by certain
stakeholders
•Strong support from
Government
•Private sector involvement for
project management
•A balanced selection of
complementary partners with
unique strengths
•Absolute conviction by key
players that project could work
•A financing model that is self-
sustainable
Benefits to the Clients and Participating Agencies
The major benefits are as follows:
•For the Importer/Exporter: faster clearance time, more
transparent process, more predictable process, less
bureaucracy
Benefits to the Government
•For Customs: vastly improved staff working through
upgraded infrastructure, substantial increase in Customs
revenue, more structured and controlled working
environment, more professionalism
•Commercial Banks: Increase in number of customers,
increase in amount of funds passing through banking
operations, collection of dividends from GCNet (being
shareholders)
•Government: substantial increase in Government
revenue, example of best practice for the region,
recognition by donors
•Economy: Improved transparency and governance in
Customs
Impact on Customs Revenues
First year, increase of 35% year-on-year; subsequent years
increase of 20%.
Table 4. Ghana Case Study
Source: OECD (2011) with modifications

5. Conclusion
As demonstrated in the above discussions and also from the country’s case studies, it is without doubt
that financial resources will be needed in order for developing countries and LDCs to be able to reach
the capacity to be fully compliant with the measures of the WTO Trade Facilitation Agreement. It has
been proven that the WTO TF Agreement is not just a means to increase exports to developing
countries and LDCs as some critics are saying but to create that multilateral framework for trade to
happen very quickly without any unnecessary limitations such as corruption, delays, bureaucracy, and
complex procedures at the border. This is supposed to provide an impetus for economic growth and
sustainable development in developing countries and LDCs as it will increase the competitiveness of
these countries and also help them to overcome their capacity constraints to benefit from the
multilateral trading system.
It has been argued that if the Trade Facilitation measures are implemented correctly and strategically,
they will pay for themselves. Countries will benefit tremendously from these measures as
demonstrated in the case of Ghana, Ethiopia, Mauritius and the other country case studies included in
the Appendix. Implementation of trade facilitation measures will pay off both in the broad sense, as it
will generate wider macroeconomic benefits as a result of lower trade costs, increased
competitiveness and higher volumes of trade. In the narrow sense, trade facilitation measures that
improve transparency and simplify procedures will reduce contact with customs officials and other
bureaucrats and cut the scope for corrupt practices. The government will be able to retain revenue
that was otherwise leaking out.
Even though it is estimated that the total costs of reaching the full implementation status of the
considered trade facilitation measures range widely, going from $136,000 to $15.4 million, it is
strongly argued that the benefits from implementing the trade facilitation measures will be far more
than the costs. Notwithstanding the uncertainty of the exact total amount of financial resources
available to implement the trade facilitation measures in developing countries, many initiatives from
the WTO Trade Facilitation Agreement Facility, the World Bank Trade Facilitation Support Programme,
and the support from the International Organizations and other donor support programmes through
their aid for trade initiatives exist to support the LDCs and the developing countries reach full
implementation of the trade facilitation measures. As to whether these initiatives will be sufficient or
not, it is not known. But at least the good news is that, trade facilitation will provide the necessary
framework needed to facilitate trade at the border and help make trade happen quick, so that the
monies that the State is losing to individuals and certain corporations will be retained for the State.

Bibliography
UNECE, Sharing the Gains of Globalization in the New Security Environment: The Challenges to Trade Facilitation, available at http://books.google.ch/books?id=BYXlIPZNfeQC&pg=PA135&lpg=PA135&dq=Self+financing+trade+facilitation&source=bl&ots=tbzd08jdiX&sig=4OtaLiIZPw8ebDWn7j3JOAA--80&hl=en&sa=X&ei=0gXzU4zmEYal0QXg8IGYDQ&ved=0CDQQ6AEwBA#v=onepage&q=Self%20financing%20trade%20facilitation&f=false
UNECE (2009) Single Window Cases: Ghana, available at http://www.unece.org/fileadmin/DAM/cefact/single_window/sw_cases/Download/Ghana.pdf
http://myradiogoldlive.com/index.php/general-news/2848-ghana-has-reaped-numerous-benefits-from-my-investigations-anas-aremeyaw-anas
http://www.oecd.org/aidfortrade/47434962.pdf
http://www.worldcustomsjournal.org/media/wcj/-2010/1/Kieck.pdf
http://www.google.ch/url?sa=t&rct=j&q=&esrc=s&source=web&cd=3&ved=0CC4QFjAC&url=http%3A%2F%2Fwww.wto.org%2Fenglish%2Ftratop_e%2Ftradfa_e%2Fcase_studies_e%2Fsymp_nov12_e%2Fsession4_mark_e.ppt&ei=3kLzU_2qJ6rMyAOt4IDQAw&usg=AFQjCNHSQHKTiJB80CdHK5nm0Q0MFM9NaQ
Milner C. et al (2008) Trade Facilitation in Developing Countries, available at http://www.nottingham.ac.uk/credit/documents/papers/08-05.pdf
OECD (2013), Trade Facilitation Indicators: The Potential Impact of Trade Facilitation on Developing Countries’ Trade, available at http://www.oecd.org/officialdocuments/publicdisplaydocumentpdf/?cote=TAD/TC/WP(2012)24/FINAL&docLanguage=En
Hoekman B. and Shepherd B. (2013) Who Profits From Trade Facilitation Initiatives? Available at http://www10.iadb.org/intal/intalcdi/PE/2013/12982a03.pdf
OECD (2011), Customs Reform and Trade Facilitation in Ethiopia, available at http://www.oecd.org/aidfortrade/47799254.pdf
OECD (2013), WTO Ministerial Conference in Bali: Too Good a Prize to Pass Up, available at http://www.oecd.org/trade/facilitation/bali-too-good-a-prize-to-pass-up.htm
De Wulf, L. (2004), ‘Ghana’, in L. De Wulf and J.B. Sokol (eds.), Customs Modernization Initiatives: Case Studies, The World Bank, Washington, DC, available at https://openknowledge.worldbank.org/bitstream/handle/10986/14911/301120PAPER0Customs0case0studies.pdf?sequence=1
Draper, C. (2000), ‘Reforming Customs Administration: the Unlikely Case of Bangladesh’, mimeo, World Bank
De Wulf, L. and Sokol, J.B. (2004), Customs Modernization Initiatives: Case Studies, The World Bank, Washington, DC.
Hummels, D. (2001), ‘Time as a Trade Barrier’, available at http://www.mgmt.purdue.edu/faculty/hummelsd/research/time3b.pdf
Keen, M. (2003), ‘The Future of Fiscal Frontiers and the Modernization of Customs
Administration’, in M. Keen (ed.) Changing Customs: Challenges and Strategies for the Reform of Customs Administration, IMF, Washington, DC.
Goorman, A. (2004), ‘Peru’, in De Wulf, L. and J. Sokol (eds), Customs Modernisation Initiatives: Case Studies, Washington, D.C.: World Bank.
Kim, S., H. Lee and I. Park (2004), ‘Measuring the Impact of APEC Trade Facilitation: A Gravity Analysis’, paper presented at the APEC EC Committee meeting 30 September 2004 in Santiago, Chile.
APEC (1999), ‘Assessing APEC Trade Liberalization and Facilitation: 1999 Update, Economic Committee, September 1999, APEC: Singapore
APEC (2004a), ‘Trade Facilitation and Trade Liberalisation: From Shanghai to Bogor’, APEC Economic Committee, APEC: Singapore.
Commonwealth of Australia (2002), ‘APEC economies: Realising the Benefits of Trade Facilitation’, report prepared for the APEC ministerial meeting, Los Cabos, Mexico, 2002.
OECD (2005b), ‘OECD Regional Forum: Maximising the Developmental Benefits of Trade Facilitation’, OECD Trade Directorate, Paris: (TD/TC/WP/RD(2006)9).
Staples, B.R. (2002). ‘Trade Facilitation: Improving the Invisible Infrastructure’,
in B. Hoekman, A. Mattoo and P. English (eds.), Development, Trade and the WTO, The World Bank, Washington, DC.
United Nations (2002). Trade Facilitation Handbook: For the Greater MekongRegion, United Nations, New York.
Wilson, J.S., C.L. Mann and T. Otsuki (2003), ‘Assessing the Potential Benefit of Trade Facilitation: A Global Perspective’, World Bank Policy Research Working Paper No.3224.
African Trade Policy Centre, (2004), ‘Trade Facilitation to Integrate Africa into the World Economy’, Addis Ababa, UN Economic Commission for Africa (UNECA):ATPC Work in Progress No. 4.
APPENDIXES

APPENDIX A: Study of other Countries Experiences in Trade Facilitation Reforms
AngolaOECD (2005b)
Following years of civil war and a poorly operating customs administration, Angola adopted a customs expansion and modernisation programme in 2000. Crown Agents were hired to help design and introduce a thorough reform programme. The reforms focused on institutional weaknesses of the customs authority and six priority areas were identified. These included a reorganisation of the customs authority, the design and introduction of a new customs legislation framework, investments in HR management and training, the introduction of new customs procedures, financial management practices and the implementation of new information technology equipment. Half-way through the five-year programme, revenue receipts had increased by 150 percent and customs processing time had been reduced to 24 hours for correctly submitted documentation.
Bangladesh
Abid Khan (2004),Draper (2000)
In mid-1999, Bangladesh initiated a customs modernization programme after domestic and international pressure had heightened awareness of the poor state of the customs administration. The first wave of reform saw the implementation of ASYCUDA + +; a simplified tariff schedule; the introduction of PSI; and strengthening of training and competence building. Despite some significant operating problems, six months after the start of the programme customs revenue was up by 14 percent year-on-year and Draper concludes that the scheme was at least in part responsible for this increase in import tax revenue. Customs clearance times were reduced to 1-3 days for imports and 3-8 hours for exports.
Bolivia
Escobar (2004)Gutiérrez (2001)
In 1997, Bolivia introduced a customs reform project aimed at a total reengineering of the customs organisation, staffing, and its processes and procedures to restore institutional credibility, improve tax collection, and reduce high levels of corruption. The reform processes included the implementation of a new legislative and regulatory framework, a new organisational structure with previously corrupt customs official made redundant, and replacement of around 80 percent of staff. Wages were significantly raised and ASYCUDA + + was implemented. Despite certain setbacks and shortcomings, two years after the reform process was initiated, both corruption and customs clearance times had been substantially reduced. However, following the economic slowdown, there was a reduction in imports and private investment. The drop in imports exceeded the decline in customs revenue. In 2000, customs collection was up by 11 percent or 25 percent if account is taken for tariff reductions.
Bulgaria
WTO TPR (2003)
Bulgaria has drastically reformed its customs administration since 1998 when it harmonised its customs legislation with that of the European Union. Most restrictions to the importation of goods were removed and in 2001, all specific registration requirements for customs purposes were eliminated. Bulgaria also introduced a single administrative document for customs declaration and a number of other measures to tackle the problems with administrative and operational capacity. The senior management of the Customs Agency was changed in 2002 and a three-year programme of customs reform was initiated with the assistance of the U.K. Crown Agents. This programme aimed to improve the customs legislation and management practices, train customs officials and improve customs controls and anti-smuggling activities through the deployment of "mobile assurance teams". The World Bank assisted the work with institutional reform and trade facilitation. It also helped to

improve the Bulgarian Integrated Customs Information System. Since September 2002, when mobile assurance teams were introduced, there has been a steady increase in customs revenue. In January-May 2003, revenues increased by 158% year-on-year.
Jamaica
Staples (2002),UNPAN (2002)
In 1993, Jamaica’s government initiated a reform programme following complaints about widespread corruption and poor administrative practices. The reform programme included the implementation of a single-point clearance mechanism, the introduction of risk assessment procedures and the publication of a customs manual of procedures setting out all customs rights and responsibilities in export clearance. A customs automation service was later introduced and Crown Agents was contracted to implement software components for risk analysis, intelligence collection and data processing for valuation purposes. As a result of these initiatives, there was a steady and significant increase in revenue collection despite little or no economic growth in the country. Between 1998 and 2001, customs revenue increased by 110 percent.
Morocco
Steenlandt andDe Wulf (2004)
In 1996, Morocco’s customs administration was highly inefficient: in the main port of Casablanca, releasing a container took on average 18-20 days. A reform process was initiated and covered all aspects of customs operations, including an overhaul of the customs code, the implementation of the Customs Valuation Agreement of the WTO, new staff incentives and training, and focus on information and communication technology. The results were impressive. Imports (other than for home consumption) increased by 48 percent between 1996-02 while customs revenue increased by 8 percent between 1998-02 despite progressive tariff reductions. Customs clearance times were reduced to an average of 1-2 hours in 2001-03.
Mozambique
OECD (2005b),Mwangi (2004)
In 1997, Mozambique introduced a new customs programme – including a PSI scheme – which thoroughly reformed the customs administration. The reforms focused on improving the customs legislation, systems and procedures, HR management, organisation, IT and financial management. Crown Agents had also been hired in 1996 to help manage the customs authority. During the first two years of the programme, imports increased by 4 percent while customs revenue increased by 58 percent despite significant duty rate reductions. There was also a marked reduction in the clearance time of goods at the country’s principal points of entry: in the capital Maputo, 80 percent of road imports and 62 percent of imports by sea are cleared by customs within 24 hours of correctly submitted documentation. Initial investments in the customs administration were recovered within 14 months from additional revenue receipts.
Peru
Goorman(2004)
Following an economic crisis in 1990 and a number of failed attempts at reforming its customs administration, Peru finally managed to implement a customs reform programme in the beginning of the 1990s. It reduced the number of tariff levels from 39 to 2, initiated competence enhancing programmes and brought in automation systems and best practices in line with international standards. Despite a reduction in the average tariff level and the number of staff (from 3,800 to 2,600), customs revenue increased by 105 percent between 1990 and 1992 (327 percent in 1990-1995) whereas the value of imports increased by 37 percent over the same period (175 percent in 1990-1995). Customs release time dropped from a range of 15-30 days to 2 hours - 2 days.
Philippines
Keen (2003),Bhatnagar(2001)
In 1995, the Philippine customs authority decided to implement ASYCUDA + + for payment, risk assessment, clearance processing and shipment release from customs control. The initiation was a response to fraud in the customs administration and unduly long clearance times due to highly bureaucratic control procedures. One of

the goals was also to raise government revenue and the cost of the project was approximately USD 27 million. The results were positive: customs clearance time was reduced from an average of 8 days before the automation to 4 hours – 2 days following the introduction. The Philippine customs authority experienced significant problems during the implementation phase and the Asian financial crisis also affected trade in the country. Nevertheless, the net present value of increased revenue was considerably higher than the expenditure and customs was able to meet revenue targets in three of six years. Between 1990 and 1996 imports grew by 160 percent while revenue grew by 60 percent.
Singapore
United Nations(2002)
In 1989, Singapore introduced TradeNet, a highly efficient electronic trade document system which cost the country S$ 20 million to develop. The system linked trade parties – including 34 government units – to a single point of transaction for most trade-related activities. These activities cover customs clearance, payments of duties and taxes, processing of import and export permits and certificates of origin, and the collection of trade statistics. Studies suggest that the new system reduced trade documentation processing costs by 20-35 percent for traders. Singapore is the largest trader in the world when trade flows are measured in relation to GDP and government revenue is not linked to trade taxes. Nevertheless, Singapore claims that properly applied trade facilitation is saving it in excess of 1 percent of GDP each year.
Uganda
De Wulf (2004)
Uganda undertook a comprehensive reform programme in the 1990s which aimed at trade liberalisation and customs modernisation. The initiatives included the establishment of an independent revenue agency to improve revenue collection. Again, as in the case of Angola and Mozambique, the reforms included an overhaul of the entire customs authority including significant changes to the tariff schedule, improvements of the customs legislation, emphasis on HR management, implementation of ICT through ASYCUDA + +, and simplification of customs procedures. The reform programme brought considerable results. Revenue of the Uganda Revenue Authority increased from 7.7 percent to 13.0 percent of GDP in the ten-year period to 2002.
Source: Milner C. et al (2008)
APPENDIX B: Studies on Welfare Effects of Trade Facilitation Measures

Author Key findings
Francois et al.(2005)
Based on a CGE model exercise, the authors estimate that world annual income will increase by USD 72 billion (USD 151 billion) following a 1.5 percent (3.0 percent) reduction in TTCs for goods trade. In proportion to national income, most of these gains would benefit developing countries. All regions or major trading nations would benefit except China in the 1.5-percent reduction scenario. All countries/regions would benefit in the 3.0 percent, or “full liberalisation”, scenario.
OECD (2003a) Based on a CGE (GTAP) model exercise, the authors estimate that a 1-percent reduction of TTCs for goods trade will bring annual gains of about USD 40 billion on a world basis. Most of these gains will benefit developing countries in relative terms. There are no losers. Estimates as share of GDP reveals that Middle East & North Africa (0.27 percent), Non-OECD Asia Pacific (0.25 percent), OECD Europe (0.19 percent) and Sub-Saharan Africa (0.18 percent) would be particularly well off.
APEC (2002) Based on a CGE model exercise for APEC economies, the authors estimate that a 5- percent reduction in TTCs for goods trade will raise APEC’s GDP by USD 154 billion, or 0.9 percent.
Commonwealthof Australia(2002)
The authors estimate that in terms of annual increases of real incomes measured in1997 prices, gains from reforms of customs procedures are estimated to be USD 0.4billion in the Philippines, USD 2.3 billion in Singapore and USD 1.2 billion inThailand.
UNCTAD(2001)
A 1-percent reduction in the cost of maritime and air transport services in developing countries could increase global GDP by USD 7 billion (1997 value).
Source: OECD (2005c)
ANNEXE C: Impact of Trade Facilitation Measures on Trade Flows

Author (year) Key findingsAPEC(2004a)
Based on a gravity model exercise for APEC economies, improved trade facilitation by 10 percent boosts intra-APEC imports by a minimum of 0.5 percent in the area of customs procedures.
Dollar et al.(2004)
Based on survey results from 7,302 companies in eight developing economies (including Brazil, China and India), customs clearance times for both imports and exports have a significant negative effect on exportation.
Kim et al.(2004)
Based on a gravity model exercise for APEC economies, an improvement in customs procedures performance by 50 percent would increase imports by 1.7-3.4 percent in industrialised APEC economies, 2.0-4.5 percent in newly industrialised APEC economies, and 7.7-13.5 percent in industrialising APEC economies.
Wilson et al.(2004)
Based on a gravity model exercise for 75 countries, improvements in port efficiency and customs administration for below-average efficient countries half-way up to the global average would increase trade flows by USD 107 billion and USD 33 billion respectively. Improvements in customs administration and port efficiency would benefit developing countries significantly.
Batra et al.(2003)
Based on survey results from 8,560 companies in some 80 countries, ‘customs/foreign trade regulations’ were identified as the second most serious “tax and regulatory constraint” on operations and business growth/trade in Latin America, Africa, Developing East Asia and the Middle East.
Fox et al.(2003)
Based on GTAP-model estimates, the authors conclude that a removal of the frictions in border crossings (delays) between Mexico and the United States would lead to a USD 7 billion rise in trade, with southbound trade estimated to increase by USD 6 billion and northbound trade by USD 1 billion. Welfare would increase by USD 1.8 billion in Mexico and by USD 1.4 billion in the United States.
Wilson et al.(2003)
Based on a gravity model exercise for APEC economies, enhanced port efficiency has a large and positive effect on trade. Improvements in customs significantly expand trade but to a lesser degree. If port efficiency and customs environment in below-APEC-average members were brought half-way to the initial APEC-average, intra-APEC trade is estimated to increase by 11.5 percent. A 9.7 percent gain (USD 117 billion) is expected from increased port efficiency and 1.8 percent (USD 22 billion) from an improved customs environment.
Hummels(2001)
Each additional day spent in transport reduces the probability that the US will source from the country by 1–1.5 percent for manufactured goods (no effect for commodities). Each day saved in shipping time is worth 0.8 percent ad valorem for manufactures.
APEC (1999) Based on CGE analysis, a 1 percent reduction in import prices (from reduced TTCs) for Korea, Chinese Taipei and Singapore, and a 2 percent reduction for the other developing countries yield an increase in APEC merchandise trade of 3.3 percent.
Source: OECD (2005c)