Embed Size (px)
Citation preview
www.esri.ie
Working Paper No. 360
November 2010
Determinants of Vegetarianism and Partial Vegetarianism in the United Kingdom
Eimear Leahya, Seán Lyonsa b and Richard S.J. Tola b c
Abstract: Vegetarianism is increasing in the western world. Anecdotally, this trend can be attributed to heightened health, environmental and animal welfare concerns. In this paper we investigate the factors associated with vegetarianism among adults and children in the UK. Using the 2008 Health Survey for England, we use a logit model to assess the relationship between vegetarianism and the socioeconomic and personal characteristics of the respondents. We also analyse the factors associated with varying levels of meat consumption using an ordered logit model. This paper adds to the existing literature as it is the first paper to estimate the determinants of vegetarianism using a large dataset containing individual level consumption data.
Corresponding Author: [email protected]
a Economic and Social Research Institute, Whitaker Square, Sir John Rogerson’s Quay, Dublin 2, Ireland bDepartment of Economics, Trinity College, Dublin, Ireland c Institute for Environmental Studies and Department of Spatial Economics, Vrije Universiteit, Amsterdam, The Netherlands
ESRI working papers represent un-refereed work-in-progress by researchers who are solely responsible for the content and any views expressed therein. Any comments on these papers will be welcome and should be sent to the author(s) by email. Papers may be downloaded for personal use only.

2
Determinants of Vegetarianism and Partial Vegetarianism in the United Kingdom
1. Introduction
Meat production is set to double by 2050 due to an increase in the world population
and increased wealth in developing countries (FAO, 2010). At present, in less
developed countries, low income levels force many people to follow vegetarian diets.
In developed countries, where people are vegetarians by choice, vegetarianism is
increasing (Leahy, Lyons and Tol, 2010b). The notion of partial vegetarianism is also
becoming increasingly popular in developed nations. Catholics have long been urged
to abstain from meat consumption on Fridays. However, the heightened interest in
partial vegetarianism has been driven mainly by celebrity endorsed movements such
as the Meatless Monday campaign which began in 2003. Concern for animal welfare
and the environment are among the factors driving this trend. The relationship
between meat consumption, especially red meat, and global environmental change has
been acknowledged (FAO, 2006). Ruminant livestock are major emitters of methane,
the second-most important anthropogenic greenhouse gas.
Meat consumption also has implications for an individual’s health. In developed
countries, excessive meat consumption can be a health concern (Giovannucci et al.,
2004, Drewnowski and Specter, 2004, Hu et al., 2000, Rose, Boyar, and Wynder,
1986, James et al., 1997). Barnard, Nicholson and Howard (1995) studied the medical
costs associated with meat consumption in the USA. The authors estimate that costs
of between $30-60 billion per year result due to the higher prevalence of
hypertension, heart disease, cancer, diabetes, gallstones, obesity and food-borne
illness among omnivores compared with vegetarians.
Leahy, Lyons and Tol, (2010b) examined the determinants of vegetarianism at an
aggregate level. The findings suggest that there is a Kuznets-like relationship between
income and meat expenditure. For the poor, an increase in income results in higher
meat expenditure. However, at the global average income, meat consumption levels
off and at very high levels of per capita income vegetarianism increases. Higher levels
of education were also associated with increased vegetarianism and, in poor countries,
vegetarianism is negatively associated with the per capita level of meat production.
3
Leahy, Lyons and Tol (2010a) find that the proportion of vegetarians in the UK is
increasing (see Figure A1). In this paper, we analyse the determinants of
vegetarianism at the individual level. This study provides a much richer analysis of
the characteristics of vegetarians. This should be of benefit to those forecasting future
numbers of vegetarians and the associated environmental or health benefits. Because
partial vegetarianism can lead to important environmental and health benefits, we also
assess the personal and household characteristics associated with varying levels of
meat consumption.
Previous papers which aim to establish the motivations of vegetarians have usually
been carried out on small or unrepresentative samples (Beardsworth and Bryman,
1999, Fox and Ward, 2006, Jabs, Devine and Sobal, 1998). The majority of the
literature instead focuses on the health advantages of following a vegetarian diet. In a
study of almost 11,000 participants, with whom a follow up study was carried out 17
years later, Sanjoaquin et al. (2004) find that vegetarians showed a moderately but
nonsignificantly lower risk of colorectal cancer compared with non vegetarians. Also,
the risk of colorectal cancer was not seen to increase with higher meat consumption
among non vegetarians. Key et al. (1999) find with the use of Poisson regression
analysis that from a total sample of 76,172, of which 36.5% are vegetarian, mortality
from ischemic heart disease was 24% lower in vegetarians than in non vegetarians and
26% lower in vegans. Appleby, Davey and Key (2002) find that non-meat eaters,
especially vegans, are found to have a lower prevalence of hypertension and lower
systolic and diastolic blood pressures than meat eaters. The differences can largely be
explained by differences in body mass index, however. Key et al. (2009) studied the
cancer risk among British vegetarians. In this study the sample size was 61,566 and
the average follow-up took place 12.2 years after the initial interview. Results show
that vegetarians face a much lower risk of stomach cancer, ovarian cancer, bladder
cancer and cancer of the lymphatic and haematopoietic tissues than meat eaters.
In his summation of the literature on the health effects of vegetarianism,
Panebianco (2007) concluded that the merits of meat avoidance include a lower
incidence of obesity, a reduced risk of chronic diseases such as heart disease,
hypertension, and type 2 diabetes, a lower death rate from ischemic heart disease,
lower blood cholesterol levels, a lower incidence of certain cancers including prostate
and colon cancer, and greater longevity. Some authors for example, Worsley and

4
Skrzypiec, (1997) have suggested, however, that there is a link between teenage
vegetarianism and eating disorders, especially among females,
While literature on the determinants of vegetarianism is lacking, research into meat
consumption has been extensive. The factors affecting meat demand have been
studied at a micro level for example in Ireland by Newman et al. (2001), in the USA
by Nayga (1995), in the UK by Burton et al. (1994), in Japan by Chern et al. (2002)
and in Mexico by Gould et al. (2002). Results suggest that the demand for meat is
affected by factors such as income, household size, education level and professional
status. Changing socio economic patterns have also resulted in changing the pattern of
meat demand. Meat products which are seen as being convenient and versatile have
become popular in developed countries (Newman et al., 2002, Meat and Livestock
Commission, 1996). During the 1990s in the UK it was found that price and income
were declining in importance and the demand for meat was dominated by preferences
and tastes (Burton et al., 1996, 1999). Various health scares such as the BSE crisis
have resulted in a noticeable demand shift away from red meat towards white meat
(Burton et al., 1999). A recent analysis of the role of the media on the demand for
meat shows that animal welfare advertising has a small but statistically significant
effect on pork and poultry demand (Tonser and Olynk, 2010).
The majority of meat demand studies to date have used household expenditure
surveys with which it is difficult to predict individual consumption patterns because
data is collected at the household level. Also, such surveys do not usually contain
detailed information about eating out. Expenditure does not necessary equal
consumption (e.g., someone may buy meat for her dog). Expenditure surveys cannot
distinguish between people who eat a lot of cheap meat and people who eat a little bit
of expensive meat. There can also be problems with the accuracy of purchase recall,
and the frequency of purchase. All this makes expenditures surveys less suitable for
studying the patterns of vegetarianism. The advantage of this paper is that the data we
use is collected at the individual level and respondents are asked about general eating
patterns as opposed to expenditure at a point in time. To our knowledge, this is the
first empirical analysis of the determinants of vegetarianism and partial vegetarianism
using a large micro dataset.
The paper continues as follows. Section 2 describes the data and methods used and
section 3 discusses the results. Section 4 provides a discussion and conclusion.
5
2. Data and Methods
We use the 2008 Health Survey for England in which 15,102 adults and 7,521 children
took part. 3,473 children were from the core sample and 4,048 were from a later boost
sample (Department of Health, 2010). A response rate of 64% was achieved for the core
sample and 73% for the boost sample. The Health Survey for England specialises in
different topics each year. The 2008 survey focuses on physical activity and fitness levels.
Participants were interviewed, and for those in the core sample this was followed by a
nurse visit. Adults and children were asked a range of questions about general health,
fruit and vegetable consumption, alcohol consumption, smoking, and physical activity.
Respondents aged 16 and over were asked to self- complete a section on eating habits
while an interviewer completed the section on children’s eating habits. Adults and
children were asked how often they consume both red and white meat; 6 or more times a
week, 3-5 times a week, 1-2 times a week, less than once a week, or rarely or never. We
classify those who identify themselves as consuming both red and white meat “rarely or
never” as vegetarians. While this is not perfect, it is the best measure available to identify
vegetarians.
The Health Survey for England also contains information on income and other
socio-economic variables which we use as explanatory variables in our models. The
analysis is made up of two parts. In the first we use logit regression models to analyse
the factors associated with vegetarianism. The dependent variable is a binary variable,
equalling 1 if the respondent eats red meat or white meat “rarely or never” and 0 if
he/she eats any type of meat more often. We carry out separate analyses for adults and
children.
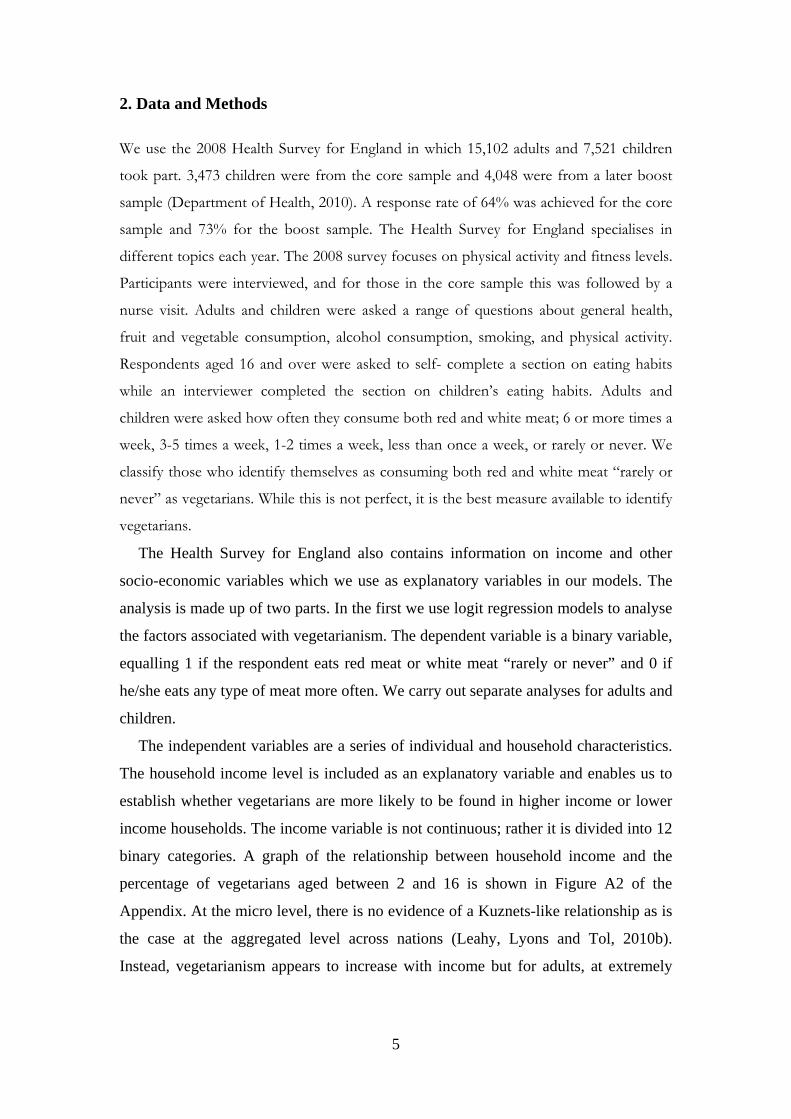
The independent variables are a series of individual and household characteristics.
The household income level is included as an explanatory variable and enables us to
establish whether vegetarians are more likely to be found in higher income or lower
income households. The income variable is not continuous; rather it is divided into 12
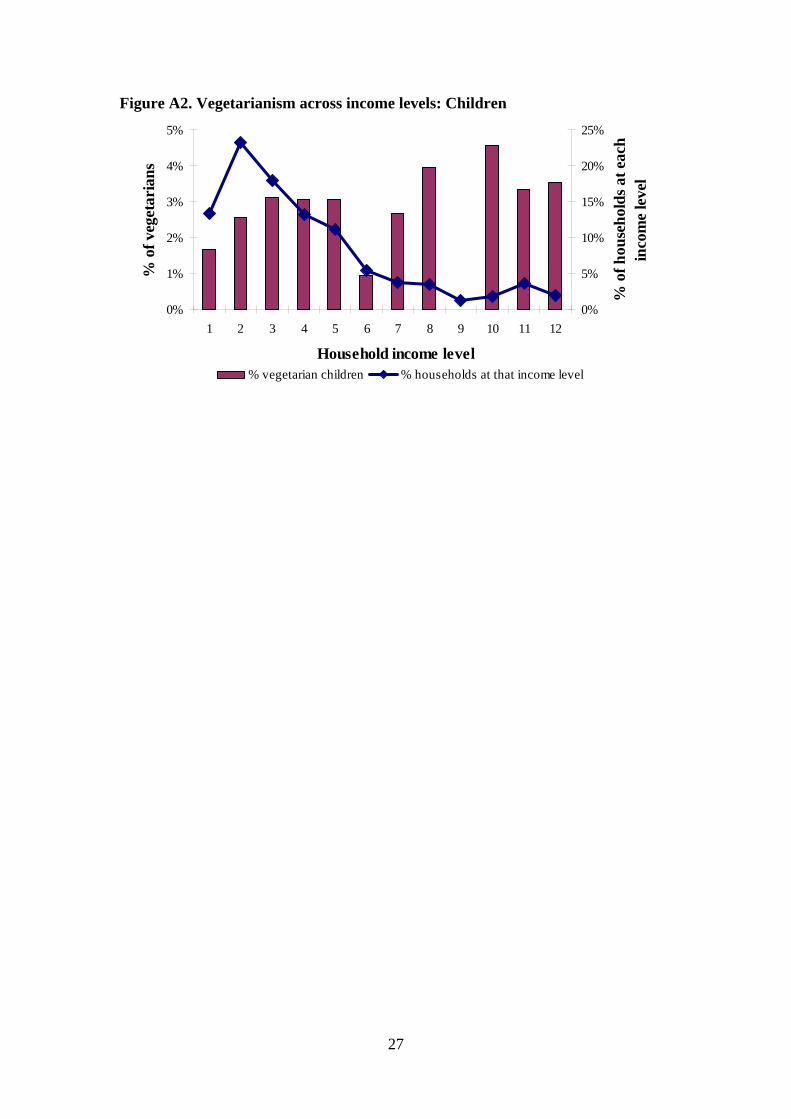
binary categories. A graph of the relationship between household income and the
percentage of vegetarians aged between 2 and 16 is shown in Figure A2 of the
Appendix. At the micro level, there is no evidence of a Kuznets-like relationship as is
the case at the aggregated level across nations (Leahy, Lyons and Tol, 2010b).
Instead, vegetarianism appears to increase with income but for adults, at extremely

6
high income levels, the proportion of the population that is vegetarian falls (see Figure
A3 of the Appendix).
For the analysis of vegetarianism among children we also control for the social
class of the household reference person (HRP)1 as we expect to find a positive
relationship between vegetarianism and higher social classes. As the presence of other
vegetarians in a household may increase the likelihood that a child will be vegetarian,
we control for the number of other vegetarians in the household. We expect to find
that vegetarians are more prevalent in urban areas (and in particular big cities) than in
rural areas or small towns. Therefore we control for the region in which the child lives
and the degree of urbanisation. Also included is the age and gender of the child.
Anecdotally, vegetarianism is becoming more prevalent among young adults and
females in particular. We wish to ascertain whether there is a link between vegetarians
and the health conscious. The child’s body mass index (bmi) is measured and the
number of portions of fruit and vegetables consumed daily are counted. Children are
also asked whether they get the recommended amount of physical activity or not. The
recommended amount of exercise for children is a minimum of 60 minutes of
moderate2 to vigorous exercise every day of the week. Children are also asked if they
are trying to lose weight. We expect to find a positive relationship between being on a
diet and vegetarianism. Other control variables include having a long term illness,
because this may mean respondents are obliged to follow restricted diets, and ethnic
origin because this may influence meat eating patterns, particularly those of red meat.
We then do the same analysis for adults. The questions asked to adults and children
vary slightly. With regard to adults, we control for all of the above except we do not
know if adults are trying to lose weight and, instead of controlling for the social class
of the HRP, we control for the social class of the respondent. In addition, we include
the education level and economic status of the individual because those educated to
higher levels and those in professional occupations may have a higher probability of
being a vegetarian. The explanatory variables also include smoking and alcohol
intake. We expect to find that vegetarians are more health conscious and so, alcohol
intake might be lower than that of non vegetarians. Similarly, we expect to find that
1 The HRP is the highest earner in the household. If household members cannot be separated by income, the oldest person is chosen. 2 Moderate activity is defined as an activity that makes one out of breath or sweaty, indicating that one is doing cardiovascular activity.
7
non smokers are more likely to be vegetarians than smokers. Finally, we control for
the marital status of the individual. Pribis, Sabate and Fraser (1999) find no
differences in martial status between vegetarians and non vegetarians. However, the
sample used was small (158 adults) and unrepresentative of the population. A list of
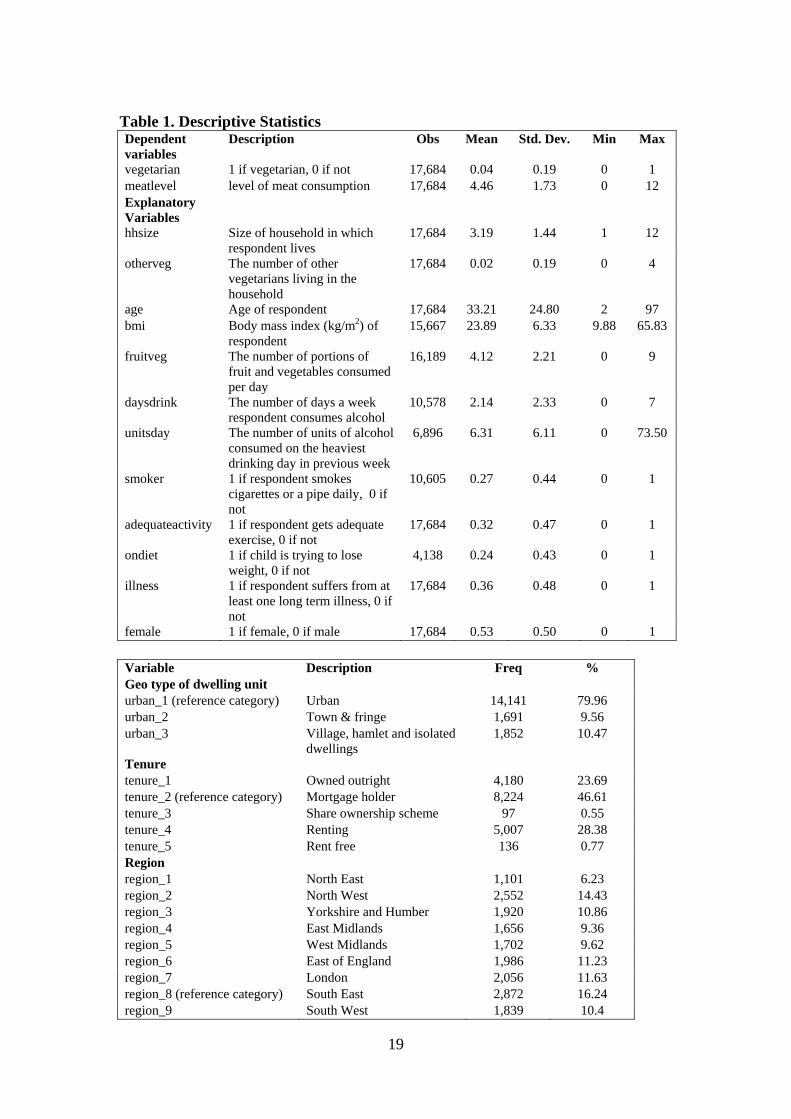
the variables included in our models and some descriptive statistics on them is set out
in Table 1.
[Table 1 about here]
In the second part of the analysis we examine the factors associated with varying
levels of meat consumption. We construct an ordered logit model in which the
dependent variable is the level meat consumption. First we construct a red meat
consumption scale. 0 indicates that red meat is consumed rarely or never, 1 indicates
that red meat is consumed less than once a week, 2 indicates that red meat is
consumed 1-2 times a week, 3 indicates a consumption level of 3-5 times a week and
6 means that red meat is consumed at least 6 times per week. We do the same for
white meat and then combine the two scales in order to rank total meat consumption.
Thus, the dependent variable takes a value of 0 if the consumption level is rarely or
never in both of the red and white meat categories, 1 if it is less than once a week in
one of the categories and 0 in the other, 2 if it is less than once a week for both red
and white meat consumption or 1-2 times a week in one of the categories and zero in
the other and so on until we have a variable which takes a value of 0, 1, 2, 3, 4, 5, 6, 7,
8, 9, or 12. We run separate models for children and adults.
For both the logit and ordered logit models we include all of the explanatory
variables we believe may influence meat consumption. We then test for joint
significance of the insignificant variables. Due to the large number of explanatory
variables in our models, only the results of the more parsimonious models are
presented. Full regression results are available on request from the authors.
3. Results
3.1 Vegetarianism
The dependent variable equals 1 if the respondent is a vegetarian, 0 otherwise. For
each categorical explanatory variable there is a reference category which acts as a
8
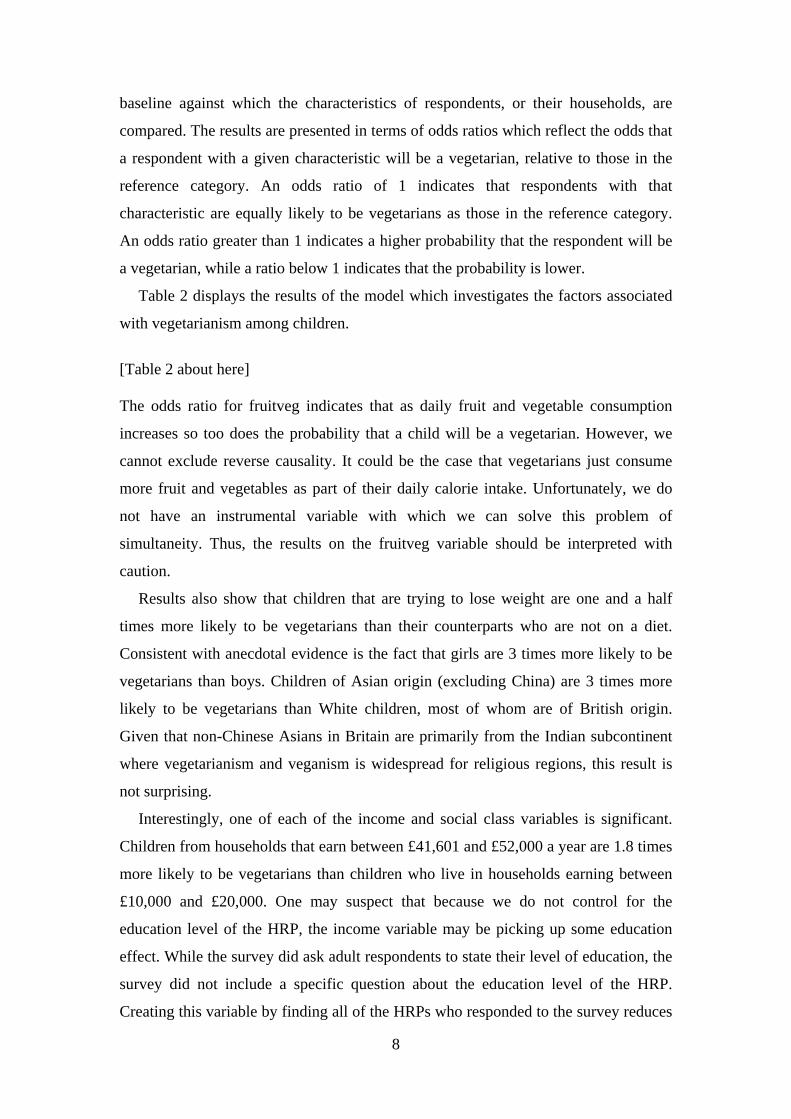
baseline against which the characteristics of respondents, or their households, are
compared. The results are presented in terms of odds ratios which reflect the odds that
a respondent with a given characteristic will be a vegetarian, relative to those in the
reference category. An odds ratio of 1 indicates that respondents with that
characteristic are equally likely to be vegetarians as those in the reference category.
An odds ratio greater than 1 indicates a higher probability that the respondent will be
a vegetarian, while a ratio below 1 indicates that the probability is lower.
Table 2 displays the results of the model which investigates the factors associated
with vegetarianism among children.
[Table 2 about here] The odds ratio for fruitveg indicates that as daily fruit and vegetable consumption
increases so too does the probability that a child will be a vegetarian. However, we
cannot exclude reverse causality. It could be the case that vegetarians just consume
more fruit and vegetables as part of their daily calorie intake. Unfortunately, we do
not have an instrumental variable with which we can solve this problem of
simultaneity. Thus, the results on the fruitveg variable should be interpreted with
caution.
Results also show that children that are trying to lose weight are one and a half
times more likely to be vegetarians than their counterparts who are not on a diet.
Consistent with anecdotal evidence is the fact that girls are 3 times more likely to be
vegetarians than boys. Children of Asian origin (excluding China) are 3 times more
likely to be vegetarians than White children, most of whom are of British origin.
Given that non-Chinese Asians in Britain are primarily from the Indian subcontinent
where vegetarianism and veganism is widespread for religious regions, this result is
not surprising.
Interestingly, one of each of the income and social class variables is significant.
Children from households that earn between £41,601 and £52,000 a year are 1.8 times
more likely to be vegetarians than children who live in households earning between
£10,000 and £20,000. One may suspect that because we do not control for the
education level of the HRP, the income variable may be picking up some education
effect. While the survey did ask adult respondents to state their level of education, the
survey did not include a specific question about the education level of the HRP.
Creating this variable by finding all of the HRPs who responded to the survey reduces

9
the number of observations to 469.3 Children living in households where the HRP is a
semi-skilled manual worker are 1.6 times more likely to be vegetarians than children
living with reference persons who are managerial or technical workers. Since we do
not control for the education level of the HRP, we would have expected that the
reference group, managerial and technical workers, who achieve relatively high levels
of education (30% of this group have a degree or higher) would be more likely to be
vegetarians than the less well educated semi-skilled manual workers (6% have a
degree or higher). Thus, there is some factor, other than education, that we don’t
observe that would explain this result. Finally, children living in the East Midlands are
significantly more likely to be vegetarians compared to those living in the South East.
This result must be explained by some factor we do not observe.
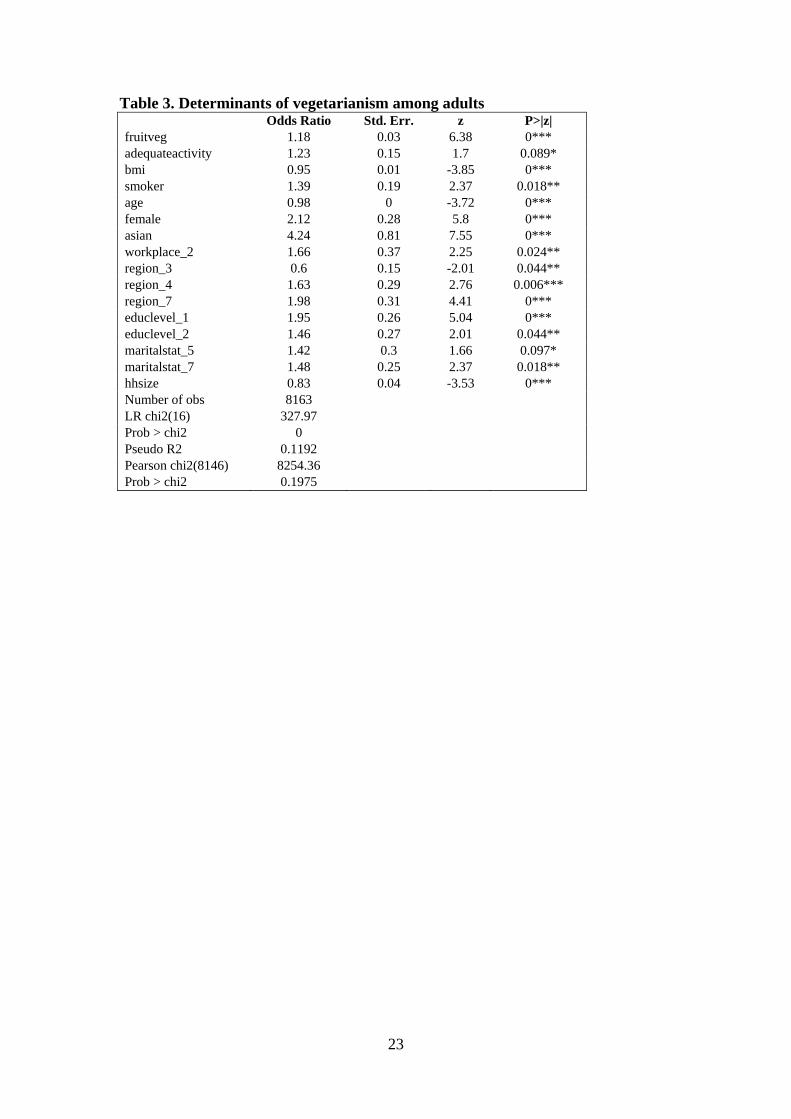
Table 3 shows the results of the model which investigates the factors associated
with vegetarianism among adults. The number of observations is much higher than is
the case for children, as is the number of significant variables. The results of the
parsimonious model are presented. The omitted variables prove individually and
jointly insignificant.
[Table 3 about here] Results show that there is a positive correlation between vegetarianism and the
consumption of fruit and vegetables. However, as stated previously, we cannot draw
any causal inferences between the two variables using this data. Similarly, adults
getting the recommended amount of physical activity per week are 23% more likely to
be vegetarians than adults who do not meet the criteria.4 The odds ratio for bmi
indicates that the lower a person’s bmi, the higher the probability that the person is a
vegetarian. This suggests that people chose to become vegetarians for health reasons.
However, it could be the case that the non-consumption of meat reduces the bmi.
Thus, we interpret the odds ratios on these variables with caution. We know only that
the variables are positively correlated but we cannot say that one causes the other.
3 A total of 17,684 respondents from 9,870 households took part in the survey but over 60% of households did not provide an interview from the HRP. This, along with the exclusion of a child’s interview in other households, reduces the total number of observations dramatically. The education level of the HRP was not significant in an earlier version of the model. Thus, we decided to omit it. 4 For adults, the recommended amount is at least 30 minutes of moderate activity 5 days a week or at least 30 minutes of vigorous activity 3 days a week.
10
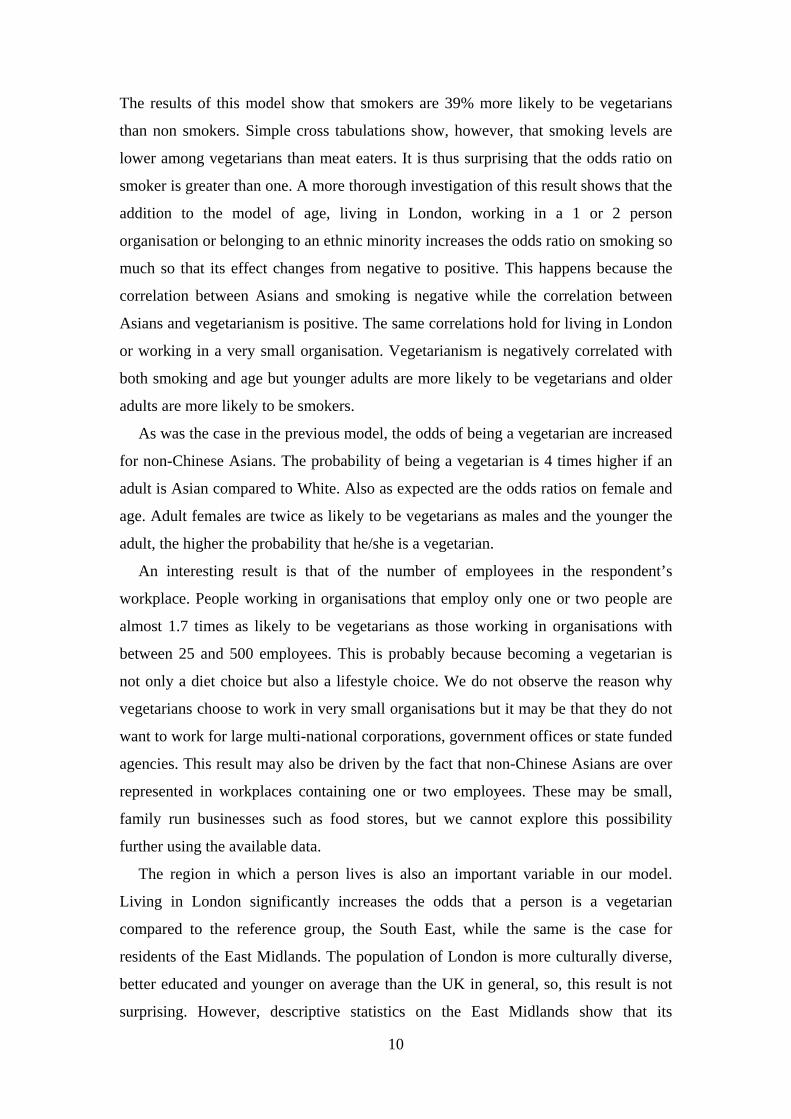
The results of this model show that smokers are 39% more likely to be vegetarians
than non smokers. Simple cross tabulations show, however, that smoking levels are
lower among vegetarians than meat eaters. It is thus surprising that the odds ratio on
smoker is greater than one. A more thorough investigation of this result shows that the
addition to the model of age, living in London, working in a 1 or 2 person
organisation or belonging to an ethnic minority increases the odds ratio on smoking so
much so that its effect changes from negative to positive. This happens because the
correlation between Asians and smoking is negative while the correlation between
Asians and vegetarianism is positive. The same correlations hold for living in London
or working in a very small organisation. Vegetarianism is negatively correlated with
both smoking and age but younger adults are more likely to be vegetarians and older
adults are more likely to be smokers.
As was the case in the previous model, the odds of being a vegetarian are increased
for non-Chinese Asians. The probability of being a vegetarian is 4 times higher if an
adult is Asian compared to White. Also as expected are the odds ratios on female and
age. Adult females are twice as likely to be vegetarians as males and the younger the
adult, the higher the probability that he/she is a vegetarian.
An interesting result is that of the number of employees in the respondent’s
workplace. People working in organisations that employ only one or two people are
almost 1.7 times as likely to be vegetarians as those working in organisations with
between 25 and 500 employees. This is probably because becoming a vegetarian is
not only a diet choice but also a lifestyle choice. We do not observe the reason why
vegetarians choose to work in very small organisations but it may be that they do not
want to work for large multi-national corporations, government offices or state funded
agencies. This result may also be driven by the fact that non-Chinese Asians are over
represented in workplaces containing one or two employees. These may be small,
family run businesses such as food stores, but we cannot explore this possibility
further using the available data.
The region in which a person lives is also an important variable in our model.
Living in London significantly increases the odds that a person is a vegetarian
compared to the reference group, the South East, while the same is the case for
residents of the East Midlands. The population of London is more culturally diverse,
better educated and younger on average than the UK in general, so, this result is not
surprising. However, descriptive statistics on the East Midlands show that its
11
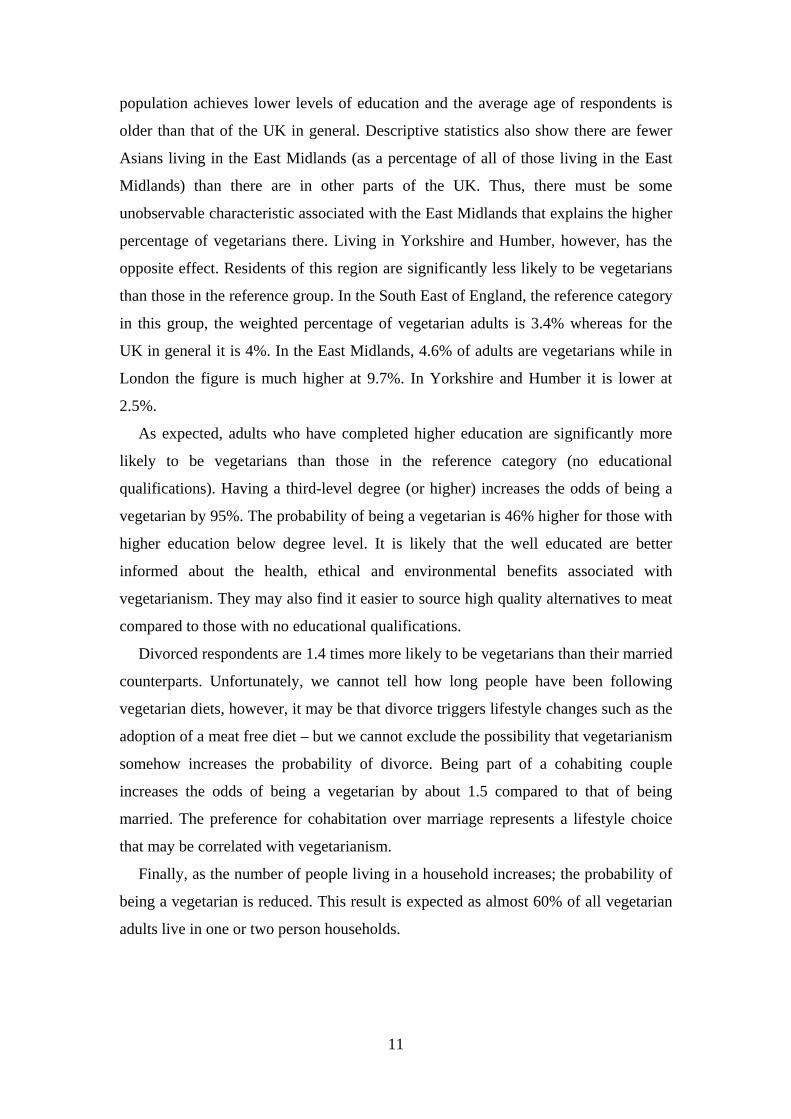
population achieves lower levels of education and the average age of respondents is
older than that of the UK in general. Descriptive statistics also show there are fewer
Asians living in the East Midlands (as a percentage of all of those living in the East
Midlands) than there are in other parts of the UK. Thus, there must be some
unobservable characteristic associated with the East Midlands that explains the higher
percentage of vegetarians there. Living in Yorkshire and Humber, however, has the
opposite effect. Residents of this region are significantly less likely to be vegetarians
than those in the reference group. In the South East of England, the reference category
in this group, the weighted percentage of vegetarian adults is 3.4% whereas for the
UK in general it is 4%. In the East Midlands, 4.6% of adults are vegetarians while in
London the figure is much higher at 9.7%. In Yorkshire and Humber it is lower at
2.5%.
As expected, adults who have completed higher education are significantly more
likely to be vegetarians than those in the reference category (no educational
qualifications). Having a third-level degree (or higher) increases the odds of being a
vegetarian by 95%. The probability of being a vegetarian is 46% higher for those with
higher education below degree level. It is likely that the well educated are better
informed about the health, ethical and environmental benefits associated with
vegetarianism. They may also find it easier to source high quality alternatives to meat
compared to those with no educational qualifications.
Divorced respondents are 1.4 times more likely to be vegetarians than their married
counterparts. Unfortunately, we cannot tell how long people have been following
vegetarian diets, however, it may be that divorce triggers lifestyle changes such as the
adoption of a meat free diet – but we cannot exclude the possibility that vegetarianism
somehow increases the probability of divorce. Being part of a cohabiting couple
increases the odds of being a vegetarian by about 1.5 compared to that of being
married. The preference for cohabitation over marriage represents a lifestyle choice
that may be correlated with vegetarianism.
Finally, as the number of people living in a household increases; the probability of
being a vegetarian is reduced. This result is expected as almost 60% of all vegetarian
adults live in one or two person households.
12
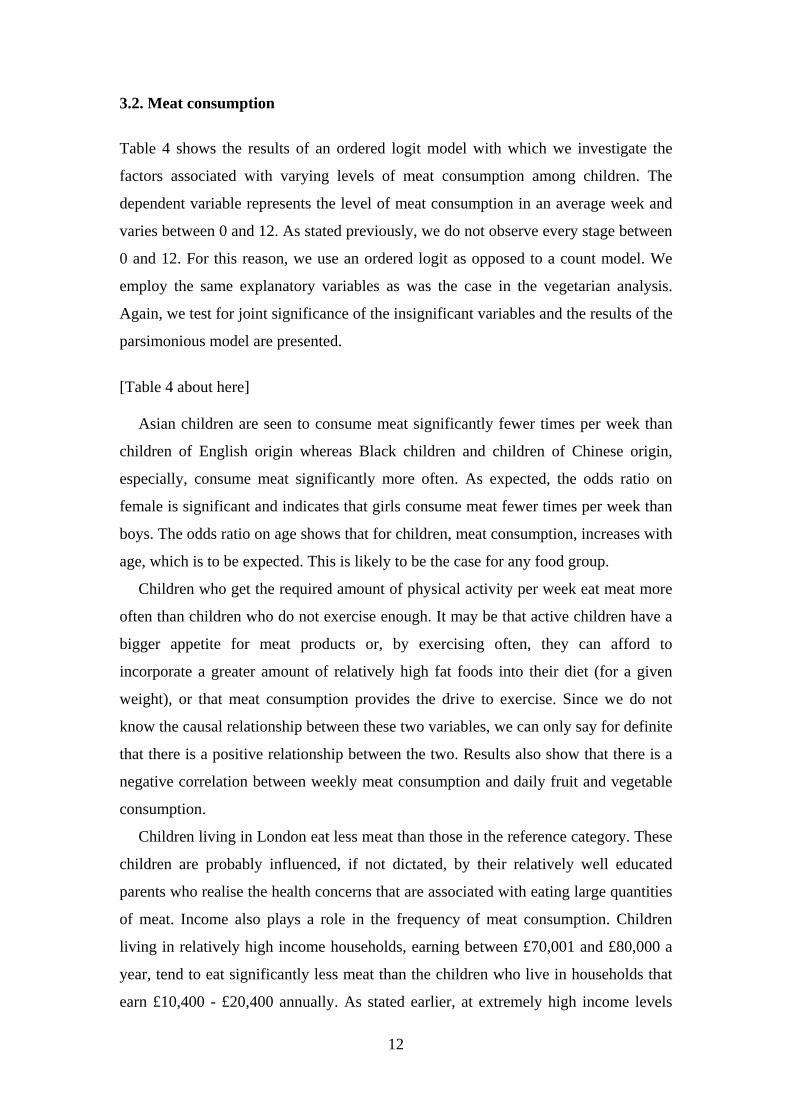
3.2. Meat consumption
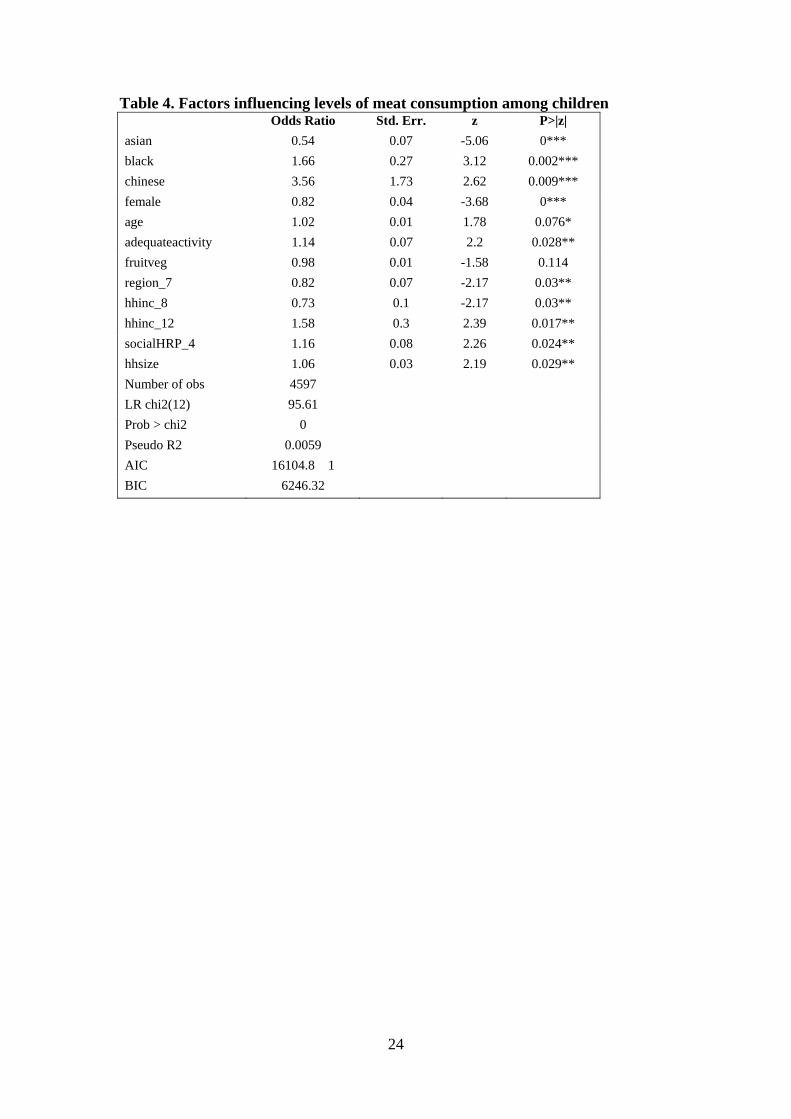
Table 4 shows the results of an ordered logit model with which we investigate the
factors associated with varying levels of meat consumption among children. The
dependent variable represents the level of meat consumption in an average week and
varies between 0 and 12. As stated previously, we do not observe every stage between
0 and 12. For this reason, we use an ordered logit as opposed to a count model. We
employ the same explanatory variables as was the case in the vegetarian analysis.
Again, we test for joint significance of the insignificant variables and the results of the
parsimonious model are presented.
[Table 4 about here]
Asian children are seen to consume meat significantly fewer times per week than
children of English origin whereas Black children and children of Chinese origin,
especially, consume meat significantly more often. As expected, the odds ratio on
female is significant and indicates that girls consume meat fewer times per week than
boys. The odds ratio on age shows that for children, meat consumption, increases with
age, which is to be expected. This is likely to be the case for any food group.
Children who get the required amount of physical activity per week eat meat more
often than children who do not exercise enough. It may be that active children have a
bigger appetite for meat products or, by exercising often, they can afford to
incorporate a greater amount of relatively high fat foods into their diet (for a given
weight), or that meat consumption provides the drive to exercise. Since we do not
know the causal relationship between these two variables, we can only say for definite
that there is a positive relationship between the two. Results also show that there is a
negative correlation between weekly meat consumption and daily fruit and vegetable
consumption.
Children living in London eat less meat than those in the reference category. These
children are probably influenced, if not dictated, by their relatively well educated
parents who realise the health concerns that are associated with eating large quantities
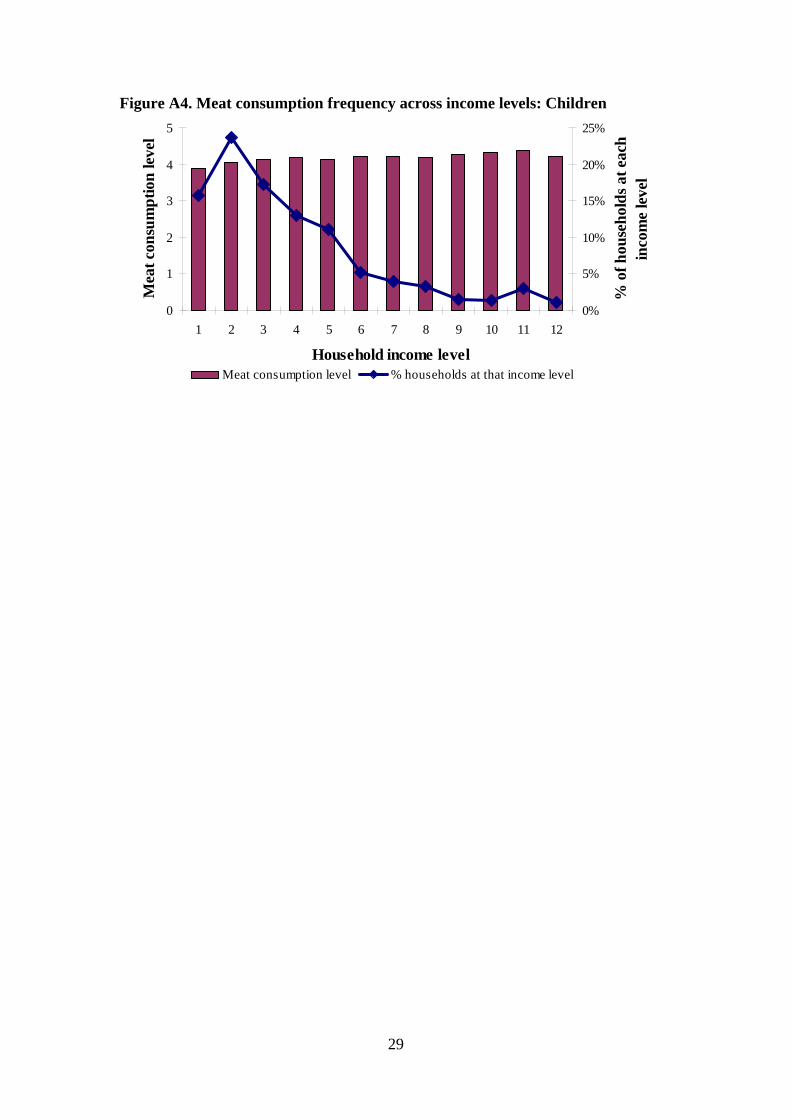
of meat. Income also plays a role in the frequency of meat consumption. Children
living in relatively high income households, earning between £70,001 and £80,000 a
year, tend to eat significantly less meat than the children who live in households that
earn £10,400 - £20,400 annually. As stated earlier, at extremely high income levels
13
excessive meat consumption can be a health concern. This finding is reinforced in this
model by the odds ratio for the highest income earners. Children living in households
that earn over £150,000 a year eat almost 60% more meat (if we are to believe that
portions sizes are roughly the same in each sitting) than their counterparts in the
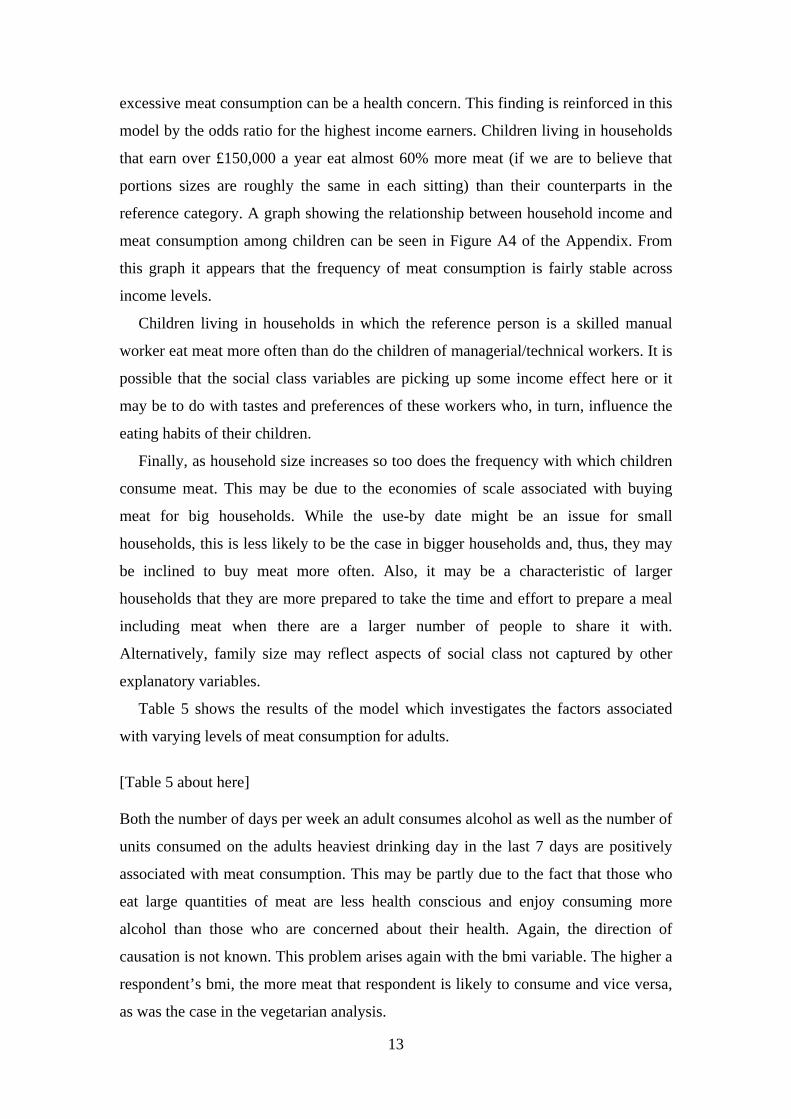
reference category. A graph showing the relationship between household income and
meat consumption among children can be seen in Figure A4 of the Appendix. From
this graph it appears that the frequency of meat consumption is fairly stable across
income levels.
Children living in households in which the reference person is a skilled manual
worker eat meat more often than do the children of managerial/technical workers. It is
possible that the social class variables are picking up some income effect here or it
may be to do with tastes and preferences of these workers who, in turn, influence the
eating habits of their children.
Finally, as household size increases so too does the frequency with which children
consume meat. This may be due to the economies of scale associated with buying
meat for big households. While the use-by date might be an issue for small
households, this is less likely to be the case in bigger households and, thus, they may
be inclined to buy meat more often. Also, it may be a characteristic of larger
households that they are more prepared to take the time and effort to prepare a meal
including meat when there are a larger number of people to share it with.
Alternatively, family size may reflect aspects of social class not captured by other
explanatory variables.
Table 5 shows the results of the model which investigates the factors associated
with varying levels of meat consumption for adults.
[Table 5 about here] Both the number of days per week an adult consumes alcohol as well as the number of
units consumed on the adults heaviest drinking day in the last 7 days are positively
associated with meat consumption. This may be partly due to the fact that those who
eat large quantities of meat are less health conscious and enjoy consuming more
alcohol than those who are concerned about their health. Again, the direction of
causation is not known. This problem arises again with the bmi variable. The higher a
respondent’s bmi, the more meat that respondent is likely to consume and vice versa,
as was the case in the vegetarian analysis.
14
As expected, ethnicity is strongly correlated with levels of meat consumption.
Asians consume over 60% less meat than Whites while Blacks and respondents of
mixed ethnic backgrounds consume significantly more. The odds ratio on female is
consistent with that of the previous model while respondents who live in the South
West of England consume meat on fewer occasions than those living in the South
East. Since we control for income, education, social class and employment status, this
result must be explained by some factor that we do not observe.
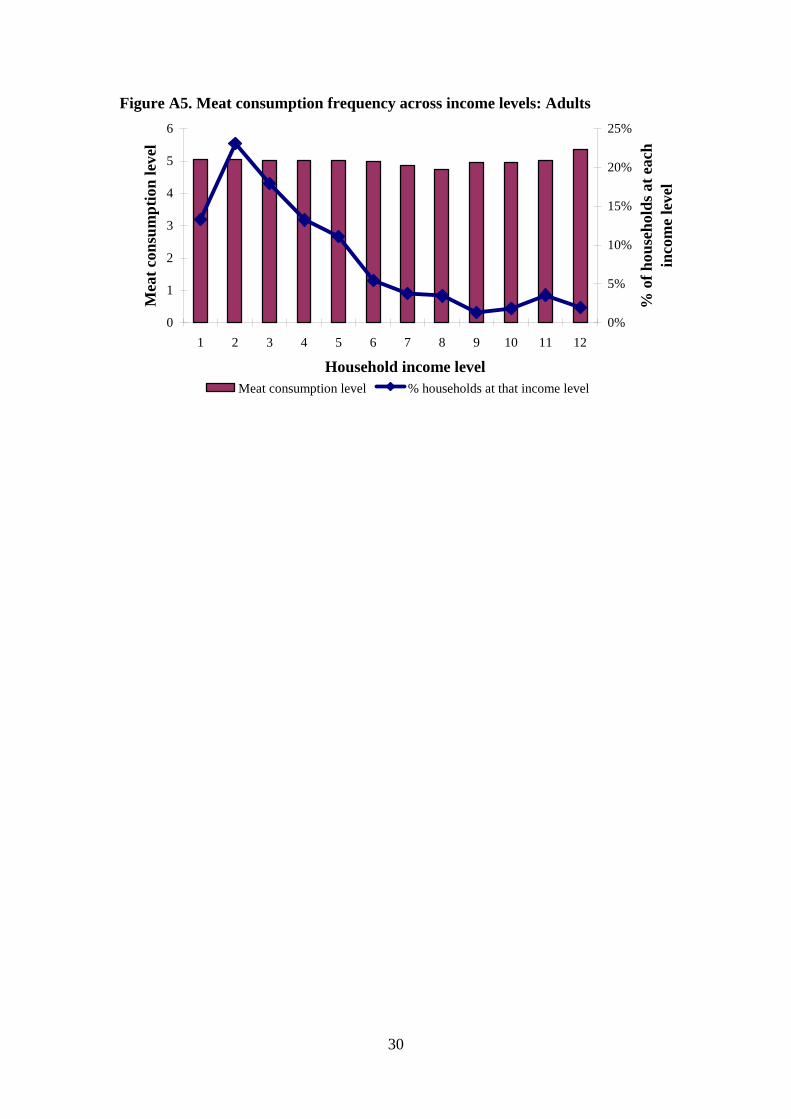
As was the case in the model looking at meat consumption among children, a high
level of income proves statistically significant. This time we see that adults who live
in households earning between £100,001 and £150,000 a year eat meat more often
than those in the reference category. Not only can these people afford to buy meat for
home consumption more often, it may also be the case that residents of these high
income households eat in restaurants offering a large number of meat dishes more
often than their poorer counterparts. This may also partly explain the positive
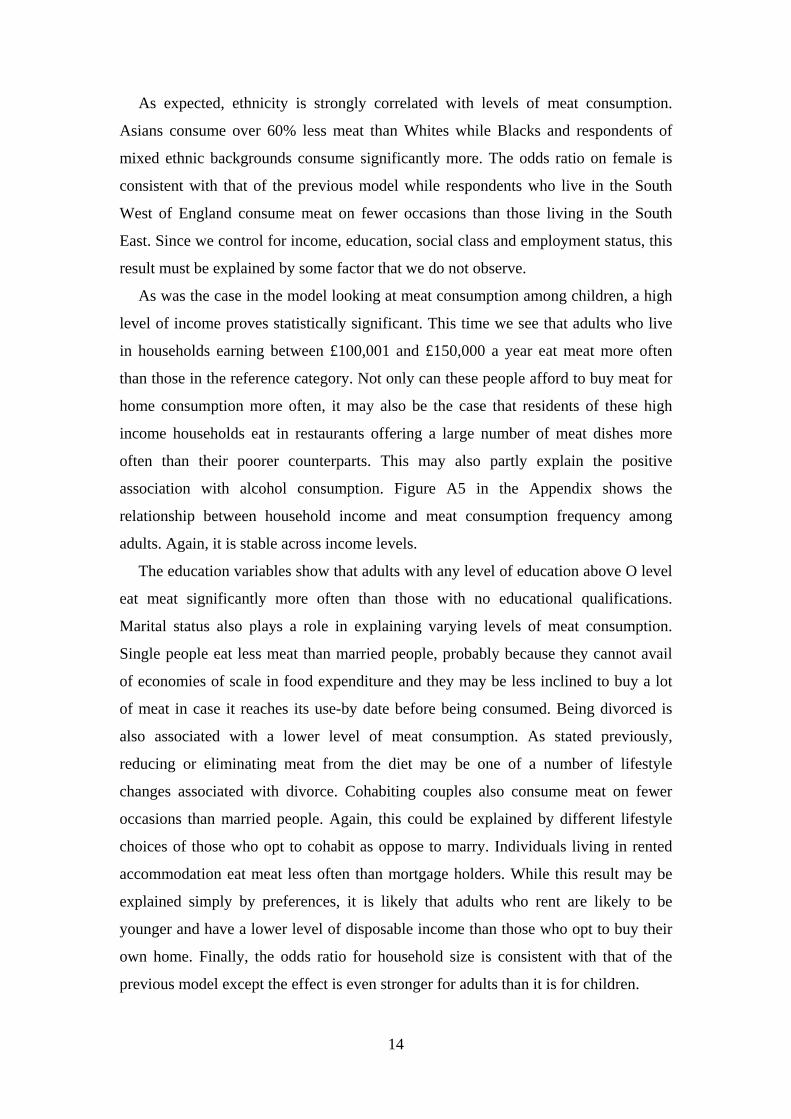
association with alcohol consumption. Figure A5 in the Appendix shows the
relationship between household income and meat consumption frequency among
adults. Again, it is stable across income levels.
The education variables show that adults with any level of education above O level
eat meat significantly more often than those with no educational qualifications.
Marital status also plays a role in explaining varying levels of meat consumption.
Single people eat less meat than married people, probably because they cannot avail
of economies of scale in food expenditure and they may be less inclined to buy a lot
of meat in case it reaches its use-by date before being consumed. Being divorced is
also associated with a lower level of meat consumption. As stated previously,
reducing or eliminating meat from the diet may be one of a number of lifestyle
changes associated with divorce. Cohabiting couples also consume meat on fewer
occasions than married people. Again, this could be explained by different lifestyle
choices of those who opt to cohabit as oppose to marry. Individuals living in rented
accommodation eat meat less often than mortgage holders. While this result may be
explained simply by preferences, it is likely that adults who rent are likely to be
younger and have a lower level of disposable income than those who opt to buy their
own home. Finally, the odds ratio for household size is consistent with that of the
previous model except the effect is even stronger for adults than it is for children.
15
Discussion and Conclusion
In this paper, we investigate the factors associated with vegetarianism at the
individual level. We find that gender, ethnic origin, the region in which a person lives,
their level of education and other lifestyle choices are all significantly associated with
vegetarianism. Consistent across both the adult and child analyses are the findings that
vegetarians are more likely to be female as opposed to male and Asian as opposed to
White. The identification of causal relationships between some of the variables in our
models and vegetarianism is constrained by the data. We are unable to correct for
problems of simultaneity due to the lack of suitable instrumental variables and
because the data are cross sectional. Also, due to data limitations, we cannot test the
hypotheses that people become vegetarians for heath, environmental or animal
welfare reasons.
We also investigate the factors driving the frequency of meat consumption. Only a
few variables are found to be significant in the meat consumption analysis for both
children and adults; being female and being Asian both negatively affect the level of
meat consumed while Blacks are found to consume meat significantly more often than
Whites. The household size variable is important for the level of meat consumed by
both adults and children. The larger the household, the more often meat is consumed.
It thus appears that there are economies of scale in food consumption and small
households may be deterred from consuming meat as often because of the associated
cost, limited life span of meat, or the effort required in preparation.
The U-shaped relationship between income and vegetarianism at the aggregate
level does not exist at the micro level. It is neither the richest nor the poorest of
households that have the highest levels of vegetarianism. Nevertheless, most adult
vegetarians belong to households earning between £80,001 and £90,000 a year while
most children live in households earning between £90,001 and £100,000, both well
above the national average. We see that there is much more variation in the level of
vegetarianism across income levels than there is in meat consumption frequency.
As expected, vegetarianism increases with education (37% of vegetarians are
educated to degree level or higher) while for those that do eat meat, respondents who
discontinued education after A levels are the most frequent consumers. This is
probably because the well educated are aware of the health and environmental
benefits that are associated with a low meat, if not a meat free, diet.

16
Acknowledgements
The Energy Policy Research Centre of the ESRI provided financial support.
References Appleby, P.N., Davey, G.K., Key, T.J., 2002. Hypertension and blood pressure among meat eaters, fish eaters, vegetarians and vegans in EPIC–Oxford. Public Health Nutrition, 5, 645-654. Barnard, N.D., Nicholson, A., Howard, J.L., 1995. The Medical Costs Attributable to Meat Consumption. Preventative Medicine, 24, 646-655. Beardsworth, A., Bryman, A., 1999. Meat consumption and vegetarianism among young adults in the UK: An empirical study. British Food Journal, 101, 289-300. Burton, M., Dorsett, R., Young, T., 1996. Changing preferences for meat: Evidence from UK household data, 1973-93. European Review of Agricultural Economics, 23, 357-370. Burton, M., Tomlinson, M., Young, T., 1994. Consumers' Decisions whether or not to Purchase Meat: A Double Hurdle Analysis of Single Adult Households. Journal of Agricultural Economics, 45, 202-212. Burton, M., Cromb, R., Young, T., 1999. Meat consumers' long-term response to perceived risks associated with the BSE crisis in Britain. Cashiers d'Economie et Sociologie Rurales, 50, 7-19. Chern, W.S., Ishibashi, K., Taniguchi, K., Tokoyama, Y., 2002. Analysis of the Food Consumption of Japanese Households. Food and Agricultural Organization, Rome. Department of Health, 2010. Health Survey for England 2008. Department of Health, http://www.dh.gov.uk/en/Publicationsandstatistics/PublishedSurvey/HealthSurveyForEngland/DH_632. Drewnowski, A., Specter, S.E., 2004. Poverty and obesity: The role of energy density and energy costs. American Journal of Clinical Nutrition, 79, 6-16. FAO, 2006. Livestock's Long Shadow: Environmental issues and options. Food and Agriculture Organization, Rome. FAO, 2010. Meat and Meat Production. Food and Agriculture Organization, Rome. http://www.fao.org/ag/againfo/themes/en/meat/home.html

17
Fox, N., Ward, K.J., 2008. You are what you eat? Vegetarianism, health and identity. Social Science & Medicine, 66, 2585-2595. Giovannucci, E., Rimm, E.B., Stampfer, M.J., Colditz, G.A., Ascherio, A., Willett, W.C., 1994. Intake of fat, meat, and fiber in relation to risk of colon cancer in men. Cancer Research, 54, 2390-2397. Gould, B.W., Lee, Y., Dong, D., Villareal, H.J., 2002. Household Size and Composition Impacts on Meat Demand in Mexico: A Censored Demand System Approach. Annual Meeting of the American Agricultural Economics Association. July 2002, Long Beach, California. Hu, F.B., Rimm, E.B., Stampfer, M.J., Ascherio, A., Spiegelman, D., Willett, C.W., 2000. Prospective study of major dietary patterns and risk of coronary heart disease in men. American Journal of Clinical Nutrition, 72, 912-921. Jabs J., Devine, C.M., Sobal, J., 1998. Model of the Process of Adopting Vegetarian Diets: Health Vegetarians and Ethical Vegetarians. Journal of Nutrition Education, 30, 196-202. James, W.P.T., Nelson, M., Ralph, A., Leather, S., 1997. Socioeconomic determinants of health: The contribution of nutrition to inequalities in health. British Medical Journal, 314, 1545-1549. Key, T.J., Apppleby, P.N., Spencer, E.A., Travis, R.C., Allen, N.E., Thorogood, M., Mann, J.I., 2009. Cancer incidence in British vegetarians. British Journal of Cancer, 101, 192-197. Key, T.J., Fraser, G.E., Thorogood, M., Appleby, P.N., Beral, V., Reeves, G., Burr, M.L., Chang-Claude, J., Frentzel-Beyme, R., Kuzma, J.W., Mann, J., McPherson, K., 1999. Mortality in vegetarians and nonvegetarians: detailed findings from a collaborative analysis of 5 prospective studies. The American Journal of Clinical Nutrition, 70, 516S-524S. Leahy, E., Lyons, S,. Tol, R.S.J., 2010a. An Estimate of the Number of Vegetarians in the World. Economic and Social Research Institute, Dublin. http://www.esri.ie/UserFiles/publications/WP340.pdf Leahy, E., Lyons, S,. Tol, R.S.J., 2010b. National Determinants of Vegetarianism. Economic and Social Research Institute, Dublin. http://www.esri.ie/publications/search_for_a_working_pape/search_results/view/index.xml?id=3022 Meat and Livestock Commission., 1996. The retail distribution of meat in the UK. Meat Demand Trends, May, 3-14. Nayga, R.M.Jr., 1995. Microdata Expenditure Analysis of Disaggregate Meat Products. Review of Agricultural Economics, 17, 275-285.
18
Newman, C., Henchion, M., Matthews, A., 2001. Infrequency of purchase and double-hurdle models of Irish households' meat expenditure. European Review of Agricultural Economics, 28, 393-419. Newman, C., Henchion, M., Matthews, A., Monnetz, J., 2002. Factors shaping expenditure on meat and prepared meals. Teagasc. http://www.teagasc.ie/research/reports/foodprocessing/4607/eopr4607.asp Panebianco, S.M., 2007. The Merits and Pitfalls of Vegetarianism. Diet and Nutrition, 3, 55-58. Pribis, P., Sabate, J., Fraser, G.E., 1999. Food consumption among vegetarian and nonvegetarian California Seventh-day Adventists, 1994–1996, American Journal of Clinical Nutrition, 70, 633S-634S. Rose, D.P., Boyar, A.P., Wynder, E.L., 1986. International comparisons of mortality rates for cancer of the breast, ovary, prostate, and colon, and per capita food consumption. Cancer, 58, 2363-2371. Sanjoaquin, M.A., Appleby, P.S., Thorogood, M., Mann, J.I., Key, T.J., 2004. Nutrition, lifestyle and colorectal cancer incidence: a prospective investigation of 10 998 vegetarians and non-vegetarians in the United Kingdom. British Journal of Cancer, 90, 118-121. Tonser, G.T., Olynk, N.J., 2010. Impacts of Animal Well-Being and Welfare Media on Meat Demand. Journal of Agricultural Economics, DOI: 10.1111/j.1477-9552.2010.00266.x. Worsley, A., Skrzypiec, G., 1997. Teenage vegetarianism: Beauty or the beast? Nutrition Research, 17, 391-404.
19
Table 1. Descriptive Statistics Dependent variables
Description Obs Mean Std. Dev. Min Max
vegetarian 1 if vegetarian, 0 if not 17,684 0.04 0.19 0 1 meatlevel level of meat consumption 17,684 4.46 1.73 0 12 Explanatory Variables
hhsize Size of household in which respondent lives
17,684 3.19 1.44 1 12
otherveg The number of other vegetarians living in the household
17,684 0.02 0.19 0 4
age Age of respondent 17,684 33.21 24.80 2 97 bmi Body mass index (kg/m2) of
respondent 15,667 23.89 6.33 9.88 65.83
fruitveg The number of portions of fruit and vegetables consumed per day
16,189 4.12 2.21 0 9
daysdrink The number of days a week respondent consumes alcohol
10,578 2.14 2.33 0 7
unitsday The number of units of alcohol consumed on the heaviest drinking day in previous week
6,896 6.31 6.11 0 73.50
smoker 1 if respondent smokes cigarettes or a pipe daily, 0 if not
10,605 0.27 0.44 0 1
adequateactivity 1 if respondent gets adequate exercise, 0 if not
17,684 0.32 0.47 0 1
ondiet 1 if child is trying to lose weight, 0 if not
4,138 0.24 0.43 0 1
illness 1 if respondent suffers from at least one long term illness, 0 if not
17,684 0.36 0.48 0 1
female 1 if female, 0 if male 17,684 0.53 0.50 0 1 Variable Description Freq % Geo type of dwelling unit urban_1 (reference category) Urban 14,141 79.96 urban_2 Town & fringe 1,691 9.56 urban_3 Village, hamlet and isolated
dwellings 1,852 10.47
Tenure tenure_1 Owned outright 4,180 23.69 tenure_2 (reference category) Mortgage holder 8,224 46.61 tenure_3 Share ownership scheme 97 0.55 tenure_4 Renting 5,007 28.38 tenure_5 Rent free 136 0.77 Region region_1 North East 1,101 6.23 region_2 North West 2,552 14.43 region_3 Yorkshire and Humber 1,920 10.86 region_4 East Midlands 1,656 9.36 region_5 West Midlands 1,702 9.62 region_6 East of England 1,986 11.23 region_7 London 2,056 11.63 region_8 (reference category) South East 2,872 16.24 region_9 South West 1,839 10.4

20
Variable Description Freq % Education level educlevel_1 Degree or higher 2,105 19.86 educlevel_2 Higher education below
degree 1,216 11.47
educlevel_3 A level 1,534 14.47 educlevel_4 O level 2,300 21.7 educlevel_5 Other 535 5.05 educlevel_6 Foreign educational
qualifications 193 1.82
educlevel_7 (reference category)
No educational qualifications
2,718 25.64
Economic status econstat_1 (reference category)
In employment 5,770 54.45
econstat_2 Unemployed 463 4.37 econstat_3 Retired 2,756 26.01 econstat_4 Other 1,607 15.17 Marital status maritalstat_1 Single 1,870 17.63 maritastat_2 (reference category)
Married 5,749 54.21
maritalstat_3 Civil Partnership 3 0.03 maritalstat_4 Separated 228 2.15 maritalstat_5 Divorced 744 7.02 maritalstat_6 Widowed 858 8.09 maritalstat_7 Cohabiting 1,153 10.87 Social status of the respondent
socialstat_1 Professional 546 5.15 socialstat_2 (reference category)
Managerial/technical 3,216 30.36
socialstat_3 Skilled non-manual 2,348 22.17 socialstat_4 Skilled-manual 1,684 15.9 socialstat_5 Semi-skilled manual 1,708 16.12 socialstat_6 Unskilled manual 518 4.89 socialstat_7 Armed forces 22 0.21 socialstat_9 Full time student 259 2.45 socialstat_10 Other 292 2.76 Social status of the household reference person socialHRP_1 Professional 1,247 7.08 socialHRP_2 (reference category)
Managerial/technical 6,383 36.22
socialHRP_3 Skilled non-manual 2,630 14.92 socialHRP_4 Skilled-manual 3,713 21.07 socialHRP_5 Semi-skilled manual 2,306 13.08 socialHRP_6 Unskilled manual 744 4.22 socialHRP_7 Armed forces 86 0.49 socialHRP_9 Full time student 67 0.38 socialHRP_10 Other 449 2.55 Number of employees in workplace workplace_1 1 or 2 448 4.94 workplace_2 3-24 2,971 32.75 workplace_3 25-499 4,028 44.41 workplace_4 500+ 1,624 17.9 Ethnicity White (reference category) White British, Irish or other 15,582 88.27
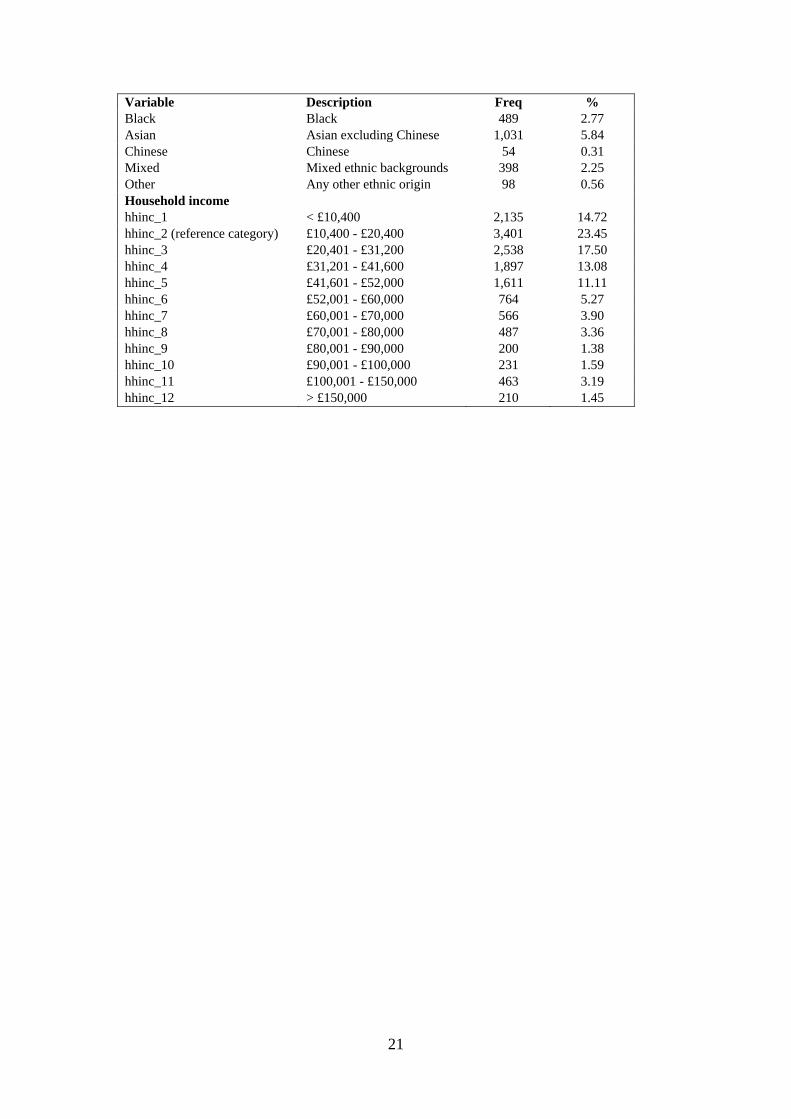
21
Variable Description Freq % Black Black 489 2.77 Asian Asian excluding Chinese 1,031 5.84 Chinese Chinese 54 0.31 Mixed Mixed ethnic backgrounds 398 2.25 Other Any other ethnic origin 98 0.56 Household income hhinc_1 < £10,400 2,135 14.72 hhinc_2 (reference category) £10,400 - £20,400 3,401 23.45 hhinc_3 £20,401 - £31,200 2,538 17.50 hhinc_4 £31,201 - £41,600 1,897 13.08 hhinc_5 £41,601 - £52,000 1,611 11.11 hhinc_6 £52,001 - £60,000 764 5.27 hhinc_7 £60,001 - £70,000 566 3.90 hhinc_8 £70,001 - £80,000 487 3.36 hhinc_9 £80,001 - £90,000 200 1.38 hhinc_10 £90,001 - £100,000 231 1.59 hhinc_11 £100,001 - £150,000 463 3.19 hhinc_12 > £150,000 210 1.45

22
Table 2: Determinants of vegetarianism among children Odds Ratio Std. Err. z P>|z| fruitveg 1.17 0.06 3.11 0.002*** ondiet 1.53 0.36 1.83 0.067* female 3.02 0.77 4.33 0*** asian 3.02 0.93 3.59 0*** socialHRP_5 1.64 0.47 1.74 0.082* hhinc_5 1.83 0.56 1.96 0.05** region_4 2.15 0.67 2.44 0.015** Number of obs 3394 LR chi2(7) 58.76 Prob > chi2 0 Pseudo R2 0.072 Pearson chi2(254) 231.37 Prob > chi2 0.8427
23
Table 3. Determinants of vegetarianism among adults Odds Ratio Std. Err. z P>|z| fruitveg 1.18 0.03 6.38 0*** adequateactivity 1.23 0.15 1.7 0.089* bmi 0.95 0.01 -3.85 0*** smoker 1.39 0.19 2.37 0.018** age 0.98 0 -3.72 0*** female 2.12 0.28 5.8 0*** asian 4.24 0.81 7.55 0*** workplace_2 1.66 0.37 2.25 0.024** region_3 0.6 0.15 -2.01 0.044** region_4 1.63 0.29 2.76 0.006*** region_7 1.98 0.31 4.41 0*** educlevel_1 1.95 0.26 5.04 0*** educlevel_2 1.46 0.27 2.01 0.044** maritalstat_5 1.42 0.3 1.66 0.097* maritalstat_7 1.48 0.25 2.37 0.018** hhsize 0.83 0.04 -3.53 0*** Number of obs 8163 LR chi2(16) 327.97 Prob > chi2 0 Pseudo R2 0.1192 Pearson chi2(8146) 8254.36 Prob > chi2 0.1975
24
Table 4. Factors influencing levels of meat consumption among children Odds Ratio Std. Err. z P>|z| asian 0.54 0.07 -5.06 0*** black 1.66 0.27 3.12 0.002*** chinese 3.56 1.73 2.62 0.009*** female 0.82 0.04 -3.68 0*** age 1.02 0.01 1.78 0.076* adequateactivity 1.14 0.07 2.2 0.028** fruitveg 0.98 0.01 -1.58 0.114 region_7 0.82 0.07 -2.17 0.03** hhinc_8 0.73 0.1 -2.17 0.03** hhinc_12 1.58 0.3 2.39 0.017** socialHRP_4 1.16 0.08 2.26 0.024** hhsize 1.06 0.03 2.19 0.029** Number of obs 4597 LR chi2(12) 95.61 Prob > chi2 0 Pseudo R2 0.0059 AIC 16104.8 1 BIC 6246.32

25
Table 5. Factors influencing levels of meat consumption among adults Odds Ratio Std. Err. z P>|z| unitsday 1.02 0 4.23 0*** daysdrink 1.03 0.01 2.48 0.013** bmi 1.02 0.01 4.06 0*** asian 0.36 0.09 -4.32 0*** black 1.5 0.35 1.72 0.086* mixedrace 1.92 0.51 2.45 0.014** female 0.87 0.05 -2.7 0.007*** region_9 0.84 0.07 -2.25 0.025** hhinc_11 1.27 0.18 1.72 0.085* educlevel_1 1.15 0.08 1.93 0.054* educlevel_2 1.3 0.11 3.05 0.002*** educlevel_3 1.46 0.12 4.47 0*** educlevel_4 1.28 0.1 3.32 0.001*** maritalstat_1 0.77 0.06 -3.3 0.001*** maritalstat_5 0.67 0.07 -3.86 0*** maritalstat_7 0.87 0.07 -1.82 0.069* tenure_4 0.84 0.06 -2.62 0.009*** hhsize 1.17 0.03 7.34 0*** Number of obs 5264 LR chi2(18) 245.01 Prob > chi2 0 Pseudo R2 0.0139 AIC 17407.51 BIC 17591.43

26
Appendix Figure A1. Vegetarianism over time in the UK
0.0%
0.5%
1.0%
1.5%
2.0%
2.5%
3.0%
3.5%
1960 1965 1970 1975 1980 1985 1990 1995 2000 2005 2010
All-vegetarian householdsVegetarians
27
Figure A2. Vegetarianism across income levels: Children
0%
1%
2%
3%
4%
5%
1 2 3 4 5 6 7 8 9 10 11 12
Household income level
% o
f veg
etar
ians
0%
5%
10%
15%
20%
25%
% o
f hou
seho
lds a
t eac
h in
com
e le
vel
% vegetarian children % households at that income level

28
Figure A3. Vegetarianism across income levels: Adults
0%
1%
2%
3%
4%
5%
6%
7%
1 2 3 4 5 6 7 8 9 10 11 12
Household income level
% o
f veg
etar
ians
0%
5%
10%
15%
20%
25%
% o
f hou
seho
lds a
t eac
h in
com
e le
vel
% vegetarian children % households at that income level
29
Figure A4. Meat consumption frequency across income levels: Children
0
1
2
3
4
5
1 2 3 4 5 6 7 8 9 10 11 12
Household income level
Mea
t con
sum
ptio
n le
vel
0%
5%
10%
15%
20%
25%
% o
f hou
seho
lds a
t eac
h in
com
e le
vel
Meat consumption level % households at that income level
30
Figure A5. Meat consumption frequency across income levels: Adults
0
1
2
3
4
5
6
1 2 3 4 5 6 7 8 9 10 11 12
Household income level
Mea
t con
sum
ptio
n le
vel
0%
5%
10%
15%
20%
25%
% o
f hou
seho
lds a
t eac
h in
com
e le
vel
Meat consumption level % households at that income level
31
Year Number Title/Author(s) ESRI Authors/Co-authors Italicised
2010 359 From Data to Policy Analysis: Tax-Benefit Modelling
using SILC 2008 Tim Callan, Claire Keane, John R. Walsh and Marguerita Lane
358 Towards a Better and Sustainable Health Care System – Resource Allocation and Financing Issues for Ireland Frances Ruane
357 An Estimate of the Value of Lost Load for Ireland Eimear Leahy and Richard S.J. Tol 356 Public Policy Towards the Sale of State Assets in
Troubled Times: Lessons from the Irish Experience Paul K Gorecki, Sean Lyons and Richard S. J. Tol 355 The Impact of Ireland’s Recession on the Labour Market
Outcomes of its Immigrants Alan Barrett and Elish Kelly 354 Research and Policy Making Frances Ruane 353 Market Regulation and Competition; Law in Conflict: A
View from Ireland, Implications of the Panda Judgment Philip Andrews and Paul K Gorecki 352 Designing a property tax without property values:
Analysis in the case of Ireland Karen Mayor, Seán Lyons and Richard S.J. Tol 351 Civil War, Climate Change and Development: A Scenario
Study for Sub-Saharan Africa Conor Devitt and Richard S.J. Tol 350 Regulating Knowledge Monopolies: The Case of the IPCC Richard S.J. Tol 349 The Impact of Tax Reform on New Car Purchases in
Ireland Hugh Hennessy and Richard S.J. Tol 348 Climate Policy under Fat-Tailed Risk:
An Application of FUND David Anthoff and Richard S.J. Tol 347 Corporate Expenditure on Environmental Protection
32
Stefanie A. Haller and Liam Murphy 346 Female Labour Supply and Divorce: New Evidence from
Ireland Olivier Bargain, Libertad González, Claire Keane and
Berkay Özcan 345 A Statistical Profiling Model of Long-Term Unemployment
Risk in Ireland Philip J. O’Connell, Seamus McGuinness, Elish Kelly 344 The Economic Crisis, Public Sector Pay, and the Income
Distribution Tim Callan, Brian Nolan (UCD) and John Walsh 343 Estimating the Impact of Access Conditions on
Service Quality in Post Gregory Swinand, Conor O’Toole and Seán Lyons 342 The Impact of Climate Policy on Private Car Ownership in
Ireland Hugh Hennessy and Richard S.J. Tol 341 National Determinants of Vegetarianism Eimear Leahy, Seán Lyons and Richard S.J. Tol 340 An Estimate of the Number of Vegetarians in the World Eimear Leahy, Seán Lyons and Richard S.J. Tol 339 International Migration in Ireland, 2009 Philip J O’Connell and Corona Joyce 338 The Euro Through the Looking-Glass:
Perceived Inflation Following the 2002 Currency Changeover
Pete Lunn and David Duffy 337 Returning to the Question of a Wage Premium for
Returning Migrants Alan Barrett and Jean Goggin 2009 336 What Determines the Location Choice of Multinational
Firms in the ICT Sector? Iulia Siedschlag, Xiaoheng Zhang, Donal Smith 335 Cost-benefit analysis of the introduction of weight-based
charges for domestic waste – West Cork’s experience Sue Scott and Dorothy Watson 334 The Likely Economic Impact of Increasing Investment in
Wind on the Island of Ireland Conor Devitt, Seán Diffney, John Fitz Gerald, Seán Lyons
33
and Laura Malaguzzi Valeri 333 Estimating Historical Landfill Quantities to Predict
Methane Emissions Seán Lyons, Liam Murphy and Richard S.J. Tol 332 International Climate Policy and Regional Welfare
Weights Daiju Narita, Richard S. J. Tol, and David Anthoff 331 A Hedonic Analysis of the Value of Parks and
Green Spaces in the Dublin Area Karen Mayor, Seán Lyons, David Duffy and Richard S.J.
Tol 330 Measuring International Technology Spillovers and
Progress Towards the European Research Area Iulia Siedschlag 329 Climate Policy and Corporate Behaviour Nicola Commins, Seán Lyons, Marc Schiffbauer, and
Richard S.J. Tol 328 The Association Between Income Inequality and Mental
Health: Social Cohesion or Social Infrastructure Richard Layte and Bertrand Maître 327 A Computational Theory of Exchange:
Willingness to pay, willingness to accept and the endowment effect
Pete Lunn and Mary Lunn 326 Fiscal Policy for Recovery John Fitz Gerald 325 The EU 20/20/2020 Targets: An Overview of the EMF22
Assessment Christoph Böhringer, Thomas F. Rutherford, and Richard
S.J. Tol 324 Counting Only the Hits? The Risk of Underestimating the
Costs of Stringent Climate Policy Massimo Tavoni, Richard S.J. Tol 323 International Cooperation on Climate Change Adaptation
from an Economic Perspective Kelly C. de Bruin, Rob B. Dellink and Richard S.J. Tol 322 What Role for Property Taxes in Ireland? T. Callan, C. Keane and J.R. Walsh 321 The Public-Private Sector Pay Gap in Ireland: What Lies

34
Beneath? Elish Kelly, Seamus McGuinness, Philip O’Connell 320 A Code of Practice for Grocery Goods Undertakings and
An Ombudsman: How to Do a Lot of Harm by Trying to Do a Little Good
Paul K Gorecki 319 Negative Equity in the Irish Housing Market David Duffy 318 Estimating the Impact of Immigration on Wages in
Ireland Alan Barrett, Adele Bergin and Elish Kelly 317 Assessing the Impact of Wage Bargaining and Worker
Preferences on the Gender Pay Gap in Ireland Using the National Employment Survey 2003
Seamus McGuinness, Elish Kelly, Philip O’Connell, Tim Callan
316 Mismatch in the Graduate Labour Market Among
Immigrants and Second-Generation Ethnic Minority Groups
Delma Byrne and Seamus McGuinness 315 Managing Housing Bubbles in Regional Economies under
EMU: Ireland and Spain Thomas Conefrey and John Fitz Gerald 314 Job Mismatches and Labour Market Outcomes Kostas Mavromaras, Seamus McGuinness, Nigel O’Leary,
Peter Sloane and Yin King Fok 313 Immigrants and Employer-provided Training Alan Barrett, Séamus McGuinness, Martin O’Brien
and Philip O’Connell 312 Did the Celtic Tiger Decrease Socio-Economic
Differentials in Perinatal Mortality in Ireland? Richard Layte and Barbara Clyne 311 Exploring International Differences in Rates of Return to
Education: Evidence from EU SILC Maria A. Davia, Seamus McGuinness and Philip, J.
O’Connell 310 Car Ownership and Mode of Transport to Work in Ireland Nicola Commins and Anne Nolan 309 Recent Trends in the Caesarean Section Rate in Ireland
1999-2006

35
Aoife Brick and Richard Layte 308 Price Inflation and Income Distribution Anne Jennings, Seán Lyons and Richard S.J. Tol 307 Overskilling Dynamics and Education Pathways Kostas Mavromaras, Seamus McGuinness, Yin King Fok 306 What Determines the Attractiveness of the European
Union to the Location of R&D Multinational Firms? Iulia Siedschlag, Donal Smith, Camelia Turcu, Xiaoheng
Zhang 305 Do Foreign Mergers and Acquisitions Boost Firm
Productivity? Marc Schiffbauer, Iulia Siedschlag, Frances Ruane 304 Inclusion or Diversion in Higher Education in the
Republic of Ireland? Delma Byrne 303 Welfare Regime and Social Class Variation in Poverty and
Economic Vulnerability in Europe: An Analysis of EU-SILC Christopher T. Whelan and Bertrand Maître 302 Understanding the Socio-Economic Distribution and
Consequences of Patterns of Multiple Deprivation: An Application of Self-Organising Maps
Christopher T. Whelan, Mario Lucchini, Maurizio Pisati and Bertrand Maître
301 Estimating the Impact of Metro North Edgar Morgenroth 300 Explaining Structural Change in Cardiovascular Mortality
in Ireland 1995-2005: A Time Series Analysis Richard Layte, Sinead O’Hara and Kathleen Bennett 299 EU Climate Change Policy 2013-2020: Using the Clean
Development Mechanism More Effectively Paul K Gorecki, Seán Lyons and Richard S.J. Tol 298 Irish Public Capital Spending in a Recession Edgar Morgenroth 297 Exporting and Ownership Contributions to Irish
Manufacturing Productivity Growth Anne Marie Gleeson, Frances Ruane 296 Eligibility for Free Primary Care and Avoidable
Hospitalisations in Ireland Anne Nolan

36
295 Managing Household Waste in Ireland:
Behavioural Parameters and Policy Options John Curtis, Seán Lyons and Abigail O’Callaghan-Platt 294 Labour Market Mismatch Among UK Graduates;
An Analysis Using REFLEX Data Seamus McGuinness and Peter J. Sloane 293 Towards Regional Environmental Accounts for Ireland Richard S.J. Tol , Nicola Commins, Niamh Crilly, Sean
Lyons and Edgar Morgenroth 292 EU Climate Change Policy 2013-2020: Thoughts on
Property Rights and Market Choices Paul K. Gorecki, Sean Lyons and Richard S.J. Tol 291 Measuring House Price Change David Duffy 290 Intra-and Extra-Union Flexibility in Meeting the European
Union’s Emission Reduction Targets Richard S.J. Tol 289 The Determinants and Effects of Training at Work:
Bringing the Workplace Back In Philip J. O’Connell and Delma Byrne 288 Climate Feedbacks on the Terrestrial Biosphere and the
Economics of Climate Policy: An Application of FUND Richard S.J. Tol 287 The Behaviour of the Irish Economy: Insights from the
HERMES macro-economic model Adele Bergin, Thomas Conefrey, John FitzGerald and Ide
Kearney 286 Mapping Patterns of Multiple Deprivation Using
Self-Organising Maps: An Application to EU-SILC Data for Ireland
Maurizio Pisati, Christopher T. Whelan, Mario Lucchini and Bertrand Maître
285 The Feasibility of Low Concentration Targets:
An Application of FUND Richard S.J. Tol 284 Policy Options to Reduce Ireland’s GHG Emissions
Instrument choice: the pros and cons of alternative policy instruments
Thomas Legge and Sue Scott

37
283 Accounting for Taste: An Examination of Socioeconomic Gradients in Attendance at Arts Events
Pete Lunn and Elish Kelly 282 The Economic Impact of Ocean Acidification on Coral
Reefs Luke M. Brander, Katrin Rehdanz, Richard S.J. Tol, and
Pieter J.H. van Beukering 281 Assessing the impact of biodiversity on tourism flows: A
model for tourist behaviour and its policy implications Giulia Macagno, Maria Loureiro, Paulo A.L.D. Nunes and
Richard S.J. Tol 280 Advertising to boost energy efficiency: the Power of One
campaign and natural gas consumption Seán Diffney, Seán Lyons and Laura Malaguzzi Valeri 279 International Transmission of Business Cycles Between
Ireland and its Trading Partners Jean Goggin and Iulia Siedschlag 278 Optimal Global Dynamic Carbon Taxation David Anthoff 277 Energy Use and Appliance Ownership in Ireland Eimear Leahy and Seán Lyons 276 Discounting for Climate Change David Anthoff, Richard S.J. Tol and Gary W. Yohe 275 Projecting the Future Numbers of Migrant Workers in the
Health and Social Care Sectors in Ireland Alan Barrett and Anna Rust 274 Economic Costs of Extratropical Storms under Climate
Change: An application of FUND Daiju Narita, Richard S.J. Tol, David Anthoff 273 The Macro-Economic Impact of Changing the Rate of
Corporation Tax Thomas Conefrey and John D. Fitz Gerald 272 The Games We Used to Play
An Application of Survival Analysis to the Sporting Life-course
Pete Lunn 2008 271 Exploring the Economic Geography of Ireland Edgar Morgenroth
38
270 Benchmarking, Social Partnership and Higher Remuneration: Wage Settling Institutions and the Public-Private Sector Wage Gap in Ireland
Elish Kelly, Seamus McGuinness, Philip O’Connell 269 A Dynamic Analysis of Household Car Ownership in
Ireland Anne Nolan 268 The Determinants of Mode of Transport to Work in the
Greater Dublin Area Nicola Commins and Anne Nolan 267 Resonances from Economic Development for Current
Economic Policymaking Frances Ruane 266 The Impact of Wage Bargaining Regime on Firm-Level
Competitiveness and Wage Inequality: The Case of Ireland
Seamus McGuinness, Elish Kelly and Philip O’Connell 265 Poverty in Ireland in Comparative European Perspective Christopher T. Whelan and Bertrand Maître 264 A Hedonic Analysis of the Value of Rail Transport in the
Greater Dublin Area Karen Mayor, Seán Lyons, David Duffy and Richard S.J.
Tol 263 Comparing Poverty Indicators in an Enlarged EU Christopher T. Whelan and Bertrand Maître 262 Fuel Poverty in Ireland: Extent,
Affected Groups and Policy Issues Sue Scott, Seán Lyons, Claire Keane, Donal McCarthy
and Richard S.J. Tol 261 The Misperception of Inflation by Irish Consumers David Duffy and Pete Lunn 260 The Direct Impact of Climate Change on Regional Labour
Productivity Tord Kjellstrom, R Sari Kovats, Simon J. Lloyd, Tom Holt,
Richard S.J. Tol 259 Damage Costs of Climate Change through Intensification
of Tropical Cyclone Activities: An Application of FUND
Daiju Narita, Richard S. J. Tol and David Anthoff 258 Are Over-educated People Insiders or Outsiders?
39
A Case of Job Search Methods and Over-education in UK Aleksander Kucel, Delma Byrne 257 Metrics for Aggregating the Climate Effect of Different
Emissions: A Unifying Framework Richard S.J. Tol, Terje K. Berntsen, Brian C. O’Neill, Jan
S. Fuglestvedt, Keith P. Shine, Yves Balkanski and Laszlo Makra
256 Intra-Union Flexibility of Non-ETS Emission Reduction
Obligations in the European Union Richard S.J. Tol 255 The Economic Impact of Climate Change Richard S.J. Tol 254 Measuring International Inequity Aversion Richard S.J. Tol 253 Using a Census to Assess the Reliability of a National
Household Survey for Migration Research: The Case of Ireland
Alan Barrett and Elish Kelly 252 Risk Aversion, Time Preference, and the Social Cost of
Carbon David Anthoff, Richard S.J. Tol and Gary W. Yohe 251 The Impact of a Carbon Tax on Economic Growth and
Carbon Dioxide Emissions in Ireland Thomas Conefrey, John D. Fitz Gerald, Laura Malaguzzi
Valeri and Richard S.J. Tol 250 The Distributional Implications of a Carbon Tax in
Ireland Tim Callan, Sean Lyons, Susan Scott, Richard S.J. Tol
and Stefano Verde 249 Measuring Material Deprivation in the Enlarged EU Christopher T. Whelan, Brian Nolan and Bertrand Maître 248 Marginal Abatement Costs on Carbon-Dioxide Emissions:
A Meta-Analysis Onno Kuik, Luke Brander and Richard S.J. Tol 247 Incorporating GHG Emission Costs in the Economic
Appraisal of Projects Supported by State Development Agencies
Richard S.J. Tol and Seán Lyons 246 A Carton Tax for Ireland Richard S.J. Tol, Tim Callan, Thomas Conefrey, John D.

40
Fitz Gerald, Seán Lyons, Laura Malaguzzi Valeri and Susan Scott
245 Non-cash Benefits and the Distribution of Economic
Welfare Tim Callan and Claire Keane 244 Scenarios of Carbon Dioxide Emissions from Aviation Karen Mayor and Richard S.J. Tol 243 The Effect of the Euro on Export Patterns: Empirical
Evidence from Industry Data Gavin Murphy and Iulia Siedschlag 242 The Economic Returns to Field of Study and
Competencies Among Higher Education Graduates in Ireland
Elish Kelly, Philip O’Connell and Emer Smyth 241 European Climate Policy and Aviation Emissions Karen Mayor and Richard S.J. Tol 240 Aviation and the Environment in the Context of the EU-
US Open Skies Agreement Karen Mayor and Richard S.J. Tol 239 Yuppie Kvetch? Work-life Conflict and Social Class in
Western Europe Frances McGinnity and Emma Calvert 238 Immigrants and Welfare Programmes: Exploring the
Interactions between Immigrant Characteristics, Immigrant Welfare Dependence and Welfare Policy
Alan Barrett and Yvonne McCarthy 237 How Local is Hospital Treatment? An Exploratory
Analysis of Public/Private Variation in Location of Treatment in Irish Acute Public Hospitals
Jacqueline O’Reilly and Miriam M. Wiley 236 The Immigrant Earnings Disadvantage Across the
Earnings and Skills Distributions: The Case of Immigrants from the EU’s New Member States in Ireland
Alan Barrett, Seamus McGuinness and Martin O’Brien 235 Europeanisation of Inequality and European Reference
Groups Christopher T. Whelan and Bertrand Maître 234 Managing Capital Flows: Experiences from Central and
Eastern Europe Jürgen von Hagen and Iulia Siedschlag
41
233 ICT Diffusion, Innovation Systems, Globalisation and
Regional Economic Dynamics: Theory and Empirical Evidence
Charlie Karlsson, Gunther Maier, Michaela Trippl, Iulia Siedschlag, Robert Owen and Gavin Murphy
232 Welfare and Competition Effects of Electricity
Interconnection between Great Britain and Ireland Laura Malaguzzi Valeri 231 Is FDI into China Crowding Out the FDI into the
European Union? Laura Resmini and Iulia Siedschlag 230 Estimating the Economic Cost of Disability in Ireland John Cullinan, Brenda Gannon and Seán Lyons 229 Controlling the Cost of Controlling the Climate: The Irish
Government’s Climate Change Strategy Colm McCarthy, Sue Scott 228 The Impact of Climate Change on the Balanced-Growth-
Equivalent: An Application of FUND David Anthoff, Richard S.J. Tol 227 Changing Returns to Education During a Boom? The
Case of Ireland Seamus McGuinness, Frances McGinnity, Philip O’Connell 226 ‘New’ and ‘Old’ Social Risks: Life Cycle and Social Class
Perspectives on Social Exclusion in Ireland Christopher T. Whelan and Bertrand Maître 225 The Climate Preferences of Irish Tourists by Purpose of
Travel Seán Lyons, Karen Mayor and Richard S.J. Tol 224 A Hirsch Measure for the Quality of Research
Supervision, and an Illustration with Trade Economists Frances P. Ruane and Richard S.J. Tol 223 Environmental Accounts for the Republic of Ireland:
1990-2005 Seán Lyons, Karen Mayor and Richard S.J. Tol 2007 222 Assessing Vulnerability of Selected Sectors under
Environmental Tax Reform: The issue of pricing power J. Fitz Gerald, M. Keeney and S. Scott 221 Climate Policy Versus Development Aid
Richard S.J. Tol
42
220 Exports and Productivity – Comparable Evidence for 14
Countries The International Study Group on Exports and
Productivity 219 Energy-Using Appliances and Energy-Saving Features:
Determinants of Ownership in Ireland Joe O’Doherty, Seán Lyons and Richard S.J. Tol 218 The Public/Private Mix in Irish Acute Public Hospitals:
Trends and Implications Jacqueline O’Reilly and Miriam M. Wiley
217 Regret About the Timing of First Sexual Intercourse: The
Role of Age and Context Richard Layte, Hannah McGee
216 Determinants of Water Connection Type and Ownership
of Water-Using Appliances in Ireland Joe O’Doherty, Seán Lyons and Richard S.J. Tol
215 Unemployment – Stage or Stigma?
Being Unemployed During an Economic Boom Emer Smyth
214 The Value of Lost Load Richard S.J. Tol 213 Adolescents’ Educational Attainment and School
Experiences in Contemporary Ireland Merike Darmody, Selina McCoy, Emer Smyth
212 Acting Up or Opting Out? Truancy in Irish Secondary
Schools Merike Darmody, Emer Smyth and Selina McCoy
211 Where do MNEs Expand Production: Location Choices of
the Pharmaceutical Industry in Europe after 1992 Frances P. Ruane, Xiaoheng Zhang
210 Holiday Destinations: Understanding the Travel Choices
of Irish Tourists Seán Lyons, Karen Mayor and Richard S.J. Tol
209 The Effectiveness of Competition Policy and the Price-
Cost Margin: Evidence from Panel Data Patrick McCloughan, Seán Lyons and William Batt
208 Tax Structure and Female Labour Market Participation:
Evidence from Ireland Tim Callan, A. Van Soest, J.R. Walsh

43