Embed Size (px)
Citation preview

ViDX: Visual Diagnostics of Assembly Line Performance in
Smart Factories Panpan Xu, Honghui
Mei, Liu Ren, and Wei Chen
Bosch Research North America, Zhejiang University. 2016
1

Cybersyn, Chile 1971–1973 Distributed decision support system designed by British operations scientist Stafford Beer.
● An operations room,
● Economic simulator,
● Custom software to check factory performance,
● Using national network of telex.
Cybersyn opsroom image credit Gui Bonsiepe
2

● Industrial processes
Manufacturing, Process control, power generation, fabrication.
● Infrastructure processes
Oil and gas pipelines, electrical power transmission ,water treatment.
● Facility processes
Monitor and control heating, ventilation air conditioning systems (HVAC),and energy consumption.
SCADA: Supervisory control and data acquisition
http://www.promotic.eu
3

Industry 4.0
credit "Christoph Roser at http://www.allaboutlean.com
4

Every second matters! Cisco $1594 per second
Samsung $1540 per second
Nokia $941 per second
Ford — Kansas City Assembly Plant, Claycomo, MO
460,338 cars per year
Hyundai — Hyundai Motor Manufacturing Alabama, Montgomery, AL
342,162 cars per year
Nissan — Nissan North America, Smyrna, TN
333,392 cars per year
1 year = 525,600 minute
http://www.automobilemag.com/ www.businessinsider.com/visualizing-how-much-big-tech-companies-make-2014-4
5

Why performance monitoring? ● TPM:Temporal
productive maintenance
● OEE: Overall equipment effectiveness
6

Gantt chart Gantt charts illustrate the start and finish dates of the terminal elements and summary elements of a project.
Photo courtesy: dreamfactory.com
7
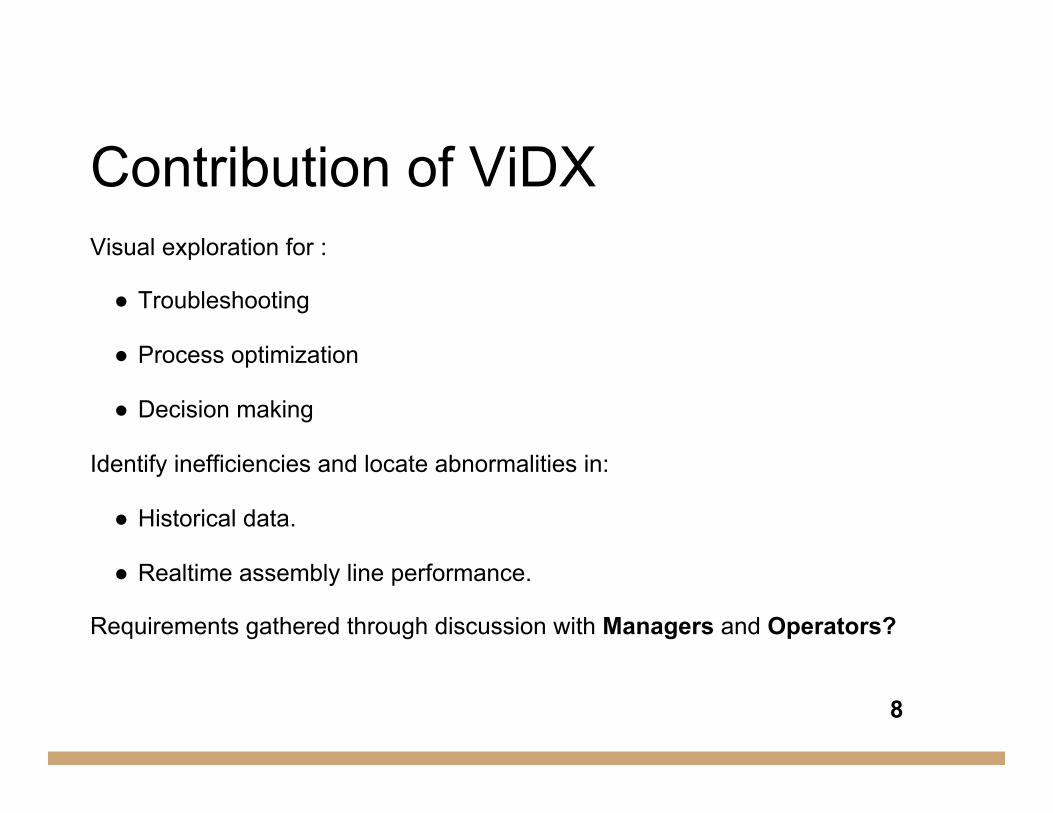
Contribution of ViDX Visual exploration for :
● Troubleshooting
● Process optimization
● Decision making
Identify inefficiencies and locate abnormalities in:
● Historical data.
● Realtime assembly line performance.
Requirements gathered through discussion with Managers and Operators?
8

REQUIREMENTS FOR HISTORICAL DATA
R1: Facilitate the detection of abnormal processes.
R2: Inefficiencies and troubleshooting.
R3: Engaging users to detect outlier process interactively.
R4: Support predictive analysis.
9

REQUIREMENTS FOR REAL-TIME SYSTEM
R5: Highlight abnormalities in real time.
R6: Visual metaphors.
R7: Interactive exploration of large amount of process data (thousands of products everyday).
R8: Visually indicating the problematic components in 3D model!!
10 10

Assembly line as a directed acyclic graph (DAG)
11
No error! Quality Control! How about repeating operations

12

Extended Marey’s graph
1885 as a visual depiction of train schedules.
● Train speeds, ● Dwell times, ● Directions of travel, ● Service frequency, ● Stop spacing
13
Time Distance b/w stations

Anomaly detection
1. Steak of efficient process
14
2. Halt of entire assembly line
3. Partial halt of assembly line

Quantiles brush and Sample brush Interactive outlier detection
15

Aggregation
16
Visualizing larger number of processes in parallel coordinates [Munzner, Tamara. Visualization analysis and design. CRC Press, 2014.pp 165]

System architecture and implementation
17

Case study Detect inefficiencies and troubleshooting.
● Schedule break.
● Stop and restart for a few times before operating smoothly.
18

Case study
● Several products were postponed.
● Other products have to wait.
19

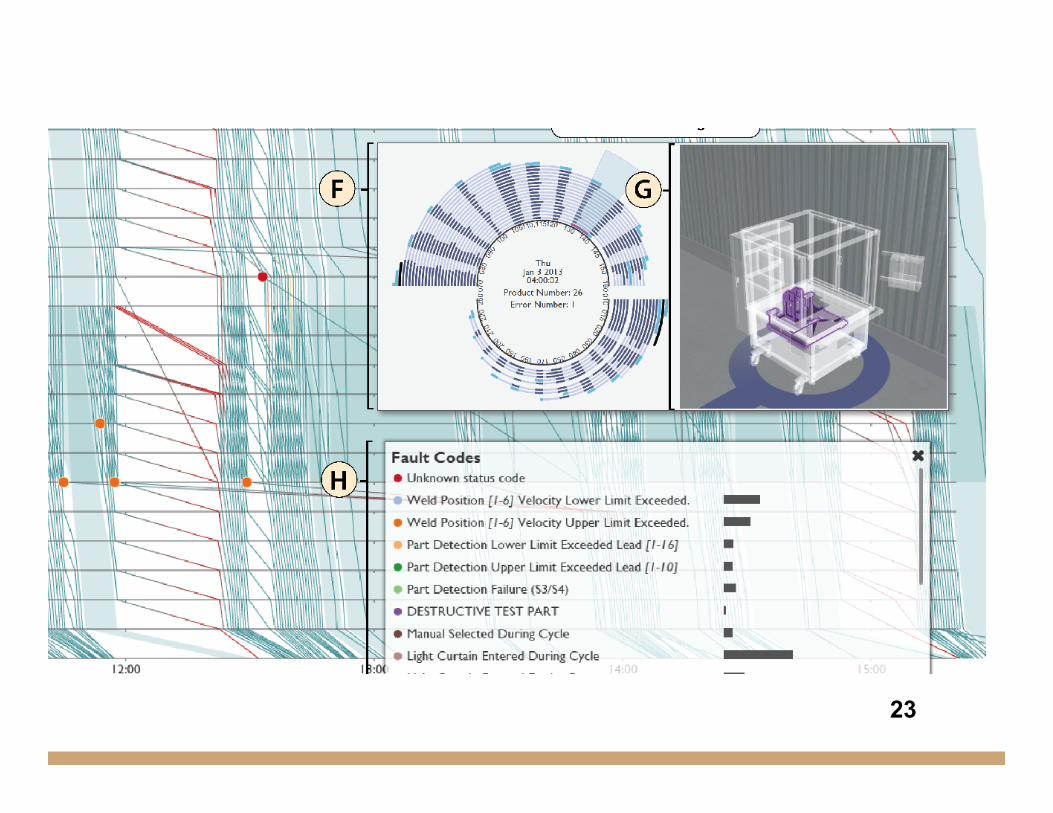
Fault detection
20

Real-time monitoring Radial graph proposed by
target users.
Users asked for three layers of rotating concentric circles.
21
1. Ongoing process (light blue) 2. Length encode the time to
finish the process 3. Fault occurs
Not effective
New design

Real time performance with radial graph
22
23

What: Data ● Table of workstations and product information: many value attributes. E.g Serial time values, Error and workstation’s DAG.
Why: Task
● Find trends, outliers, extreme, exploration and anomaly detection.
How : Encode
● Marey’s graph and parallel layouts: horizontal spatial position used to express time on each station. Vertical traces shows the products.
● Radial layout: Line length.
How: Reduce
● Item aggregation.
● Filtering.
Scale
Dozens along vertical axis (Workstations) and thousands to millions?! polylines (products).
24
Limitations ● Data scalability:
Site managers are willing to immediately know the abnormalities in each day in calendar visualization
● Longer time span in Marey’s graph:
In displays with limited width, traces will become vertical lines
● Subprocess and parallel processes are overlaid
Increasing the complexity of manufacturing process can cause visual clutter.
25
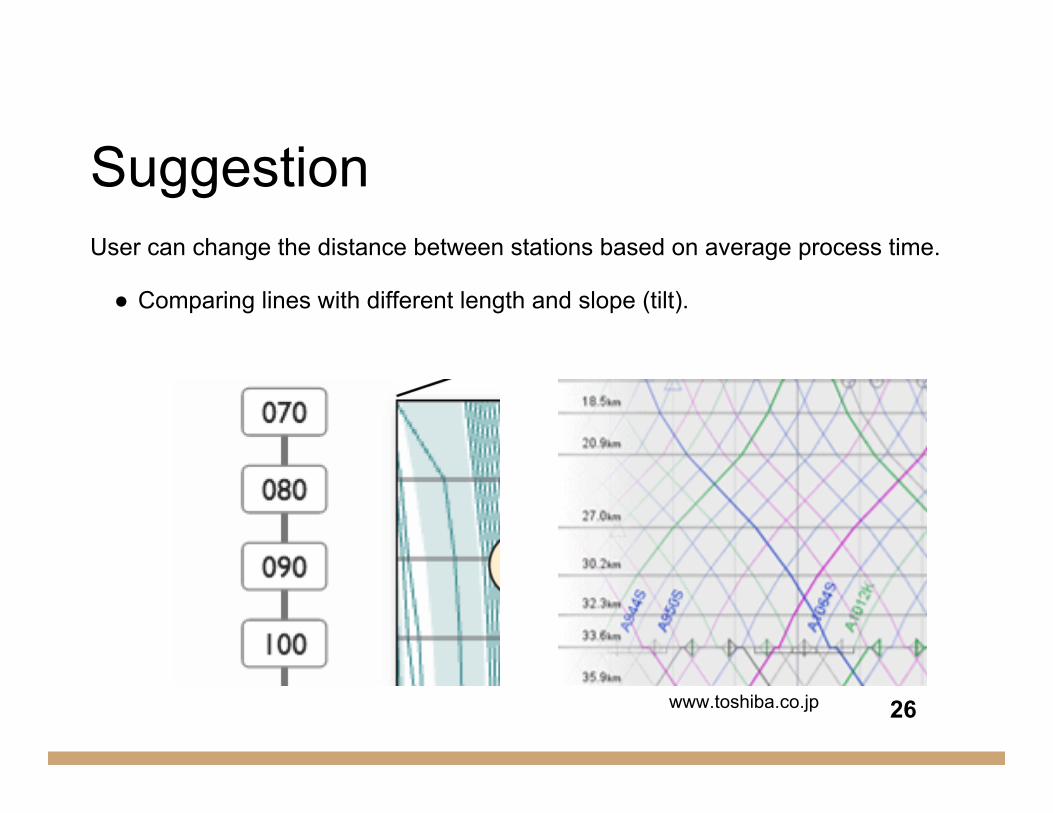
Suggestion User can change the distance between stations based on average process time.
● Comparing lines with different length and slope (tilt).
www.toshiba.co.jp 26

Critiques v Every operation is trackable not every product.
There is no jump in production line and product will be stored in case of failure. FIFO system can cause overall delay and disables abnormalities detection techniques.
27 27

Critiques The rationale behind using the radial graph is not clear!Why not rectilinear.Maybe to show the cyclic pattern!!!
v Divided into same size sectors in radial graph.
v The angle channel is less accurately perceived than rectilinear spatial position channel. [Munzner, Tamara. Visualization analysis and design. CRC Press, 2014.pp 166]
28
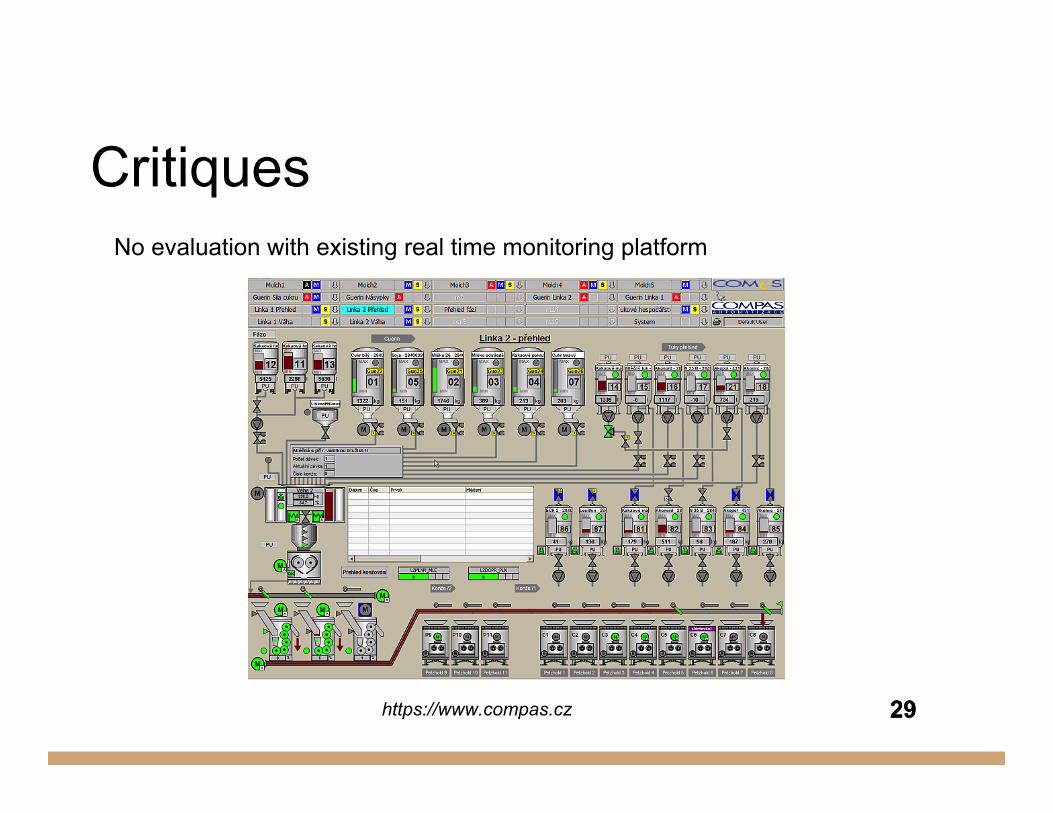
Critiques No evaluation with existing real time monitoring platform
29 https://www.compas.cz 29

Conclusion q Application of Marey’s graph in this domain was very effective.
q Two anomaly detection processes were suggested for outlier detection.
q System was tested with real data and they ran case studies for both historical data and real-time data.
q User interviews shows promising results but no evaluation.
30 30

Future directions 1. Deployment in real production line
2. Improve scalability
3. The occurrence of outliers in composite events
My suggestion:
• Extend the visualization to group or uncountable products
• Add indicators for sensors and their values in real time system and controllability for stations
31