Embed Size (px)
Citation preview

Video Surveillance Event
Detection Track
The TRECVID 2009 Evaluation
Jonathan Fiscus, Martial Michel,
John Garofolo, Paul Over
NIST
Heather Simpson, Stephanie Strassel
LDC
VACEVACEVideo Analysis
Content Extraction
Science and Technology Directorate
Motivation
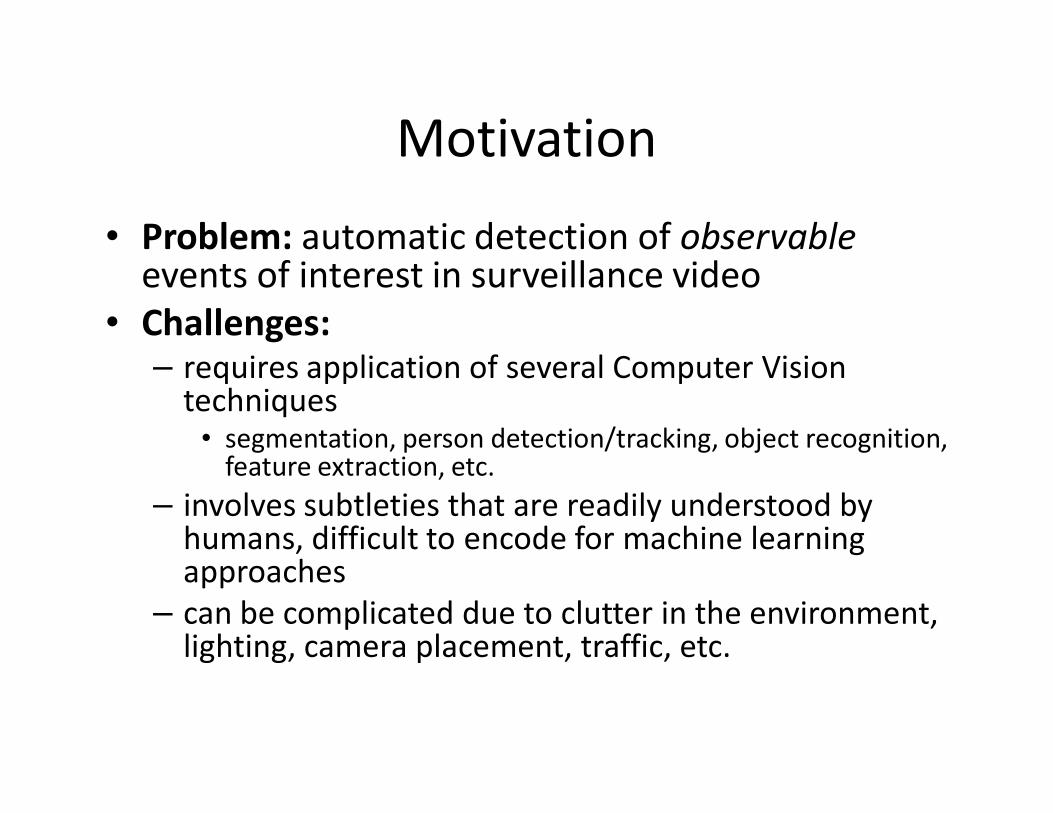
• Problem: automatic detection of observable
events of interest in surveillance video
• Challenges: – requires application of several Computer Vision
techniques• segmentation, person detection/tracking, object recognition,
feature extraction, etc.
– involves subtleties that are readily understood by humans, difficult to encode for machine learning approaches
– can be complicated due to clutter in the environment, lighting, camera placement, traffic, etc.
Evaluation Source Data
3
2
4
1
5
32
5
1
4
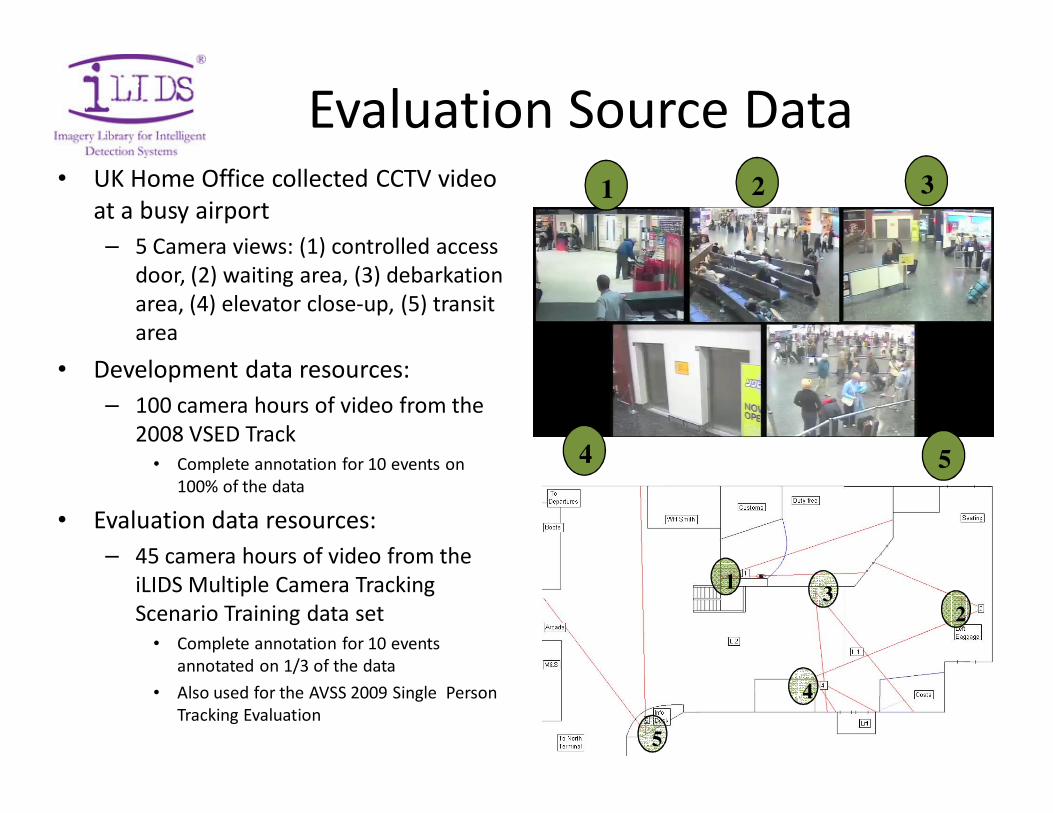
• UK Home Office collected CCTV video
at a busy airport
– 5 Camera views: (1) controlled access
door, (2) waiting area, (3) debarkation
area, (4) elevator close-up, (5) transit
area
• Development data resources:
– 100 camera hours of video from the
2008 VSED Track
• Complete annotation for 10 events on
100% of the data
• Evaluation data resources:
– 45 camera hours of video from the
iLIDS Multiple Camera Tracking
Scenario Training data set
• Complete annotation for 10 events
annotated on 1/3 of the data
• Also used for the AVSS 2009 Single Person
Tracking Evaluation

TRECVID VSED
Retrospective Event Detection
• Task:
– Given a textual description of an observable event of
interest in the airport surveillance domain, configure a system to detect all occurrences of the event
– Identify each event observation by:
• The temporal extent
• A detection score indicating the system’s confidence that
the event occurred
• A binary decision on the detection score optimizing
performance for the primary metric
TRECVID
VSED Freestyle Analysis
• Goal is to support innovation in ways not
anticipated by the retrospective task
• Freestyle task includes:
– rationale
– clear definition of the task
– performance measures
– reference annotations
– baseline system implementation

Event Annotation Guidelines
• Jointly developed by NIST, Linguistic Data Consortium
(LDC), Computer Vision Community
– Event Definitions left minimal to capture human intuitions
• Updates from 2008 guidelines :
– Based on annotation questions from 2008 annotation
– End Time Rule :
• If Event End Time = a person exiting the frame boundary, frame for end time should be the earliest frame when their body and any objects they are carrying (e.g. rolling luggage) have passed out of the frame. If luggage remains in the frame not moving, can assume person left the luggage and tag at person leaving the frame.
– People Meet/Split Up rules:
• If people leave a group but do not leave the frame, the re-merging of those people do not qualify as PeopleMeet
• If a group is standing near the edge of the frame, people are briefly occluded by frame boundary but under RI rule have not left the group, that is not PeopleSplitUp
– Some specific case examples added to Annotator guidelines

Annotation Tool and Data Processing
• No changes from 2008
– Annotation Tool • ViPER GT, developed by UMD (now AMA)
• http://viper-toolkit.sourceforge.net/
• NIST and LDC adapted tool for workflow system compatibility
– Data Pre-processing• OS limitations required conversion from MPEG to JPEG
– 1 JPEG image for each frame
• For each video clip assigned to annotators
– Divided JPEGs into framespan directories
– Created .info file specifying order of JPEGs
– Created ViPER XML file (XGTF) with pointer to .info file
• Default ViPER playback rate = about 25 frames (JPEGs)/second
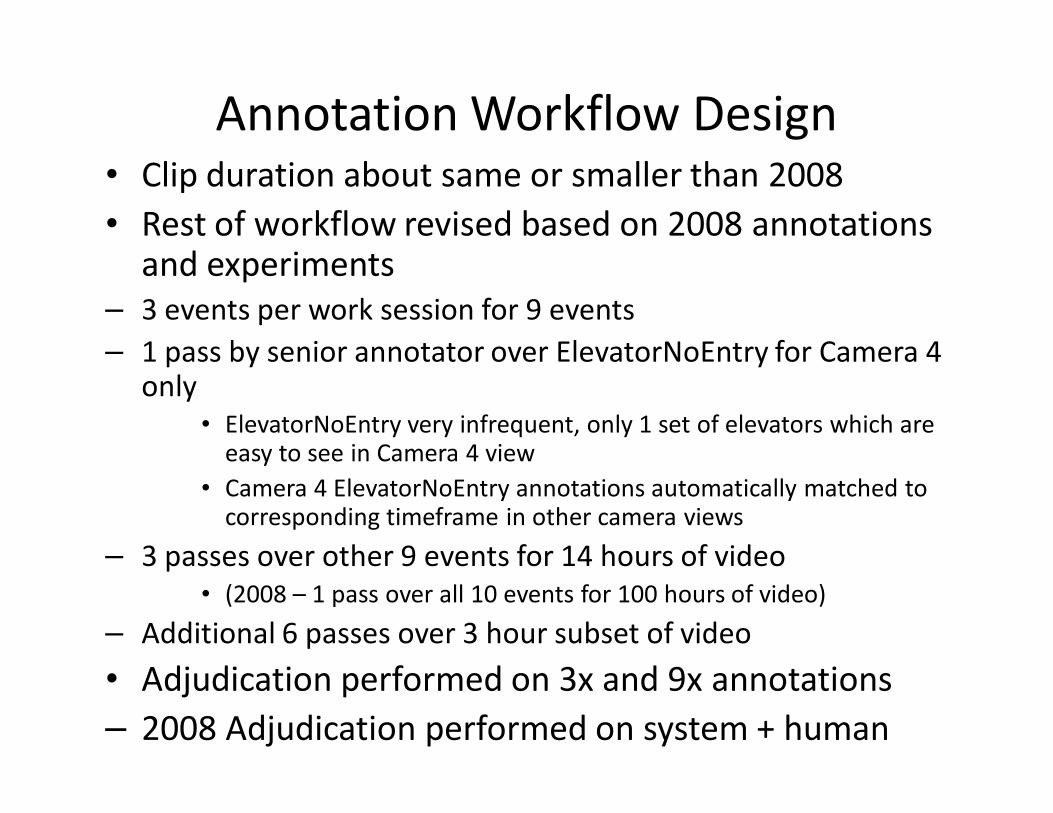
Annotation Workflow Design• Clip duration about same or smaller than 2008
• Rest of workflow revised based on 2008 annotations and experiments
– 3 events per work session for 9 events
– 1 pass by senior annotator over ElevatorNoEntry for Camera 4 only
• ElevatorNoEntry very infrequent, only 1 set of elevators which are easy to see in Camera 4 view
• Camera 4 ElevatorNoEntry annotations automatically matched to corresponding timeframe in other camera views
– 3 passes over other 9 events for 14 hours of video
• (2008 – 1 pass over all 10 events for 100 hours of video)
– Additional 6 passes over 3 hour subset of video
• Adjudication performed on 3x and 9x annotations
– 2008 Adjudication performed on system + human

Event Sets• 3 sets of 3 events, ElevatorNoEntry separate set
• Goal to balance sets by event type and frequency
Event Type Tracking Object Gesture
Set 1 OpposingFlow CellToEar Pointing
Set 2 PeopleSplitUp ObjectPut Embrace
Set 3 PeopleMeet TakePicture PersonRuns

Visualization of Annotation Workflow
Video
E10
Events
Annotators
<= ~5 minute video clip
E1 E2 E3 E5E4 E6 E7 E9 E8
A1A1 A1A1 A1 A1 A2 A3 A1
A1Senior Annotator
ElevatorNoEntry
(Camera 4 only)
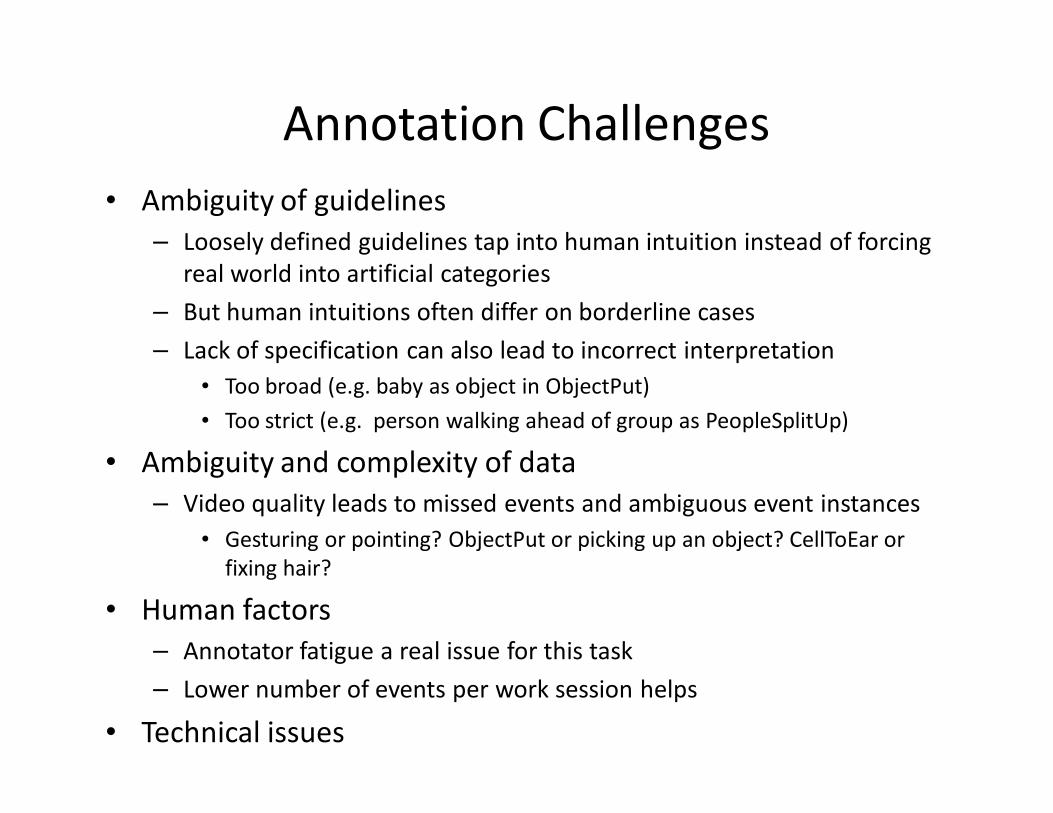
Annotation Challenges
• Ambiguity of guidelines
– Loosely defined guidelines tap into human intuition instead of forcing
real world into artificial categories
– But human intuitions often differ on borderline cases
– Lack of specification can also lead to incorrect interpretation
• Too broad (e.g. baby as object in ObjectPut)
• Too strict (e.g. person walking ahead of group as PeopleSplitUp)
• Ambiguity and complexity of data
– Video quality leads to missed events and ambiguous event instances
• Gesturing or pointing? ObjectPut or picking up an object? CellToEar or
fixing hair?
• Human factors
– Annotator fatigue a real issue for this task
– Lower number of events per work session helps
• Technical issues

2009 Participants11 Sites (45 registered participants)
75 Event Runs
Single Person
Single Person +
Object Multiple People
Ele
vato
rNo
En
try
Op
po
sin
gF
low
Pe
rso
nR
un
s
Po
inti
ng
Ce
llTo
Ea
r
Ob
ject
Pu
t
Take
Pic
ture
Em
bra
ce
Pe
op
leM
ee
t
Pe
op
leS
plit
Up
Shanghai Jiao Tong University SJTU x x x x x x x x
Universidad Autónoma de Madrid UAM x x x
Carnegie Mellon University CMU x x x x x x x x x x
NEC Corporation/University of Illinois
at Urbana-Champaign NEC-UIUC x x x x x
NHK Science and Technical Research
Laboratories NHKSTRL x x x x
Beijing University of Posts and
Telecommunications (MCPRL)
BUPT-
MCPRL x x x x x
Beijing University of Posts and
Telecommunications (PRIS)
BUPT-
PRIS x x x
Peking University (+ IDM) PKU-IDM x x x x x
Simon Fraser University SFU x x x
Tokyo Institute of Technology TITGT x x x
Toshiba Corporation Toshiba x x x
Total Participants per Event 6 7 11 5 2 4 3 5 5 4
2008
New

Observation Durations and Event DensitiesComparing 2008 and 2009 Test Sets
0
2
4
6
8
10
12
14
16
18
Se
con
ds
pe
r In
sta
nce
Average Duration of Instances
2008
2009
0
10
20
30
40
50
60
70
80
Inst
an
ces
Pe
r H
ou
r
Rates of Event Instances
95% more for Cam2
(Waiting Area)
50% more for Cam3
(Debarkation Area)

Evaluation Protocol Synopsis
• NIST used the Framework for Detection Evaluation (F4DE) Toolkit
• Available for download on the VSED Web Site
• http://www.itl.nist.gov/iad/mig/tools
• Events are scored independently
• Five step evaluation process
• Segment mapping
• Segmented scoring
• Score accumulation
• Error metric calculation
• Error visualization

Segment Mapping for Streaming Media
• Mapping kernel function
– The mid point of the system-generated extent must
be within the reference extent extended by 1 sec.
– Temporal congruence and decision scores give
preference to overlapping events
Time
Ref. Obs.
Sys. Obs.
Hungarian
Solution to
Bipartite Graph
Matching
1 Hour of Video

Segment Scoring
Time
Ref. Obs.
Sys. Obs.
Missed
Detections
When a reference
observation is
NOT mapped
Correct
Detections
When reference
and system
observations are
mapped
False
Alarms
When a
system
observation is
NOT mapped
1 Hour of Video

Compute Normalized Detection Cost
Time
Ref. Obs.
Sys. Obs.
tionSignalDura
sFalseAlarmRateFA
#() =
TrueObs
MissedObsPMiss
#
#() =
50.4
2() ==MissP
HrFAHr
RateFA /11
1() ==
1 Hour of Video
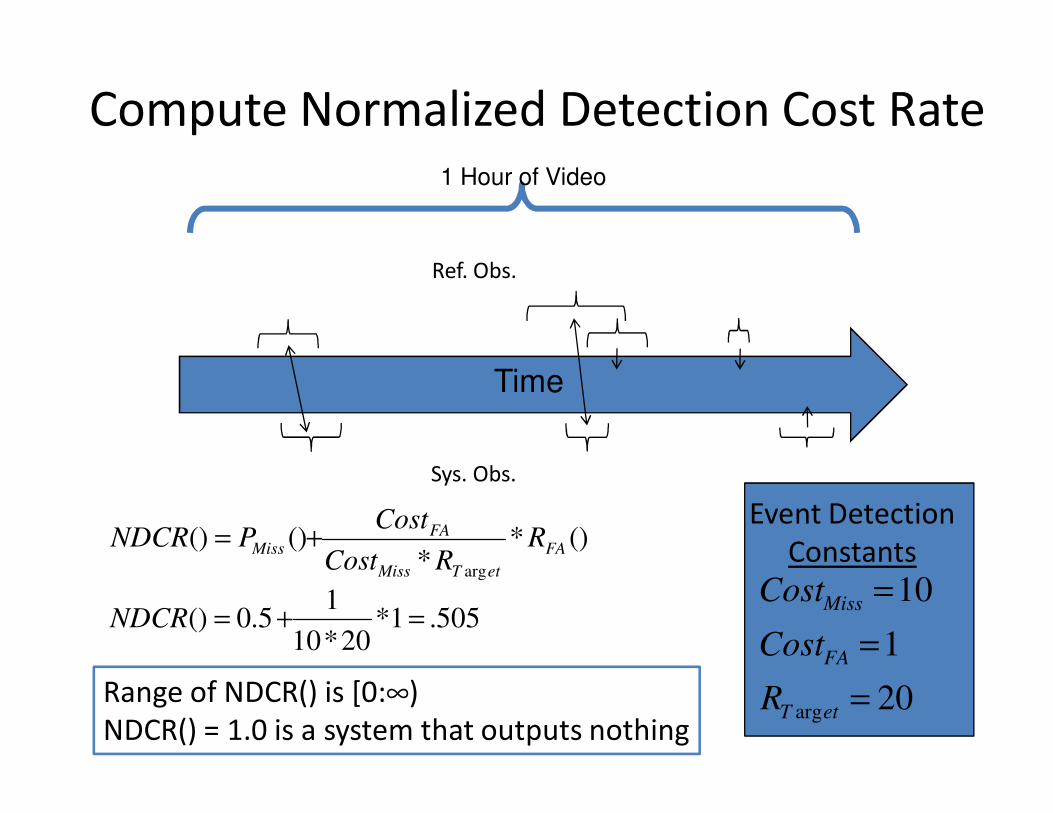
Compute Normalized Detection Cost Rate
Time
Ref. Obs.
Sys. Obs.
1 Hour of Video
()**
()()arg
FA
etTMiss
FAMiss R
RCost
CostPNDCR +=
20
1
10
arg =
=
=
etT
FA
Miss
R
Cost
Cost
Event Detection
Constants
505.1*20*10
15.0() =+=NDCR
Range of NDCR() is [0:∞)
NDCR() = 1.0 is a system that outputs nothing

Decision Error Tradeoff Curves
ProbMiss
vs. RateFA
Decision Score Histogram
Co
un
t o
f O
bse
rva
tio
ns
Decision Score
Full Distribution

Decision Error Tradeoff Curves
ProbMiss
vs. RateFA
Decision Score Histogram Separated wrt. Reference Annotation s
Θ
Co
un
t o
f O
bse
rva
tio
ns
System Decision Score
Incorrect System
Observations
True Observations
tionSignalDura
sFalseAlarmRateFA
#)( =θ
TrueObs
MissedObsPMiss
#
#)( =θ
Normalizing by # of Non-Observations is
impossible for Streaming Detection Evaluations
Non-Targets
Targets
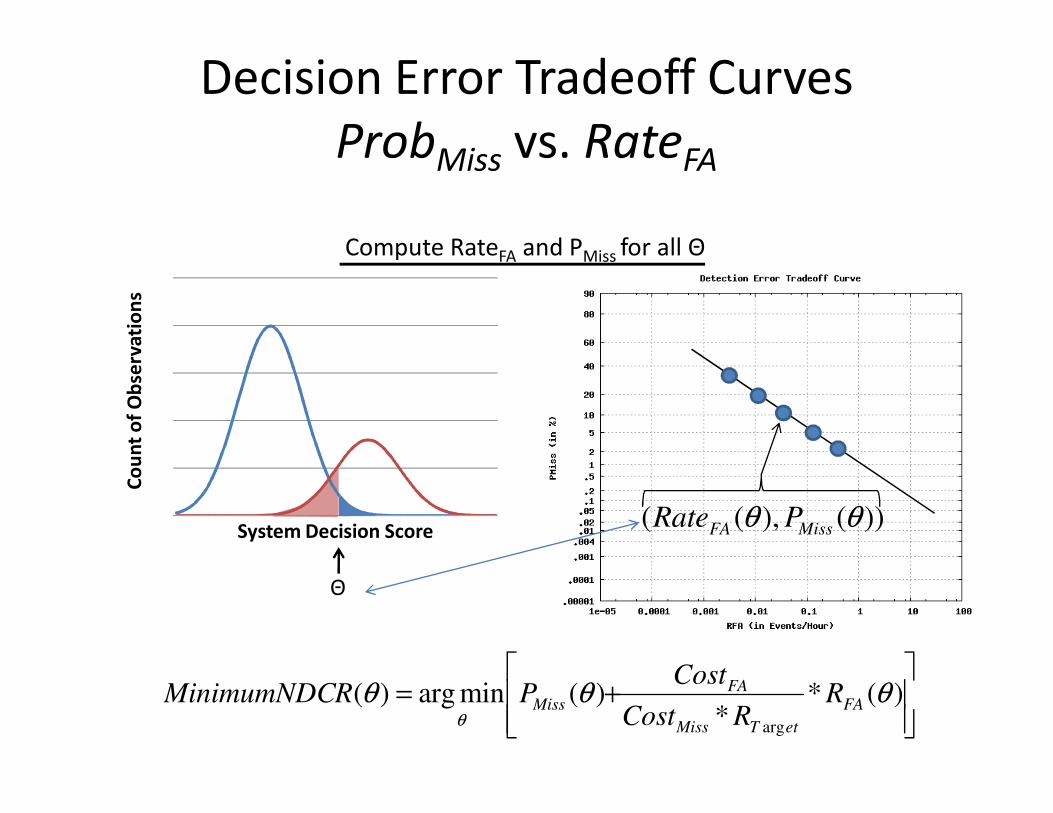
Decision Error Tradeoff Curves
ProbMiss
vs. RateFA
Compute RateFA and PMiss for all Θ
Θ
Co
un
t o
f O
bse
rva
tio
ns
System Decision Score
Incorrect System
Observations
True Observations
))(),(( θθ MissFA PRate
+= )(*
*)(minarg)(
arg
θθθθ
FA
etTMiss
FAMiss R
RCost
CostPRMinimumNDC
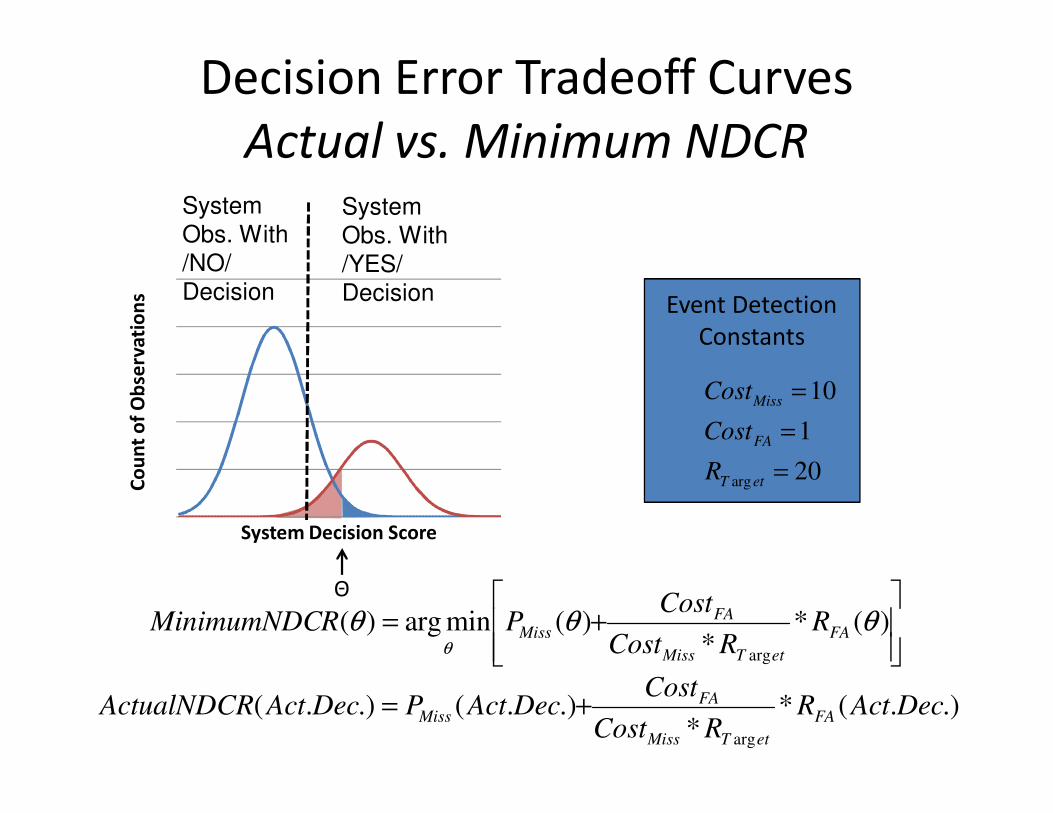
Decision Error Tradeoff Curves
Actual vs. Minimum NDCR
Θ
Co
un
t o
f O
bse
rva
tio
ns
System Decision Score
+= )(*
*)(minarg)(
arg
θθθθ
FA
etTMiss
FAMiss R
RCost
CostPRMinimumNDC
System
Obs. With
/YES/
Decision
System
Obs. With
/NO/
Decision
.).(**
.).(.).(arg
DecActRRCost
CostDecActPDecActActualNDCR FA
etTMiss
FAMiss +=
20
1
10
arg =
=
=
etT
FA
Miss
R
Cost
Cost
Event Detection
Constants
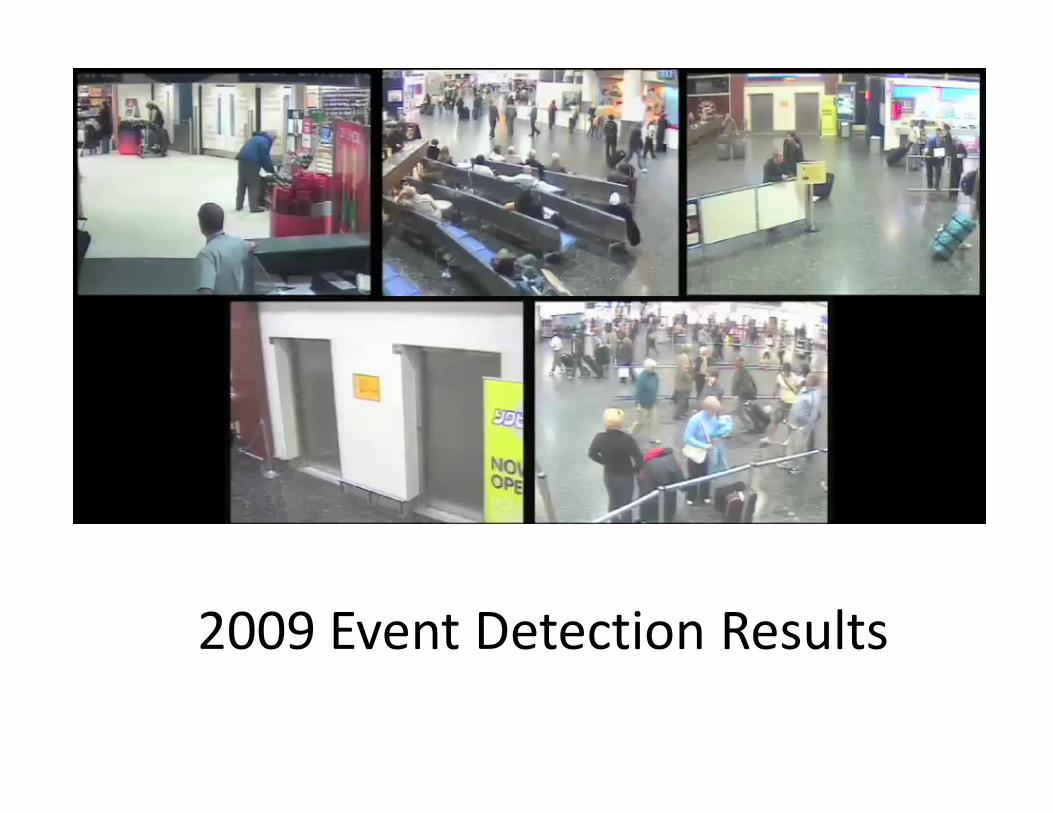
2009 Event Detection Results

2009 Minimum and Actual NDCRs
(Set 1)
0 0.5 1 1.5 2 2.5 3 3.5 4 4.5 5
CMU_3
NEC-UIUC_2
BUPT-MCPRL_6
BUPT-PRIS_1
CMU_3
PKU-IDM_4
SJTU_3
Toshiba_1
CMU_3
NEC-UIUC_2
PKU-IDM_4
SFU_1
SJTU_3
CMU_3
NEC-UIUC_2
NHKSTRL_2
UAM_1
BUPT-MCPRL_6
BUPT-PRIS_1
CMU_3
NHKSTRL_2
SJTU_3
Toshiba_1
UAM_1
Ce
llT
oE
ar
Ele
va
torN
oE
ntr
yE
mb
race
Ob
ject
Pu
tO
pp
osi
ng
Flo
w
Normalized Detection Cost Rate
Min of Act. DCR
Min of Min DCR
Act. Dec
Minimum
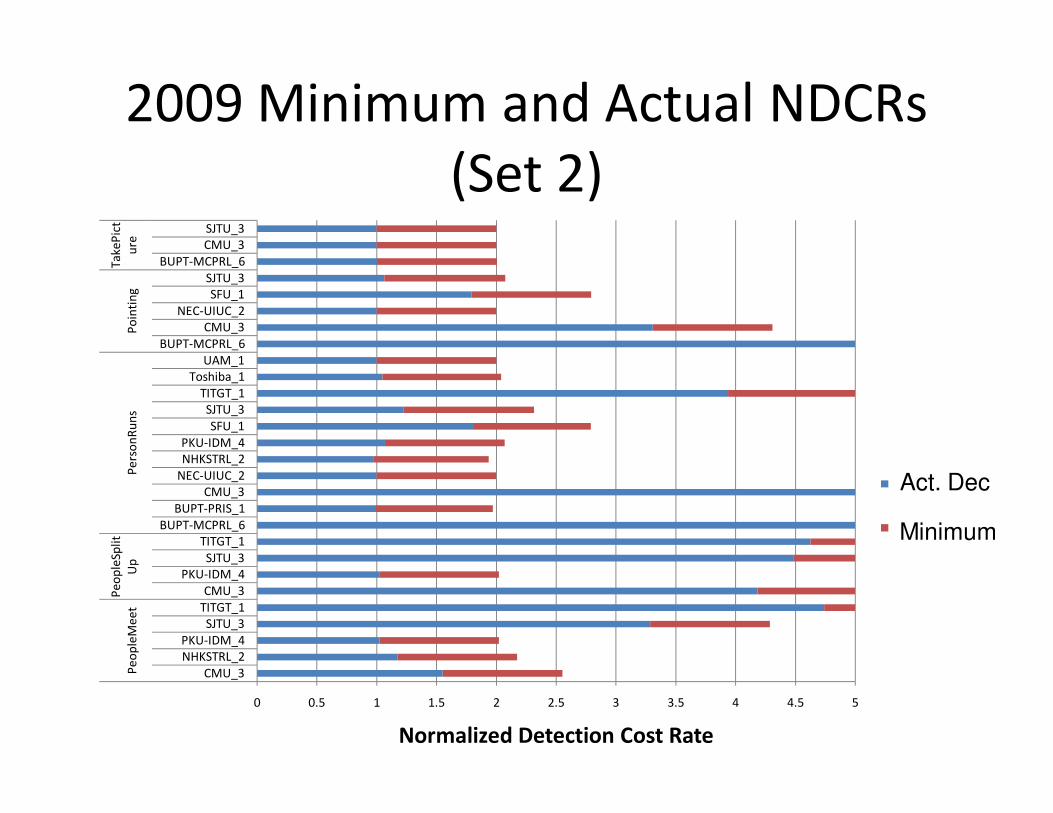
2009 Minimum and Actual NDCRs
(Set 2)
0 0.5 1 1.5 2 2.5 3 3.5 4 4.5 5
CMU_3
NHKSTRL_2
PKU-IDM_4
SJTU_3
TITGT_1
CMU_3
PKU-IDM_4
SJTU_3
TITGT_1
BUPT-MCPRL_6
BUPT-PRIS_1
CMU_3
NEC-UIUC_2
NHKSTRL_2
PKU-IDM_4
SFU_1
SJTU_3
TITGT_1
Toshiba_1
UAM_1
BUPT-MCPRL_6
CMU_3
NEC-UIUC_2
SFU_1
SJTU_3
BUPT-MCPRL_6
CMU_3
SJTU_3
Pe
op
leM
ee
t
Pe
op
leSp
lit
Up
Pe
rso
nR
un
sP
oin
tin
g
Ta
ke
Pic
t
ure
Normalized Detection Cost Rate
Min of Act. DCR
Min of Min DCR
Act. Dec
Minimum

2009 Best DET Curves for Events
2009

2008 Best DET Curves for Events
2008
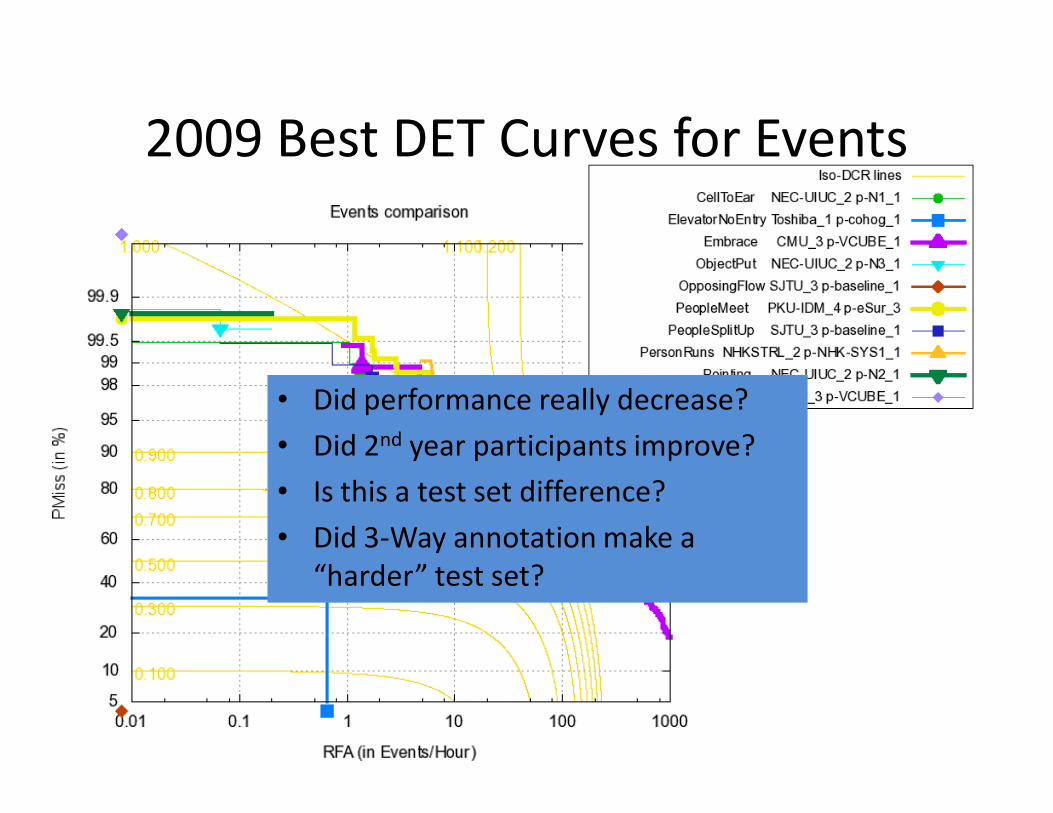
2009 Best DET Curves for Events
• Did performance really decrease?
• Did 2nd year participants improve?
• Is this a test set difference?
• Did 3-Way annotation make a
“harder” test set?

Embrace EventBest Submission per Site
0 2 4 6 8
CMU / VCUBE
NEC-UIUC / none
PKU-IDM / eSur
SFU / match
SJTU / baseline
RandomDET
Human Pass 1
Human Pass 2
Human Pass 3
Eval08 Best
Min NDCR Act. NDCR
Ra
ng
e
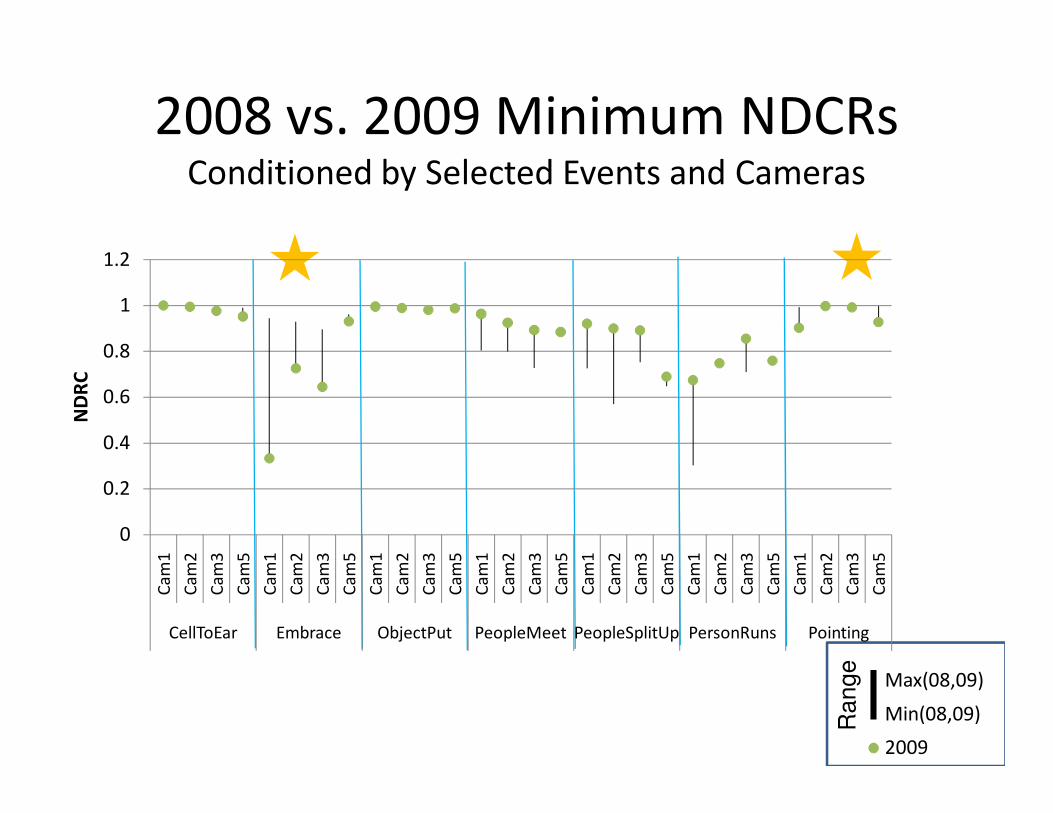
2008 vs. 2009 Minimum NDCRsConditioned by Selected Events and Cameras
0
0.2
0.4
0.6
0.8
1
1.2
Ca
m1
Ca
m2
Ca
m3
Ca
m5
Ca
m1
Ca
m2
Ca
m3
Ca
m5
Ca
m1
Ca
m2
Ca
m3
Ca
m5
Ca
m1
Ca
m2
Ca
m3
Ca
m5
Ca
m1
Ca
m2
Ca
m3
Ca
m5
Ca
m1
Ca
m2
Ca
m3
Ca
m5
Ca
m1
Ca
m2
Ca
m3
Ca
m5
CellToEar Embrace ObjectPut PeopleMeet PeopleSplitUp PersonRuns Pointing
ND
RC
Max(08,09)
Min(08,09)
2009
Ra
ng
e
0
0.2
0.4
0.6
0.8
1
1.2
Ca
m1
Ca
m2
Ca
m3
Ca
m5
Ca
m1
Ca
m2
Ca
m3
Ca
m5
Ca
m1
Ca
m2
Ca
m3
Ca
m4
Ca
m5
Ca
m1
Ca
m2
Ca
m3
Ca
m5
Ca
m1
Ca
m2
Ca
m3
Ca
m5
Ca
m1
Ca
m2
Ca
m3
Ca
m5
Ca
m1
Ca
m2
Ca
m3
Ca
m4
Ca
m5
CellToEar Embrace ObjectPut PeopleMeet PeopleSplitUp PersonRuns Pointing
ND
CR
Max(08,09)
Min(08,09)
2009
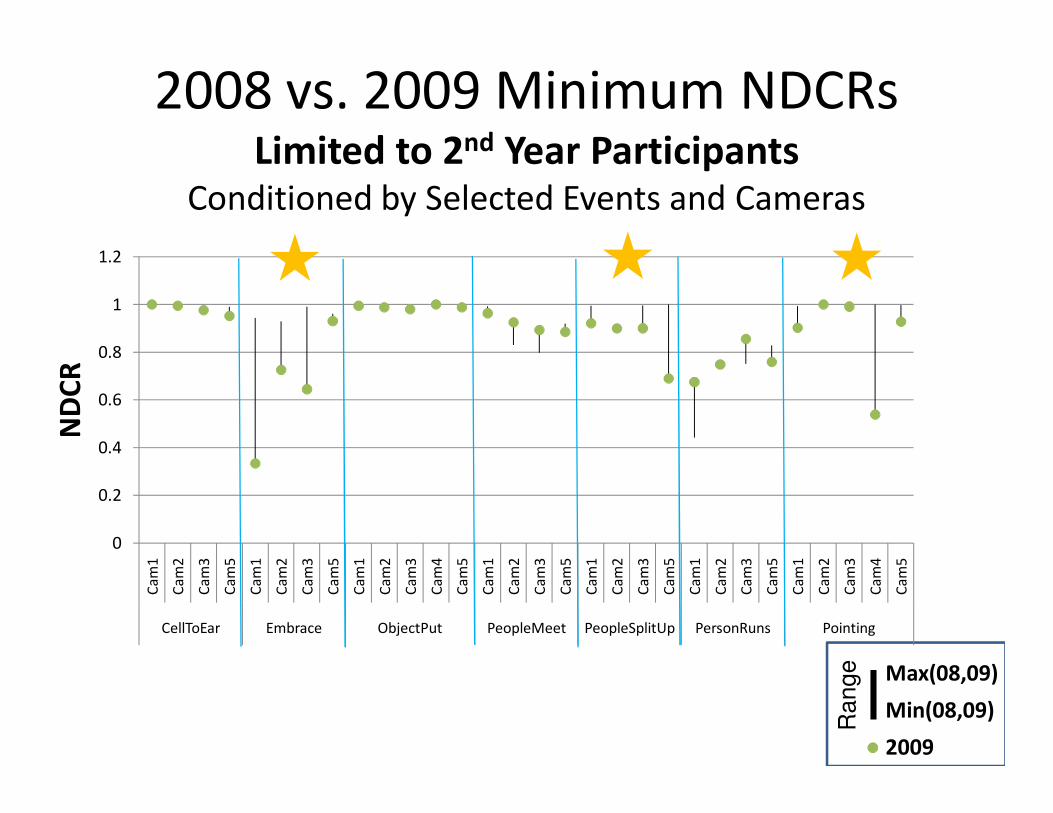
2008 vs. 2009 Minimum NDCRsLimited to 2nd Year Participants
Conditioned by Selected Events and Cameras

CMU 2008 and 2009 Embrace
Event Submissions

CMU 2008 and 2009 Embrace Event
Submissions Split By Cameras
Why is the ALL
Camera Curve
worse than each
SINGLE Camera
Curves?
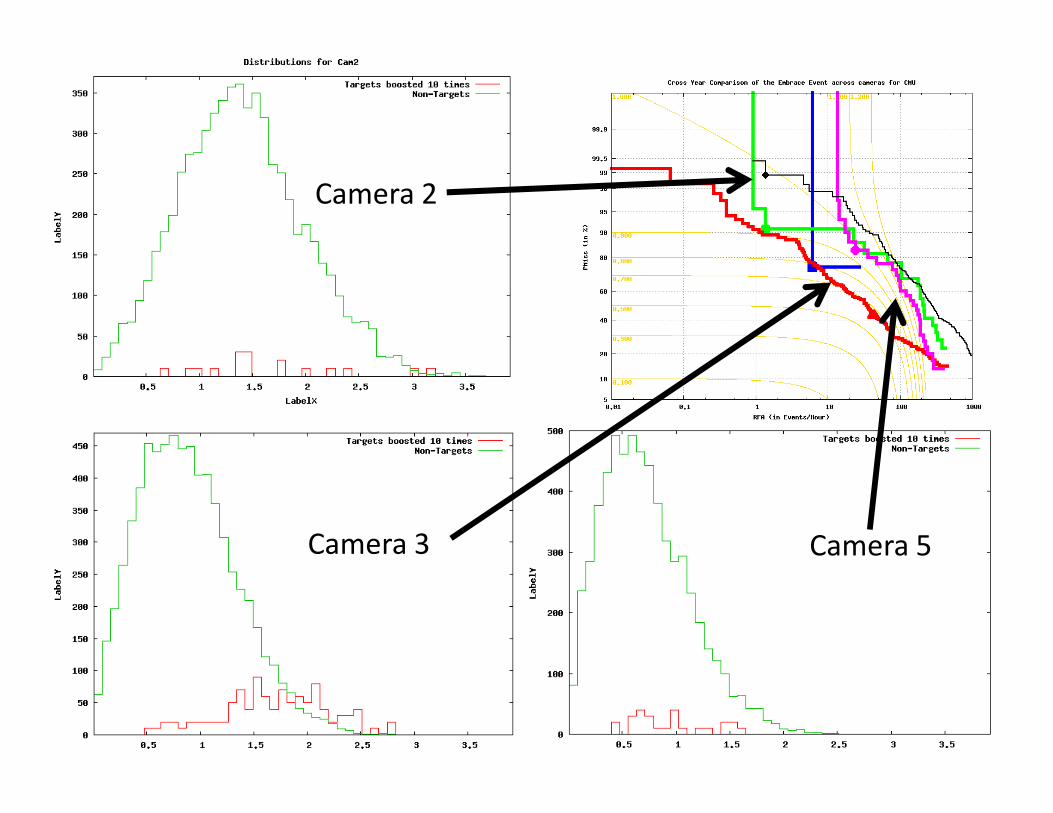
Me
dia
n
Me
dia
n
Camera 3
Camera 3 Camera 5
Camera 2
Conclusions and Lessons Learned
• Improvement can be seen in 2 of the events on
specific cameras
• Multiple-year participants have shown improvement
on 3 events
– Decision score normalization is important
– Non-optimal normalization obscures performance gains
• The change in annotation scheme improved the
number of found event instances
– We will be studying the effect on scoring
• Next year’s evaluation should re-use this year’s test
set but in what manner
End of Talk
Back up slides
to follow
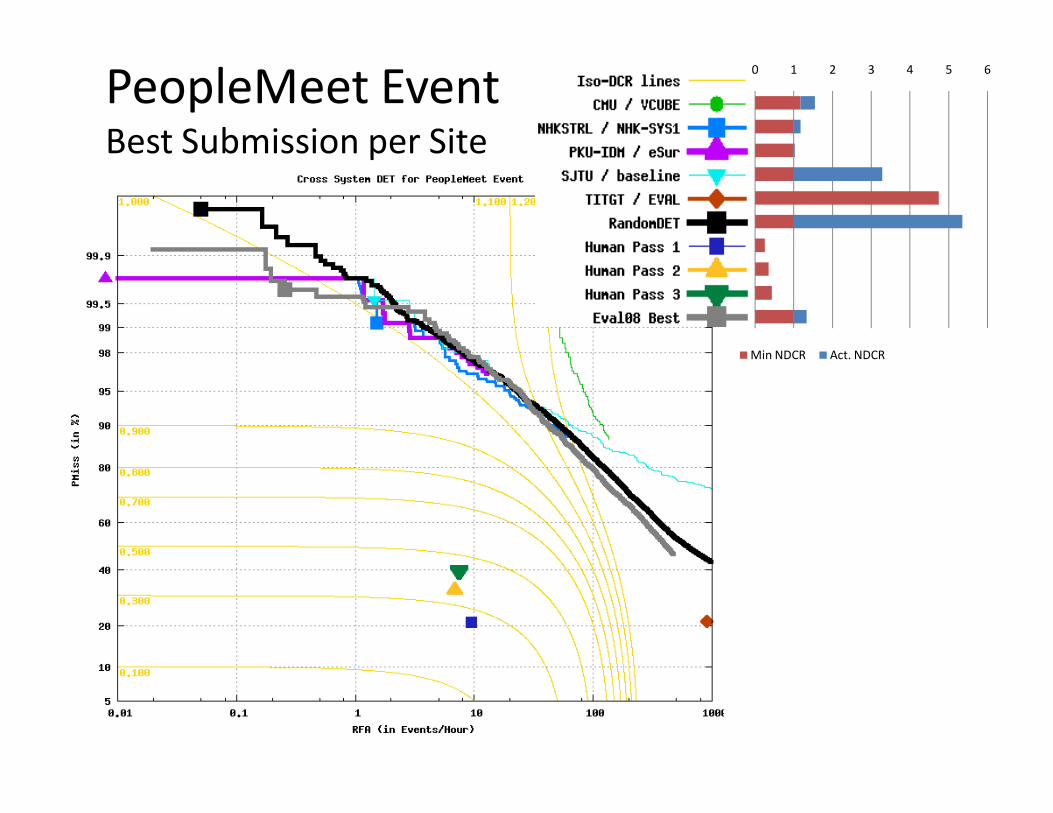
PeopleMeet EventBest Submission per Site
0 1 2 3 4 5 6
CMU / VCUBE
NHKSTRL / NHK-SYS1
PKU-IDM / eSur
SJTU / baseline
TITGT / EVAL
RandomDET
Human Pass 1
Human Pass 2
Human Pass 3
Eval08 Best
Min NDCR Act. NDCR
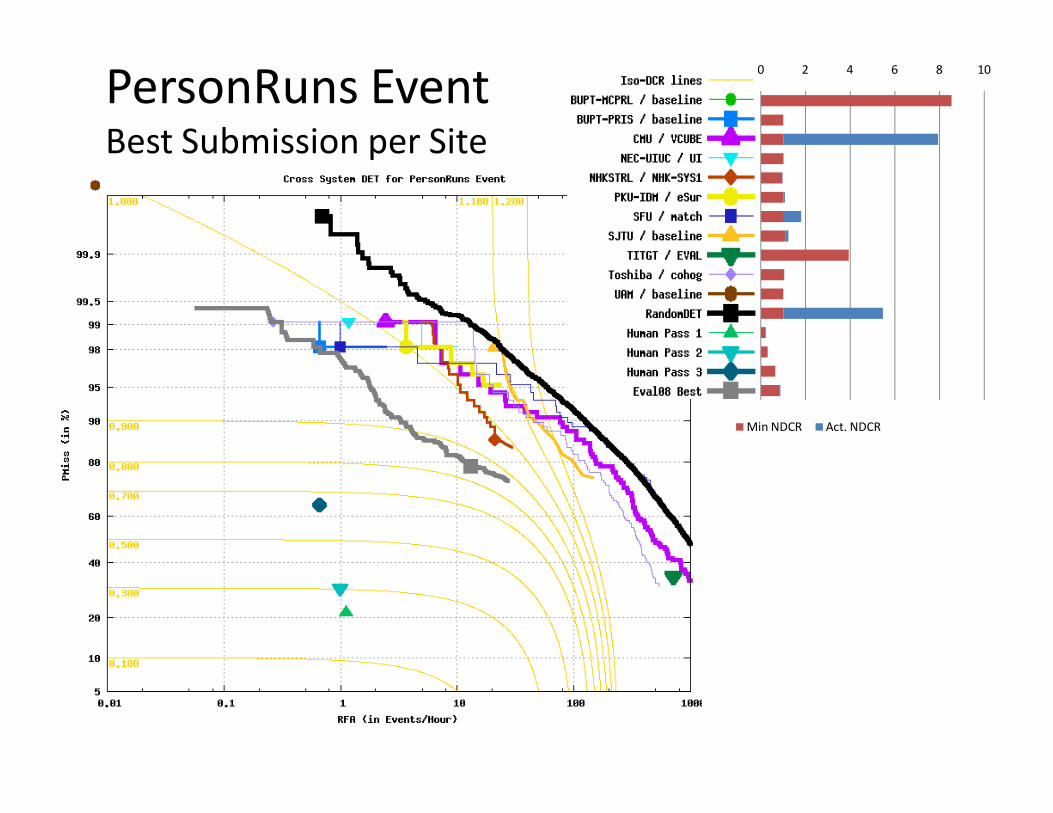
PersonRuns EventBest Submission per Site
0 2 4 6 8 10
BUPT-MCPRL / baseline
BUPT-PRIS / baseline
CMU / VCUBE
NEC-UIUC / UI
NHKSTRL / NHK-SYS1
PKU-IDM / eSur
SFU / match
SJTU / baseline
TITGT / EVAL
Toshiba / cohog
UAM / baseline
RandomDET
Human Pass 1
Human Pass 2
Human Pass 3
Eval08 Best
Min NDCR Act. NDCR
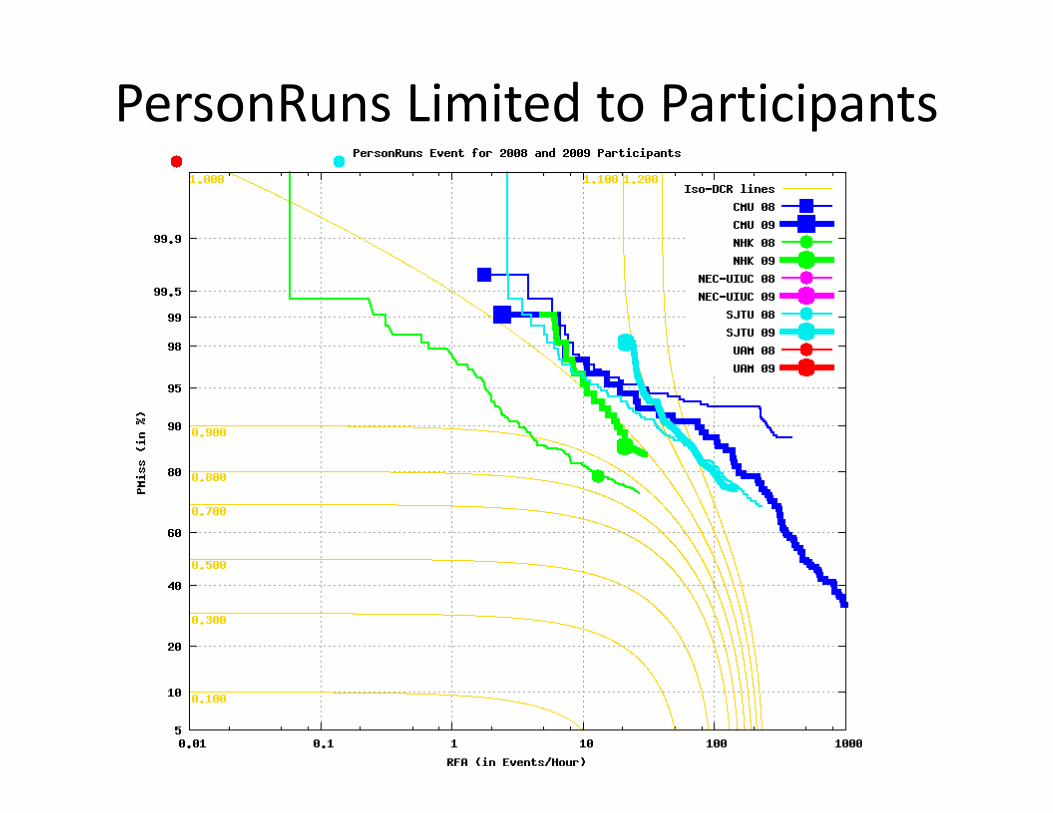
PersonRuns Limited to Participants
of Both 2008 and 2009

Pointing EventBest Submission per Site
• Random system
• Rtarg=XXX,
• MeanDur=XXs
• TestDur=XXH
0 2 4 6 8 10
BUPT-MCPRL / baseline
CMU / VCUBE
NEC-UIUC / N2
SFU / match
SJTU / baseline
RandomDET
Human Pass 1
Human Pass 2
Human Pass 3
Eval08 Best
Min NDCR Act. NDCR
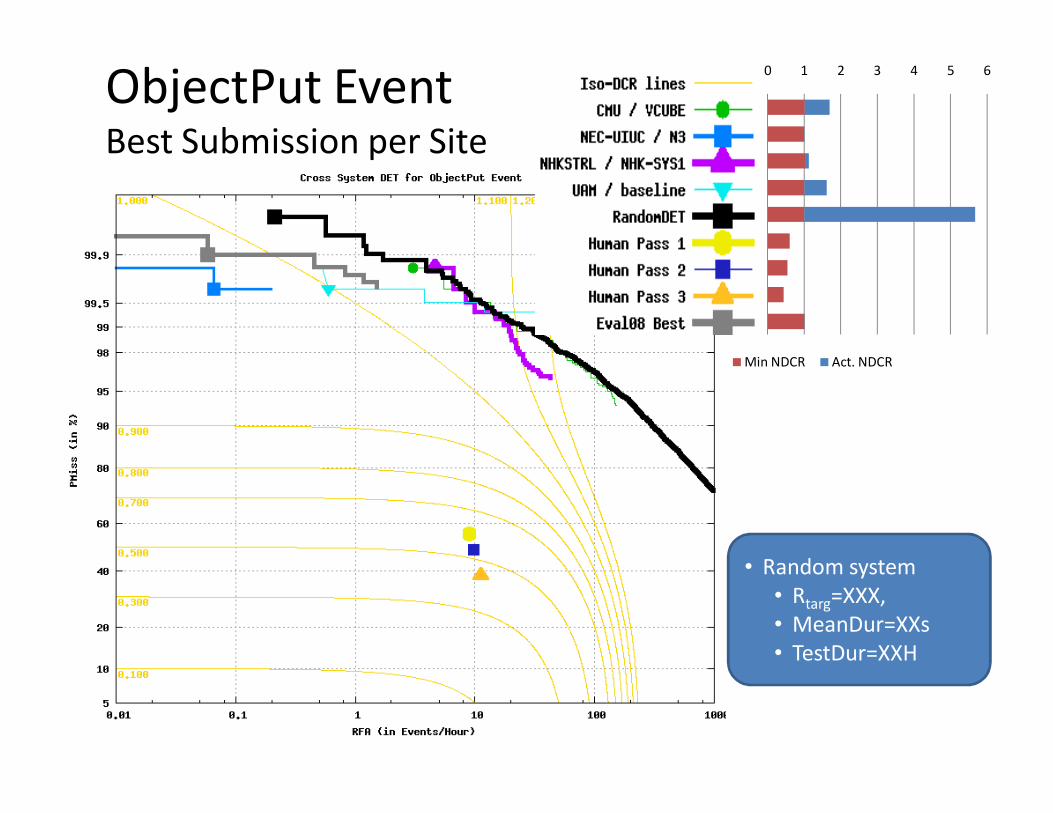
ObjectPut EventBest Submission per Site
• Random system
• Rtarg=XXX,
• MeanDur=XXs
• TestDur=XXH
0 1 2 3 4 5 6
CMU / VCUBE
NEC-UIUC / N3
NHKSTRL / NHK-SYS1
UAM / baseline
RandomDET
Human Pass 1
Human Pass 2
Human Pass 3
Eval08 Best
Min NDCR Act. NDCR
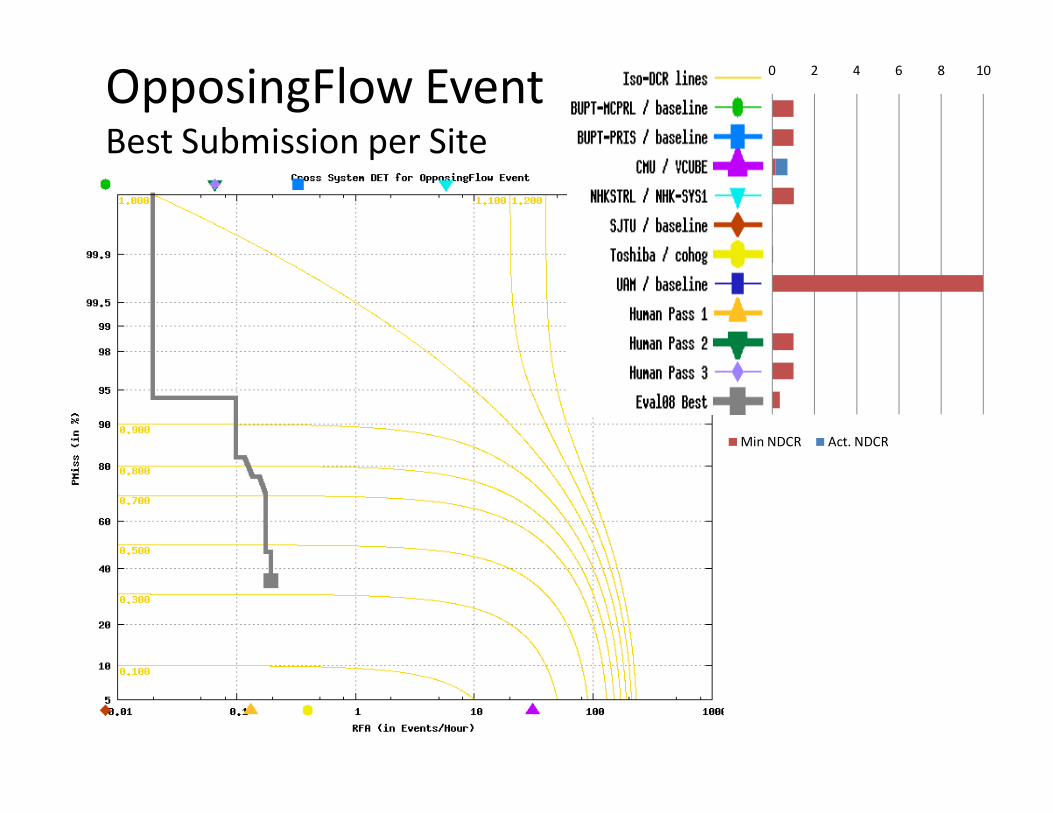
OpposingFlow EventBest Submission per Site
-2 0 2 4 6 8 10
BUPT-MCPRL / baseline
BUPT-PRIS / baseline
CMU / VCUBE
NHKSTRL / NHK-SYS1
SJTU / baseline
Toshiba / cohog
UAM / baseline
Human Pass 1
Human Pass 2
Human Pass 3
Eval08 Best
Min NDCR Act. NDCR
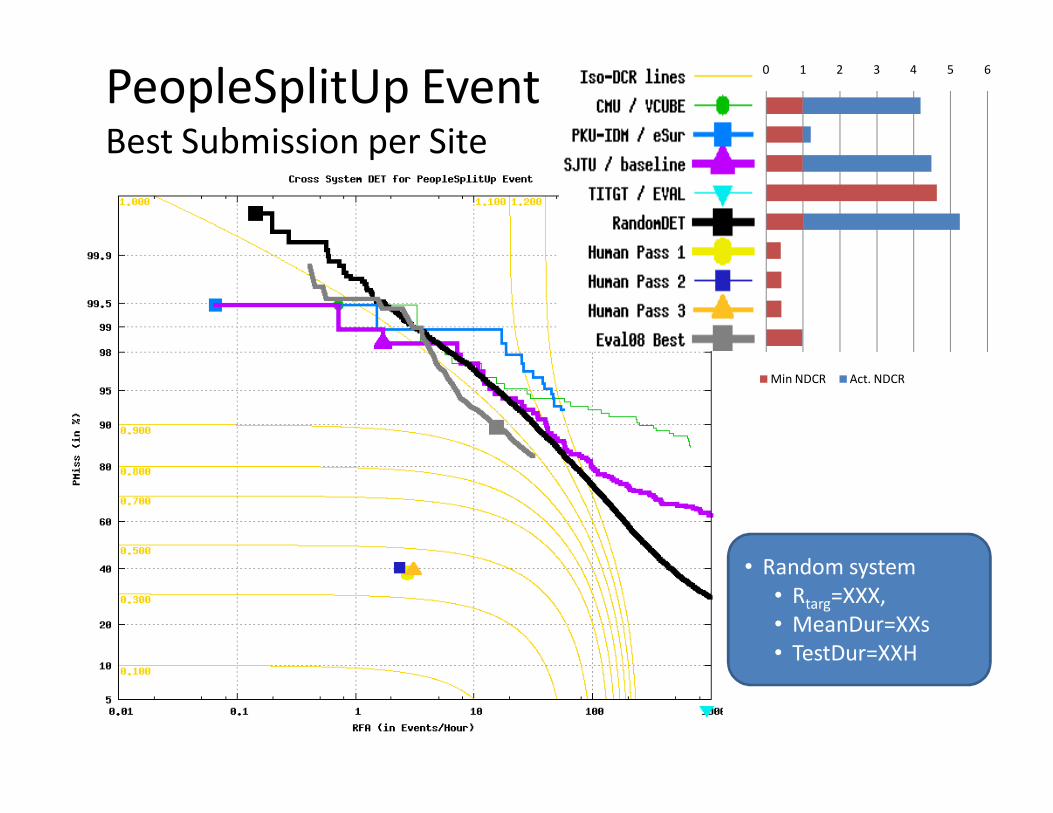
PeopleSplitUp EventBest Submission per Site
• Random system
• Rtarg=XXX,
• MeanDur=XXs
• TestDur=XXH
0 1 2 3 4 5 6
CMU / VCUBE
PKU-IDM / eSur
SJTU / baseline
TITGT / EVAL
RandomDET
Human Pass 1
Human Pass 2
Human Pass 3
Eval08 Best
Min NDCR Act. NDCR

TakePicture EventBest Submission per Site
-0.2 0 0.2 0.4 0.6 0.8 1 1.2
BUPT-MCPRL / baseline
CMU / VCUBE
SJTU / baseline
Human Pass 1
Human Pass 2
Human Pass 3
Eval08 Best
Min NDCR Act. NDCR

CellToEar EventBest Submission per Site
• Random system
• Rtarg=XXX,
• MeanDur=XXs
• TestDur=XXH
0 2 4 6 8 10
CMU / VCUBE
NEC-UIUC / N1
RandomDET
Human Pass 1
Human Pass 2
Human Pass 3
Eval08 Best
Min NDCR Act. NDCR

ElevatorNoEntry EventAll Submissions
0 0.2 0.4 0.6 0.8 1 1.2
BUPT-MCPRL_6 p-baseline_6
BUPT-PRIS_1 p-baseline_1
CMU_3 p-VCUBE_1
PKU-IDM_4 p-eSur_1
PKU-IDM_4 p-eSur_3
SJTU_3 p-baseline_1
Toshiba_1 p-cohog_1
Min NDCR Act. NDCR


![GP VD150 E Operating Instruction Eng Ger Fre Ita Spa Rus · 1 1 Press the [CAM1], [CAM2], [CAM3] or [CAM4] button to select the unit. 2 Press the [MENU] button for at least 2 seconds](https://img.dokumen.tips/doc/110x75/5f053f5c7e708231d41203e2/gp-vd150-e-operating-instruction-eng-ger-fre-ita-spa-rus-1-1-press-the-cam1-cam2.jpg)