Embed Size (px)
Citation preview

Vibrations in timber bridges due
to pedestrian induced forces
A case study of Älvsbackabron
Master of Science Thesis in the Master’s Programme Structural Engineering and
Building Performance Design
HANNA JANSSON
ISAK SVENSSON
Department of Civil and Environmental Engineering
Division of Structural Engineering
Steel and Timber Structures
CHALMERS UNIVERSITY OF TECHNOLOGY
Göteborg, Sweden 2012
Master’s Thesis 2012:96


MASTER’S THESIS 2012:96
Vibrations in timber bridges due
to pedestrian induced forces
A case study of Älvsbackabron
Master of Science Thesis in the Master’s Programme Structural Engineering and
Building Performance Design
HANNA JANSSON
ISAK SVENSSON
Department of Civil and Environmental Engineering
Division of Structural Engineering
Steel and Timber Structures
CHALMERS UNIVERSITY OF TECHNOLOGY
Göteborg, Sweden 2012

Vibrations in timber bridges due to pedestrian induced forces
A case study of Älvsbackabron
Master of Science Thesis in the Master’s Programme Structural Engineering and
Building Performance Design
HANNA JANSSON
ISAK SVENSSON
© HANNA JANSSON, ISAK SVENSSON, 2012
Examensarbete / Institutionen för bygg- och miljöteknik,
Chalmers tekniska högskola 2012:96
Department of Civil and Environmental Engineering
Division of Structural Engineering
Steel and Timber Structures
Chalmers University of Technology
SE-412 96 Göteborg
Sweden
Telephone: + 46 (0)31-772 1000
Cover:
Overview of Älvsbackabron over Skellefteå river in the centre of Skellefteå. More
information about Älvsbackabron and Skellefteå can be found in Chapter 6.
Reproservice, Chalmers University of Technology, Göteborg, Sweden 2012

I
Vibrations in timber bridges due to pedestrian induced forces
A case study of Älvsbackabron
Master of Science Thesis in the Master’s Programme Structural Engineering and
Building Performance Design
HANNA JANSSON
ISAK SVENSSON
Department of Civil and Environmental Engineering
Division of Structural Engineering
Steel and Timber Structures
Chalmers University of Technology
ABSTRACT
One of the greatest challenges for structural engineers when constructing lightweight
timber bridges is the pedestrian induced vibrations. The purpose of this Master’s
thesis was to investigate the force models, regulations and comfort criteria regarding
vibrations in timber footbridges induced by pedestrian forces presented in design
codes. Furthermore, a case study of Älvsbackabron, a cable-stayed timber footbridge
with span of 130 meters designed by COWI AB, was performed with the purpose of
comparing measured accelerations with calculated accelerations and acceleration limit
values. Two models were established in the finite element software Brigade/Plus, one
with material parameters according to BRO 2004 and the other with material
parameters according to Eurocode 5. The results from these two models were
compared with each other to study the differences the transition from BRO 2004 to
Eurocode implied. Besides, the resulting accelerations from the force models
presented in BRO 2004 and the ISO 10137 standard applied on the finite element
models were compared with the measured accelerations at Älvsbackabron.
The main differences between the two bridge codes were that lateral vibrations also
have to be considered when designing according to Eurocode. When performing
dynamic design according to Eurocode 5 the force model presented in the ISO 10137
standard can be used for both vertical and lateral pedestrian forces. In this Master’s
thesis simplifications of the vertical force model were made which resulted in a
practical and useful force model. According to this simplified force model the vertical
acceleration limit was fulfilled for a group of twenty pedestrians, which was
considered a reasonable design situation.
From the measured accelerations at Älvsbackabron the damping factor was calculated
to 1.2% of critical damping which is twice the value used in design. From the field
tests at Älvsbackabron it was also concluded that the measured accelerations never
exceeded the limit accelerations presented in BRO 2004 and Eurocode 0.
Key words: Älvsbackabron, footbridge, timber bridge, pedestrian induced vibrations,
acceleration measurements, damping factor, BRO 2004, Eurocode, ISO 10137

II
Vibrationer i träbroar orsakade av fotgängare
En fallstudie av Älvsbackabron
Examensarbete inom Structural Engineering and Building Performance Design
HANNA JANSSON, ISAK SVENSSON
Institutionen för bygg- och miljöteknik
Avdelningen för konstruktionsteknik
Stål- och träbyggnad
Chalmers tekniska högskola
SAMMANFATTNING
Under sommaren 2011 färdigställdes Älvsbackabron, en gång- och cykelbro över
Skellefteälven i centrala Skellefteå. Älvsbackabron är en 130 meter lång snedstagsbro
byggd i trä där en av de största konstruktionstekniska utmaningarna för COWI AB var
att bedöma brons dynamiska respons från svängningar orsakade av fotgängare. En del
av examensarbetets syfte var att studera accelerationsgränsvärden och lastmodeller i
designkoder gällande vibrationer i lätta gång- och cykelbroar. Dessutom genomfördes
en fallstudie av Älvsbackabron vilken innefattade både modellering av bron i finita
elementprogrammet Brigade/Plus samt accelerationsmätningar i brons gångbana.
Målet med fallstudien var att jämföra uppmätta accelerationer från Älvsbackabron
med accelerationsgränsvärden samt att beräkna en dämpningsfaktor baserad på de
uppmätta accelerationerna.
Som en del av arbetet etablerades två finita element modeller där den ena baserades
på materialparametrar från BRO 2004 och den andra på materialparametrar från
Eurocode 5. Skillnaderna mellan lastmodellerna från BRO 2004 och ISO 10137
standarden studerades genom att jämföra resultaten från lastsimuleringar i de två olika
modellerna. Vidare jämfördes även accelerationer från lastsimuleringar med uppmätta
accelerationer från Älvsbackabron med syftet att verifiera beräkningsmodellerna. I
undersökningen inkluderades enbart vibrationer i gångbanan från gångtrafik.
En av de största skillnaderna som normbytet från BRO 2004 till Eurocode inneburit är
att även laterala accelerationskrav och lastmodeller rörande svängningar numera
måste beaktas vid dynamisk design av gång- och cykelbroar. Vid dynamisk design
enligt Eurocode 5 kan lastmodellen i ISO 10137 standarden användas, där
lastmodeller för både vertikala och laterala krafter finns angivna. I examensarbetet
gjordes förenklande antaganden angående den vertikala lastmodellen vilket gav en
praktisk och användbar lastmodell. Enligt den förenklade lastmodellen uppfylldes
accelerationsgränsvärdena för en grupp om tjugo personer vilket ansågs vara en rimlig
dimensioneringssituation.
Från de uppmätta accelerationerna på Älvsbackabron beräknades dämpningsfaktorn
till 1,2% av kritisk dämpning vilket är dubbelt så högt som designvärdet. De uppmätta
accelerationerna visade också att accelerationskraven i BRO 2004 och Eurocode 0
inte överskreds. Detta innebar att Älvsbackabron ansågs uppfylla funktionskravet om
att bron ska vara fri från besvärande svängningar.
Nyckelord: Älvsbackabron, gång- och cykelbro, träbro, svängningar orsakade av
fotgängare, accelerationsmätning, dämpning, BRO 2004, Eurocode, ISO
10137

CHALMERS Civil and Environmental Engineering, Master’s Thesis 2012:96 III
Contents
ABSTRACT I
SAMMANFATTNING II
CONTENTS III
PREFACE VII
NOTATIONS VIII
1 INTRODUCTION 1
1.1 Purpose 2
1.2 Limitations 2
1.3 Method 3
2 VIBRATIONS IN LIGHTWEIGHT CABLE-STAYED BRIDGES 4
2.1 Vibrations induced by pedestrians 4
2.1.1 Dynamic forces from pedestrians 4 2.1.2 Dynamic lateral forces 7
2.2 Human perception of bridge vibrations 8
2.3 Dynamic model for vibrations 9
3 REGULATIONS OF VIBRATIONS IN FOOTBRIDGES 11
3.1 Regulations according to BRO 2004 11
3.2 Regulations according to Eurocode 11
3.2.1 National annexes to Eurocode 13 3.2.2 Suggested design requirements by JRC and ECCC 13
3.3 Regulations according to ISO 10137 15
3.4 Regulations according to the Danish standard Belastnings- og
beregningsregler for vej- og stibroer 17
3.5 Regulations according to the British Standard BS 5400 18
4 PEDESTRIAN FORCE MODELS 19
4.1 Force model according to BRO 2004 19
4.2 Force model according to Eurocode 20 4.2.1 National annexes to Eurocode 20
4.3 Force model according to ISO 10137 20
4.4 Force model according to the Danish standard Belastnings- og
beregningsregler for vej- og stibroer 21
4.5 Force model according to British Standard BS 5400 22
4.6 Force models presented in research literature 22

CHALMERS, Civil and Environmental Engineering, Master’s Thesis 2012:96 IV
5 DYNAMIC TESTING OF TIMBER BRIDGES 25
5.1 Experimental modal analysis 25
5.2 Dynamic test methods for bridges 26 5.2.1 Impact tests 26
5.2.2 Controlled walking 27 5.2.3 Electrodynamic shaker 27
6 CASE STUDY OF ÄLVSBACKABRON 28
6.1 The structural system of Älvsbackabron 28
6.2 Skellefteå and the timber processing industry 30
6.2.1 Smart Wooden Bridge in Smart City 31
7 MODELLING OF ÄLVSBACKABRON 34
7.1 Structural model of the bridge 34 7.1.1 Dynamic design by COWI 34 7.1.2 Simplifications and assumptions in the Master’s thesis models 35
7.2 Master’s thesis models 37
8 ACCELERATION MEASUREMENTS AT ÄLVSBACKABRON 41
8.1 Measuring equipment 41
8.2 Tests performed at Älvsbackabron 42
8.2.1 Controlled walking test 42
8.2.2 Jumping test 43 8.2.3 Heel impact test 45 8.2.4 Continuous measurements 45
8.3 Simulation of tests in Brigade/Plus 45
9 RESULTS 47
9.1 Master’s thesis model according to BRO 2004 47
9.2 Master’s thesis model according to Eurocode 50
9.3 Tests at Älvsbackabron 53
9.3.1 Controlled walking test 53 9.3.2 Jumping test 54
9.3.3 Heel impact test 58 9.3.4 Continuous measurements 60
9.4 Simulations of the tests in Brigade/Plus 61
10 COMPARISON 63
10.1 Regulations and force models 63
10.2 Master’s thesis models 66 10.2.1 Material parameters 66 10.2.2 Force models 67

CHALMERS Civil and Environmental Engineering, Master’s Thesis 2012:96 V
10.3 Measurements from Älvsbackabron and simulations 72
11 DISCUSSION 77
11.1 Regulations and force models 77
11.2 Case study of Älvsbackabron 78
12 CONCLUSIONS 81
12.1 Regulations and force models 81
12.2 Case study of Älvsbackabron 82
13 REFERENCES 83
APPENDIX A 1
APPENDIX B 1
APPENDIX C 1
APPENDIX D 1
APPENDIX E 1

CHALMERS, Civil and Environmental Engineering, Master’s Thesis 2012:96 VI

CHALMERS Civil and Environmental Engineering, Master’s Thesis 2012:96 VII
Preface
The thesis is the final part of the civil engineering programme and has been carried
out from January to June 2012 at COWI AB, Göteborg, in cooperation with the
Division of Structural Engineering at Chalmers University of Technology, Sweden.
Professor Robert Kliger from the Division of Structural Engineering was the examiner
for the thesis.
In this Master’s thesis a study of pedestrian induced vibrations in lightweight timber
bridges have been carried out with Älvsbackabron in Skellefteå as a case study.
Comprised within the case study are two testing occasions at Älvsbackabron where
the measuring equipment was borrowed from the Division of Dynamics and the
Division of Structural Engineering at Chalmers University of Technology, Sweden.
For this we are very grateful and without the equipment a large part of the thesis could
not have been accomplished.
We would like to thank our supervisors Robert Kliger and Tomas Svensson who have
motivated and supported us during our work and contributed with valuable knowledge
and experience. We would also like to thank Thomas Hallgren at COWI for all his
help during our modelling process and Peter Jacobsson at Martinsons Träbroar who
organised the two testing occasions at Älvsbackabron. We appreciate all help from
those at Martinsons Träbroar, COWI, SP Trätek and Luleå University of Technology
that participated in our tests and made our trips to Skellefteå memorable and
successful.
The computer modelling of Älvsbackabron is performed in Bridgade/Plus, a finite
element software specialised for bridge design. A special thanks to Scanscot and their
contribution by providing us a licence and valuable support. We are also very grateful
for the scholarships we received from the funds Chalmers MasterCard and Chalmers
Vänner. Their contribution helped us finance our visits to Skellefteå.
During our work we have been encouraged, motivated and inspired from the positive
work environment at COWI, why we want to thank all the co-workers at COWI.
Finally, we would like to thank our opponents David Glans and Fredrik Eckerwall for
a great cooperation throughout the project.
Göteborg June 2012
Hanna Jansson
Isak Svensson

CHALMERS, Civil and Environmental Engineering, Master’s Thesis 2012:96 VIII
Notations
Roman upper case letters
load amplification factor
width of the bridge [m]
structural damping matrix
coordination factor
pedestrian force [N]
pedestrian force [N]
total force from N pedestrians [N]
static load from pedestrian [N]
pedestrians frequency synchronization coefficient
pedestrian girder movement synchronization coefficient
structural stiffness matrix
length of the bridge [m]
structural mass matrix
modal self-weight of the pedestrian
number of people in the group
amount of pedestrians
static load from pedestrian [N]
period of a step
Roman lower case letters
acceleration at cycle i [m/s2]
acceleration at cycle i+1 [m/s2]
peak acceleration limit [m/s2]
acceleration limit in vertical direction [m/s2]
density of pedestrian traffic
frequency of the loading [Hz]
natural frequency of the bridge [Hz]
natural frequency of the bridge [Hz]
external force
gravity constant [m/s2]
total number of pedestrians
number of steps

CHALMERS Civil and Environmental Engineering, Master’s Thesis 2012:96 IX
is the pedestrian number
number of harmonics of interest
factor expressing contact time
bridge size coefficient
frequency coefficient
numerical coefficient
lateral force / pedestrian weight ratio
girder vibration synchronization coefficient
bridge dependent numerical coefficient
mass of the runner [kg]
is the integer number of the natural harmonic
time [s]
displacement of the structure
lateral velocity of the bridge
velocity of the bridge
velocity of the structure
acceleration of the structure
Greek letters
coefficient corresponding to the i:th harmonic
numerical coefficient
phase lag for the i:th harmonic
mode shape
phase angle for the n:th harmonic
damping factor


CHALMERS, Civil and Environmental Engineering, Master’s Thesis 2012:96 1
1 Introduction
In the late summer of 2011 a cable-stayed timber footbridge was completed in the
centre of Skellefteå. The bridge is called Älvsbackabron and has a free span of 130
meter which makes it the largest cable-stayed timber bridge in Scandinavia today. The
client was the municipality of Skellefteå and Martinsons Träbroar AB acted as the
contractor with COWI AB as the structural engineering consultant (Byggindustrin,
2010).
Älvsbackabron is a part of a research program called Smart Wooden Bridge in Smart
City which aims to increase the knowledge of advanced timber bridges and
consequently strengthen the timber industry in Sweden. During the erection of the
bridge measuring devices were installed and from these devices data are collected and
analysed. The intention of collecting the data is to develop models and tools for
estimating the technical performance and quality of timber bridges. The municipality
of Skellefteå, Luleå University of Technology, SP Trätek and Martinsons Träbroar are
the participants of the project which is partly financed by the European Regional
Development Fund (Degerfeldt, 2009).
Timber footbridges with span greater than 30 meters are sensitive to vibrations which
is why dynamic considerations are needed in the design (Pousette, 2001). A source for
vibrations is pedestrian traffic and a special loading situation is caused by a crowd of
pedestrians walking with the same pace on the bridge. This loading situation was one
of the greatest challenges when designing Älvsbackabron together with predicting
how the dynamic behaviour of the modelled bridge would correlate to the real
response of the bridge (Martinsons, 2009).
The general design rules in Eurocode 5 regarding vibrations in timber footbridges
state that a footbridge should be designed in a way so that the loads on the bridge don
not result in uncomfortable vibrations for the users (Anon. 2004b). However, the
question of how to define uncomfortable vibrations remains. The experience of
vibrations is highly individual why it is difficult to specify suitable regulations for
vibrations in lightweight bridges (Pousette, 2001). In Eurocode 0 (Anon., 2002b)
acceleration limits regarding pedestrian induced vibrations are stated, but no methods
for assessing the dynamic behaviour are given. Instead, it is up to the designer to
make reasonable assumptions which ensures that the limits are fulfilled.
One assumption made in the design process that affects the accelerations is the
damping factor. In the dynamic design of Älvsbackabron, by COWI, the damping
factor from BRO 2004 is used. As a consequence the calculated design values of the
accelerations in the bridge deck exceed the limit values. However, according to
Thomas Hallgren1 the dynamic designer of Älvsbackabron, the damping factor is
assumed to be twice as high as the value given in BRO 2004. This assumption is
based on higher values of the damping factor presented in literature, such as Eurocode
5 (Anon., 2004b). A damping factor twice as high as the value in BRO 2004 results in
lower accelerations and fulfils the design limits. However, if the acceleration limits
would not be fulfilled preparations to install dampers are made on the bridge.
Älvsbackabron is designed according to the Swedish Road Administration Bridge
Code BRO 2004, but since 2009 Eurocode has to be used in all designs. The effects
1 Thomas Hallgren, structural engineer COWI AB, meeting March 21:th 2012

CHALMERS, Civil and Environmental Engineering, Master’s Thesis 2012:96 2
on the dynamic design from this transition are studied to relate Eurocode to BRO
2004 and get useful experience for future projects.
1.1 Purpose
The aim of the Master´s thesis is to investigate the dynamic force models, regulations
and comfort criteria regarding pedestrian induced vibrations in the serviceability limit
state for lightweight timber bridges given in BRO 2004, Eurocode and the
international standard ISO 10137. The purpose of the investigation is to find
similarities and differences between the dynamic force models, regulations and
comfort criteria presented in the studied codes and standard.
In the Master’s thesis, a case study of Älvsbackabron is also included. The purpose of
the case study is to compare the resulting accelerations from the force models
presented in BRO 2004 and Eurocode. Furthermore, the effects of the transition from
BRO 2004 to Eurocode on the dynamic design of timber footbridges with respect to
pedestrian induced vibrations are studied.
An additional purpose of the case study is to measure the vertical and lateral
accelerations of Älvsbackabron to evaluate if the regulations regarding accelerations
in Eurocode and BRO 2004 are fulfilled. Besides, a damping factor of the bridge is
estimated from the results of the measurements.
1.2 Limitations
Besides the dynamic forces from pedestrian loading, wind loads may also excite
bridge structures and cause disturbing sway and motion why an assessment of the
aerodynamic behaviour of new bridges is of great importance in design. However, this
study is limited to the dynamic forces induced by pedestrians and the corresponding
bridge accelerations. Moreover, the contribution to the dynamic force from bicycle
traffic is neglected since the force does not vary in amplitude as the force from
pedestrian traffic.
Dynamic design is needed for slender, lightweight cable-stayed footbridges with free
span above 30 meters, why this study is limited to footbridges with span length above
this limit (Pousette, 2001). As the span length increases the natural frequency of a
bridge decreases resulting in a bridge which can be more susceptible to vibrations
(Stoyanoff & Hunter, 2003). 200 meters have been set as an upper limit for the span
length.
The codes regarding dynamic design of timber bridges studied in detail in this thesis
are BRO 2004, Eurocode and the international standard ISO 10137. There is no force
model for pedestrian induced vibrations in Eurocode, instead the designer is referred
to the national annex or project specific models. However, no such model is given in
the Swedish national annex, why this study of force models in Eurocode is restricted
to the complementary ISO 10137 standard. In the case study only the resulting
accelerations in the midspan from the force models presented in BRO 2004 and the
ISO 10137 standard are compared.
To evaluate the dynamic behaviour of Älvsbackabron vertical and lateral
accelerations are measured with accelerometers attached to the bridge deck during the
tests. According to Craig and Kurdila (2006) accelerations is the most common

CHALMERS, Civil and Environmental Engineering, Master’s Thesis 2012:96 3
quantity to measure when estimating the dynamic response of a structure, why
accelerometers are used as measuring device. Furthermore, the accelerations of the
pylons are not measured at the test occasions.
1.3 Method
The first part of the report is a literature study of the dynamic behaviour of
lightweight cable-stayed footbridges including regulations and recommendations for
vibrations and dynamic force models for pedestrian induced forces. The studied
regulations, comfort criteria and force models are compared respectively with the
intention to find similarities and differences. In addition, a section describing different
dynamic loading tests is included. This part of the report is mainly based on the
chapters regarding dynamic design of footbridges in BRO 2004, ISO 10137, Eurocode
0, Eurocode 1 and Eurocode 5. Besides these codes, some regulations and force
models presented in research literature are studied with the intention to expand the
comparison. This first part intends to introduce the reader to the subject and give the
needed theory for assessing the dynamic response of Älvsbackabron.
Following the literature study the second part of the report is presented, a case study
of the dynamic behaviour of Älvsbackabron. As an introduction, the city of Skellefteå
with the timber processing industry and the research project Smart Wooden Bridge in
Smart City are described. Moreover, descriptions of both the actual and the modelled
dynamic behaviour of Älvsbackabron are presented.
In this thesis, Älvsbackabron is modelled with the finite element software
Brigade/Plus, specialised for modelling bridge structures. Two models of
Älvsbackabron are established in this Master’s thesis, one with material parameters
according to BRO 2004 and the other with material parameters according to Eurocode
5. In the report, these models are referred to as Master’s thesis model according to
BRO 2004 and Master’s thesis model according to Eurocode. The Master’s thesis
model according to BRO 2004 is verified with the dynamic design model by COWI.
The verification is described in detail in Section 7.2. The Master’s thesis models are
used to compare the resulting accelerations from the force models given in BRO 2004
and ISO 10137.
In connection to the case study two test occasions and loading simulations are
described, for a more detailed description, see Section 8.2 and Section 8.3. The data
from the tests are analysed, processed and visualised using the programming software
MATLAB. Two of the dynamic loading tests at Älvsbackabron are also simulated in
the Master’s thesis model according to Eurocode and the resulting accelerations are
used in the comparison part. The case study is based on the results from the models
and the measurements from the field tests at the bridge.
Finally, comparisons between the results from the literature studie and the case study
are presented. From the literature part comparisons between the described regulations,
comfort criteria and pedestrian force models are made respectively. In the case study
comparisons of the results from the two Master’s thesis models are made. The models
are compared with respect to material parameters, natural frequencies and resulting
accelerations from the force models in BRO 2004 and ISO 10137.

CHALMERS, Civil and Environmental Engineering, Master’s Thesis 2012:96 4
2 Vibrations in lightweight cable-stayed bridges
The aspiration of using sustainable building materials in combination with increased
knowledge in advanced technology produces new opportunities in the design of new
structures. When it comes to footbridges more spectacular designs can be
accomplished, for example cable-stayed bridges with large span length (Melchor
Blanco et al., 2005). Large spans in combination with a lightweight material such as
steel or timber gives a slender bridge structure with low mass inertia which in turn
results in low natural frequencies of the bridge. Forces caused by pedestrians walking
on the bridge can result in loading frequencies within the same range as the natural
frequencies of the bridge. If the walking frequencies coincide with the natural
frequencies of the bridge resonance can occur why dynamic design of these types of
bridges is necessary (Heinemeyer et al., 2009).
In this chapter the origin of the dynamic forces induced by pedestrians in lightweight
bridges is described and how they can cause vibrations in a bridge. In addition, a
description of human reaction to different types of vibrations is included and a
mathematic model for vibrations is described.
2.1 Vibrations induced by pedestrians
The dynamic forces acting on a bridge deck origin from walking, running and
jumping pedestrians. The contribution to the dynamic force from bicycle traffic can be
neglected since the force does not vary in amplitude as the force from pedestrian
traffic. The pedestrian induced live loads can excite the bridge and cause vibrations in
both vertical and lateral direction depending on the coincidence of the frequencies.
However, there is little documentation of pedestrian induced vibrations causing
collapse or damage of a bridge in the ultimate state. Instead, the dynamic vibration
problem is a serviceability problem why a dynamic analysis is sufficient in the design
phase to assure that the bridge is free from disturbing sway (Heinemeyer et al., 2009).
2.1.1 Dynamic forces from pedestrians
When a pedestrian walks with a walking frequency of 2 Hz, up to 40% of the self-
weight is transmitted as dynamic vertical force acting on the bridge deck (Dallard et
al., 2001a). Besides the vertical component, the walking mechanism also creates two
horizontal components, one in lateral direction across the bridge and one longitudinal
in the direction of the traffic (Bachmann & Ammann, 1987). These forces are shown
in Figure 1.
The horizontal forces are smaller than the vertical force, as an example the lateral
component is ten times smaller than the dynamic vertical force. Especially the lateral
force can cause problems with sway in the bridge deck where the most famous case is
the Millennium Bridge in London (Dallard et al., 2001a). The longitudinal component
can in rare cases cause problem with disturbing motion for a bridge with low stiffness
in longitudinal direction (Bachmann & Ammann, 1987).

CHALMERS, Civil and Environmental Engineering, Master’s Thesis 2012:96 5
Figure 1 Directions of the vertical, lateral and longitudinal component of the
dynamic force from a pedestrian.
Bachmann and Ammann (1987) assign the dynamic load induced by a walking or
running pedestrian as a periodic load meaning that the load value varies in time, but
the variation is repeated over a certain time interval. A footbridge can also be exposed
to transient loading where the load varies in time without periodicity. An example is
landing from a jump which results in transient loading.
In general, the normal walking frequency for a pedestrian is about two steps per
second, 2 Hz, which results in an approximate forward speed of 1.5 m/s with a stride
length of 0.75 m. An increasing pace rate results in a vertical dynamic load with
increased magnitude plus a shortening of the contact period between the foot and the
ground (Bachmann & Ammann, 1987). This relationship is illustrated in the Figures
2-4.
Figure 2 shows a footfall for a pedestrian with a walking frequency of 1.67 Hz. It can
be seen that the maximum value of the vertical load is almost the same as the self-
weight. The two peak values of the curve represent the impact from the heel and the
forefoot respectively (Bachmann & Ammann, 1987).

CHALMERS, Civil and Environmental Engineering, Master’s Thesis 2012:96 6
Figure 2 Dynamic vertical load versus the time for one footfall at walking
frequency 1.67 Hz (Bachmann & Ammann, 1987).
A higher walking frequency results in increased maximum amplitude of the dynamic
vertical force, illustrated in Figure 3 where a footfall with walking frequency of 2.38
Hz is shown. Notable is also the shortening of the contact time for the foot compared
to the previous figure (Bachmann & Ammann, 1987).
Figure 3 Dynamic vertical load versus the time for one footfall at walking
frequency 2.38 Hz (Bachmann & Ammann, 1987).
A jogging or running pedestrian exerts a higher dynamic vertical force than the two
previous cases. The load-time curve becomes smoother since the contact time for one
foot is shorter (Bachmann & Ammann, 1987). A footfall for a jogging pedestrian is
shown in Figure 4.
Figure 4 Dynamic vertical load versus the time for one footfall when jogging
(Bachmann & Ammann, 1987).
An aspect influencing the walking frequency is the amount of pedestrians crossing the
bridge at the same time. If the bridge is heavily crowded each individual cannot move
freely, instead the crowd adapts its walking speed which is lowered. Consequently,

CHALMERS, Civil and Environmental Engineering, Master’s Thesis 2012:96 7
the walking frequency a bridge is subjected to depends both on each pedestrian and on
the amount of people crossing the bridge at the time. The expected walking frequency
in vertical direction is in the region 1.2-2.2 Hz (Dallard et al., 2001a).
The vertical vibrations are according to Dallard et al. (2001a) investigated in research
to a greater extent than the lateral vibrations and there are some codes regarding the
assessment and design concerning vertical vibrations. However, the lateral forces
causing the bridge to sway in lateral direction are not as documented, but can still
cause problems with uncomfortable vibrations.
2.1.2 Dynamic lateral forces
When a person walks the gravity centre is shifted from right to left repeatedly as the
person steps with the right and left foot. This motion is causing the lateral force and
the frequency of this force is in the range of 0.6-1.1 Hz, which is half the frequency of
the vertical load. The reason is that only every second step gives rise to a lateral force
in each direction. When a person steps with the right foot a force directed to the right
is created. In the next step the person steps with the left foot and consequently
creating a force directed to the left (Dallard et al., 2001a). Figure 5 illustrates how the
gravity centre is shifted for a pedestrian and how the lateral forces are created from
alternate steps.
Figure 5 Lateral forces caused by the lateral movement of the gravity centre of a
pedestrian (Heinemeyer et al., 2009).
If some frequencies within the frequency range of the lateral force are close to the
natural frequencies of the lightweight bridge resonance can occur. One person alone
cannot cause any significant lateral vibration in a bridge, but if a crowd walks
synchronised lateral vibrations are possible. Kawasaki and Nakamura (2006)
describes a test at a bridge where 30 students sidestepped at the same time with a
frequency close to the natural frequency of the bridge causing noticeable vibrations.
Furthermore, if the lateral forces from pedestrians do not have the same phase, the
phases will cancel each other out and no resonance occur. Kawasaki and Nakamura
(2006) explains the resonance phenomena as the human intuition of synchronizing
with the vibrations. When the bridge starts to sway a pedestrian tends to move in the
same direction as the bridge, e.g. when the bridge sway to the right a pedestrian steps
with the right foot. This results in increased vibration amplitude in the bridge,
resonance. In some literature this phenomena is also called lock-in (Dallard et al.,
2001a). However, with this theory the vibrations would increase to infinity which is
not the case in bridges where problems with lateral vibrations are observed. Kawasaki

CHALMERS, Civil and Environmental Engineering, Master’s Thesis 2012:96 8
and Nakamura (2006) explain this with the human ability of adapting the walking
speed when the magnitude of the vibrations becomes too large. When the oscillations
of the bridge grow too large from the synchronized walking pace, the pedestrians tend
to lower their walking speed or grab the hand rail, which wearies out the increasing
amplitude.
It is emphasised by Dallard et al. (2001a) that further measurements and research is
needed to establish the magnitude of the lateral force and its effect on the motion in
the bridge and at which magnitude of the sway lock-in occurs. Moreover, Ingólfsson
and Georgakis (2011) means that the importance of the pedestrian synchronization
with the bridge motion is not clearly verified in tests and the synchronization may not
be a decisive condition for lateral vibrations to occur.
2.2 Human perception of bridge vibrations
Vibrations in bridges are normally perceived as uncomfortable by the users, but at
which level vibrations become disturbing is not only highly individual but one
person´s perception can vary from one day to another. To assess the right
serviceability class for a bridge it is important to identify the tolerance level and
recommendations for vibrations in bridges (Živanović et al., 2005).
The human body can sense vibrations from below 1 Hz up to 100 kHz and there are
several ways people tend to feel pedestrian induced vibrations. For example,
vibrations in a footbridge can be experienced mechanically, meaning that a person is
sensing the deck vibrating while crossing the bridge. Vibrations could also be
experienced visually by noticing sway of the bridge deck or movement in the cables
(Bachmann & Ammann, 1987).
According to Živanović et al. (2005), it has been shown that humans are more
sensitive to vibrations in the lateral direction, but beyond the direction of the vibration
there are several other factors influencing the human sensitivity to vibrations. One
factor is the body posture, a person sitting or standing still on a bridge is more
sensitive to vibrations than a walking person.
Another aspect mentioned by Heinemeyer et al. (2009) is the number of people
walking on the bridge at the same time. It has been noted that a higher number of
people walking on a bridge gives a higher individual tolerance towards motion and
vibrations. The reasons for this, however, have not yet been established. Aspects as
exposure time at the bridge, frequency of use and height above ground also influence
the individual sensitivity to bridge vibrations (Heinemeyer et al., 2009).
Heinemeyer et al. (2009) present a survey of two footbridges with similar dynamic
properties, but with different appearances and locations. The first bridge has a slender
look and is located in the countryside while the other is located in a town with a more
strong-looking appearance. The results from the survey showed that more people were
disturbed by vibrations in the second bridge and the authors mean that this indicates
that both appearance and expected stability affects the experience of the bridge
(Heinemeyer et al., 2009).
According to Heinemeyer et al. (2009) the matter of pedestrians synchronizing with
vertical vibrations is not observed in research. The reason is that the vertical force is
absorbed by the pedestrian’s legs and joints hence damping the force resulting in no
shift of the gravity centre.

CHALMERS, Civil and Environmental Engineering, Master’s Thesis 2012:96 9
The question of what is a tolerable level of vibration does not have an unambiguous
answer. In a literature review by Živanović et al. (2005) different values for
serviceability accelerations for both vertical and lateral accelerations are given. To be
able to compare the different values presented in the literature all values are converted
into peak accelerations.
Mentioned in the review is a research which aims to describe the vertical limit
accelerations by taking into account peoples different perceptions of acceleration.
Four perception levels were defined varying from barely noticeable to greatly
unpleasant with corresponding probability. Results from this method are given as an
example for a bridge with a first natural frequency of 2 Hz. The risk that accelerations
up to a level of 0.18 m/s2 are experienced unpleasant is small and a suggested
serviceability limit for the vertical accelerations is 0.13 m/s2 (Živanović et al., 2005).
These values are low compared to a constant limit of 0.5 m/s2 which is recommended
by Bachmann and Ammann (1987).
According to Živanović et al. (2005) 1.35 m/s2 is suggested as a serviceability level
for lateral accelerations. The research by Nakamura resulting in this limit is based on
people’s perception of bridge vibrations from a full scale test at a footbridge. With
lateral accelerations of 1.35 m/s2 the pedestrians felt insecure and their walking
patterns were disturbed. Besides the serviceability limit, the value 0.3 m/s2 is given as
a level of acceleration for which it is unlikely that the accelerations are perceived
uncomfortable by the users. Limitations regarding both vertical and lateral
accelerations are described to a greater extent in Chapter 3.
2.3 Dynamic model for vibrations
To assess vibrations the transmission path, vibration source and receiver of the
vibrations need to be determined, which is the first step for characterising structures
subjected to disturbing vibrations (Anon., 2007).
For the case of a cable-stayed timber bridge both the vibration source and receiver
were described in the previous sections, namely the pedestrians. The transmission
path, however, is also important in the matter of preventing uncomfortable motion.
For a cable-stayed bridge, it is the bridge deck that acts as the transmission path by
transferring vibrations caused by one pedestrian to the receiver, another pedestrian.
The characteristics of the transmission path, such as geometric properties, material
damping and natural frequencies of the deck influence the amplitude and spreading of
the vibrations (Anon., 2007).
The mathematic model describing the dynamic behaviour of a structure with its
characteristics of the transmission path and the pedestrian induced force is called the
equation of motion and can be seen in Equation (1). It is not only the walking
frequency and number of pedestrians that are decisive in the assessment of the
dynamic behaviour, but also the mass, stiffness and damping of the bridge play an
important role (Dallard et al., 2001a).
(1)
where
is the structural mass matrix
is the structural damping matrix
CHALMERS, Civil and Environmental Engineering, Master’s Thesis 2012:96 10
is the structural stiffness matrix
is the external force
is the acceleration of the structure
is the velocity of the structure
is the displacement of the structure
A vibrating system has a stable equilibrium state to which the system tries to return.
The force that regains the equilibrium state is called the stiffness force and it is
proportional to the displacement of the system. The system must also contain mass to
vibrate, which is proportional to the acceleration. Damping is dissipation of energy in
a structure meaning that if no external forces are applied the vibrations will fade away
with time (Maguire & Wyatt, 2002).
The mass and stiffness of a footbridge can be determined with a finite element model
in which the structure is divided into a finite number of elements where the geometric
and material properties are assembled into mass and stiffness matrices. The damping
matrix, however, is difficult to model mathematically and is most often determined in
an experimental way (Živanović et al., 2005).
It can be desirable in design to influence the natural frequencies for a cable-stayed
footbridge. This can be accomplished by modifying the geometry or material
properties of the structure. By increasing stiffness of the deck, the pylons or
increasing the sectional area of the cables, the resulting natural frequency will be
higher. Pousette (2001) assigns the sectional area of the cables as the most significant
factor for increasing the natural frequency of the bridge. To increase the damping of a
structure, dampers can be installed.
According to Živanović et al. (2006), due to uncertainties regarding material
properties, support conditions and the effect of non-structural elements, the natural
frequencies calculated with a FE model may deviate from the real frequencies of a
built bridge. Dynamic testing followed by tuning the FE model is suggested as a
working method that should be used to a wider extent in civil engineering to increase
the reliability of the models (Živanović et al., 2006).

CHALMERS, Civil and Environmental Engineering, Master’s Thesis 2012:96 11
3 Regulations of vibrations in footbridges
To reduce the risk of pedestrians feeling discomfort or unsafe due to vibrations when
walking on a footbridge, regulations regarding vibrations are given in the design
codes. The value, sometimes called comfort criteria, indicate up to which limit most
people do not feel disturbed by the vibrations of the bridge. The most common factors
to set as limit values are either the natural frequency or the acceleration. The
acceleration is usually expressed in terms of maximum allowed acceleration in the
bridge deck.
It is stressed that there are many uncertainties involved in the assessment of the
dynamic performance of a footbridge, e.g. the amount of pedestrians on the bridge
during the normal use. This means that if the comfort criteria are not fulfilled with
margin it could be necessary to make extra investigations to evaluate if dampers are
needed (Anon., 2002b).
In this chapter the comfort criteria regarding pedestrian induced vibrations in
footbridges are presented for some codes. Focus in the comparison will be on the
comfort criteria given in BRO 2004 and Eurocode 0, but a few additional codes are
presented for comparison. The values are compared with the intention to investigate
the differences and similarities between different codes.
3.1 Regulations according to BRO 2004
BRO 2004 was published by the Swedish Road Administration and was until 2009 the
Swedish standard for bridge design. The bridge code was replaced by Eurocode, but
for projects procured before 2009 it is still allowed to use BRO 2004 as design code
(Trafikverket, 2012). The structural design of Älvsbackabron was procured before
2009 hence BRO 2004 was the valid design code.
The limit for vertical vibrations in footbridges is expressed in terms of a natural
frequency limit. A footbridge should be designed so that the first vertical natural
frequency of the bridge deck is higher than 3.5 Hz. During the natural frequency
analysis the loads on the bridge should be the self-weight of the structural and non-
structural elements and, if applicable, the tension forces (Anon., 2004d).
If the fist natural frequency is below 3.5 Hz, a maximum limit value for the vertical
acceleration of the bridge deck is set. This limit value is 0.5 m/s2 which is the root
mean square value of the acceleration. To transform the root mean square value into a
peak value it is multiplied by √2 which gives a peak limit value for vertical
accelerations of approximately 0.7 m/s2. No requirements or recommendations for
lateral vibrations are given in BRO 2004 (Anon., 2004d).
3.2 Regulations according to Eurocode
The Eurocodes are European standards with design rules regarding structural design
published by the European Committee for Standardization. In design of timber
bridges there are mainly Eurocode 0: Basis of Structural Design, Eurocode 1: Actions
on structures and Eurocode 5: Design of timber structures that are used (Anon., 2005).
The general restrictions of design regarding vibrations presented in Eurocode 5:
Design of Timber Structures state that the expected actions on the bridge should be

CHALMERS, Civil and Environmental Engineering, Master’s Thesis 2012:96 12
controlled so that they do not cause vibrations that may harm the structural function or
cause discomfort to the user (Anon., 2004b). In addition, comfort criteria based on the
maximum acceleration of the bridge deck should be used in the design. The criteria
could be stated in the national annex or set by the client for a specific project.
However, in the code there are some recommended values for acceleration limits, see
Table 1.
Table 1 Recommended acceleration limits in Eurocode 0 (Anon., 2005).
Acceleration limit [m/s2] Direction and occurrence
0.7 Vertical acceleration
0.2 Lateral acceleration, normal use
0.4 Lateral acceleration, exceptional crowd conditions
In dynamic design of footbridges, the natural frequencies are calculated to ensure that
the comfort criteria are met. If the natural frequency of the bridge deck is less than 5
Hz for the first vertical mode and less than 2.5 Hz for the first lateral mode a
verification of the comfort criteria should be performed (Anon., 2005).
The comfort criteria should also be verified with respect to the vibrations caused by
the dynamic pedestrian force. If the frequency of the pedestrian force coincide with
one or some natural frequencies of the bridge deck resonance could occur. This effect
must be considered in design and if there is a risk for resonance the resulting
accelerations must be investigated and fulfil the comfort criteria (Anon., 2003). The
forces from a walking and jogging pedestrian can be assumed to have frequencies
according to Table 2.
Table 2 Frequencies for normal walking and jogging (Anon., 2003).
Frequency [Hz] Direction and activity
1-3 Vertical direction, normal walking
0.5-1.5 Lateral direction, normal walking
3 Vertical direction, jogging
In the design of footbridges, the expected pedestrian traffic and design situation
should be assessed for each individual bridge. The design situation should be based on
the expected traffic during the service life of the bridge. During the service life the
bridge is subjected to a load level which can be considered its persistent loading level.
Depending on each individual project, occasionally higher load levels must be
considered such as choreographic and festive events. The surrounding activities may
also influence the amount of traffic on the bridge, for example schools and railway
stations. Recommended amount of pedestrians for the persistent load level depends on
the considered area of the bridge deck but should be between eight and fifteen people.
For the higher load levels, a significantly higher amount of people need to be
considered in the design. Still, at present, no verification rule for higher load levels are

CHALMERS, Civil and Environmental Engineering, Master’s Thesis 2012:96 13
formulated, but the designer is directed to literature and special studies of the
individual case (Anon., 2005).
3.2.1 National annexes to Eurocode
Every country using the Eurocodes has their own national annex which should be
used in conjunction with Eurocode. The national annex contains country specific
values to the notes in Eurocode which states that the national annex may apply
(Anon., 2011).
The Swedish national annex (Anon., 2011) for bridges is issued by the Swedish
Transport Administration and contains the national parameters to Eurocode. In the
design of footbridges Eurocode 0 states that the national parameters might be applied
instead of the comfort criteria suggested in code. In the Swedish annex, no further
restrictions regarding the comfort criteria are given. Instead, it is stated that the client
is allowed to assign project specific values for each individual project (Anon., 2011).
3.2.2 Suggested design requirements by JRC and ECCC
The Joint Research Centre (JRC) of the European Commission has in collaboration
with the European Convention for Constructional Steelworks (ECCC) published a
report based on research aiming to implement, develop and improve the Eurocodes
regarding design of lightweight footbridges subjected to human induced vibrations.
The results presented in the report are supposed to be applicable to Eurocode 0,
Eurocode 1, Eurocode 3 and to some parts in Eurocode 5 (Heinemeyer et al., 2009).
To assess suitable design requirements for a bridge, the designer is recommended to
classify the usage of the bridge with different traffic situations and comfort classes
into several design situations. The design situations should consider different loading
situations during the design life of the footbridge and should be individual for each
project. An example illustrating different design situations with corresponding traffic
and comfort classes is presented in Table 3. A design situation that only occurs once
in the design life of a structure is supposed to have a less strict limit regarding
accelerations than a design situation occurring daily (Heinemeyer et al., 2009).
Table 3 Example of how the traffic and comfort classes should be used when
assigning design situations for footbridges (Heinemeyer et al., 2009).
Design situation Description Traffic class Occurrence Comfort class
1 Opening TC 4 Once a lifetime CL 3
2 Commuters TC 2 Daily CL 1
3 Races TC 3 Once a year CL 2
It is suggested that the pedestrian traffic should be divided into five levels where the
first level, traffic class 1, has very weak pedestrian traffic while traffic class 5 has
exceptionally dense traffic (Heinemeyer et al., 2009). The traffic classes are described
in Table 4. The density of pedestrian traffic is calculated using Equation (2).

CHALMERS, Civil and Environmental Engineering, Master’s Thesis 2012:96 14
Table 4 Suggested traffic classes (Heinemeyer et al., 2009).
Traffic class Density,
[P/m²]
Description Characteristics
TC 1 ˂ 0.2 Very weak
traffic
Free crossing, comfortable and
free walking, choose own pace
TC 2 0.2 Weak traffic Free walking, pedestrians can
choose their own pacing rate,
overtaking possible
TC 3 0.5 Dense traffic Free walking, overtaking might
be restricted
TC 4 1.0 Very dense
traffic
Restricted waking, overtaking
not possible
TC 5 1.5 Exceptionally
dense traffic
Unpleasant waking, cannot
choose pace
(2)
where
is the density of pedestrian traffic
is the amount of pedestrians
is the width of the deck
is the length of the deck
The comfort classes are four with comfort class 1 as the class with highest demands
on the comfort. The requirements are presented as acceleration limits and the comfort
classes with corresponding limits are given in Table 5.
Table 5 Suggested comfort classes for dynamic design of lightweight
footbridges (Heinemeyer et al., 2009).
Comfort class Degree of comfort Vertical limit [m/s2] Lateral limit [m/s
2]
CL 1 Maximum ˂ 0,50 ˂ 0,10
CL 2 Medium 0,50 - 1,00 0,10 – 0,30
CL 3 Minimum 1,00 – 2,50 0,30 – 0,80
CL 4 Unacceptable ˃ 2,50 ˃ 0,80

CHALMERS, Civil and Environmental Engineering, Master’s Thesis 2012:96 15
3.3 Regulations according to ISO 10137
The International Organization for Standardization (ISO) develops several
international standards in many different technical fields. In the field of structural
engineering there are a number of standards that are related to the Eurocodes. In the
design of vibration serviceability there is one standard of particular interest, namely
ISO 10137 Basis for design of structures – Serviceability of buildings and walkways
against vibrations (Anon., 2012).
Also in the ISO 10137 standard the vibrations of footbridges are based on different
design situations occurring during the design life of the bridge. The specified design
situations from the standard are specified in Table 6. The second design situation
intends to symbolise the regular use of the bridge while the fourth situation might
never be relevant in the design (Anon., 2007).
Table 6 Design situations to consider when estimating the vibrations of a
footbridge (Anon., 2007).
Design situation Pedestrian traffic
1 Single pedestrian walking across the bridge while another
pedestrian is standing in the mid-point
2 A group of eight to fifteen pedestrians crossing the bridge.
The amount of people depends on the size of the bridge deck
3 Streams of pedestrians, much more than fifteen pedestrians
4 Exceptionally heavy traffic
The comfort criteria given in ISO 10137 state a maximum limit for the acceleration in
vertical and lateral direction respectively. The limits for each direction depend on a
specific base curve multiplied with a certain factor. The base curves for vertical and
lateral accelerations are shown in Figure 6 (Anon., 2007).

CHALMERS, Civil and Environmental Engineering, Master’s Thesis 2012:96 16
Figure 6 Base curves for lateral and vertical vibration limits according to ISO
10137. The accelerations are presented as root mean square values
(Anon., 2007).
The value for the vertical vibrations of a footbridge should not exceed the values from
the vertical base curve multiplied with a factor of 60. One exception is the first design
situation, where one person is standing still on the bridge and a factor of 30 should be
used instead. The limit values for lateral accelerations are given by multiplying the
lateral base curve with a factor of 60. The corresponding limit curves for vertical and
lateral vibrations are shown in Figure 7 (Anon., 2007).
100
101
102
10-3
10-2
10-1
100
Frequency [Hz]
Accele
ration lim
it (
r.m
.s)
[m/s
2]
Vertical acceleration limit
Lateral acceleration limit

CHALMERS, Civil and Environmental Engineering, Master’s Thesis 2012:96 17
Figure 7 Acceleration limits for vertical and lateral accelerations with
corresponding multiplication factors for footbridges according to ISO
10137. The accelerations are presented as root mean square values
(Anon., 2007).
3.4 Regulations according to the Danish standard
Belastnings- og beregningsregler for vej- og stibroer
In the Danish standard Belastnings- og beregningsregler for vej- og stibroer the limit
of the peak-acceleration for vertical vibration is given in Equation (3).
(3)
where
is the peak acceleration limit [m/s2]
is the frequency of the bridge deck [Hz]
If the maximum acceleration of the bridge deck is below this value the pedestrian
comfort is ensured. In another clause it is stated that the comfort criteria regarding
bridge sway are automatically fulfilled if the first natural frequency of the bridge deck
is above 5 Hz. Regarding a maximal limit for lateral accelerations the same method as
descried for vertical accelerations should be used. The annex also states critical
natural frequency intervals for footbridges where resonance could occur, see Table 7
(Anon., 2002a).
100
101
102
10-1
100
101
Frequency [Hz]
Accele
ration lim
it (
r.m
.s)
[m/s
2]
Vertical acceleration limit, factor 60
Vertical acceleration limit, factor 30
Lateral acceleration limit, factor 60

CHALMERS, Civil and Environmental Engineering, Master’s Thesis 2012:96 18
Table 7 Critical intervals for natural frequencies in vertical and lateral
direction (Anon., 2002a).
Frequency [Hz] Origin of force Direction
1.6-2.4 Walking Vertical
2.5-4.5 Running or higher harmonics from walking Vertical
0.8-1.2 Walking, half the vertical walking frequency Lateral
2.6-3.4 Running Lateral
3.5 Regulations according to the British Standard BS 5400
The British standard BS 5400 comprise a number of standards regarding the design of
steel, concrete and composite bridges which was the previous standard regarding
bridge design and construction in the UK, now replaced with the Eurocodes (Anon.,
2010). In conjunction with the BS 5400 a standard called BD 29/04 Design criteria for
footbridges was used in dynamic design (Anon., 2004a).
If the natural frequency for the bridge deck in vertical direction is above 5 Hz the
comfort criteria are automatically fulfilled and no further investigations are required.
The same apply if the first natural frequency in lateral direction, but for a limit of 1.5
Hz. However, if the vertical natural frequency is equal to or below 5 Hz the comfort
criteria set in Equation (4) should be fulfilled (Anon., 2004a).
√ (4)
where
is the acceleration limit in vertical direction [m/s2]
is the natural frequency in vertical direction [Hz]
Limits for vibrations in lateral direction are not specified in the code. Instead, it is
stated that suitable limits should be set together with appropriate authority. Noted is
also that the designer should be aware of that bridges with low mass and stiffness in
combination with a natural frequency below 1.5 Hz could experience large lateral
vibrations which should be prevented (Anon., 2001).

CHALMERS, Civil and Environmental Engineering, Master’s Thesis 2012:96 19
4 Pedestrian force models
In Chapter 2, the dynamic forces induced by pedestrians and its influencing factors
are described. The irregularity of the force, e.g. that the force vary both in time and
space, the synchronization phenomena and the different perception levels for each
individual pedestrian are some of the factors making the force complicated to model
mathematically. Though, in literature the force created by pedestrians is often
modelled as a perfectly periodic force depending on the walking frequency and time
(Živanović et al., 2005).
This chapter describes the force models for pedestrian loading presented in BRO
2004, Eurocode 5 and ISO 10137. In addition, some force models from research
literature are also described for comparison.
4.1 Force model according to BRO 2004
The force model from BRO 2004 for pedestrian loading on footbridges is presented in
Equation (5). The load is a harmonic vertical concentrated force which should be
placed in the most critical point of the bridge deck, e.g. the position that results in the
highest vertical acceleration. When designing according to BRO 2004 a damping
factor of 0.6% of critical damping should be used (Anon., 2004d).
(5)
√ (6)
{
(7)
where
is the pedestrian force [N]
is a bridge size coefficient [m]
is a frequency coefficient [N]
is the natural frequency of the bridge [Hz]
is the time [s]
is the width of the bridge [m]
is the length of the bridge [m]
The two coefficients and presented in Equation (6) and Equation (7) describe
some characteristics of the pedestrian force. The size of the bridge and hence the
possible amount of pedestrians on the bridge are considered by the variable . The
coefficient takes the variation of the dynamic force amplitude into account. It is
stated that the largest observed effect is for frequencies below 2.5 Hz. For the
frequencies above 2.5 Hz the coefficient includes effects from higher harmonics. No
model for the lateral force is given in the code (Anon., 2004d).

CHALMERS, Civil and Environmental Engineering, Master’s Thesis 2012:96 20
4.2 Force model according to Eurocode
In Eurocode 5, a simplified method for calculating vertical vibrations in timber
bridges is given. The method applies for simply supported or truss bridges, but not to
other bridge types. Instead, it is stated that other methods may be specified in the
national annex or for each individual project. In Eurocode 5 the damping factor for
structures with mechanical joints are set to 1.5%, which can be used if no other value
is stated in the national annex (Anon., 2004c).
4.2.1 National annexes to Eurocode
In the Swedish national annex (Anon., 2011), no force model for the pedestrian force
is given. Instead, it is the client that should choose the appropriate force model for the
dynamic force, in the same way as for the comfort criteria (Anon., 2011).
4.3 Force model according to ISO 10137
In the international standard ISO 10137 the force from a pedestrian is described with
the static weight of the pedestrian and the corresponding periodic dynamic
contribution, see Equation (8). Both the vertical and lateral component of the dynamic
pedestrian force is represented with this equation (Anon., 2007).
( ∑ ) (8)
where
is the pedestrian force, lateral or vertical [N]
is the static load from pedestrian [N]
is the integer number of the natural harmonic
is the total number of harmonics of interest
is a numerical coefficient
is the frequency of the loading [Hz]
is the time [s]
is the phase angle for the n:th harmonic
The difference between vertical and lateral direction is the numerical coefficient .
In Table 8 the values for the two coefficients for one moving pedestrian are presented.
Also noted in the standard is that the lateral numerical coefficient do not take the lock-
in phenomena into account (Anon., 2007).

CHALMERS, Civil and Environmental Engineering, Master’s Thesis 2012:96 21
Table 8 The vertical numerical coefficient and the lateral numerical
coefficient for one person (Anon., 2007).
Harmonic
number,
Numerical coefficient,
vertical direction,
Numerical coefficient,
lateral direction,
Walking 1 0.37( -1.0) 0.1
2 0.1 -
3 0.06 -
4 0.06 -
5 0.06 -
Running 1 1.4 0.2
2 0.4 -
3 0.1 -
The action from a group consisting of N people crossing the bridge can be expressed
by multiplying a coordination factor to the total pedestrian force. The coordination
factor aims to describe the amount of people in the group that tend to walk with the
same pace. The coordination factor is expressed in Equation (9) and in Equation (10)
the total force from N people is shown (Anon., 2007).
√
(9)
(10)
where
is the number of people in the group
is the coordination factor
is the total pedestrian force [N]
is the total force with respect to coordination [N]
4.4 Force model according to the Danish standard
Belastnings- og beregningsregler for vej- og stibroer
In the Danish standard Belastnings- og beregningsregler for vej- og stibroer a vertical
force model with a pulsating point load and a constant forward speed is presented
according to Equation (11) and Equation (12) respectively. The amplitude value of
360 N represents two small pedestrians walking together at the bridge. For
substantially larger groups of pedestrians, a higher value of the amplitude should be
used, especially for natural frequencies between 1.3 and 2.7 Hz. For an appropriate

CHALMERS, Civil and Environmental Engineering, Master’s Thesis 2012:96 22
value, the designer is referred to the literature. The Danish standard proposes a
damping factor for timber constructions that is 1.2% (Anon., 2002a).
(11)
(12)
where
is the pedestrian force [N]
is the natural frequency of the bridge [Hz]
is the time [s]
is the velocity of the pedestrian [m/s]
If the natural frequency is larger than 4 Hz, the calculated maximum acceleration can
be reduced by a factor that varies linearly from 0% reduction at 4 Hz to 70%
reduction at 5 Hz. No force model for the lateral force is presented in the annex
(Anon., 2002a).
4.5 Force model according to British Standard BS 5400
In the British code BS 5400 a general method for modelling the vertical dynamic
force is given that resembles the one described in the Danish standard. The force
model is described in Equation (13). The pedestrian force should be applied at the
bridge deck with the velocity described in Equation (14) (Anon., 2001).
(13)
(14)
where
is the pedestrian force [N]
is the natural frequency of the bridge [Hz]
is the time [s]
is the velocity of the pedestrian [m/s]
The only difference between the Danish model and this is the amplitude. In this case
the amplitude symbolises one person walking on the bridge instead of two (Anon.,
2001).
4.6 Force models presented in research literature
In research literature a number of other force models than those presented above are
described. These models attempt to take different characteristics of force into account,
such as the synchronization phenomena and the irregularity of the force.
According to Occhiuzzi et al. (2008) the model for the vertical pedestrian force
presented in ISO 10137 characterises the walking force reasonably good, but for
running it fails to describe the irregularity of the force. During walking one foot is
always in contact with the ground, but for running there is a time interval every period
where the person does not have contact with the ground meaning that the force

CHALMERS, Civil and Environmental Engineering, Master’s Thesis 2012:96 23
becomes discontinuous. In Equation (15) and Equation (16) a force model is presented
where each step is divide in a period of contact with the ground and a period without
contact (Occhiuzzi et al., 2008).
(
) (15)
(16)
where
is the pedestrian force [N]
is a load amplification factor
is the mass of the runner [kg]
is the gravity constant [m/s2]
is the stepping frequency [Hz]
is the time [s]
is the number of steps
is the period of a step
is a factor expressing the contact time
The human nature of synchronizing with the lateral movement of the bridge deck is
another aspect of the dynamic pedestrian force that is taken into account in the two
force models presented below. The force model in Equation (17) by Nakamura and
Kawasaki (2009) takes this aspect into consideration by the synchronization function
presented in Equation (18).
The function takes into account how one pedestrian synchronise with the
girder movement depending on the velocity of the girder. If the velocity of the girder
becomes too high, the pedestrians adapt their walking frequencies or grabbing the
hand rail to decrease the girder velocity and hence stop the synchronization with the
bridge. This is considered by the synchronization function since the function has a
linear behaviour for small velocities resulting in a certain increase rate of the
synchronization. However, for higher velocities the increase rate of the
synchronization function decreases.
(17)
(18)
where
is the pedestrian force [N]
is the velocity of the bridge [m/s]
is a pedestrian girder movement synchronization function
is the natural frequency of the bridge [Hz]
is a pedestrians frequency synchronization coefficient
is the modal self-weight of the pedestrian
is a numerical coefficient

CHALMERS, Civil and Environmental Engineering, Master’s Thesis 2012:96 24
is the lateral force / pedestrian weight ratio
is a girder vibration synchronization coefficient
is the time [s]
The Millennium Bridge in London is one of the most famous bridges which have had
problems with lateral vibrations due to crowd synchronization. Dallard et al. (2001b)
have presented a force model for the lateral dynamic pedestrian force which is
proportional to the lateral movement of the bridge. In Equation (19) the total lateral
force from pedestrians is shown.
∑
(19)
where
is the pedestrian force [N]
is the pedestrian number
is the total number of pedestrians
is the mode shape
is a bridge dependent numerical coefficient
is the lateral velocity of the bridge [m/s]

CHALMERS, Civil and Environmental Engineering, Master’s Thesis 2012:96 25
5 Dynamic testing of timber bridges
Assessments of the dynamic behaviour of slender lightweight footbridges are
necessary in the design. A dynamic model based on the finite element method is most
often established for analysing and evaluating the characteristic parameters of the
structure during the design phase. The dynamic parameters of interest are the natural
frequency, the damping factor, the mode mass and the modal shape which together
describes the dynamic performance of a structure. The main difficulty is to establish
the damping factor for a composite structure. In design, an assumed value is used for
the damping, but the real value cannot be calculated (Ohlsson, 1995).
The dynamic properties of a bridge can be determined by measuring the acceleration
with accelerometers in a test with a known applied force e.g. by performing
experimental modal testing. This chapter aims to shortly describe this method and
different types of test methods that can be used for assessing the dynamic properties
of a bridge.
5.1 Experimental modal analysis
The experimental modal analysis is used for determining the modal properties, such as
natural frequencies, damping factors and mode shapes for a built structure. The
method comprises vibration tests from which the data is analysed and frequency-
response functions are established from which, in turn, the modal properties are
estimated. Both the displacement and velocity of a node due to an induced force can
be measured in a vibration test, but according to Craig Jr. and Kurdila (2006) the
acceleration is the most common output to measure in a vibration test. To measure
bridge accelerations piezoelectric accelerometers are the most commonly used device.
In the test, the piezoelectric accelerometers are attached to the structure which is
excited by a force. The measured accelerations are then transformed in to electric
signals which are proportional to the accelerations (Craig Jr & Kurdila, 2006).
According to Ohlsson (1995), the choice of both locations of the measuring devices
and the point for applying the force are important. Initial knowledge regarding the
expected mode shapes and natural frequencies of the bridge are required to place the
measuring devices in the positions and directions that will give the information of
interest, for example nodes or the point where the displacements are the largest. If the
load is applied in only one point, Ohlsson (1995) emphasizes that it is essential that
the point do not coincide with a node. In Figure 8 a schematic mode shape is shown
where the mid-point is a node, a point that does not move during oscillation. If the
load should be placed in a node of a mode shape of a structure no excitation of this
mode occurs.
Figure 8 Schematic picture of a mode shape with a node in the middle.

CHALMERS, Civil and Environmental Engineering, Master’s Thesis 2012:96 26
Both the input and output, for example force and acceleration, in the experimental
modal analysis need to be transformed from a time domain into a frequency domain.
This is called Fourier transformation. When measuring a signal over a period T, it is
of importance that the sampling frequency is high enough to avoid aliasing meaning
that enough number of samples is measured so the signal is characterised in the right
way. Aliasing means that the frequency of the signal is characterised incorrect due to
peak accelerations. The Nyquist sampling theorem states that the sampling frequency
should be greater than twice the maximum frequency of the sampled signal. By using
the Fourier transforms of the measured input and output it is now possible to establish
the frequency response functions of the bridge (Craig Jr & Kurdila, 2006).
5.2 Dynamic test methods for bridges
To create measurable accelerations in an existing bridge, a force with certain
magnitude and frequency need to be applied at a certain position. All these factors
depend on the dynamic properties of the bridge, which in most design are calculated
with finite element software. By looking at the calculated mode shapes in advance, the
point for applying the load can be decided and from the calculated natural frequencies
the frequency of the applied force can be estimated (Živanović et al., 2006).
The response from the excitation is most often measured with accelerometers attached
to the bridge. Below are some methods for simulating excitation loads at a bridge.
5.2.1 Impact tests
In this test, a weight is dropped at a certain point to cause an impact on the bridge.
From the response, the dynamic properties of the bridge are estimated. It is of
importance that no one is walking on the bridge during the test. The main advantage is
that the test is repeatable, both the magnitude and the application point of the force
can be exactly the same in several tests. The drawback is how the arrangement from
which the load should be falling should be built up which often can be unwieldy
(Jürisoo et al., 1980).
The ideal test set up is to do a snap-back test where a weight is hanged underneath the
bridge in a rope. The rope is cut off and the resulting accelerations are measured. This
procedure is easy to model in finite element software and therefore it is easy to verify
the model. In many cases the test is not possible, instead the weight is dropped on the
bridge and left on the bridge during the measurement. When analysing the results the
additional mass and the changed initial conditions must be included in the
calculations. Furthermore, it can be difficult to excite the bridge at the lowest
frequencies with this test method (Jürisoo et al., 1980).
An easy way to do an impact test is to use the heel impact method. One person or a
group of people are standing on their toes and then falling back on the heels causing
impact on the bridge. The test is favourable since no special equipment is needed to
cause the impact and the impact force is within a suitable frequency range that is
possible to measure (Jürisoo et al., 1980).

CHALMERS, Civil and Environmental Engineering, Master’s Thesis 2012:96 27
5.2.2 Controlled walking
People walking randomly and falling in to the same pace is the normal loading
situation for a footbridge and may cause vibrations in both vertical and lateral
direction. In this test, a number of people are walking on the bridge to simulate a real
loading situation. They can either be keeping step in walking or just walk randomly
depending on how the test is designed. This test is easy to perform since no additional
loading devices and test set ups are needed. The disadvantage with the test is that it is
not repeatable, meaning that the exact loading frequency cannot be reproduced. It is
hard to know the exact location and magnitude of the forces from all the individuals’
feet and also to recreate the same walking pattern (Jürisoo et al., 1980).
5.2.3 Electrodynamic shaker
According to Živanović et al. (2005), the best method for testing is to use a shaker
that is hydraulic or electrodynamic and produces a controlled force with known
application point. Since it is a controlled force, the test needs shorter time for
completion, which will cause fewer disturbances on the bridge traffic than other tests.
Downsides with this test method are that frequencies below 1 Hz are hard to excite
with enough amount of force, and the shakers are expensive, which causes the test
method to become the most expensive way to test the bridge (Živanović et al., 2005).

CHALMERS, Civil and Environmental Engineering, Master’s Thesis 2012:96 28
6 Case study of Älvsbackabron
In recent years, there has been a trend towards building footbridges in cities with the
motivation of decreasing motor traffic and consequently improving the air quality and
living standards. Furthermore, a new bridge can be seen as a landmark and illustrate
the city as modern and new thinking. This often require more creativeness and
innovation by the architect and structural engineer, since the design of such a bridge
can be both aesthetically demanding and technically advanced (Occhiuzzi et al.,
2008).
This is the case for Älvsbackabron which is a slender cable-stayed footbridge in the
centre of Skellefteå, which can be seen in Figure 9. This chapter aims to describe the
structural system of Älvsbackabron and introduce the reader to the Swedish timber
processing industry and describe Västerbotten as a timber promoting county. Also
included is a description of the research project Smart Wooden Bridge in Smart City
and its participants.
Figure 9 The slender profile of Älvsbackabron. The picture is taken from
Anderstorp located on the south side of the river.
6.1 The structural system of Älvsbackabron
In a cable-stayed bridge, the bridge deck is supported by cables connected to pylons.
Cable-stayed bridges are suited for design situations where large spans must be
bridged without introducing new support placements. Crossing highways, railways

CHALMERS, Civil and Environmental Engineering, Master’s Thesis 2012:96 29
and watercourses are examples of situations where an increasing amount of support is
unfavourable (Pousette, 2001).
Älvsbackabron is a symmetrical cable-stayed bridge with one span and two pylons,
shown in Figure 10. The bridge spans 130 meters over Skellefteå River creating a
crossing between Anderstorp and Älvsbacka, two districts of Skellefteå. The bridge
deck is slightly curved where the mid-point is about one meter above the end points.
Figure 10 Overview of the symmetric Älvsbackabron with a span of 130 meters.
The height of the pylons are 23 meters and one pylon consists of two glulam columns
with four glulam cross beams and steel cross bracing to stabilise the pylon. The south
pylon is shown in Figure 11 where the anchorage cables also can be seen. The cables
are anchored in concrete foundations on the landside. At the top of each pylon column
a total amount of six cables are connected, two anchorage cables and four cables in
opposite direction supporting the bridge deck.
Figure 11 The south pylon of Älvsbackabron with its anchorage cables and
concrete foundations

CHALMERS, Civil and Environmental Engineering, Master’s Thesis 2012:96 30
Figure 12 shows the bridge from below. The main beam consists of three glulam
beams glued together creating one beam with the dimensions 645x1125 mm. The
main beams are supported by steel cross beams every 16.25 meters to which the
cables are connected at each side. Glulam cross beams are connecting the two main
beams with distance of 2.5 meters. On top of the glulam cross beams purlins are
placed to carry the deck of wooden planks. To stabilise the bridge deck steel cross
bracing are used which also can be seen in Figure 12. The main beams of the deck and
the cross beams and columns of the pylons are covered with yellow painted panels for
weather protection.
Figure 12 Älvsbackabron from below. The main beams are supported by steel
cross beams to which the cables are attached. The glulam cross beams,
timber purlins and steel cross bracing can also be seen.
6.2 Skellefteå and the timber processing industry
The city of Skellefteå is situated in the northern part of Sweden in Västerbotten
County. The timber processing industry has a traditional and important value for the
county since it employs a big part of the population (Nationalencyklopedin, 2012).
Martinsons AB, one of the biggest wood processing companies in Sweden, is located
in the Västerbotten County and is specialised in building timber bridges and building
systems for frameworks in timber for multi-storey residential houses. In addition, the
company has its own saw mill and is also the largest producer of glulam products in
Sweden (Martinsons, 2012).
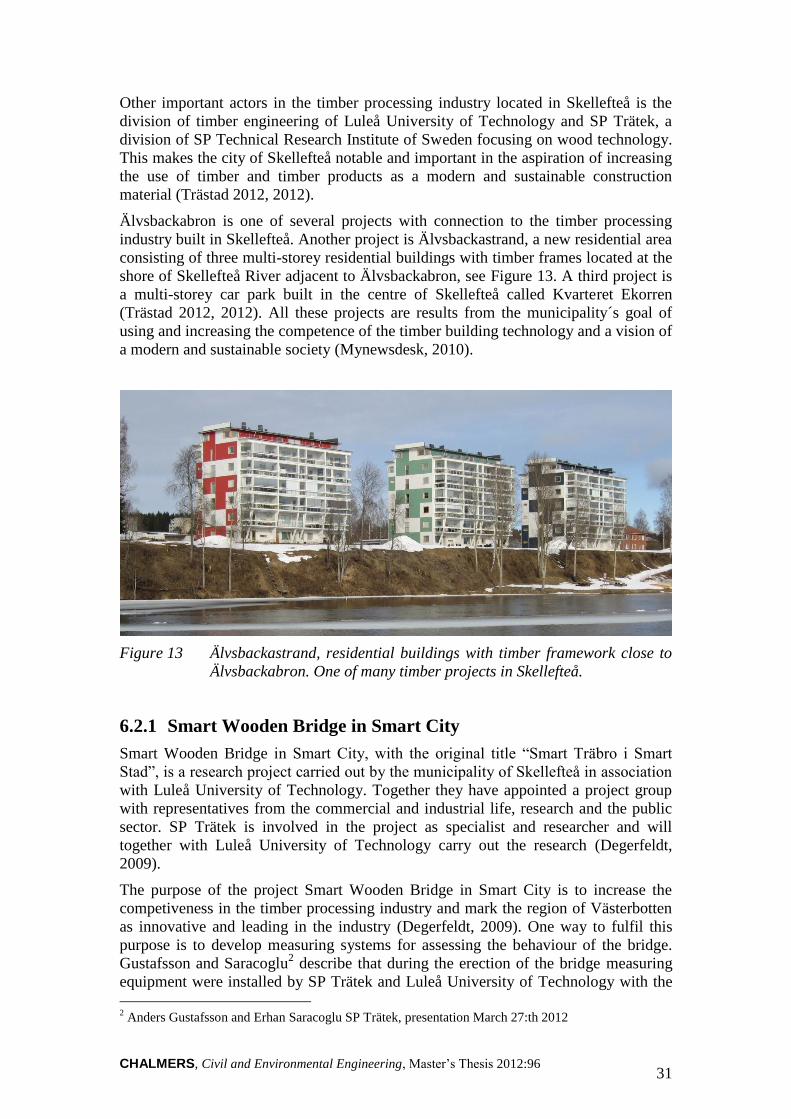
CHALMERS, Civil and Environmental Engineering, Master’s Thesis 2012:96 31
Other important actors in the timber processing industry located in Skellefteå is the
division of timber engineering of Luleå University of Technology and SP Trätek, a
division of SP Technical Research Institute of Sweden focusing on wood technology.
This makes the city of Skellefteå notable and important in the aspiration of increasing
the use of timber and timber products as a modern and sustainable construction
material (Trästad 2012, 2012).
Älvsbackabron is one of several projects with connection to the timber processing
industry built in Skellefteå. Another project is Älvsbackastrand, a new residential area
consisting of three multi-storey residential buildings with timber frames located at the
shore of Skellefteå River adjacent to Älvsbackabron, see Figure 13. A third project is
a multi-storey car park built in the centre of Skellefteå called Kvarteret Ekorren
(Trästad 2012, 2012). All these projects are results from the municipality´s goal of
using and increasing the competence of the timber building technology and a vision of
a modern and sustainable society (Mynewsdesk, 2010).
Figure 13 Älvsbackastrand, residential buildings with timber framework close to
Älvsbackabron. One of many timber projects in Skellefteå.
6.2.1 Smart Wooden Bridge in Smart City
Smart Wooden Bridge in Smart City, with the original title “Smart Träbro i Smart
Stad”, is a research project carried out by the municipality of Skellefteå in association
with Luleå University of Technology. Together they have appointed a project group
with representatives from the commercial and industrial life, research and the public
sector. SP Trätek is involved in the project as specialist and researcher and will
together with Luleå University of Technology carry out the research (Degerfeldt,
2009).
The purpose of the project Smart Wooden Bridge in Smart City is to increase the
competiveness in the timber processing industry and mark the region of Västerbotten
as innovative and leading in the industry (Degerfeldt, 2009). One way to fulfil this
purpose is to develop measuring systems for assessing the behaviour of the bridge.
Gustafsson and Saracoglu2 describe that during the erection of the bridge measuring
equipment were installed by SP Trätek and Luleå University of Technology with the
2 Anders Gustafsson and Erhan Saracoglu SP Trätek, presentation March 27:th 2012

CHALMERS, Civil and Environmental Engineering, Master’s Thesis 2012:96 32
purpose to create a database containing different measured data. Accelerometers,
weather sensors, GPS systems, hygrotracs, strain gauges and a camera were installed
at the bridge. From the database the performance of the bridge during pedestrian
traffic, heavy weather and seasonal changes can be analysed. Furthermore, knowledge
concerning methods for evaluating the quality of the structural components in a
timber bridge will be gained and the understanding of how maintenance of a timber
bridge should be performed will be increased (Degerfeldt, 2009).
The effects of the project do not only include aspects involving improvement and
development of the timber processing industry and research in the field, but also
positive effects such as decreasing the motor traffic in the centre of Skellefteå and
improving the health and standard of living for the people of Skellefteå are expected
results from the new bridge (Degerfeldt, 2009). A scenic picture of the bridge is
shown in Figure 14.
Figure 14 The scenic view of Älvsbackabron. The new bridge is supposed to
improve the living standard for the people of Skellefteå.
Martinsons Träbroar AB is a representative from the project group who will
contribute to the research with time in the project group. According to Jacobsson
(2009) their main interest in the research project is to increase the knowledge of the
dynamical behaviour in this type of large timber bridges. By measuring the
oscillations of Älvsbackabron caused by pedestrians and wind, the dynamical
behaviour of the bridge can be studied and compared with the theoretical calculations.
With the gained knowledge the timber bridge design can be improved and in turn
strengthen timber bridges as a competitive bridge type. There are important
environmental advantages in increasing the understanding and competence in timber
bridge design. One benefit in using timber as a construction material is that the

CHALMERS, Civil and Environmental Engineering, Master’s Thesis 2012:96 33
material is a local and renewable resource. An advantage of the bridge type is that it
has little influence on watercourses, both during construction and when finished
(Jacobsson, 2009).
Smart Wooden Bridge in Smart City is partly financed by a contribution from the
European Regional Development Fund. The contribution is within intervention 1.2
Innovation and renewability with the incentive of creating sustainable development by
reinforcing the competitiveness and innovation in the region of Övre Norrland
(Puranen, 2011). Five million Swedish kronor were given to the municipality of
Skellefteå and Luleå University of Technology where three millions were dedicated to
the research project and two millions were given to the execution of the bridge.
Remaining costs for the bridge, 25 million, were paid by the municipality of
Skellefteå (Byggindustrin, 2010).

CHALMERS, Civil and Environmental Engineering, Master’s Thesis 2012:96 34
7 Modelling of Älvsbackabron
In the Master’s thesis, two finite element models of Älvsbackabron are established in
Brigade/Plus. One of the models is established with material properties according to
BRO 2004 and compared with the dynamic design model by COWI AB. The dynamic
design model was made in 2010 by Thomas Hallgren3, structural engineer at COWI
AB. This model is later referred to as the dynamic design model by COWI.
The two Master’s thesis models are modelled in the same way, but with material
parameters which are based on either BRO 2004 or Eurocode 5. These models are
referred to as Master’s thesis model according to BRO 2004 and Master’s thesis
model according to Eurocode. In this chapter the dynamic design by COWI will be
presented followed by the Master’s thesis models.
7.1 Structural model of the bridge
In both the dynamic design model of the bridge and in the Master’s thesis models the
same kind of elements is used. The main beams, pylons and the cross beams in pylons
and the deck are modelled using beam elements. The deck is modelled as shell
elements, where the material stiffness and weight of the purlins and timber planks are
weighted to simulate the real arrangement and behaviour. The third element used in
the model is truss elements for the cables and cross bracing. The structural system of
the bridge is illustrated in Figure 15.
Figure 15 Structural model of Älvsbackabron.
7.1.1 Dynamic design by COWI
The dynamic design of Älvsbackabron was carried out by COWI in Gothenburg in
cooperation with the division for aerodynamics from COWI Denmark. The finite
element software called NEiNastran with the pre- and postprocessor Femap was used
for the dynamic analyses of Älvsbackabron. Included in these analyses are both
3 Thomas Hallgren, structural engineer COWI AB

CHALMERS, Civil and Environmental Engineering, Master’s Thesis 2012:96 35
impact from wind and corresponding aerodynamic instability and the dynamic effects
from pedestrian traffic4. The pedestrian induced vibrations are of main interest in this
thesis, why no further considerations regarding the aerodynamic design are made.
In Table 9, the input data from the dynamic design model by COWI are shown. The
same data are later used for verifying the Master’s thesis model according to BRO
2004.
Table 9 Input data from the dynamic design model by COWI and the Master’s
thesis model according to BRO 2004.
Young’s
modulus [GPa]
Poisson’s
Ratio
Density
[kg/m3]
Shear modulus
[GPa]
Deck 4.846 - 454 0.323
Glulam 13 0.4 600 4.643
Steel 210 0.3 7850 80.769
Cable 200 0.3 7850 76.923
7.1.2 Simplifications and assumptions in the Master’s thesis models
The Master’s thesis models are created with the finite element software Brigade/Plus
and all dynamic analyses are performed with linear analysis. In the models a number
of simplifications of the bridge structure are done.
In reality the cables are attached to the top of the pylons with steel attachments, which
can be seen in Figure 16. In the model, however, all cables are attached directly to the
pylon tops. The simplification results in a small change of angle for the cables, but
these effects are considered negligible.
Further simplifications related to the pylons are regarding the two anchorage cables
which in one end are attached to the column top and in the other end are attached to
the concrete foundation. The connection to the top of the pylon is seen in Figure 16
and to the concrete foundation in Figure 17. The cables are modelled as one cable
with an increased cross section area corresponding to the total area of the two cables.
4Thomas Hallgren, structural engineer COWI AB, meeting March 21:th 2012

CHALMERS, Civil and Environmental Engineering, Master’s Thesis 2012:96 36
Figure 16 The pylon top to which the anchorage cables are attached to.
Simplifications are made in the model both regarding the steel
attachment and the anchorage cables.
The connection of the anchorage cables to the concrete foundation is not modelled
either. Instead, the end of each modelled cable is restrained to move in all directions
in the model.
Figure 17 Connection of the anchorage cables to the concrete foundation at the
north side of the bridge. The cables are modelled as one cable with a
cross section area corresponding to the total area of the two cables.
The pylons are in reality connected with steel connections to the concrete foundations
which in turn are piled to the ground. Both the connection between pylon and concrete
foundation and the foundation to the piles are simplified in the model. The support
conditions are modelled with spring element which simulates the effect from the piles.
In the dynamic design model by COWI the piles are modelled, but the difference

CHALMERS, Civil and Environmental Engineering, Master’s Thesis 2012:96 37
between piles and spring elements are negligible5. The spring elements are connected
directly to the pylons meaning that the steel connection is excluded in the model. The
real connection can be seen in Figure 18.
Figure 18 The connection between one pylon and the concrete foundation. In the
finite element model the steel connection is excluded.
Other assumptions in the model are the connections between the cross beams and the
main beams. These connections are modelled as rigid connections, but in reality they
consist of steel connectors and screws which are not fully rigid. The deck is, as
described previously, modelled as a shell with weighted material parameters. For a
more detailed description of the modelling process in Brigade/plus, see Appendix A.
7.2 Master’s thesis models
The Master’s thesis model according to BRO 2004, based on material parameters
from BRO 2004, is verified with the dynamic design model by COWI by using the
same material parameters. The reason for this is to avoid possible modelling mistakes
in the Master’s thesis models and insure that the differences in results between the
two Master’s thesis models do not depend on modelling mistakes, but instead
differences between the codes.
Some results from the verification of the Master’s thesis model according to BRO
2004 are shown in Table 10. The static deflection due to service load and the first
natural frequencies of the bridge deck are compared for the dynamic design model by
COWI and the Master’s thesis model according to BRO 2004. The differences
between the models are considered reasonably small why the Master’s thesis models
are considered reliable.
5Thomas Hallgren, structural engineer COWI AB, meeting March 21:th 2012

CHALMERS, Civil and Environmental Engineering, Master’s Thesis 2012:96 38
Table 10 Verification of Master’s thesis model according to BRO 2004 with the
dynamic design model by COWI by comparing some results from the
models.
Comparison element COWI Master’s thesis model
according to BRO 2004
Deflection due to uniformed
pedestrian load 4 kN/m2
166 mm 163 mm
First lateral natural frequency 0.614 Hz 0.620 Hz
Second lateral natural frequency 1.415 Hz 1.386 Hz
First vertical natural frequency 1.448 Hz 1.441 Hz
Second vertical natural frequency 1.902 Hz 1.899 Hz
The only differences between the two Master´s thesis models are the material
properties given in the codes. The material properties that are used in the Master’s
thesis model according to Eurocode are presented in Table 11.
Table 11 Input data for Master’s thesis model according to Eurocode.
Young’s
modulus [GPa]
Poisson’s
Ratio
Density
[kg/m3]
Shear modulus
[GPa]
Deck 5.923 - 259 0.372
Glulam 13.7 0.4 430 4.893
Steel 210 0.3 7850 80.769
Cable 210 0.3 7850 80.769
The force models for the dynamic pedestrian force presented in BRO 2004 and ISO
10137 are simulated in both the models and the results from Brigade/Plus is presented
in Section 9.1 and Section 9.2.
The force model given in ISO 10137 consists of a Fourier series which takes the
contribution from higher harmonics into account by introducing a phase angle. The
force model can be seen in Equation (20). A recommended value for the phase angle
is a shift of 90˚ (Anon., 2007). The resulting force is periodic, but not harmonic due to
the phase shifts.
∑ (20)
To be able to apply the vertical force model given in ISO 10137 over a frequency
interval in Brigade/Plus, the force has to be harmonic. In Figure 19, the force model in
Equation (20) with phase shift and the simplified harmonic force model are shown. To
simplify the force model the phase shift is neglected, but the magnitude of the first
three vertical harmonics are still considered by taking their contribution by into

CHALMERS, Civil and Environmental Engineering, Master’s Thesis 2012:96 39
account. The lateral force model only takes the first harmonic into account and
therefore no simplification is needed.
Figure 19 Force model according to the ISO 10137 standard with a phase shift of
90˚ for the second and third harmonic as presented in Equation (20).
Furthermore, a simplified force model without the phase shift is
described. The simplification results in a harmonic force.
The force amplitudes for the different force models are presented in Table 12. In the
ISO 10137 model the static weight of a pedestrian is included in the force amplitude,
which in this study is assumed to be 80 kg. The sum of the three first -factors that
are used in the simplified ISO 10137 force model is 0.3.
One of the recommended design situations in ISO 10137 is a stream of pedestrians
significantly larger than fifteen pedestrians. In the simplified force model, a group of
fifty pedestrians is chosen, which means that √ pedestrians are assumed to walk
with the same pace.
In BRO 2004 no force model regarding lateral vibrations is given. Instead, as
described in Section 2.1.1, 10% of the vertical force is assumed to act as a lateral
force in the calculations. The different loads are all harmonic periodic forces and the
resulting accelerations will be calculated over a frequency sweep from 0 to 5 Hz.
0 0.5 1 1.5 2 2.5 3 3.5 4 4.5 50.5
0.6
0.7
0.8
0.9
1
1.1
1.2
1.3
1.4
1.5
Time [s]
Load/s
tatic w
eig
ht [-
]
Force model from ISO 10137 with phase shift
Simplified force model from ISO 10137 without phase shift

CHALMERS, Civil and Environmental Engineering, Master’s Thesis 2012:96 40
Table 12 Force amplitudes for the dynamic pedestrian forces used in Section 9.1 and
Section 9.2. These values are used for calculating accelerations in the
bridge deck of the two models.
Code Vertical force
amplitude [N]
Lateral force
amplitude [N]
BRO 2004 1082 108
ISO 10137, 1 runner 1520 160
ISO 10137, 1 pedestrian 240 80
ISO 10137, 10 pedestrians 760 250
ISO 10137, 50 pedestrians 1700 565

CHALMERS, Civil and Environmental Engineering, Master’s Thesis 2012:96 41
8 Acceleration measurements at Älvsbackabron
The accelerations in the bridge deck at Älvsbackabron are measured at two occasions.
As an interesting detail it can be mentioned that the local newspaper Norran made an
article about the second occasion and the research project Smart Bridge in Smart City
(Dhyr, 2012). The article can be found in Appendix B. In this chapter the equipment
used for measuring at Älvsbackabron will be presented together with the performed
tests at the bridge. In the description of the tests some of the theoretical results are
presented to motivate the frequencies used in the tests.
8.1 Measuring equipment
In this report, the accelerations in the bridge deck are of main interest. To be able to
measure the accelerations of the bridge, a portable measuring device is used during
the tests. This measuring device consists of piezoelectric accelerometers connected to
a data acquisition module which in turn is connected to a computer. Two of the
accelerometers and the data acquisition module are shown in Figure 20. With this
device up to four accelerometers can be connected at the same time.
Figure 20 Portable measuring device consisting of accelerometers attached to a
data acquisition module. The accelerometer mounted directly on the
bridge deck measures the vertical accelerations while the other
measures lateral accelerations.
During the first test occasion in March four ICP accelerometers of model number
V356A11 were used and for the second test occasion in May four ICP accelerometers

CHALMERS, Civil and Environmental Engineering, Master’s Thesis 2012:96 42
of model number 393B12 were used. Information and calibration certificates for the
accelerometers used at Älvsbackabron are shown in Appendix C. Two of these
accelerometers were mounted at the middle of the bridge span and two others at the
quarter of the bridge span, according to Figure 21. At each position one accelerometer
measures the accelerations in vertical direction and the other measures in the lateral
direction.
Figure 21 Middle and quarter of the bridge span where the loading and
accelerometers are positioned.
8.2 Tests performed at Älvsbackabron
To verify the dynamic design of Älvsbackabron three different tests were conducted
on the bridge. The tests were controlled walking, controlled jumping and heel impact.
Also, continuous measurements were made to investigate the level of the
accelerations during normal use of the bridge. Frequencies for the controlled walking
and jumping tests were chosen according to theoretical natural frequencies calculated
in the Master’s thesis models of Älvsbackabron. The natural frequencies calculated
with the two Master’s thesis models differ slightly from each other. This is the reason
why two similar frequencies are chosen to excite a specific mode in the controlled
walking and jumping tests.
The tests were performed at two different occasions, one in March and one in May.
During all tests, except the continuous measurements, the bridge was closed to traffic
to avoid disturbances.
8.2.1 Controlled walking test
To create measureable accelerations in the bridge deck, a number of repeated
controlled walking tests were performed. A description of the controlled walking tests
is presented in Section 5.2.2. During the test a group of eight people walked over the
bridge with the same pacing rate. The different paces were indicated by a metronome
and in Table 13 the tested walking frequencies are presented and the corresponding
mode shapes that were supposed to be excited. The natural frequency of the lateral
mode is half the walking frequency due to the fact that only alternate step give rise to
a lateral force in each direction.

CHALMERS, Civil and Environmental Engineering, Master’s Thesis 2012:96 43
Table 13 Walking frequencies for the controlled walking tests and their corresponding
mode shapes.
Walking frequency [Hz] Excited mode shape
1.4 First vertical and lateral
1.5 First vertical and lateral
1.9 Second vertical
Figure 22 shows one of the walking tests at Älvsbackabron in March. The controlled
walking tests are performed with the intention of simulating possible loading
scenarios that can arise on the bridge.
Figure 22 One of the walking tests at Älvsbackabron with controlled walking
frequency.
8.2.2 Jumping test
The jumping test aims to simulate the performance of an electrodynamic shaker,
which was described in Section 5.2.3. The group of eight people jumped in a certain
frequency to create a periodic load that acted on one point of the bridge. A picture of
one jumping test is shown in Figure 23.

CHALMERS, Civil and Environmental Engineering, Master’s Thesis 2012:96 44
Figure 23 One of the jumping tests performed at Älvsbackabron (Eriksson, 2012).
To excite the first vertical mode, the jumping group was positioned in the middle of
the bridge and to excite the second vertical mode the group jumped in the quarter of
the bridge span, see Figure 21. The jumping positions, frequencies and expected mode
shapes are presented in Table 14. From the tests the acceleration can be evaluated and
a damping factor for the bridge can be calculated.
For all the jumping tests the group jumps for about 30 seconds and afterwards remains
stationary for about 30 seconds.
To excite the lateral mode ice skating jumps are performed at the middle of the
bridge. The frequency for this type of jumps is twice the expected natural frequency
since only every second jump gives rise to a lateral force in each direction. The
expected natural frequency is around 0.7 Hz and therefore the jumping frequency is
chosen to 1.4 Hz, see Table 14.
Table 14 Jump direction, position and frequency together with the expected mode
to excite.
Jump direction Load position Jumping frequency [Hz] Mode
Vertical L/2 1.4 First vertical
Vertical L/2 1.5 First vertical
Vertical L/4 1.9 Second vertical
Vertical L/4 2.1 Second vertical
Lateral L/2 1.4 First lateral

CHALMERS, Civil and Environmental Engineering, Master’s Thesis 2012:96 45
8.2.3 Heel impact test
To induce a simple impact load on the bridge as described in Section 5.2.1 the heel
impact test is performed. The heel impact test was performed at the bridge in the
midspan and in the quarter of the span. The same group as in the previously described
tests were standing on their toes close together and falling back on their heels at the
same time. At each test, this procedure was repeated two times with 30 seconds
interval during which all the test participants were standing still. The purpose of the
test is to estimate a damping factor.
8.2.4 Continuous measurements
The accelerations of the bridge deck during the regular use of the bridge are of interest
when evaluating the performance of the bridge. To obtain measurements reflecting the
regular use of the bridge measurements at Älvsbackabron were conducted during two
afternoons with the accelerometers placed in the middle and the quarter of the bridge
deck. From these tests, the largest accelerations due to normal use can be measured.
8.3 Simulation of tests in Brigade/Plus
The jumping tests and the heel impact tests are simulated in the Master’s thesis
models in Brigade/Plus to achieve theoretical data for the comparison. The theoretical
forces from the tests are presented together with other relevant input data.
The jumping tests are modelled in Brigade/Plus with a pulsating force with the shape
of a half-sine curve. A graph of the force is shown in Figure 24. The maximum
amplitude of the dynamic force is assumed to be three times the static weight of the
group (Bachmann & Ammann, 1987). The static weight of the participating people is
730 kg which is used in the simulations. In the example presented in Figure 24 the
force frequency is 1.4 Hz, the same as the test described in Section 8.2.2 and the load
is applied in midspan of the model.

CHALMERS, Civil and Environmental Engineering, Master’s Thesis 2012:96 46
Figure 24 Half-sine force factor to simulate jumping force induced by the group.
The heel impact test is simulated with a point load applied in the midspan. The
magnitude of the force is assumed to be twice the static force from the participating
group, in the range between the magnitude of walking and jumping force. The force
and its duration are shown in Figure 25.
Figure 25 The heel impact force simulation in Brigade/Plus. An impact force
twice the static force is applied during 0.3 s.
0 1 2 3 4 5 6 7 8 9 100
0.5
1
1.5
2
2.5
3
Time [s]
Load/s
tatic w
eig
ht [-
]
0 0.5 1 1.5 2 2.5 3 3.5 4 4.5 50
0.5
1
1.5
2
2.5
Time [s]
Load/s
tatic w
eig
ht [-
]
CHALMERS, Civil and Environmental Engineering, Master’s Thesis 2012:96 47
9 Results
In this chapter, the results from the both Master’s thesis models are presented. The
natural frequencies and the accelerations resulting from the force models in BRO
2004 and ISO 10137 are presented. Moreover, the acceleration measurements from
the different tests at Älvsbackabron are also presented with corresponding results
from the force simulations in Brigade/Plus.
9.1 Master’s thesis model according to BRO 2004
The Master’s thesis model according to BRO 2004 with its input data is described in
Section 7.1.1. In Table 15, the first ten natural frequencies of the model are presented.
The corresponding mode shapes are included in Appendix D.
Table 15 The first ten natural frequencies and description of mode shapes from
the Master’s thesis model according to BRO 2004.
Mode number Description of mode shape Natural frequency [Hz]
1 Lateral movement of bridge deck 0.620
2 Vertical movement of bridge deck 1.386
3 Lateral movement of pylon 1.390
4 Lateral movement of bridge deck 1.441
5 Lateral movement of pylon 1.479
6 Vertical movement of bridge deck 1.899
7 Torsional movement of bridge deck 2.350
8 Lateral movement of bridge deck 2.559
9 Longitudinal movement of pylons 2.760
10 Longitudinal movement of pylons 2.786
In Figure 26, the resulting vertical accelerations from the Master’s thesis model
according to BRO 2004 with the force models in BRO 2004 and the simplified force
model from ISO 10137 are presented. The simplification of the force model in ISO
10137 is described in Section 7.2. Both the force models in BRO 2004 and in ISO
10137 are time dependent, but with a built in function in Brigade/Plus the force is
converted to a frequency domain. The forces have been applied with a frequency
sweeping from 0 to 5 Hz in the midspan of the bridge. The peaks with the highest
accelerations indicate the natural frequencies, i.e. where resonances occur. The first
vertical mode of the bridge deck gives the highest acceleration, why it is reasonable to
expect the highest accelerations from this walking frequency. The simplified force
model in ISO 10137 with a group of fifty pedestrians results in the highest
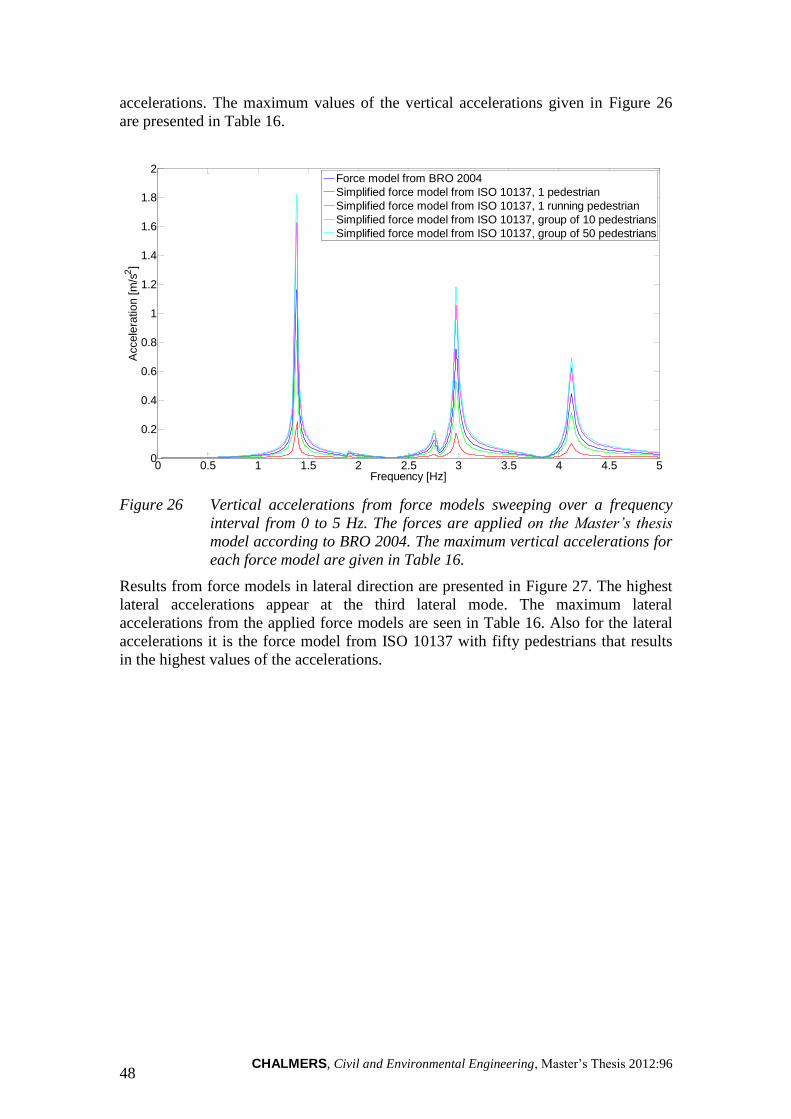
CHALMERS, Civil and Environmental Engineering, Master’s Thesis 2012:96 48
accelerations. The maximum values of the vertical accelerations given in Figure 26
are presented in Table 16.
Figure 26 Vertical accelerations from force models sweeping over a frequency
interval from 0 to 5 Hz. The forces are applied on the Master’s thesis
model according to BRO 2004. The maximum vertical accelerations for
each force model are given in Table 16.
Results from force models in lateral direction are presented in Figure 27. The highest
lateral accelerations appear at the third lateral mode. The maximum lateral
accelerations from the applied force models are seen in Table 16. Also for the lateral
accelerations it is the force model from ISO 10137 with fifty pedestrians that results
in the highest values of the accelerations.
0 0.5 1 1.5 2 2.5 3 3.5 4 4.5 50
0.2
0.4
0.6
0.8
1
1.2
1.4
1.6
1.8
2
Frequency [Hz]
Accele
ration [m
/s2]
Force model from BRO 2004
Simplified force model from ISO 10137, 1 pedestrian
Simplified force model from ISO 10137, 1 running pedestrian
Simplified force model from ISO 10137, group of 10 pedestrians
Simplified force model from ISO 10137, group of 50 pedestrians

CHALMERS, Civil and Environmental Engineering, Master’s Thesis 2012:96 49
Figure 27 Lateral accelerations from force models sweeping over a frequency
interval from 0 to 5 Hz. The forces are applied on the Master’s thesis
model according to BRO 2004. The maximum lateral accelerations for
each force model are given in Table 16.
The ISO 10137 force model with fifty pedestrians results in the highest accelerations
for both vertical and lateral accelerations. Notable is also that the maximum resulting
vertical acceleration from one runner is higher than the accelerations from ten walking
pedestrians and the force model given in BRO 2004.
Table 16 Maximum vertical and lateral accelerations from force models in BRO
2004 and ISO 10137 applied on Master’s thesis model according to
BRO 2004.
Force model Maximum vertical
acceleration [m/s2]
Maximum lateral
acceleration [m/s2]
BRO 2004 1.16 0.13
ISO 10137, 1 pedestrian 0.26 0.10
ISO 10137, 1 running pedestrian 1.63 0.19
ISO 10137, 10 pedestrian 0.81 0.30
ISO 10137, 50 pedestrian 1.82 0.69
0 0.5 1 1.5 2 2.5 3 3.5 4 4.5 50
0.1
0.2
0.3
0.4
0.5
0.6
0.7
0.8
Frequency [Hz]
Accele
ration [m
/s2]
Force model from BRO 2004
Simplified force model from ISO 10137, 1 pedestrian
Simplified force model from ISO 10137, 1 running pedestrian
Simplified force model from ISO 10137, group of 10 pedestrians
Simplified force model from ISO 10137, group of 50 pedestrians

CHALMERS, Civil and Environmental Engineering, Master’s Thesis 2012:96 50
9.2 Master’s thesis model according to Eurocode
Corresponding calculations as previously described are performed in the Master’s
thesis model according to Eurocode. An extensive description of the Master’s thesis
model according to Eurocode is given in Section 7.2. The first ten natural frequencies
of the bridge are presented in Table 17 and the corresponding mode shapes are
presented in Appendix D.
Table 17 Natural frequencies and description of the mode shapes for the first ten
modes from the Master’s thesis model according to Eurocode.
Mode number Description of mode shape Natural frequency [Hz]
1 Lateral movement of bridge deck 0.746
2 Lateral movement of pylon 1.539
3 Lateral movement of pylon 1.644
4 Vertical movement of bridge deck 1.648
5 Lateral movement of bridge deck 1.732
6 Vertical movement of bridge deck 2.285
7 Torsional movement of bridge deck 2.714
8 Lateral movement of bridge deck 3.057
9 Longitudinal movement of pylons 3.244
10 Longitudinal movement of pylons 3.274
The force models from BRO 2004 and ISO 10137 have been applied in the same way
as described earlier in Section 9.1. The load is placed in the middle of the bridge with
a frequency sweeping from 0 to 5 Hz. Figure 28 shows the resulting vertical
accelerations and the maximum resulting accelerations can be seen in Table 18. The
first natural frequency of the bridge deck gives the highest vertical accelerations.

CHALMERS, Civil and Environmental Engineering, Master’s Thesis 2012:96 51
Figure 28 Vertical accelerations from force models sweeping over a frequency
interval from 0 to 5 Hz. The loads are applied on the Master’s thesis
model according to Eurocode. The maximum vertical accelerations for
each force model are given in Table 18.
The lateral accelerations are seen in Figure 29 and the maximum lateral accelerations
are presented in Table 18. Here it is the second lateral mode that gives the highest
accelerations.
Figure 29 Lateral accelerations from force models sweeping over a frequency
interval from 0 to 5 Hz. The forces are applied on the Master’s thesis
model according to Eurocode. The maximum lateral accelerations for
each force model are given in Table 18.
0 0.5 1 1.5 2 2.5 3 3.5 4 4.5 50
0.2
0.4
0.6
0.8
1
1.2
1.4
Frequency [Hz]
Accele
ration [m
/s2]
Force model from BRO 2004
Simplified force model from ISO 10137, 1 pedestrian
Simplified force model from ISO 10137, 1 running pedestrian
Simplified force model from ISO 10137, group of 10 pedestrians
Simplified force model from ISO 10137, group of 50 pedestrians
0 0.5 1 1.5 2 2.5 3 3.5 4 4.5 50
0.05
0.1
0.15
0.2
0.25
0.3
0.35
0.4
0.45
0.5
Frequency [Hz]
Accele
ration [m
/s2]
Force model from BRO 2004
Simplified force model from ISO 10137, 1 pedestrian
Simplified force model from ISO 10137, 1 running pedestrian
Simplified force model from ISO 10137, group of 10 pedestrians
Simplified force model from ISO 10137, group of 50 pedestrians

CHALMERS, Civil and Environmental Engineering, Master’s Thesis 2012:96 52
Also in this model the resulting vertical acceleration from a runner is the second
highest value, higher than a group of ten walking pedestrians. However, highest
accelerations are achieved from the force model with fifty pedestrians.
Table 18 Maximum vertical and lateral accelerations from force models in BRO
2004 and ISO 10137 applied on Master’s thesis model according to
Eurocode.
Force model Maximum vertical
acceleration [m/s2]
Maximum lateral
acceleration [m/s2]
BRO 2004 0.63 0.06
ISO 10137, 1 pedestrian 0.14 0.05
ISO 10137, 1 running pedestrian 0.88 0.09
ISO 10137, 10 pedestrian 0.44 0.15
ISO 10137, 50 pedestrian 0.99 0.33

CHALMERS, Civil and Environmental Engineering, Master’s Thesis 2012:96 53
9.3 Tests at Älvsbackabron
The results from the tests are presented as measured acceleration in two positions of
the bridge deck, namely midspan and a quarter of the span. The measured data are
filtered to only include frequencies up to 5 Hz using a built in low pass filter in
MATLAB. The accelerations are plotted versus time and from these curves the
resulting accelerations of the bridge are seen and the maximum accelerations are
determined. From the jumping test and heel impact test damping factors are calculated
according to Equation (21).
(
) (21)
where
is the damping factor
is the acceleration at cycle i
is the acceleration at cycle i+1
A possible source of error influencing the measurements is the wind. However, on the
both measuring days the wind speed was less than five m/s2.
9.3.1 Controlled walking test
In Figure 30, a curve with measured vertical accelerations from one of the controlled
walking tests is shown. The measured accelerations from the controlled walking tests
never exceed 0.5 m/s2. The data shown in Figure 30 is measured in the quarter of the
span in May with eight people walking on the bridge with a walking frequency of 1.9
Hz. The accelerations are highest when the group is passing the quarter of the bridge
span, but when the group is passing midspan the accelerations are smaller.
Figure 30 Measured vertical accelerations at Älvsbackabron when performing a
controlled walking test with a walking frequency of 1.9 Hz.
0 10 20 30 40 50 60 70 80 90 100-0.5
-0.4
-0.3
-0.2
-0.1
0
0.1
0.2
0.3
0.4
0.5
Time [s]
Accele
ration [m
/s2]

CHALMERS, Civil and Environmental Engineering, Master’s Thesis 2012:96 54
One of the intentions of the controlled walking tests was to excite the bridge in lateral
direction. Measured accelerations in lateral direction from a test with 1.5 Hz as
walking frequency are shown in Figure 31. The maximum lateral acceleration is 0.037
m/s2 and the accelerations are measured in the midspan.
Figure 31 Measured lateral accelerations when performing a controlled walking
test with a walking frequency of 1.5 Hz. The accelerations are
measured in midspan.
During the both test occasions the cables of bridge started to sway from the applied
forces in the controlled walking tests, but the oscillations decayed as soon as the
group had left the bridge.
9.3.2 Jumping test
Results from the jumping tests will be presented below. The largest measured vertical
acceleration from the jumping tests is 1.66 m/s2, shown in Figure 32. The data from
two additional jumping tests are shown in Figure 33 and in Figure 34. The three
curves show the same tendency, the accelerations are increasing when the group is
jumping in the middle of the bridge. After 30 seconds the group stop jumping and is
standing still while the accelerations are decreasing.
0 20 40 60 80 100 120-0.05
-0.04
-0.03
-0.02
-0.01
0
0.01
0.02
0.03
0.04
0.05
Time [s]
Accele
ration [m
/s2]

CHALMERS, Civil and Environmental Engineering, Master’s Thesis 2012:96 55
Figure 32 Measured vertical accelerations at Älvsbackabron. This test resulted in
the highest accelerations. The accelerations are measured in midspan
during one of the tests performed in May with a jumping frequency of
1.4 Hz.
Figure 33 Measured vertical accelerations at Älvsbackabron from one of the
jumping tests. The accelerations are measured in midspan during one
of the tests performed in March with a jumping frequency of 1.4 Hz.
Different accelerometers are used in the tests performed in March,
however, the results correspond well to the accelerations measured in
May by another set of accelerometers.
0 10 20 30 40 50 60
-1.5
-1
-0.5
0
0.5
1
1.5
Time [s]
Accele
ration [m
/s2]
0 10 20 30 40 50 60 70 80
-1
-0.8
-0.6
-0.4
-0.2
0
0.2
0.4
0.6
0.8
1
Time [s]
Accele
ration [m
/s2]

CHALMERS, Civil and Environmental Engineering, Master’s Thesis 2012:96 56
Figure 34 Measured vertical accelerations at Älvsbackabron from one of the
jumping test. The accelerations are measured in midspan during one of
the tests performed in May with a jumping frequency of 1.5 Hz.
An observation from the tests was the sway of the cables. During the jumping part of
the jumping tests the cables started to oscillate. These oscillations continued for about
one minute after the group had stopped jumping.
The results from the jumping tests are used to calculate a damping factor of the
bridge. To calculate the damping factor curve fitting is performed in MATLAB. The
MATLAB-code used to perform the curve fitting are attached in Appendix E. One of
the fitted curves with decaying accelerations is shown in Figure 35. Taking results
from all jumping tests into account the approximate damping factor from the jumping
tests is estimated to 0.6%.
0 10 20 30 40 50 60
-1
-0.5
0
0.5
1
Time [s]
Accele
ration [m
/s2]

CHALMERS, Civil and Environmental Engineering, Master’s Thesis 2012:96 57
Figure 35 Curve fitting of measured data to calculate the damping factor of the
bridge. The fitted curve results in a damping of 0.6%.
The ice skating jumps resulted in the highest measured lateral accelerations with a
maximum acceleration of 0.14 m/s2 in lateral direction. Figure 36 shows the resulting
accelerations from one of the tests where the group was jumping sideways in the
middle of the bridge for 30 seconds with a frequency of 1.4 Hz.
Figure 36 Lateral accelerations from one of the ice skating jump tests performed
in May. Accelerations are measured in the midspan.
35 40 45 50 55 60 65 70 75-0.8
-0.6
-0.4
-0.2
0
0.2
0.4
0.6
0.8
Time [s]
Accele
ration [m
/s2]
0 10 20 30 40 50 60 70
-0.1
-0.05
0
0.05
0.1
0.15
Time [s]
Accele
ration [m
/s2]

CHALMERS, Civil and Environmental Engineering, Master’s Thesis 2012:96 58
9.3.3 Heel impact test
Figure 37 shows the vertical accelerations from two heel impacts where the load is
applied in midspan and the accelerations are measured in the quarter of the span. The
maximum acceleration, measured both in midspan and in the quarter of the span, is
approximately 0.1 m/s2.
Figure 37 Vertical accelerations from one heel impact test. The group applied the
load in midspan and the result is measured in the quarter of the span.
The test was performed in May.
In Figure 38, the vertical accelerations from another heel impact test are shown. In
this test the load is applied in the quarter of the span and the resulting accelerations
are measured in the middle of the bridge.
0 10 20 30 40 50 60-0.2
-0.15
-0.1
-0.05
0
0.05
0.1
0.15
0.2
Time [s]
Accele
ration [m
/s2]

CHALMERS, Civil and Environmental Engineering, Master’s Thesis 2012:96 59
Figure 38 Vertical accelerations from one heel impact test. The load from the
group is applied in the quarter of the span and the response is
measured in the middle. The test was performed in May.
The reason the accelerations from the heel impact tests are not measured in the same
position as the application point of the force is to avoid local irregularities. For
example, all participants of the test may not stand completely still after the impact
which results in additional local impacts. When performing these tests no persistent
vibrations in the cables were observed.
The damping is calculated through curve fitting and Figure 39 shows the curve fitting
for one of the heel impact tests. From all heel impact tests the damping factor is
calculated to approximately 1.2% which is twice the damping calculated from the
jumping tests.
0 10 20 30 40 50 60-0.2
-0.15
-0.1
-0.05
0
0.05
0.1
0.15
0.2
Time [s]
Accele
ration [m
/s2]

CHALMERS, Civil and Environmental Engineering, Master’s Thesis 2012:96 60
Figure 39 Curve fitting for one of the heel impact tests with a fitted curve with a
damping factor of 1.2%.
9.3.4 Continuous measurements
The results from the continuous measurements at Älvsbackabron show that the
vertical accelerations never exceed 0.2 m/s2 and the lateral is about ten times smaller.
In Figure 40, the vertical accelerations from one of the continuous measurements
during a quarter of an hour measured in the quarter of the bridge span are shown.
Figure 41 shows the corresponding lateral accelerations.
Figure 40 Vertical accelerations from one continuous measurement measured in
the quarter of the span.
39 40 41 42 43 44 45 46-0.2
-0.15
-0.1
-0.05
0
0.05
0.1
0.15
0.2
Time [s]
Accele
ration [m
/s2]
0 100 200 300 400 500 600 700 800 900 1000-0.2
-0.15
-0.1
-0.05
0
0.05
0.1
0.15
0.2
Time [s]
Accele
ration [m
/s2]

CHALMERS, Civil and Environmental Engineering, Master’s Thesis 2012:96 61
Figure 41 Lateral accelerations from one of the continuous measurements,
measured in the quarter of the span.
During the continuous measurements pedestrians and runners crossed the bridge.
Movement of the bridge deck from forces induced by other pedestrians was felt when
standing still, however, when walking the movement of the bridge deck was not
experienced as extensive. No significant sway of the cables was observed. These
observations are the authors’ personal experiences.
9.4 Simulations of the tests in Brigade/Plus
The simulations of the jumping tests and the heel impact test are modelled in the
Master’s thesis model based on material parameters given in Eurocode except for the
damping factor which is the same value as calculated in corresponding test. The
modelling of the forces are described in Section 8.3.
The resulting vertical accelerations from the jumping test simulated in the Master’s
thesis model according to Eurocode are shown in Figure 42 and in Figure 43 the
results from the simulation of the heel impact test are presented as vertical
accelerations of the bridge deck due to the impact force.
0 100 200 300 400 500 600 700 800 900 1000-0.1
-0.08
-0.06
-0.04
-0.02
0
0.02
0.04
0.06
0.08
0.1
Time [s]
Accele
ration [m
/s2]

CHALMERS, Civil and Environmental Engineering, Master’s Thesis 2012:96 62
Figure 42 Vertical accelerations from simulation of a jumping test in the Master’s
thesis model according to Eurocode. Damping factor of 0.6%.
Figure 43 Vertical accelerations from simulation of the heel impact test in the
Master’s thesis model according to Eurocode. Damping factor of 1.2%.
0 10 20 30 40 50 60 70 80-1.5
-1
-0.5
0
0.5
1
1.5
Time [s]
Accele
ration [m
/s2]
0 1 2 3 4 5 6 7 8 9 10-0.2
-0.15
-0.1
-0.05
0
0.05
0.1
0.15
0.2
Time [s]
Accele
ration [m
/s2]

CHALMERS, Civil and Environmental Engineering, Master’s Thesis 2012:96 63
10 Comparison
The comparison in this chapter is divided into two parts. The first part is a comparison
between the different regulations and force models described in Chapter 3 and
Chapter 4. The second part is regarding the case study of Älvsbackabron where the
results from the two Master’s thesis models are compared with each other and also
with the measured results from Älvsbackabron.
10.1 Regulations and force models
The comfort criteria regarding the pedestrian induced vibrations presented in Chapter
3 all assign a limit for the vertical acceleration in the bridge deck. In Figure 44 the
vertical limit acceleration for a frequency interval between 1 Hz and 5 Hz is
presented. The peak acceleration limits given in both Eurocode 0 and BRO 2004 have
a fixed value of 0.7 m/s2 over the frequency interval. These two codes differ from the
remaining codes which all have frequency dependent limits over the interval. Low
limit accelerations for low frequencies takes into account the fact that people are more
sensitive to low frequency vibrations. This is the case for the limits in the Danish
standard Belastnings- og beregningsregler for vej- og stibroer and BS 5400 which
both have increasing acceleration limits with increasing frequency. The main
difference is that the limit in the Danish standard is stricter than in BS 5400.
In ISO 10137, however, the curve shows the reverse behaviour with a higher value of
the limit acceleration for low frequencies. Besides, ISO 10137 also defines a curve
with stricter limit accelerations for the design case with one person standing still in
the midpoint of the bridge. This curve has the same tendency as the curve from ISO
10137 in Figure 44, but the values are half the values.
Notable is also that all curves, except the one from the Danish standard, have the same
limit for a walking frequency of 2 Hz, namely 0.7 m/s2. A walking frequency of 2 Hz
is the most common walking frequency.

CHALMERS, Civil and Environmental Engineering, Master’s Thesis 2012:96 64
Figure 44 Peak acceleration limits for vertical accelerations presented in the
different codes.
In the report by JRC and ECCC presented in Section 3.2.2, the limit acceleration is no
longer frequency dependent, but is instead given by different comfort classes.
Comfort class 1 describes the maximum comfort with a limit for vertical accelerations
of 0.5 m/s2. The value 0.7 m/s
2 belong to comfort class 2 which corresponds to
medium degree of comfort. The upper limit for comfort class 2 is 1 m/s2 and in
relation to the limits presented in Figure 44 it is only BS 5400 that reaches this limit
within the interval.
The peak acceleration limit curves for the lateral accelerations in the interval 1 to 5 Hz
are presented in Figure 45. BRO 2004 do not specify any regulations regarding lateral
acceleration and BS 5400 only state that special considerations regarding these
accelerations have to be taken for bridges with low natural frequency.
0.5 1 1.5 2 2.5 3 3.5 4 4.5 5 5.50.2
0.3
0.4
0.5
0.6
0.7
0.8
0.9
1
1.1
1.2
Frequency [Hz]
Peak a
ccele
ration lim
it [m
/s2]
BRO 2004
Eurocode
ISO10137
Danish standard
BS 5400

CHALMERS, Civil and Environmental Engineering, Master’s Thesis 2012:96 65
Figure 45 Peak acceleration limits for lateral accelerations presented in the
different codes.
In Eurocode 0 two fixed limit values regarding lateral accelerations are given, one
limit of 0.2 m/s2 which is relevant for the daily use of the bridge and a higher limit of
0.4 m/s2 for exceptional crowd conditions. The limit of 0.2 m/s
2 is the strictest value
for the lateral accelerations.
The lateral limit in ISO 10137 is fixed up to 2 Hz and then frequency dependent. The
limit given in Danish standard is also frequency dependent. For the lowest frequency
all the limits are almost the same, about 0.2 m/s2, except the higher Eurocode limit,
but the limits differ for higher frequencies.
The limits in Figure 45 can be compared with the lateral limit accelerations presented
by JRC and ECCC. For maximum comfort, comfort class 1, the lateral acceleration
should not exceed 0.1 m/s2. For medium comfort the acceleration should be within the
span of 0.1-0.3 m/s2. These values are stricter compared to the limits presented in
Figure 45.
The force models given in BRO 2004 and the Danish standard resemble each other
with a periodic force. The differences are mainly the magnitude of the force amplitude
and the movement of the pedestrian force in the Danish standard. None of the codes
present force models for the lateral force.
The vertical force model given in BRO 2004 takes the size of the bridge and hence the
possible amount of pedestrians into consideration. Included is also the fact that the
force might cause resonance for frequencies below 2.5 Hz why a higher force
amplitude is used for frequencies below 2.5 Hz. These aspects are not considered in
the Danish standard. An additional difference between the force models is the
amplitude. The amplitude is smaller in the Danish standard with a value of 360 N.
This fact should be put in relation to the strict limits for vertical accelerations given in
the Danish standard. No models regarding the lateral force are given in the two codes.
The Eurocode and Swedish national annex provides no force model for the pedestrian
force other than for the design case of a simply supported bridge. Instead, the ISO
0.5 1 1.5 2 2.5 3 3.5 4 4.5 5 5.50
0.1
0.2
0.3
0.4
0.5
0.6
0.7
0.8
0.9
1
Frequency [Hz]
Peak a
ccele
ration lim
it [m
/s2]
Eurocode, normal use
Eurocode, exceptional crowd conditions
ISO 10137
Danish standard

CHALMERS, Civil and Environmental Engineering, Master’s Thesis 2012:96 66
10137 standard can be used. A difference with this model compared to the two
previously described is that this model includes the static force from the pedestrians.
The ISO 10137 force model also takes the contribution of higher harmonics from the
pedestrian force into account by introducing a phase shift. Thus, the force model in
ISO 10137 is not harmonic as the other presented forces. ISO 10137 also takes the
number of pedestrians into account and adds a coordination factor which describes an
equivalent number of people who will walk with the same pace. The ISO 10137
standard also includes a force model for the lateral force. This model is the same as
the model for the vertical force, but with different values of the coefficients.
10.2 Master’s thesis models
In this second part of the comparison, the Master’s thesis models according to BRO
2004 and Eurocode will be compared. The two main differences between the models
are the material parameters and the force models.
10.2.1 Material parameters
The effect from the different material parameters on the two Master’s thesis models
are studied by comparing the natural frequencies of the two models. The parameters
that differ are presented in Table 19 and in Appendix A a complete list of all material
properties is presented. The largest differences between the two models are the
density of the timber materials and the given damping factors.
Table 19 Comparison of material properties from BRO 2004 and Eurocode 5.
Comparison element BRO 2004 Eurocode 5
Young’s modulus glulam 13 GPa 13.7 GPa
Young’s modulus cables 200 GPa 210 GPa
Density glulam 600 kg/m² 430 kg/m²
Density timber K24 600 kg/m² 430 kg/m²
Damping factor 0.6% 1.5%
The differences between the material parameters affect the results in the models. In
Table 20 the natural frequencies for the both models are shown. The natural
frequencies are higher in the Master’s thesis model according to Eurocode. The
difference in damping factor does not affect the natural frequencies, but only the
magnitude of the accelerations.

CHALMERS, Civil and Environmental Engineering, Master’s Thesis 2012:96 67
Table 20 Comparison of the first ten natural frequencies calculated for the two
Master’s thesis models.
Description of mode shape Natural frequencies
from Master’s thesis
models according to
BRO 2004 [Hz]
Natural frequencies
from Master’s thesis
models according to
Eurocode [Hz]
Lateral movement of bridge deck 0.620 0.746
Vertical movement of bridge deck 1.386 1.648
Lateral movement of pylon 1.390 1.539
Lateral movement of bridge deck 1.441 1.732
Lateral movement of pylon 1.479 1.644
Vertical movement of bridge deck 1.899 2.285
Torsional movement of bridge deck 2.350 2.714
Lateral movement of bridge deck 2.559 3.057
Longitudinal movement of pylons 2.760 3.244
Longitudinal movement of pylons 2.786 3.274
10.2.2 Force models
Since no force model is given in Eurocode for this bridge type, the comparisons are
between the force model in BRO 2004 and the simplified force model from ISO
10137 instead. Both force models are described in Section 7.2.
As described in Section 3.3, the ISO 10137 standard states different design situations
which are decisive for the force. The worst case scenario is pedestrian streams
significantly larger than fifteen people, why in this comparison a group of fifty
pedestrians is chosen for the calculations. The force amplitude from the simplified
ISO 10137 model is 1700 N while in BRO 2004 it is 1082 N. In the ISO 10137 force
model a group of fifty pedestrians is chosen and within this group √ pedestrians are
walking with the same pace.
Figure 46 shows the vertical acceleration response from the two load models acting on
the Master’s thesis model according to BRO 2004. The frequency of the force is
sweeping from 0-5 Hz, the peaks indicates the resonance frequencies of the bridge
deck.

CHALMERS, Civil and Environmental Engineering, Master’s Thesis 2012:96 68
Figure 46 Vertical acceleration response due to the force models in BRO 2004
and the simplified force model in ISO 10137 with a group of fifty
pedestrians applied on the Master’s thesis model according to BRO
2004.
Naturally, the force from the ISO 10137 model gives higher vertical accelerations
because the magnitude of the force is higher. Figure 47 shows the vertical acceleration
response from the two force models applied in the Master’s thesis model according to
Eurocode.
Figure 47 Vertical acceleration response due to the force models in BRO 2004
and the simplified force model in ISO 10137 with a group of fifty
pedestrians applied on the Master’s thesis model according to
Eurocode.
0 0.5 1 1.5 2 2.5 3 3.5 4 4.5 50
0.2
0.4
0.6
0.8
1
1.2
1.4
1.6
1.8
2
Frequency [Hz]
Accele
ration [m
/s2]
Force model from BRO 2004
Simplified force model from ISO 10137, group of 50 pedestrian
0 0.5 1 1.5 2 2.5 3 3.5 4 4.5 50
0.1
0.2
0.3
0.4
0.5
0.6
0.7
0.8
0.9
1
Frequency [Hz]
Accele
ration [m
/s2]
Force model from BRO 2004
Simplified force model from ISO 10137, group of 50 pedestrian

CHALMERS, Civil and Environmental Engineering, Master’s Thesis 2012:96 69
Also in this figure the accelerations due to the ISO 10137 force are higher, but the
magnitudes of the accelerations differ between the two models. The Master’s thesis
model according to Eurocode gives a lower maximum value of the vertical
acceleration due to the fact that the damping factor is higher.
For further comparison between the models, the same force is applied in the both
Master’s thesis models, namely the force model from BRO 2004 with a force
magnitude of 1082 N. The results are shown in Figure 48, where it clearly can be seen
that the Master’s thesis model according to BRO 2004 results in higher vertical
accelerations and lower natural frequencies than the Master’s thesis model according
to Eurocode. The reason for this is the difference in the material parameters.
According to Hallgren6 the density of timber and glulam given in BRO 2004 is too
high, but is assumed to include non-structural mass, while the value given in
Eurocode 5 are too low and all extra mass have to be considered separately.
Figure 48 Vertical accelerations from the force model in BRO 2004 applied on
both Master’s thesis models.
The most relevant comparison is between the resulting accelerations from the
Master’s thesis model according to BRO 2004 and resulting accelerations from
Master’s thesis model according to Eurocode. The accelerations are achieved by
applying the corresponding force model on the two Master’s thesis models. The
resulting vertical accelerations are shown in Figure 49. It can be seen that even though
the force amplitude from the simplified force model in ISO 10137 is higher than the
force amplitude in BRO 2004 the resulting accelerations is higher in the Master’s
thesis model according to BRO 2004. This is due to the fact that the damping factor is
higher according to Eurocode 5. The different natural frequencies from the two
models can also be seen in Figure 49.
6 Thomas Hallgren, structural engineer COWI AB, meeting March 21:th 2012
0 0.5 1 1.5 2 2.5 3 3.5 4 4.5 50
0.2
0.4
0.6
0.8
1
1.2
1.4
Frequency [Hz]
Accele
ration [m
/s2]
Accelerations from Master´s thesis model according to BRO 2004
Accelerations from Master´s thesis model according to Eurocode

CHALMERS, Civil and Environmental Engineering, Master’s Thesis 2012:96 70
Figure 49 Vertical acceleration response from the force model in BRO 2004
acting on Master’s thesis model according to BRO 2004 and force
model from ISO 10137 with a group of fifty pedestrians acting on the
Master’s thesis model according to Eurocode.
The vertical acceleration limit is exceeded in both Master’s thesis models. The force
model given in BRO 2004 only depends on the size of the bridge why it cannot be
varied. The force model in ISO 10137 depends on the number of pedestrians walking
on the bridge at the same time. In all previous calculations a group of 50 pedestrians
have been assumed, but the results exceed the limit value. To fulfil the vertical limit
twenty pedestrians can be used in the simplified ISO 10137 force model. Resulting
vertical accelerations from the simplified ISO 10137 force model with twenty walking
pedestrians are shown in Figure 50.
0 0.5 1 1.5 2 2.5 3 3.5 4 4.5 50
0.2
0.4
0.6
0.8
1
1.2
1.4
Frequency [Hz]
Accele
ration [m
/s2]
Resulting accelerations from Master´s thesis model according to BRO 2004
Resulting accelerations from Master´s thesis model according to Eurocode
Vertical acceleration limit according to BRO 2004 and Eurocode

CHALMERS, Civil and Environmental Engineering, Master’s Thesis 2012:96 71
Figure 50 Vertical accelerations from the force model in ISO 10137 with a group
of twenty pedestrians acting on the Master’s thesis model according to
Eurocode and the force model in BRO 2004 acting on the Master’s
thesis model according to BRO 2004.
If the lateral force in ISO 10137 with a group of twenty pedestrians is applied in the
Master’s thesis model according to Eurocode the lateral acceleration limit is
exceeded.
Figure 51 Lateral accelerations from the force model in ISO 10137 with a group
of twenty pedestrians acting on the Master’s thesis model according to
Eurocode and the force model in BRO 2004 acting on the Master’s
thesis model according to BRO 2004.
0 0.5 1 1.5 2 2.5 3 3.5 4 4.5 50
0.2
0.4
0.6
0.8
1
1.2
1.4
Frequency [Hz]
Accele
ration [m
/s2]
Resulting accelerations from Master´s thesis model according to BRO 2004
Resulting accelerations from Master´s thesis model according to Eurocode
Vertical acceleration limit according to BRO 2004 and Eurocode
0 0.5 1 1.5 2 2.5 3 3.5 4 4.5 50
0.05
0.1
0.15
0.2
0.25
0.3
0.35
Frequency [Hz]
Accele
ration [m
/s2]
Resulting accelerations from Master´s thesis model according to BRO 2004
Resulting accelerations from Master´s thesis model according to Eurocode
Vertical acceleration limit according to BRO 2004 and Eurocode

CHALMERS, Civil and Environmental Engineering, Master’s Thesis 2012:96 72
10.3 Measurements from Älvsbackabron and simulations
In this section, the accelerations measured at Älvsbackabron are compared with the
results from the simulations of the tests in Brigade/Plus. The compared tests are the
jumping test and the heel impact test. In Figure 52, a comparison between the
measured vertical acceleration from one of the jumping tests at Älvsbackabron and
corresponding simulation in the Master’s thesis model according to Eurocode is
shown. In the simulation, a damping factor of 0.6% is used, which is the same as the
calculated value from the measurements.
Figure 52 Comparison of the vertical accelerations from one jumping test
performed at Älvsbackabron in March and from the simulation of the
jumping test in Master’s thesis model according to Eurocode except the
damping factor which is 0.6%, same value as calculated from jumping
tests.
The measured and simulated acceleration shows quite good correlation, especially
when the energy of the system is dissipating. This is shown more clearly in Figure 53
where the accelerations are shown from when the jumping group has stopped
jumping.
0 10 20 30 40 50 60 70-1.5
-1
-0.5
0
0.5
1
1.5
Time [s]
Accele
ration [m
/s2]
Simulation from Master´s thesis model according to Eurocode
Measurements from test at Älvsbackabron

CHALMERS, Civil and Environmental Engineering, Master’s Thesis 2012:96 73
Figure 53 Comparison of measured response of Älvsbackabron and simulations
from Master’s thesis model according to Eurocode after the group has
stopped jumping.
Furthermore, the simulated and measured accelerations from the heel impact test also
show good correlation. In Figure 54 the comparison is showed for the first ten seconds
after one impact. In the simulation of the heel impact test, a damping factor of 1.2% is
used, the same as calculated from the measured heel impact test.
Figure 54 Comparison of measured vertical accelerations from one heel impact
test at Älvsbackabron and corresponding simulation in the Master’s
thesis model according to Eurocode except the damping factor which is
1.2%, same value as calculated from heel impact tests.
30 35 40 45 50 55 60 65 70-0.8
-0.6
-0.4
-0.2
0
0.2
0.4
0.6
0.8
Time [s]
Accele
ration [m
/s2]
Simulation from Master´s thesis model according to Eurocode
Measurements from test at Älvsbackabron
0 1 2 3 4 5 6 7 8 9 10-0.2
-0.15
-0.1
-0.05
0
0.05
0.1
0.15
0.2
Time [s]
Accele
ration [m
/s2]
Simulation from Master´s thesis model according to Eurocode
Measurements from test at Älvsbackabron

CHALMERS, Civil and Environmental Engineering, Master’s Thesis 2012:96 74
To estimate the real natural frequencies of Älvsbackabron the measured accelerations
are transformed into the frequency domain with Fast Fourier Transformation, FFT.
The transformation process in MATLAB is described in Appendix E.
The FFT-curve from one of the jumping tests is shown in Figure 55, where the first
vertical natural frequency is found to be 1.45 Hz.
Figure 55 FFT-curve from one of jumping tests measured in the middle when
jumping in midspan with a frequency of 1.4 Hz.
In Figure 56 a second FFT-curve from Älvsbackabron is shown. This figure shows a
natural frequency of 2.01 Hz which is close to the theoretical second vertical natural
frequency. The curve is based on accelerations measured in the quarter of the span
from a controlled walking test with a walking frequency of 1.9 Hz.
0 0.5 1 1.5 2 2.5 3 3.5 4 4.5 50
0.05
0.1
0.15
0.2
0.25
Frequency (Hz)
|Y(f
)|

CHALMERS, Civil and Environmental Engineering, Master’s Thesis 2012:96 75
Figure 56 FFT-curve from one of the controlled walking tests at Älvsbackabron.
The vertical accelerations are measured in the quarter of the span and
the walking frequency is 1.9 Hz.
Based on these two FFT-curves the first two natural frequencies of the bridge seem to
be in the range between theoretical values from the Master’s thesis models. A
compilation of the frequencies are shown in Table 21.
Table 21 Comparison of the natural frequencies measured at Älvsbackabron and
resulting from the Master’s thesis model according to BRO 2004 and
Master’s thesis model according to Eurocode.
Master’s thesis
model according to
BRO 2004 [Hz]
Measured
frequencies at
Älvsbackabron
[Hz]
Master’s thesis
model according to
Eurocode [Hz]
First vertical 1.386 1.45 1.648
Second vertical 1.899 2.01 2.286
From measured values from the heel impact tests the damping factor is calculated to
be 1.2%, which is between the value of 0.6% given in BRO 2004 and the value 1.5%
given in Eurocode 5. In Figure 57, the effect of the damping factor is shown. The load
from BRO 2004 has been applied in the Master’s thesis model according to BRO
2004 with two different damping factors. The resulting accelerations from the model
with the higher damping factor fulfil the acceleration limit.
0 0.5 1 1.5 2 2.5 3 3.5 4 4.5 50
0.02
0.04
0.06
0.08
0.1
0.12
0.14
0.16
Frequency [Hz]
|Y(f
)|

CHALMERS, Civil and Environmental Engineering, Master’s Thesis 2012:96 76
Figure 57 Illustration of the effect of different damping factors. The Master’s
thesis model according to BRO 2004 is modelled with 0.6% damping
factor and 1.2% damping factor. The applied force is the force from
BRO 2004.
0 0.5 1 1.5 2 2.5 3 3.5 4 4.5 50
0.2
0.4
0.6
0.8
1
1.2
1.4
Time [s]
Accele
ration [m
/s2]
Damping factor 0.6%
Damping factor 1.2%
Vertical acceleration limit according to BRO 2004

CHALMERS, Civil and Environmental Engineering, Master’s Thesis 2012:96 77
11 Discussion
In this chapter the results and the comparisons are discussed by the authors. The
discussion are based on facts presented in the chapters regarding regulations and force
models and also on own assumptions and the measured results at Älvsbackabron.
11.1 Regulations and force models
The main difference between the limits for vertical accelerations presented by
different codes as shown in Section 10.1 is, if the limit is frequency dependent or not.
The limits presented in the Danish standard and BS 5400 are frequency dependent
limits that assign higher limit values for higher frequencies. An opposite behaviour is
shown by the vertical limit presented in ISO 10137 in which a high limit is assigned
for lower frequencies and a low fixed limit for frequencies above 4 Hz. The curve is
interpreted by the authors to reflect the behaviour of vertical accelerations in the
bridge deck, where the lowest frequencies experience the highest accelerations.
Though, the limit of 0.4 m/s2 for frequencies above 4 Hz is low compared to the other
limits. It should be kept in mind that the ISO 10137 standard not only considers
dynamic design of footbridges, but also dynamic design of buildings. Thus the
standard is not a refined bridge standard, but a vibration standard.
In the ISO 10137 standard different acceleration limits are given for different design
situations. This principle is further developed by the Joint Research Centre and
European Convention for Constructional Steelworks since traffic class, occurrence
and suitable comfort class have to be chosen in each individual project. The method of
determining a number of design situations with different comfort criteria seems
reasonable since it results in flexible limits which can be easily adapted to the specific
design situation. However, this method might be more demanding for the client and
structural engineer since relevant design situations and their occurrences have to be
determined in advance for each project. Good communication between the structural
engineer and the client might be necessary to assign the design situations for each
project. Also, to set suitable design situations with relevant limits and traffic classes
some experience is needed.
The lateral limits are missing in BRO 2004 and BS 5400, but exists in Eurocode 0 as
two fixed values depending on the amount of pedestrians crossing the bridge. In the
ISO 10137 standard, a limit with a constant value of 0.2 m/s2 is used for the
frequencies up to 2 Hz and then the acceleration limit value increases. Also for lateral
vibrations the method with design situations seems like a reasonable method for
assessing suitable limit vibrations.
In Section 2.2 some additional limit values for vertical and lateral accelerations are
described. A suggested vertical limit of 0.13 m/s2 based on different perception levels
of vibrations. This value is very low compared to the values given in the studied codes
and standards. A high acceleration limit based on a full scale bridge test is presented
for the lateral accelerations. A suggested limit is 1.35 m/s2 which is much higher than
lateral all limits presented in the studied codes and standards. These two limit values
are both based on people’s perception of vibration and the distribution of limit values
show the difficulty in estimating a suitable acceleration limit.
The vertical force models presented in BRO 2004, the Danish standard and BS 5400
are all harmonic forces with different amplitudes. The force model given in the ISO

CHALMERS, Civil and Environmental Engineering, Master’s Thesis 2012:96 78
10137 standard differ from the others since it takes higher harmonics into account by
introducing a phase shift and the static weight of pedestrians. Thus, the force is not
harmonic, but instead a time dependent periodic force. The intention of including the
static weight and the phase shift is to characterise the nature of the force from a
pedestrian.
There are other force models presented in Section 4.6 which also aim to describe the
nature of the force by including irregularities of the pedestrian force and the
synchronization phenomena, also called lock-in effect. By doing this, a more accurate
prediction of the forces induced by pedestrians can be achieved and perhaps more
realistic load models can be established. One downside with the non-harmonic force
models compared to the harmonic force models in the codes is that these models are
more difficult to simulate in a computer model and may take longer time to calculate
since transient analysis are needed. An additional disadvantage with the force models
are the bridge specific coefficients that are needed. These are supposed to be
established in an experimental way for the specific bridge which is not possible in
design projects.
In the design phase it is often desirable to optimize the design process to minimize the
required time and costs. One way to do this is to use force models that are suited for
design with computer software.
Regarding the force models in lateral direction it is only the ISO 10137 standard that
assigns a model for this force. Still, it is an important force to take into consideration
when designing lightweight bridges. With the improvement and development of the
Eurocodes this subject will hopefully have a greater significance and force models for
both vertical and lateral pedestrian induced forces are hopefully included.
11.2 Case study of Älvsbackabron
One of the purposes of measuring accelerations at Älvsbackabron is to investigate if
the measured accelerations exceed the limits or if they fulfil the design limits. The
measurements show that the vertical acceleration limit in Eurocode 0, 0.7 m/s2, is
exceeded during the jumping test where the maximum measured vertical acceleration
is 1.6 m/s2. This value might seem high, but the jumping tests are considered to be
extreme loading situations with large forces pulsating with the frequency close to the
natural frequency of the bridge. The results from the controlled walking tests, which
are considered to symbolise a possible loading situation, never exceeded 0.5 m/s2 and
the vertical accelerations from the continuous measurements never reached above 0.2
m/s2. These values show that Älvsbackabron fulfils the design requirements regarding
vertical vibrations presented in both Eurocode 0 and BRO 2004.
In the case study the vertical force model in the ISO 10137 standard is modelled as a
harmonic load applied in the Master’s thesis models. The simplification is described
in Section 7.2 and the main reason for the simplification is to be able to calculate in a
frequency domain. In the simplified force model all the harmonics are assumed to be
in phase with each other and to have the same periods. The simplifications result in an
equal or higher force amplitude than the force model given in the ISO 10137 standard,
but always on the safe side. In some situations the simplifications might lead to a
force amplitude well above the force amplitude in the standard.

CHALMERS, Civil and Environmental Engineering, Master’s Thesis 2012:96 79
The force model in the ISO 10137 standard gives the structural engineer many
interpretation options. One is regarding the static weight of pedestrians which is not
given and is not suggested in the standard. Also in the third design situation, where
significantly more than fifteen pedestrians are walking on the bridge, it is up to the
structural engineer to choose an appropriate number. For the case of Älvsbackabron
the static weight of one pedestrian is assumed as 80 kg and fifty pedestrians are
chosen for the third design situation.
The magnitude of the force calculated for Älvsbackabron according to BRO 2004 is
recalculated to represent an equivalent amount of pedestrians on the bridge according
to ISO 10137. The equivalent number of pedestrians is twenty and it is considered a
possible loading situation on daily basis on Älvsbackabron, perhaps more relevant
than a group of fifty pedestrians. If an amount of twenty pedestrians are chosen for the
third design situation in ISO 10137 both the vertical and lateral acceleration limits
given in Eurocode 0 are fulfilled. Thus, the amount pedestrians are decisive and it is
up to the designer to choose a relevant amount of pedestrians.
Despite the fact that the magnitude of the force in ISO 10137 with fifty pedestrians is
higher than the magnitude of the force in BRO 2004 the maximum vertical
accelerations in the Master’s thesis model according to BRO 2004 is higher than the
vertical accelerations in the Master’s thesis model according to Eurocode. The reason
for this is the different damping factors used in the two Master’s thesis models and the
results show the importance of the damping factor.
Another interesting result is the different damping factors calculated from the jumping
tests and the heel impact tests. From the jumping tests the damping factor is calculated
to 0.6%, which is the same value as given in BRO 2004 for timber structures.
However, from the heel impact test the damping factor is calculated to 1.2% which is
twice as high. According to Eurocode 5, a damping factor of 1.5% can be used for
structures with mechanical joints. This value is closer to the measured value from the
heel impact test. A possible explanation to the different damping factors could be the
cables on the bridge and the amount of energy inserted in the system by the different
tests. The jumps in the jumping tests lasted for 30 seconds and during the jumping the
cables started to sway. The sway in the cables continued over a minute after the
jumping had stopped. This was probably what caused a lower damping factor. The
cables absorbed the energy and kept the bridge moving by both increasing and
decreasing the accelerations of the bridge deck. The forces in the cables could either
be swaying in phase with the bridge accelerations and thus increase the accelerations,
but they could also be counteracting and sway out of phase. The energy is kept in the
system for a longer time due to the cables why a lower damping factor is calculated.
In the heel impact test the force is only applied once as an impact and does not cause
any significant sway in the cables why a higher damping is calculated. The higher
value of the damping factor, closer to the Eurocode 5 value, should probably have
been used in the design of Älvsbackabron since the effects from the cables are not
included in linear design. This research could only indicate this relationship between
the damping factor and the cables, why further studies and investigations regarding
the effect are needed.
The maximum measured lateral acceleration is 0.14 m/s2 which fulfils all the design
requirements. This value is measured during the jumping tests where the jumping is
done sideways. One difficulty when designing the tests was to excite the lateral modes
of the bridge deck. The controlled walking test and the sideways jumping tests both

CHALMERS, Civil and Environmental Engineering, Master’s Thesis 2012:96 80
aimed to excite the lateral modes, but it was hard to control the direction of the force
and to know the exact magnitude of the component in lateral direction.
There are some possible error sources in the measurements at Älvsbackabron and the
force modelling in the Master’s thesis models. One is the impact from the wind which
might have influence on the measurements. During the two test occasions the wind
speed never exceeded five m/s2 why its influence is neglected. A second source of
error is the difficulty in jumping with the same frequency. This proved to be even
harder when the bridge accelerations became too high. This resulted in that the force
from the jumping group is not as perfectly harmonic as the force is simulated in the
Master’s thesis model according to Eurocode. However, the modelled results show
reasonable correlation why the results are considered reliable. A third assumption that
influences the result is the fact that the bridge is modelled as linear, but in reality it is
not due to the influence of the cables, as an example.
The first two natural frequencies of the bridge are determined by FFT curves and are
found to be between the theoretical values from the Master’s thesis models according
to BRO 2004 and Eurocode. The main differences between the codes that affect the
natural frequencies are the densities of the timber and the glulam. Since the measured
natural frequencies are in the range between the two theoretical frequencies calculated
in the Master’s thesis models the real density of the timber materials in the bridge are
assumed to be between the theoretical densities as well. Some of the divergences
concerning the natural frequencies may also depend on the fact that the modelled
bridge does not have exactly the same properties as the built bridge. In Section 2.3 the
uncertainties with FE modelling is described where also FE tuning of the models are
suggested to increase the reliability of the model.

CHALMERS, Civil and Environmental Engineering, Master’s Thesis 2012:96 81
12 Conclusions
In this final chapter the conclusions of the Master’s thesis are presented. As described
in the first chapter, the report is divided in two parts, a literature study and a case
study of Älvsbackabron. The purpose of the literature study is to find similarities and
differences between the dynamic force models, regulations and comfort criteria
presented in BRO 2004, Eurocode and the international standard ISO 10137.
One purpose of the case study of Älvsbackabron is to compare the resulting
accelerations from the force models presented in BRO 2004 and Eurocode.
Furthermore, accelerations are measured and from the results the damping factor of
the bridge is calculated.
Finally, the general aim with the Master’s thesis is to study how the transition from
BRO 2004 to Eurocode affects the dynamic design of timber footbridges.
12.1 Regulations and force models
The vertical accelerations limits given in BRO 2004 and Eurocode 0 are fixed values
with the same magnitude, namely 0.7 m/s2. In the Danish standard Belastnings- og
beregningsregler for vej- og stibroer the vertical acceleration limit is presented as a
frequency dependent value. For frequencies below 4 Hz the limit is stricter than the
limit in BRO 2004 and Eurocode 0.
The vertical limit in the ISO 10137 standard shows the opposite relation than the limit
in the Danish standard with a higher limit value for frequencies below 2 Hz and a
fixed limit of 0.4 m/s2 for frequencies above 4 Hz. For the most common walking
frequency, 2 Hz, the limits from BRO 2004, Eurocode 0 and ISO 10137 coincide. The
Danish standard assigns a stricter limit for the same frequency.
No lateral acceleration limit is given in BRO 2004. In Eurocode 0 two fixed limits are
given, one lower for normal use with a limit value of 0.2 m/s2 and a higher limit of 0.4
m/s2 for exceptional crowd conditions. The lateral acceleration limit in ISO 10137 has
a fixed value of about 0.2 m/s2 for frequencies below 2 Hz and is then frequency
dependent with increasing limit values. In the Danish standard no specific lateral limit
is given, but instead the same limit as for vertical accelerations are used. This results
in a higher lateral acceleration limit than the other studied codes and standard, with an
exception to the higher limit in Eurocode 0.
In Eurocode no force model for pedestrian force is presented other than for a design
situation with a simply supported bridge deck, which is not relevant for the
comparison. The vertical force models in BRO 2004 and the Danish standard are both
harmonic forces with different force amplitudes. The force model in the ISO 10137
standard takes higher harmonics and the static weight of a pedestrian into account and
therefore it is not a harmonic force. The result from the ISO 10137 model depends on
the amount of pedestrians why it is of importance that relevant design situations for
the bridge are assigned by the client or structural engineer.
It is only the ISO 10137 standard that presents a lateral force model. This model is the
same as the vertical model, but with different coefficients.
Effects of the transition from BRO 2004 to the Eurocodes on the design of footbridges
are that the lateral vibrations must be considered in design, the density for timber
materials will be lower and the damping factor will be higher. The vertical

CHALMERS, Civil and Environmental Engineering, Master’s Thesis 2012:96 82
acceleration limit in Eurocode 0 is the same as in BRO 2004, but a difference is that
the ISO 10137 standard can also be used in design. Both the lateral and vertical limits
are frequency dependent in the ISO 10137 standard. Since there is no general design
method for dynamic design of cable-stayed timber footbridges in the Eurocodes,
further development is needed.
12.2 Case study of Älvsbackabron
In the force model presented in ISO 10137 it is up to the client or structural engineer
to assign an appropriate number of pedestrians to the design situation where a stream
of pedestrians are crossing the bridge. For the case study, the force model in the ISO
10137 standard is simplified as a harmonic force and a stream of fifty pedestrians is
chosen which results in a force amplitude of 1700N. The force amplitude from the
force model given in BRO 2004 is 1082N. Though, the resulting vertical accelerations
from the simplified ISO 10137 force model applied on the Master’s thesis according
to Eurocode are lower than the resulting accelerations from the BRO 2004 force
applied on the Master’s thesis model according to BRO 2004. This is due to the fact
that a higher damping factor can be used according to Eurocode 5.
The resulting vertical accelerations that are calculated in both the Master’s thesis
models exceed the vertical acceleration limit according to BRO 2004 and Eurocode 0.
On the other hand, from the measurements at Älvsbackabron the vertical acceleration
limits in both BRO 2004 and Eurocode 0 are fulfilled by the measured accelerations
from the continuous measurements and all tests except from the jumping test.
However, the jumping tests are considered to be extreme loading situations and not a
relevant design situation. In BRO 2004 no limit for the lateral acceleration is given,
but none of the lateral limits given in Eurocode 0 are exceed by any of the measured
lateral accelerations from the tests.
From the measured vertical accelerations at Älvsbackabron two damping factors are
estimated based on the jumping tests and the heel impact tests. The jumping tests
result in a damping factor of 0.6% and the heel impact tests in a damping factor of
1.2%. A possible explanation to the different damping factors is the amount of energy
inserted in the bridge from the two tests. The jumping tests introduce a higher amount
of energy to the bridge than the heel impact test. The high amount of energy from the
jumping tests is absorbed by the cables which start to sway and the energy is kept in
the bridge during a longer period of time which explains the lower damping factor.
The results from the Master’s thesis models of Älvsbackabron showed that the
damping factor has the greatest influence on the accelerations. A damping factor of
1.2% is an appropriate value for further analyses of Älvsbackabron.
Effects of the transition from BRO 2004 to Eurocode on the design of footbridges are
that the lateral vibrations must be considered in design, the density for timber
materials will be lower and the damping factor will be higher. Since no force models
for the pedestrian induced forces are given in Eurocode other than for the design case
of a simply supported footbridge, the structural engineer is referred to the ISO 10137
standard. The force model presented in the ISO 10137 standard cannot be analysed in
a frequency domain why simplifications are considered to be necessary.

CHALMERS, Civil and Environmental Engineering, Master’s Thesis 2012:96 83
13 References
Anonymous (2001): Part 14 BD 37/01 Loads for Highway Bridges, The Highways
Agency, London.
Anonymous (2002a): Belastnings- og beregningsregler for vej- og stibroer,
Vejdirektoratet.
Anonymous (2002b): SS-EN 1990 Eurocode 0 – Basis of structural design, 1st ed.,
Swedish Standards Institute, Stockholm.
Anonymous (2003): SS-EN 1991-2 Eurocode 1: Actions on structures – Part 2:
Traffic loads on bridges, 1st ed., Swedish Standards Institute, Stockholm.
Anonymous (2004a): BD 29/04 Design Criteria for Footbridges, The Highways
Agency, London.
Anonymous (2004b): SS-EN 1995-1-1:2004 - Eurocode 5: Design of timber
structures - Part 1-1: General - Common rules and rules for buildings, 1st ed.,
Swedish Standards Institute, Stockholm.
Anonymous (2004c): SS-EN 1995-2:2004 - Eurocode 5: Design of timber structures -
Part2: Bridges, 1st ed., Swedish Standards Institute, Stockholm.
Anonymous (2004d): VV Publ 2004:56 BRO 2004 del 1 - Allmänna förutsättningar,
Vägverket, Borlänge.
Anonymous (2005): SS-EN 1990/A1:2005 Eurocode 0: Basis of structural design, 1st
ed., Swedish Standards Institute, Stockholm.
Anonymous (2007): ISO 10137:2007 Bases for design of structures – Serviceability of
buildings and walkways against vibration, 1st ed., International Organization for
Standardization, Geneva.
Anonymous (2010): Design of bridges to Eurocode. [Online] Available at:
http://eurocodes.jrc.ec.europa.eu/showevent.php?id=474 [2012-05-04]
Anonymous (2011): TRVFS 2011:12 Trafikverketsföreskrifter om ändring i
Vägverkets föreskrifter (VVFS 2004:43) om tillämpningen av europeiska
beräkningsstandarder, Trafikverket, Borlänge.
Anonymous (2012): Technical Cooperation between ISO and CEN. [Online]
Available at: http://eurocodes.jrc.ec.europa.eu/showpage.php?id=145 [2010-05-03]
Bachmann, H., Ammann, W. (1987): Vibrations in structures, IABSE-AIPC-IVBH,
Zurich.
Byggindustrin (2010): Träbro byggs i Skellefteå. [Online] Available at:
http://www.byggindustrin.com/byggprojekt/byggandet-av-trabron-i-skelleftea-drar-
i__7979 [2012-01-10]
Craig Jr, R.R., Kurdila, A.J. (2006): Fundamentals of structural dynamics, 2nd ed.,
John Wiley & Sons, Inc, Hoboken.
Dallard, P., Fitzpatrick, T., Flint, A., Low, A., Ridsdill Smith, R., Willford, M.,
Roche, M., (2001a): London Millenium Bridge: Pedestrian-induced lateral
vibration. Journal of Bridge Engineering, Vol. 6, No. 6, 2001, pp.412-17.

CHALMERS, Civil and Environmental Engineering, Master’s Thesis 2012:96 84
Dallard, P., Fitzpatrick, T., Flint, A., Low, A., Ridsdill Smith, R., Willford, M.,
Roche, M., (2001b): The London Millenium Footbridge. The Structural Engineer,
Vol. 79, No. 22, 2001, pp. 17-33.
Degerfeldt, K. (2009): Fördjupad projektbeskrivning "Smart Träbro i Smart Stad",
Skellefteå kommun, Skellefteå.
Dhyr, J. (2012): Hopp för bron [Online] Norran, 8:th of May. Available at:
http://norran.se/2012/05/skelleftea/hopp-for-bron/. [2012-05-25]
Eriksson, A. (2012): Hopp för bron [Online] Norran, 8:th of May. Available at:
http://norran.se/2012/05/skelleftea/hopp-for-bron/. [2012-05-25]
Heinemeyer, C., Butz, C., Keil, A., Mark, S., Goldack, A., Trometer, S., Lukić, M.,
Chabrolin, B., Lemaire, A., Martin, P., Cunha, Á., Caetano, E., (2009). Design of
Lightweight Footbridges for Human Induced Vibrations. Background document in
support to the implementation, harmonization and further development of the
Eurocodes, JRC European Commission, Luxembourg.
Ingólfsson, E.T., Georgakis, C.T. (2011): A stochastic load model for pedestrian-
induced lateral forces on footbridges. Engineering Structures, No. 33, pp.3454-
3470.
Jacobsson, P. (2009): Avsiktsförklaring om medverkan i projektet "Smart Träbro i
Smart Stad", Martinsons Träbroar AB, Skellefteå.
Jürisoo, M., Ohlsson, S., Edlund, B. (1980): Vibrationsmätningar på fyra gångbroar
av stål, Chalmers tekniska högskola, Göteborg.
Maguire, J.R., Wyatt, T. (2002): Dynamics: an introduction for civil and structural
engineers, 2nd ed., Thomas Telford Publishing, London.
Martinsons (2009): Älvsbackabron. Nytt från Martinsons, No. 1/09, 2009, pp. 1-9.
Martinsons (2012): Om företaget. [Online] Available at: http://martinsons.se/om-
foretaget [2012-01-12]
McConnell, K.G. (2001): Modal testing. Philosophical transactions of the royal
society, No. 359, 2001, pp.11-28.
Melchor Blanco, C., Bouillard, P., Bodarwé, E., Ney, L. (2005): Structural dynamic
design of a footbridge. SAMTECH Users Conference, 2005, pp. 1-19.
Mynewsdesk (2010): Byggstart för träbro i världsklass - Skellefteå kommun. [Online]
Available at: http://www.mynewsdesk.com/se/view/pressrelease/byggstart-foer-
traebro-i-vaerldsklass-450274 [2012-01-12]
Nakamura, S., Kawasaki, T. (2006): Lateral vibration of footbridges by synchronous
walking. Journal of Constructional Steel Research, No. 62, 2006, pp.1148-1160.
Nakamura, S., Kawasaki, T. (2009): A method for predicting the lateral girder
response of footbridges induced by pedestrians. Journal of Constructional Steel
Research, No. 65, 2009, pp.1705-1711.
Nationalencyklopedin (2012): Skellefteå. [Online] Available at:
http://www.ne.se.proxy.lib.chalmers.se/lang/skellefteå/307453 [2012-01-12]
Occhiuzzi, A., Spizzuoco, M., Ricciardelli, F. (2008): Loading models and response
control of footbridges excited by running pedestrian. Structural control health
monitoring, No. 15, 2008, pp.349-368.

CHALMERS, Civil and Environmental Engineering, Master’s Thesis 2012:96 85
Ohlsson, S. (1995): Modsyntes baserad på dynamisk provning, Chalmers University
of Technology, Göteborg.
Pousette, A. (2001): Cable stayed timber bridges, Trätek, Stockholm.
Puranen, M. (2011): Övre Norrland. [Online] Available at:
http://www.tillvaxtverket.se/huvudmeny/euprogram/ovrenorrland.4.21099e4211fd
ba8c87b800017079.html [2012-01-13]
Stoyanoff, S., Hunter, M. (2003): Footbridges: Pedestrian induced vibrations. Tech
Notes, No. 15, 2003, pp. 1-2.
Trafikverket (2012): ATB - Bro 2004. [Online] Available at:
http://www.trafikverket.se/Foretag/Bygga-och-underhalla/Vag/Tekniska-
dokument/Bro-och-tunnel/Allmanna-tekniska-beskrivningar/ATB---Bro-2004/
[2012-04-26].
Trästad (2012): Skellefteå-region nord. [Online] Available at:
http://www.trastad2012.se/web/Skelleftea.aspx [2012-01-12].
Wheeler, J.E. (1982): Prediction and control of pedestrian induced vibration in
footbridges. Journal of the Structural Division, No. 108, 1982, pp.2045-2065.
Živanović, S., Pavić, A., Reynolds, P. (2005): Vibration serviceability of footbridges
under human-induced excitation: a literature review. Journal of Sound and
Vibration, Vol. 279, No. 1-2, 2005, pp.1-74.
Živanović, S., Pavic, A., Reynolds, P. (2006). Modal testing and FE model tuning of a
lively footbridge structure. Engineering Structures, No. 28, 2006, pp.857-868.


CHALMERS, Civil and Environmental Engineering, Master’s Thesis 2012:96 A 1
Appendix A
This appendix describes how to produce the Master’s thesis model in Brigade/Plus
3.1-5.
Go to Module: Part
Press Part -> Create. Mark 3D, Deformable, Shell and Extrusion.
Press Add -> Spline. The spline have the coordinates (0,0), (65,1.057) and (130,0).
Exit the sketcher.
Choose the Depth to 4.185.
Press Shape -> Wire -> Spline. The spline have the coordinates (0,-0.3575,-0.3225),
(65,0.6995,-0.3225) and (130,-0.3575,-0.3225).
Press Shape -> Wire -> Spline. The spline have the coordinates (0,-0.3575,4.5075),
(65,0.6995,4.5075) and (130,-0.3575,4.5075).
Press Shape -> Wire -> Point to Point. Add the wires with the coordinates in Table
A.1.
Table A.1 Coordinates for the glulam cross beams and the pylons.
Point 1 Point 2
0.0,-0.357500,4.5075 0.0,-0.357500,-0.3225
2.5,-0.296549,4.5075 2.5,-0.296549,-0.3225
5.0,-0.235779,4.5075 5.0,-0.235779,-0.3225
7.5,-0.175370,4.5075 7.5,-0.175370,-0.3225
10.0,-0.115501,4.5075 10.0,-0.115501,-0.3225
12.5,-0.056355,4.5075 12.5,-0.056355,-0.3225
15.0,0.001890,4.5075 15.0,0.001890,-0.3225
17.5,0.059052,4.5075 17.5,0.059052,-0.3225
20.0,0.114951,4.5075 20.0,0.114951,-0.3225
22.5,0.169406,4.5075 22.5,0.169406,-0.3225
25.0,0.222238,4.5075 25.0,0.222238,-0.3225
27.5,0.273266,4.5075 27.5,0.273266,-0.3225
30.0,0.322309,4.5075 30.0,0.322309,-0.3225
32.5,0.369187,4.5075 32.5,0.369187,-0.3225

CHALMERS, Civil and Environmental Engineering, Master’s Thesis 2012:96 A 2
35.0,0.413720,4.5075 35.0,0.413720,-0.3225
37.5,0.455727,4.5075 37.5,0.455727,-0.3225
40.0,0.495028,4.5075 40.0,0.495028,-0.3225
42.5,0.531442,4.5075 42.5,0.531442,-0.3225
45.0,0.564789,4.5075 45.0,0.564789,-0.3225
47.5,0.594889,4.5075 47.5,0.594889,-0.3225
50.0,0.621560,4.5075 50.0,0.621560,-0.3225
52.5,0.644623,4.5075 52.5,0.644623,-0.3225
55.0,0.663898,4.5075 55.0,0.663898,-0.3225
57.5,0.679203,4.5075 57.5,0.679203,-0.3225
60.0,0.690359,4.5075 60.0,0.690359,-0.3225
62.5,0.697185,4.5075 62.5,0.697185,-0.3225
65.0,0.699500,4.5075 65.0,0.699500,-0.3225
67.5,0.697185,4.5075 67.5,0.697185,-0.3225
70.0,0.690359,4.5075 70.0,0.690359,-0.3225
72.5,0.679203,4.5075 72.5,0.679203,-0.3225
75.0,0.663898,4.5075 75.0,0.663898,-0.3225
77.5,0.644623,4.5075 77.5,0.644623,-0.3225
80.0,0.621560,4.5075 80.0,0.621560,-0.3225
82.5,0.594889,4.5075 82.5,0.594889,-0.3225
85.0,0.564789,4.5075 85.0,0.564789,-0.3225
87.5,0.531442,4.5075 87.5,0.531442,-0.3225
90.0,0.495028,4.5075 90.0,0.495028,-0.3225
92.5,0.455727,4.5075 92.5,0.455727,-0.3225
95.0,0.413720,4.5075 95.0,0.413720,-0.3225
97.5,0.369187,4.5075 97.5,0.369187,-0.3225

CHALMERS, Civil and Environmental Engineering, Master’s Thesis 2012:96 A 3
100.0,0.322309,4.5075 100.0,0.322309,-0.3225
102.5,0.273266,4.5075 102.5,0.273266,-0.3225
105.0,0.222238,4.5075 105.0,0.222238,-0.3225
107.5,0.169406,4.5075 107.5,0.169406,-0.3225
110.0,0.114951,4.5075 110.0,0.114951,-0.3225
112.5,0.059052,4.5075 112.5,0.059052,-0.3225
115.0,0.001890,4.5075 115.0,0.001890,-0.3225
117.5,-0.056355,4.5075 117.5,-0.056355,-0.3225
120.0,-0.115501,4.5075 120.0,-0.115501,-0.3225
122.5,-0.175370,4.5075 122.5,-0.175370,-0.3225
125.0,-0.235779,4.5075 125.0,-0.235779,-0.3225
127.5,-0.296549,4.5075 127.5,-0.296549,-0.3225
130.0,-0.357500,4.5075 130.0,-0.357500,-0.3225
130.0,4.731,5.9925 130.0,4.731,-1.8075
130.0,10.231,5.9925 130.0,10.231,-1.8075
130.0,15.731,5.9925 130.0,15.731,-1.8075
130.0,21.231,5.9925 130.0,21.231,-1.8075
0.0,21.231,5.9925 0.0,21.231,-1.8075
0.0,10.231,5.9925 0.0,10.231,-1.8075
0.0,15.731,5.9925 0.0,15.731,-1.8075
0.0,4.731,5.9925 0.0,4.731,-1.8075
0,-1.026,-1.8075 0,23.055,-1.8075
0,-1.026,5.9925 0,23.055,5.9925
130,-1.026,-1.8075 130,23.055,-1.8075
130,-1.026,5.9925 130,23.055,5.9925
Press Shape -> Wire -> Point to Point . Add the wires with the coordinates in Table
A.2.

CHALMERS, Civil and Environmental Engineering, Master’s Thesis 2012:96 A 4
Table A.2 Coordinates for the steel cross beams
First point Second point Third point Fourth point
16.25,-
0.846883,5.3025
16.25,-
0.846883,4.5075
16.25,-
0.846883,0.3225
16.25,-0.846883,-
1.1175
32.50,-
0.508313,5.3025
32.50,-
0.508313,4.5075
32.50,-
0.508313,0.3225
32.50,-0.508313,-
1.1175
48.75,-
0.268836,5.3025
48.75,-
0.268836,4.5075
48.75,-
0.268836,0.3225
48.75,-0.268836,-
1.1175
65.00,-
0.178000,5.3025
65.00,-
0.178000,4.5075
65.00,-
0.178000,0.3225
65.00,-0.178000,-
1.1175
81.25,-
0.268836,5.3025
81.25,-
0.268836,4.5075
81.25,-
0.268836,0.3225
81.25,-0.268836,-
1.1175
97.50,-
0.508313,5.3025
97.50,-
0.508313,4.5075
97.50,-
0.508313,0.3225
97.50,-0.508313,-
1.1175
113.75,-
0.846883,5.3025
113.75,-
0.846883,4.5075
113.75,-
0.846883,0.3225
113.75,-
0.846883,-1.1175
Press Shape -> Wire -> Point to Point. Add the wires with the coordinates in Table
A.3.
Press Shape -> Wire -> Spline. Add the wires with the coordinates in Table A.4.

CHALMERS, Civil and Environmental Engineering, Master’s Thesis 2012:96 A 5
Table A.3 Coordinates for the Point-to-point wires in the cross bracings
Point 1 Point 2
0,21.231,5.9925 0,15.731,-1.8075
0,15.731,5.9925 0,10.231,-1.8075
0,10.231,5.9925 0,4.731,-1.8075
130,21.231,5.9925 130,15.731,-1.8075
130,15.731,5.9925 130,10.231,-1.8075
130,10.231,5.9925 130,4.731,-1.8075
2.5,-0.296549,4.5075 7.5,-0.175370,-0.3225
7.5,-0.175370,4.5075 12.5,-0.056355,-0.3225
12.5,-0.056355,4.5075 17.5,0.059052,-0.3225
17.5,0.059052,4.5075 22.5,0.169406,-0.3225
22.5,0.169406,4.5075 27.5,0.273266,-0.3225
27.5,0.273266,4.5075 32.5,0.369187,-0.3225
32.5,0.369187,4.5075 37.5,0.455727,-0.3225
37.5,0.455727,4.5075 42.5,0.531442,-0.3225
42.5,0.531442,4.5075 47.5,0.594889,-0.3225
47.5,0.594889,4.5075 52.5,0.644623,-0.3225
52.5,0.644623,4.5075 57.5,0.679203,-0.3225
57.5,0.679203,4.5075 62.5,0.697185,-0.3225
67.5,0.697185,4.5075 72.5,0.679203,-0.3225
72.5,0.679203,4.5075 77.5,0.644623,-0.3225
77.5,0.644623,4.5075 82.5,0.594889,-0.3225
82.5,0.594889,4.5075 87.5,0.531442,-0.3225
87.5,0.531442,4.5075 92.5,0.455727,-0.3225
92.5,0.455727,4.5075 97.5,0.369187,-0.3225

CHALMERS, Civil and Environmental Engineering, Master’s Thesis 2012:96 A 6
97.5,0.369187,4.5075 102.5,0.273266,-0.3225
102.5,0.273266,4.5075 107.5,0.169406,-0.3225
107.5,0.169406,4.5075 112.5,0.059052,-0.3225
112.5,0.059052,4.5075 117.5,-0.056355,-0.3225
117.5,-0.056355,4.5075 122.5,-0.175370,-0.3225
122.5,-0.175370,4.5075 127.5,-0.296549,-0.3225
Table A.4 Coordinates for the spline wires in the cross bracings
Start point Next point Next point
0,21.231,-1.8075 0.000001,18.481,2.0925 0,15.731,5.9925
0,15.731,-1.8075 0.000001,12.981,2.0925 0,10.231,5.9925
0,10.231,-1.8075 0.000001,7.481,2.0925 0,4.731,5.9925
130,21.231,-1.8075 130.000001,18.481,2.092
5
130,15.731,5.9925
130,15.731,-1.8075 130.000001,12.981,2.092
5
130,10.231,5.9925
130,10.231,-1.8075 130.000001,7.481,2.0925 130,4.731,5.9925
2.5,-0.296549,-0.3225 5.00, -0.235950,2.0925 7.5,-0.175370,4.5075
7.5,-0.175370,-0.3225 10.0, -0.115852,2.0925 12.5,-0.056355,4.5075
12.5,-0.056355,-0.3225 15.0, 0.001338,2.0925 17.5,0.059052,4.5075
17.5,0.059052,-0.3225 20.0, 0.114219,2.0925 22.5,0.169406,4.5075
22.5,0.169406,-0.3225 25.0, 0.221326,2.0925 27.5,0.273266,4.5075
27.5,0.273266,-0.3225 30.0, 0.321217,2.0925 32.5,0.369187,4.5075
32.5,0.369187,-0.3225 35.0, 0.412447,2.0925 37.5,0.455727,4.5075
37.5,0.455727,-0.3225 40.0, 0.493574,2.0925 42.5,0.531442,4.5075
42.5,0.531442,-0.3225 45.0, 0.563155,2.0925 47.5,0.594889,4.5075
47.5,0.594889,-0.3225 50.0, 0.619746,2.0925 52.5,0.644623,4.5075
52.5,0.644623,-0.3225 55.0, 0.661903,2.0925 57.5,0.679203,4.5075

CHALMERS, Civil and Environmental Engineering, Master’s Thesis 2012:96 A 7
57.5,0.679203,-0.3225 60.0, 0.688184,2.0925 62.5,0.697185,4.5075
67.5,0.697185,-0.3225 70.0, 0.688184,2.0925 72.5,0.679203,4.5075
72.5,0.679203,-0.3225 75.0, 0.661903,2.0925 77.5,0.644623,4.5075
77.5,0.644623,-0.3225 80.0, 0.619746,2.0925 82.5,0.594889,4.5075
82.5,0.594889,-0.3225 85.0, 0.563155,2.0925 87.5,0.531442,4.5075
87.5,0.531442,-0.3225 90.0, 0.493574,2.0925 92.5,0.455727,4.5075
92.5,0.455727,-0.3225 95.0, 0.412447,2.0925 97.5,0.369187,4.5075
97.5,0.369187,-0.3225 100.0, 0.321217,2.0925 102.5,0.273266,4.5075
102.5,0.273266,-0.3225 105.0, 0.221326,2.0925 107.5,0.169406,4.5075
107.5,0.169406,-0.3225 110.0, 0.114219,2.0925 112.5,0.059052,4.5075
112.5,0.059052,-0.3225 115.0, 0.001338,2.0925 117.5,-0.056355,4.5075
117.5,-0.056355,-0.3225 120.0, -0.115852,2.0925 122.5,-0.175370,4.5075
122.5,-0.175370,-0.3225 125.0, -0.235950,2.0925 127.5,-0.296549,4.5075
Go to Module: Property
Press Material -> Create. Press General -> Density and write 430 in Mass Density.
Press Mechanical -> Elasticity -> Elastic and write 13E9 in Young’s Modulus and 0.4
in Poisson’s Ratio.
Press Material -> Create. Press General -> Density and write 7850 in Mass Density.
Press Mechanical -> Elasticity -> Elastic and write 210E9 in Young’s Modulus and
0.3 in Poisson’s Ratio.
Press Material -> Create. Press General -> Density and write 7850 in Mass Density.
Press Mechanical -> Elasticity -> Elastic and write 200E9 in Young’s Modulus and
0.3 in Poisson’s Ratio. Check No compression
Press Material -> Create. Press General -> Density and write 454 in Mass Density.
Press Mechanical -> Elasticity -> Elastic and change Type to Lamina. Write 4846E6
in E1, 4846E3 in E2, 0 in Nu12, 323E3 in G12, 323E6 in G13 and 323E3 in G23.
Press Profile -> Create. Mark Rectangular and press continue. Write 0.215 in a and
0.495 in b.
Press Profile -> Create. Mark Box and press continue. Write 0.4 in a and b and 0.016
in t.
Press Profile -> Create. Mark Trapezoidal and press continue. Write 0.645 in a and c,
1.125 in b and 0.4475 in d.
Press Profile -> Create. Mark Rectangular and press continue. Write 0.86 in a and 0.9
in b.

CHALMERS, Civil and Environmental Engineering, Master’s Thesis 2012:96 A 8
Press Section –> Create. Mark Shell and Homogeneous and press continue. Write
0.22 in Shell thickness and choose Timber as Material.
Press Section –> Create. Mark Beam and Beam and press continue. Choose Pylons as
profile and glulam as material. Repeat for main beams and cross beams.
Press Section –> Create. Mark Beam and Truss. Write cross-sectional area as in Table
A.5.
Table A.5 Cross-sectional areas for cables and bracings
Part Cross-sectional area
Cable M48 0.00180956
Cable M64 0.00321699
Cable M80 0.0100530
Bracing M24 0.000226195
Bracing M30 0.000353429
Bracing M36 0.00050894
Bracing M42 0.00069272
Bracing M48 0.00090478
Bracing M56 0.00123151
Press Section -> Assignment Manager. Press create, choose the Pylons in the viewport
and choose Pylon as profile. Repeat for deck, main beams, cross beams, cables and
bracings.
Press Assign -> Beam Section Orientation. Mark all cables, bracings and the pylons
and press done. Accept the predefined (0.0,0.0,-1.0).
Press Assign -> Beam Section Orientation. Mark all the cross beams and press done.
Write “1.0,0.0,0.0” in the textbox.
Press Assign -> Beam Section Orientation. Mark the two main beams and press done.
Write “0.0,0.0,1.0” in the textbox.
Press Special -> Springs/Dashpots -> Create. Mark Connect points to ground
(standard) and choose the end of both the main beams with x-coordinate 0. Select
Degree of freedom 2 and write 625E6 in Spring stiffness.
Press Special -> Springs/Dashpots -> Create. Mark Connect points to ground
(standard) and choose the other end of both the main beams. Select Degree of freedom
2 and write 15625E4 in Spring stiffness.
Press Special -> Springs/Dashpots -> Create. Mark Connect points to ground
(standard) and choose the bottom of the pylons with x-coordinate 0. Select Degree of
freedom 1 and write 82E6 in Spring stiffness.

CHALMERS, Civil and Environmental Engineering, Master’s Thesis 2012:96 A 9
Press Special -> Springs/Dashpots -> Create. Mark Connect points to ground
(standard) and choose the bottom of the pylons with x-coordinate 0. Select Degree of
freedom 2 and write 625E6 in Spring stiffness.
Press Special -> Springs/Dashpots -> Create. Mark Connect points to ground
(standard) and choose the bottom of the pylons with x-coordinate 130. Select Degree
of freedom 1 and write 335E5 in Spring stiffness.
Press Special -> Springs/Dashpots -> Create. Mark Connect points to ground
(standard) and choose the bottom of the pylons with x-coordinate 130. Select Degree
of freedom 2 and write 15625E4 in Spring stiffness.
Press Special -> Inertia -> Create. Mark Nonstructural mass and select both main
beams. Choose Mass per Length and write 70 in magnitude.
Press Special -> Inertia -> Create. Mark Nonstructural mass and select all the pylons.
Choose Mass per Length and write 83.4 in magnitude.
Press Special -> Inertia -> Create. Mark Nonstructural mass and select the cross
beams in the pylons. Choose Mass per Length and write 16.7 in magnitude.
Go to Module: Assembly
Press Instance -> Create. Choose the part and mark Independent (mesh on instance) as
Instance Type.
Go to Module: Step
Press Step -> Create. Mark Initial, choose Linear Perturbation and mark Frequency
and press continue. Choose Value in Number of eigenvalues requested and write 20.
Go to Module: Interaction
Press Constraint -> Create. Mark Tie and press continue, press Surface as master type
and choose the bridge deck. Choose the colour that represents the downside of the
deck, choose Node Region as slave and mark all the glulam cross beams in the deck.
Unmark Adjust slave surface initial position and Tie rotational DOFs if applicable and
Specify distance to 1. Choose Node to surface as Discretization method and press OK.
Press Constraint -> Create. Mark Tie and press continue, choose Node surface as
master and pick one of the main beams. Choose Node surface as slave and pick the
points on the steel cross beams right under the main beams. Unmark Adjust slave
surface initial position and Specify distance to 1. Choose Node to surface as
Discretization method and press OK. Repeat the same procedure for the other main
beam.
Go to Module: Load
Press BC -> Create, Mark Mechanical and Displacement/Rotation and press continue.
Select the short end of the deck where the x-coordinate is 0 and restrain U1 and U3.
Press BC -> Create, Mark Mechanical and Displacement/Rotation and press continue.
Select the other short end of the deck restrain U3.
Press BC -> Create, Mark Mechanical and Displacement/Rotation and press continue.
Select the bottom of all pylons and restrain U3.
Go to Module: Mesh
Press Seed -> Instance and choose 0.5 as approximate size.

CHALMERS, Civil and Environmental Engineering, Master’s Thesis 2012:96 A 10
Press Seed -> Edge by number and mark all cables and bracing elements. Choose 1
element.
Press Mesh -> Element type and mark all cables and bracing elements. Choose truss
under family.
Press Mesh -> Instance and press yes.
Go to Module: Job
Press Job -> Create and create the job.
Press Job -> Manager and submit the job.

CHALMERS, Civil and Environmental Engineering, Master’s Thesis 2012:96 B 1
Appendix B


CHALMERS, Civil and Environmental Engineering, Master’s Thesis 2012:96 C 1
Appendix C

CHALMERS, Civil and Environmental Engineering, Master’s Thesis 2012:96 C 2

CHALMERS, Civil and Environmental Engineering, Master’s Thesis 2012:96 C 3

CHALMERS, Civil and Environmental Engineering, Master’s Thesis 2012:96 C 4

CHALMERS, Civil and Environmental Engineering, Master’s Thesis 2012:96 D 1
Appendix D
Table D.1 Mode description, natural frequency and mode shown in figure number
for natural frequencies and modes according to Master’s thesis model
according to BRO 2004.
Description of mode shape Natural
frequency
Mode
number
Figure
number
Lateral movement of bridge deck 0.620 1 D.1
Vertical movement of bridge deck 1.386 2 D.2
Lateral movement of pylon 1.390 3 D.3
Lateral movement of bridge deck 1.441 4 D.4
Lateral movement of pylon 1.479 5 D.5
Vertical movement of bridge deck 1.899 6 D.6
Torsional movement of bridge deck 2.350 7 D.7
Lateral movement of bridge deck 2.559 8 D.8
Longitudinal movement of pylons 2.760 9 D.9
Longitudinal movement of pylons 2.786 10 D.10

CHALMERS, Civil and Environmental Engineering, Master’s Thesis 2012:96 D 2
Table D.2 Mode description, natural frequency and mode shown in figure number
for natural frequencies and modes according to Master’s thesis model
according to Eurocode.
Description of mode shape Natural
frequency
Mode
number
Figure
number
Lateral movement of bridge deck 0.746 1 D.1
Lateral movement of pylon 1.539 2 D.3
Lateral movement of pylon 1.644 3 D.5
Vertical movement of bridge deck 1.648 4 D.2
Lateral movement of bridge deck 1.732 5 D.4
Vertical movement of bridge deck 2.285 6 D.6
Torsional movement of bridge deck 2.714 7 D.7
Lateral movement of bridge deck 3.057 8 D.8
Longitudinal movement of pylons 3.244 9 D.9
Longitudinal movement of pylons 3.274 10 D.10

CHALMERS, Civil and Environmental Engineering, Master’s Thesis 2012:96 D 3
Figure D.1 First lateral mode of the bridge deck. The natural frequency from
Master’s thesis model according to BRO 2004 is 0.620 Hz and the
natural frequency from Master’s thesis model according to Eurocode is
0.746 Hz.
Figure D.2 First vertical mode of the bridge deck. The natural frequency from
Master’s thesis model according to BRO 2004 is 1.386 Hz and the
natural frequency from Master’s thesis model according to Eurocode is
1.648 Hz.

CHALMERS, Civil and Environmental Engineering, Master’s Thesis 2012:96 D 4
Figure D.3 First lateral mode of the bridge pylon. The natural frequency from
Master’s thesis model according to BRO 2004 is 1.390 Hz and the
natural frequency from Master’s thesis model according to Eurocode is
1.539 Hz.
Figure D.4 Second lateral mode of the bridge deck. The natural frequency from
Master’s thesis model according to BRO 2004 is 1.441 Hz and the
natural frequency from Master’s thesis model according to Eurocode is
1.732 Hz.

CHALMERS, Civil and Environmental Engineering, Master’s Thesis 2012:96 D 5
Figure D.5 Second lateral mode of the bridge pylon. The natural frequency from
Master’s thesis model according to BRO 2004 is 1.479 Hz and the
natural frequency from Master’s thesis model according to Eurocode is
1.644 Hz.
Figure D.6 Second vertical mode of the bridge deck. The natural frequency from
Master’s thesis model according to BRO 2004 is 1.899 Hz and the
natural frequency from Master’s thesis model according to Eurocode is
2.285 Hz.

CHALMERS, Civil and Environmental Engineering, Master’s Thesis 2012:96 D 6
Figure D.7 First torsional mode of the bridge deck. The natural frequency from
Master’s thesis model according to BRO 2004 is 2.350 Hz and the
natural frequency from Master’s thesis model according to Eurocode is
2.714 Hz.
Figure D.8 Third lateral mode of the bridge deck. The natural frequency from
Master’s thesis model according to BRO 2004 is 2.559 Hz and the
natural frequency from Master’s thesis model according to Eurocode is
3.057 Hz.

CHALMERS, Civil and Environmental Engineering, Master’s Thesis 2012:96 D 7
Figure D.9 First longitudinal mode of the bridge pylons. The natural frequency
from Master’s thesis model according to BRO 2004 is 2.760 Hz and the
natural frequency from Master’s thesis model according to Eurocode is
3.244 Hz.
Figure D.10 Second longitudinal mode of the bridge pylons. The natural frequency
from Master’s thesis model according to BRO 2004 is 2.786 Hz and the
natural frequency from Master’s thesis model according to Eurocode is
3.274 Hz.


CHALMERS, Civil and Environmental Engineering, Master’s Thesis 2012:96 E 1
Appendix E
%% Calculation of damping factor
t = filtery.time ; % Time from filtered measurements
y = filtery.data ; % Accelerations from filtered measurements
sampleRate = 1/(t(2)-t(1)) ;
startTime = 40 * sampleRate ; % Test dependent variable
endTime = 80 * sampleRate ; % Test dependent variable
upOrDown = sign(diff(y)) ;
maxPos = [upOrDown(1)<0 ; diff(upOrDown)<0 ; upOrDown(end)>0] ;
tops = find(maxPos) ;
t_coord = [] ; % Coordinates in "time-direction"
a_coord = [] ; % Coordinates in "acceleration-direction"
for i = 1:length(tops)
if (tops(i) > startTime) && (tops(i) < endTime)
t_coord = [t_coord t(tops(i))] ;
a_coord = [a_coord y(tops(i))] ;
end
end
fit_damp = fit(t_coord',a_coord','exp1') ;
plot(t,y,'-r',t_coord,a_coord,'ok')
hold on
plot(fit_damp,'b')
damp_factor = 1/(2*pi) * log(fit_damp(t_coord(1)) / fit_damp(t_coord(2)))
%% Function to calculate Fast Fourier Transformation
function [] = FFTtransformation(y,t)
L = length(y);
Fs = L / t(end);
NFFT = 2^nextpow2(L);
Y = fft(y,NFFT)/L;
f = Fs/2*linspace(0,1,NFFT/2+1);
plot(f,2*abs(Y(1:NFFT/2+1)))
xlim([0 5])
xlabel('Frequency (Hz)')
ylabel('|Y(f)|')