Embed Size (px)
Citation preview
1
Abstract The vibration transmission in a modular, parametric lightweight building is studied in this paper using the finite element method. The main focus of the research is to investigate the influence of geometry and configuration of the building on the vibration transmission. A building with a single room in the width direction is modelled, varying the size (length and width) of a room as well as the numbers of storeys and rooms along the facade. The wall and floor panels of the building are assumed to be beam-stiffened two-leaf panels. The numerical results demonstrate the capabilities of the proposed finite element model as well as the impact of changes to the building geometry on the vibration levels in rooms near or far from the source. Keywords: lightweight, building, modular, parametric, vibration, frequency gap, flanking transmission. 1 Introduction Transmission of sound in a multi-storey building is a complex phenomenon. Sound emanating from a source in one room can reach an adjacent room as airborne sound via direct transmission through a wall or floor. Alternatively, flanking transmission may occur through structural members and joints connecting walls and floors in the building. Furthermore, in lightweight structures made of wooden panels on timber frames, ribs and studs provide periodic stiffening in one or more directions, leading to orthotropic behaviour and the presence of stop bands in certain frequency ranges.
Due to the complicated nature of sound and vibration transmission in multi-storey lightweight buildings, predictions of sound pressure and vibration levels in such buildings in the design phase are difficult. As an example, the low-frequency vibration levels in rooms far from a source in the seven-storey wooden framed
Paper 194 Vibration Transmission in a Multi-Storey Lightweight Building: A Parametric Study B. Niu1, L.V. Andersen2, N. Kiel2, O. Flodén3 and G. Sandberg3 1 Department of Mechanical and Manufacturing Engineering 2 Department of Civil Engineering Aalborg University, Denmark 3 Division of Structural Mechanics, Lund University, Sweden
©Civil-Comp Press, 2012 Proceedings of the Eleventh International Conference on Computational Structures Technology, B.H.V. Topping, (Editor), Civil-Comp Press, Stirlingshire, Scotland

2
building “Limnologen” in Växjö, Sweden, were found–somewhat surprisingly–to be greater than the levels in rooms close to the source. However, a posterior finite element analysis (FEA) revealed the same tendency [1], and for this reason a design tool based on FEA is believed to provide prediction of sound and vibration levels in the low-frequency range that can be used in the early design phase. An aim of the research project “Silent Spaces”, funded by the European Union, is to develop such a design tool to aid engineers in the decision-making process regarding the geometry, material properties and connectivity of a building structure by allowing parameter studies and optimization.
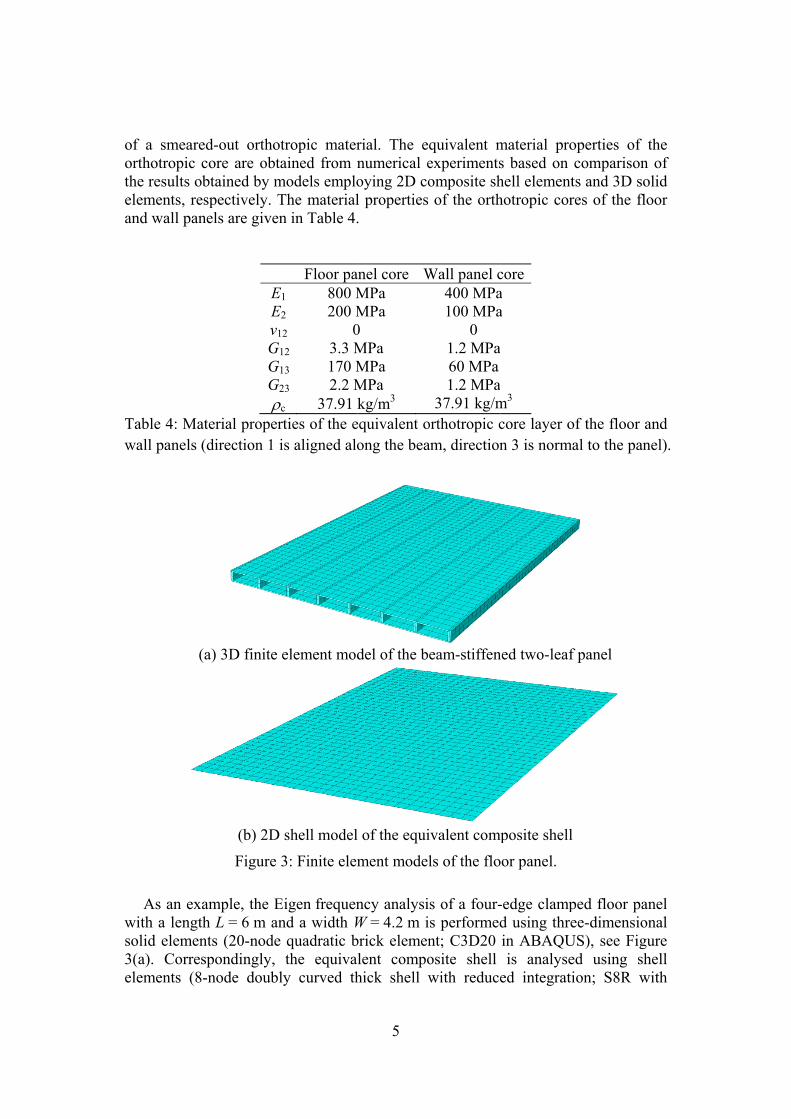
In the companion paper by Andersen et al. [2], the detailed process of parametric modelling of a modular building is presented. In this paper, vibro-acoustic analysis is performed by means of a simple version of the model, where the entire building is constructed by translation and combination of three basic modular elements, i.e. one floor panel and two different wall panels. The floor and wall panels are considered as beam-stiffened double-leaf panels. As a view to reduce the modelling and analysis cost, each panel is homogenized into an equivalent composite plate with two isotropic skin layers and one orthotropic core layer. The material properties of the orthotropic core are obtained via numerical experiments of the panel using the two-dimensional (2D) composite shell elements and three-dimensional (3D) solid elements, respectively. Furthermore, an artificial skeleton is introduced to facilitate the modelling of different connections between modules in the building. More details on the implementation of an artificial skeleton are available in Ref. [3].
In this paper, the Python programming language is used to perform the parametric modular modelling and analysis of a multi-storey lightweight building in the commercial finite element software ABAQUS [4]. Parameterization of the important dimensions and partition numbers is convenient for further design optimization.
Using this parametric building model, free vibration analysis is performed to obtain the distribution of Eigen frequencies of the building. Then the forced vibration of the building subjected to a mechanical excitation is analysed to investigate the transmission of vibration. The influence of different excitation frequencies on the vibration transmission will be studied and discussed. The vibration response in two different receiving rooms, one near the source and one far from the source, is illustrated and discussed for the various geometric configurations of the building.
2 Parametric modelling of a modular building A three-dimensional finite-element model of a modular building is made in ABAQUS. A schematic illustration of the modular building with homogenous panels is shown in Figure 1, called as “Building 4-3”, which has m = 4 rooms in the x-direction (West-East, W-E), n = 3 storeys in the y-direction (vertical), and one room (assumed to be given for all examples) in the z-direction (North-South, N-S). The influence of parameters m and n on vibration transmission will be discussed in the numerical examples. The wall panels along the facade of the building are

3
omitted. The geometric parameters of the building are given in Table 1. These parameters are subject to be varied, and the impact of changes on the vibration transmission will be studied.
Figure 1: Schematic illustration of Building 4-3 with homogeneous panels.
Number of rooms along the facade m
Number of storeys n Length of room (W-E, along the facade, x-direction) L
Height of room (Vertical, y-direction) H Width of room (N-S, z-direction) W
Table 1: Geometric parameters of the building.
The location of a room or module such as a wall or floor panel can be identified by a parametric name. With reference to the accompanying paper [2], the name includes two parts, for example in the name 'xWall 2-1', the first part 'xWall' denotes the panel type as a wall along the x-direction, and the second part '2-1' denotes the position of such a wall in the whole building with the two numbers representing the positions along the two directions x and y, respectively. Similarly, Room 1-2 represents a room at the position shown in Figure 1.
The modules consist of floor and wall panels. In this paper, beam-stiffened two-leaf panels are used as a reference configuration for the floor and wall panels, as shown in Figure 2(a). The stiffeners are uni-directionally placed, i.e., along the longitudinal direction for the floor and the vertical direction for the wall. The two skin plates and stiffeners are made of the same isotropic material with Young’s modulus 99.5 10E = × Pa, Poisson’s ratio v = 0.35, and mass density ρ = 455 kg/m3. Structural damping is introduced for the frequency response analysis in the form of a complex Young’s modulus * (1 )E i Eη= + × , where the structural damping factor η is assumed to be 0.01. The spacing of stiffeners in the floor and wall panels is the same, and equals to 0.6 m centre-to-centre distance.

4
(a) (b)
Figure 2: A reference configuration of the panel: (a) The beam-stiffened two-leaf panel; (b) The equivalent composite plate with an orthotropic core.
The thickness of the floor panel is 200 mm, where the thicknesses of the skin
plate and the core are 20 mm and 160 mm, respectively. The external and internal walls are assumed to be the same with 10 mm thick skin and 80 mm thick core. The geometric parameters of the stiffeners of the floor and wall panels are summarized in Table 2 and Table 3.
Parameter Value Length L Height 0.16 m (160 mm)
Thickness 0.05 m (50 mm) Number of beams in one floor panel W/0.6+1
Table 2: Geometric parameters of the beam as stiffener of the floor panel (beams are aligned along the facade).
Parameter Value Length H Width 0.05 m
Thickness 0.08 m Number of beams in xWall (wall along x-direction) L/0.6+1 Number of beams in zWall (wall along z-direction) W/0.6+1
Table 3: Geometric parameters of the beam as stiffener of the wall panel (beams are aligned vertically).
Although the direct computation of a building by meshing panels by three-
dimensional solid elements can provide detailed behaviour of the panels [5], it results into a high computational cost. Due to this disadvantage, approximate approaches are often used in the vibration analysis of a building. References [2, 6] apply substructure techniques to the vibration analysis of a building by modelling each panel as a substructure with much less retained degrees of freedom compared with the original model of the panel. Homogenization techniques are also used to obtain an equivalent single layer plate from the beam-stiffened two-leaf panel [7]. In this paper, the beam-stiffened two-leaf panel is homogenized into an equivalent composite shell with three layers shown in Figure 2(b), where the top and bottom layers are made of the same isotropic material as above. However, the core is made
of orththeeleand
Tabwa
witsol3(aele
a smeared-hotropic co
e results obtments, respd wall panel
ble 4: Mateall panels (d
(a)
As an examth a length id elements
a). Correspments (8-n
-out orthotrore are obtatained by mpectively. Tls are given
E1E2v12G12G13G23
ρc erial propertirection 1 is
) 3D finite e
(b) 2D s
Figure 3
mple, the EiL = 6 m ans (20-node ondingly, t
node doubly
ropic materained from nodels emplo
The materialn in Table 4.
Floor pa 800 M 200 M
2 02 3.3 M3 170 M3 2.2 M 37.91 kties of the es aligned alo
element mod
shell model
3: Finite elem
igen frequend a width Wquadratic bthe equivay curved th
5
rial. The enumerical eoying 2D col properties .
anel core WMPa MPa 0 MPa MPa MPa kg/m3
equivalent oong the bea
del of the b
l of the equi
ment model
ncy analysiW = 4.2 m ibrick elemenlent compohick shell w
quivalent mexperimentsomposite shof the orth
Wall panel c400 MPa100 MPa
0 1.2 MPa60 MPa1.2 MPa
37.91 kg/morthotropic cam, direction
eam-stiffen
ivalent comp
ls of the flo
s of a four-s performednt; C3D20 osite shell with reduce
material pros based on hell elementhotropic cor
corea a
a
a m3 core layer on 3 is norm
ned two-leaf
mposite shell
oor panel.
-edge clampd using threin ABAQUis analyse
ed integrati
operties of comparisonts and 3D sores of the fl
of the floor al to the pan
f panel
l
ped floor paee-dimensio
US), see Figed using sion; S8R w
the n of olid loor
and nel).
anel onal gure hell
with

6
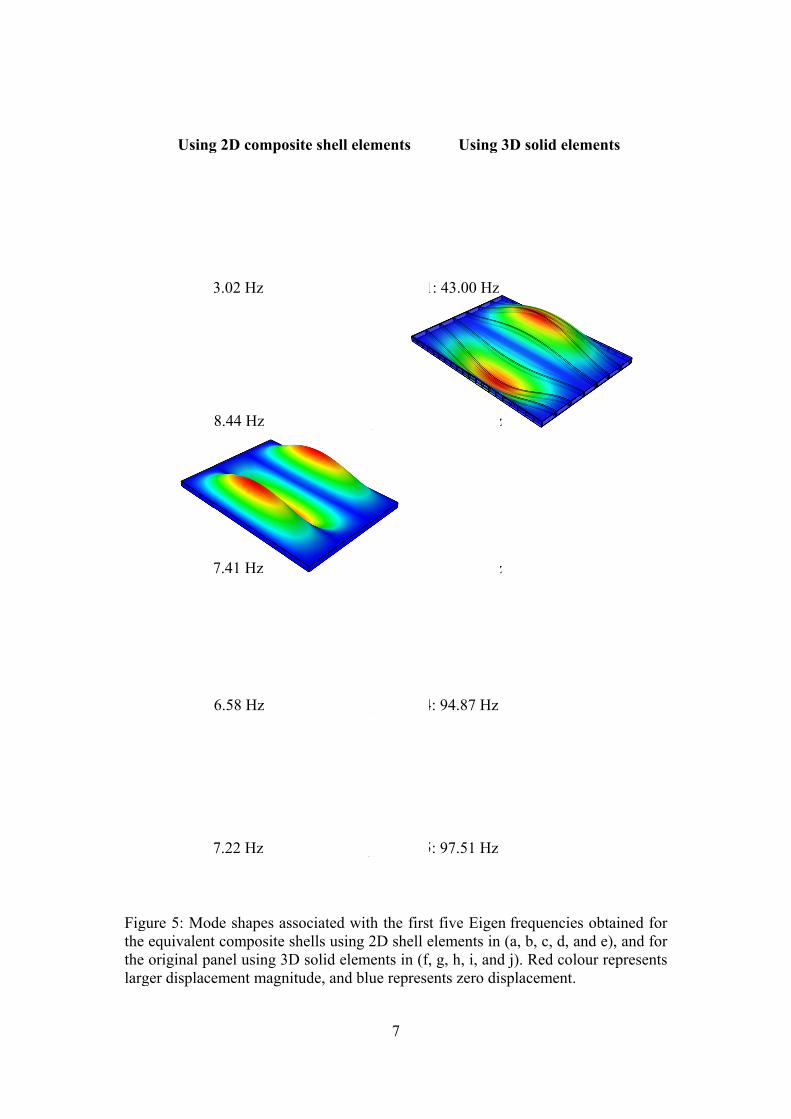
composite section in ABAQUS), see Figure 3(b). A good agreement between the Eigen frequencies obtained using the two approaches can be seen in Figure 4. The corresponding mode shapes agree very well up to 10th order. The comparison of the first five mode shapes is given in Figure 5. This comparison demonstrates that the assumption of homogenizing the panel into a multi-layer composite shell is reasonable in the frequency range up to 145 Hz.
Figure 4: Eigen frequencies of a four-edge clamped floor panel using 3D solid elements and composite shell elements.
For the wall panels, an adequate match between the shell model and the original
3D solid model has been achieved for the first 10 modes up to about 110 Hz. Based on the investigation above, the composite shells are used for the modelling and analysis of floor and wall panels in a building.
3 Vibration transmission in a building: parametric study Firstly, buildings with different numbers of rooms (m, n) are considered while the dimensions of a room are kept as L = 6 m, H = 3.6 m, and W = 4.2 m. Then, Building 4-3 as shown in Figure 1 is studied for different values of the length L and width W of the room with the same height H = 3.6 m. The free vibration analysis and forced vibration analysis are performed for different buildings. For all examples, all edges of ground floors (edges of yFloor 1-1, yFloor 2-1, yFloor 3-1, and yFloor 4-1 for Building 4-3 in Figure 1) including the partition wall edges are clamped, i.e., the translational as well as the rotational degrees of freedom are fixed.
Figthethelarg
(b)
(a)
(c)
(d)
(e)
Using
gure 5: Mode equivalente original pager displace
) Mode 2: 5
Mode 1: 43
Mode 3: 77
) Mode 4: 96
Mode 5: 97
g 2D compo
de shapes at composite anel using 3ement magn
8.44 Hz
3.02 Hz
7.41 Hz
6.58 Hz
7.22 Hz
osite shell e
associated wshells using
3D solid elenitude, and b
7
elements
with the firsg 2D shell e
ements in (f,blue represe
(f) Mode 1
(g) Mode 2
(h) Mode 3
(i) Mode 4
(j) Mode 5
Using
t five Eigenelements in
f, g, h, i, andents zero di
1: 43.00 Hz
2: 58.96 Hz
3: 78.25 Hz
4: 94.87 Hz
5: 97.51 Hz
3D solid el
n frequencie(a, b, c, d,
d j). Red cosplacement
z
z
lements
es obtainedand e), and
olour represet.
d for d for ents

8
3.1 Different numbers of rooms (m, n) 3.1.1 Free vibration analysis The undamped Eigen frequencies of the building with different numbers of rooms have been calculated for the frequency range 0-112 Hz, and the result is given in Figure 6. The first Eigen frequencies of Buildings 4-3, 4-4, 5-3, and 5-4 are 11.79 Hz, 7.61 Hz, 11.63 Hz, and 7.51 Hz, respectively. Since the edges of the ground floor are fixed in the applied boundary conditions, the length of the building only has slight influence on the first several Eigen frequencies related with the global mode shapes. This is confirmed from the distribution of the Eigen frequencies in Figure 7, where it can be seen that the first two Eigen frequencies of Buildings 4-3 and 5-3 are very close, and the corresponding results of Buildings 4-4 and 5-4 are also similar. When one more storey is added to the building, the first Eigen frequency deceases, e.g. decreasing from 11.79 Hz to 7.61 Hz for Buildings 4-3 and 4-4.
The corresponding 1st to 4th mode shapes are shown in Figure 8, where it is observed that the first mode shape of Building 4-3
corresponds to the global bending vibration of the entire building, and the vibration of floor panels appears in the 3rd mode shape.
Figure 6: Eigen frequencies in the range 0-112 Hz of the buildings with different numbers of rooms and storeys.

Fignum
Fig12.W =rep
gure 7: Eigmbers of ro
gure 8: Mo.15, 19.38, = 4.2 m. R
presents zero
en frequencoms and sto
(a) Mode
(c) Mode
ode shapes and 20.38 H
Red colouro displacem
cies in the oreys.
1: 11.79 Hz
3: 19.38 Hz
associated Hz, respect
r representment.
9
range 0-40
z
z
with the tively) of Bs larger d
0 Hz of the
(b) M
(d) M
first four EBuilding 4-3displacemen
e buildings
Mode 2: 12.1
Mode 4: 20.3
Eigen frequ3 with roomnt magnitu
with differ
15 Hz
38 Hz
uencies (11m size L = 6ude, and b
rent
.79, 6 m, blue

10
3.1.2 Forced vibration response The forced vibration analysis of the buildings subjected to a harmonic concentrated force yF is carried out in the range 0-120 Hz with a frequency step of 1/3 Hz for Buildings 4-3, 4-4, 5-3 and 5-4. The force yF is applied along the vertical direction y at the centre of the floor of Room 1-2 with the amplitude 1000 N. The response at Room 2-2 and Room 4-3 are calculated as the root-mean-square (RMS) value of the complex translational displacement amplitudes in the three directions x, y, and z in all nodes of all surrounding sides, i.e., two floor panels and three wall panels:
( ) ( )2 2
1
1 Re ImN
j jRMSj
U U UN =
= +∑ (1)
where ( )Re jU and ( )Im jU represent the real and imaginary parts of the complex translational displacement amplitude at node number j. N is the total number of nodes on the surround surfaces of the receiving room.
Figure 9: Frequency response at Room 2-2 (near the source room) of Buildings 4-3, 4-4, 5-3, and 5-4.
Figures 9 and 10 show the results in dB re 10 pm for Room 2-2 and Room 4-3, where Room 2-2 is the neighbouring room of the source room, and Room 4-3 is relatively distant from the source room. Several gaps are observed in these figures where quite low response is obtained due to the absence of structural Eigen modes, cf. the results of Eigen frequencies in Figure 6. The band gap near 75 Hz is clearly visible. In these frequency gaps, the response in the distant receiving Room 4-3 is approximately 15 dB lower than the response in the near receiving Room 2-2.

11
However, at some frequencies, the response in Room 4-3 is even larger than the response in Room 2-2.
In accordance with the findings at the Växjö site [1], it can be observed from Figure 10 that when one neighbouring room is added in the building, e.g., comparing the response of Buildings 4-3, 4-4 and 5-3, the response in Room 4-3 may increase significantly. Since all degrees of freedom at the connections of panels are fully coupled, significant flanking transmission may result into this effect. For Building 4-4 and 5-4, the response in Room 4-3 is even higher than that in Room 2-2 when the excitation frequencies are near the second Eigen frequency 7.8 Hz of the building, which is associated with a twist-like mode shape as shown in
Figure 8(b).
Figure 10: Frequency response at Room 4-3 (distant from the source room) of Buildings 4-3, 4-4, 5-3, and 5-4.
Since there are many peaks in the frequency response curve, particularly in the higher frequency range, it is difficult to observe the distinct difference of the influence of room numbers on the vibration transmission. In fact, the average response over octave bands is usually adopted in vibration measurements. Therefore, the vibration transmission is further studied by calculating average response levels in each 1/3 octave band for Rooms 2-2 and 4-3 in the frequency range 5.6-112 Hz. The lower limit 5.6 Hz is below the first Eigen frequency of all buildings considered here. In the lower 1/3 octave bands there are fewer Eigen frequencies than in the higher 1/3 octave bands, e.g., only one Eigen frequency exists in the 1/3 octave band centring at 10 Hz, but there are much more Eigen frequencies in the 1/3 octave band centring at 63 Hz. The average response levels in the 1/3 octave bands are given in Figures 11 and 12. These results confirm the observations from the frequency response curve that:

12
• At several frequency gaps, the response in the distant receiving Room 4-3 is lower than the response in the near receiving Room 2-2; e.g., in the frequency range 10-16 Hz, the response in Room 4-3 is approximately 20 dB lower than that in Room 2-2 for Buildings 4-4 and 5-4.
• The flanking transmission may play a significant role in increasing the response in Room 4-3 when one neighbouring room is added in the building, see the result in Figure 12 in the 1/3 octave bands in the frequency range 20-40 Hz.
• There are different influences on the vibration transmission when more rooms are added to the building in the x or y-direction, or in both directions. By comparing the response in Room 4-3 of Buildings 4-4, 5-3, and 5-4, it is found that in the low frequency range 6.3-16 Hz, the change to the building by adding one more storey has resulted into a significant influence on the response in Room 4-3, where the resonance peak is moved left relative to the peak of the response curve of Building 4-3. However, in this low frequency range, the response of Building 5-3 with one more room in the x-direction has a slight difference with the response of Building 4-3. When a higher frequency range is considered, e.g. in the range 31.5-50 Hz, Building 5-3 has the lowest average response among these buildings. Furthermore, as discussed in the free vibration analysis, in the lower frequency
range below 16 Hz, since the mode shapes of the buildings correspond to the global vibration of the building, the frequency responses of Buildings 4-3 and 4-4 are similar to the responses of Buildings 5-3 and 5-4, respectively.
Figure 11: RMS displacement in Room 2-2 for each 1/3 octave band for Buildings 4-3, 4-4, 5-3, and 5-4.

13
Figure 12: RMS displacement in Room 4-3 for each 1/3 octave band for Buildings 4-3, 4-4, 5-3, and 5-4.
3.2 Different room sizes (L, W) Now, we consider the influence of room length L and room width W on the vibration transmission in Building 4-3. The undamped Eigen frequencies of the buildings with different values of L and W are given in Figure 13. The corresponding first four mode shapes are shown in Figure 14 for Building 4-3 with room size L = 6 m, and W = 4.8 m. It is interesting to find that the order of the first two Eigen modes is switched compared with the order in Figure 8, which will have an impact on the response in Room 2-2 and 4-3.
The response level in dB re 10 pm for Room 2-2 and Room 4-3 is shown in Figure 15 and Figure 16 for different room sizes, respectively. It is seen that the responses in Room 2-2 and Room 4-3 are about 120 dB and 97 dB at the very low excitation frequency 4 Hz, respectively. The response in Room 4-3 is 23 dB lower than in Room 2-2. As it is well known, the magnitude of forced vibration response at a very low excitation frequency is close to that of the static response, thus the low frequency excitation mainly influences the neighbouring rooms, such as Room 2-2, due to the fully coupled connections of floor panels between the source room and receiving Room 2-2. However, when the excitation frequency is close to the first Eigen frequency of the building, the response in Room 4-3 is even larger than in Room 2-2. This is because the top floor moves more than the base floor in the forced vibration when the excitation frequency is slightly lower than the first Eigen frequency or in the gap between the first and second Eigen frequencies. In fact, the forced vibration response in such an excitation frequency range is mainly

inflass
Figroo
Fig12.
fluenced by sociated wit
gure 13: Eigom sizes, L
gure 14: M.86, 18.87, a
the first twh the global
gen frequenand W.
(a) Mode
(c) Mode
Mode shapesand 19.88 H
wo modes ol vibration o
ncies in the
1: 12.78 Hz
3: 18.87 Hz
s associatedHz of Buildi
14
of the free vof the build
range 0-11
z
z
d with the ing 4-3 with
vibration ofding, see Fig
12 Hz of Bu
(b) M
(d) M
first four h room size
f the buildingure 14 (a, b
uilding 4-3
Mode 2: 12.8
Mode 4: 19.8
Eigen frequL = 6 m, an
ngs, which b).
with differ
86 Hz
88 Hz
uencies 12nd W = 4.8 m
are
rent
.78, m.

15
Figure 15: Frequency response at Room 2-2 of Building 4-3 with different room size: (L = 6 m, W = 4.2 m), (L = 6 m, W = 4.8 m), (L = 4.8 m, W = 4.8 m), and (L = 4.8 m, W = 4.2 m).
Figure 16: Frequency response in Room 4-3 of Building 4-3 with different room sizes: (L = 6 m, W = 4.2 m), (L = 6 m, W = 4.8 m), (L = 4.8 m, W = 4.8 m), and (L = 4.8 m, W = 4.2 m).

16
Figure 17: RMS displacement for each 1/3 octave band in Room 2-2 of Building 4-3 with different room sizes: (L = 6 m, W = 4.2 m), (L = 6 m, W = 4.8 m), (L = 4.8 m, W = 4.8 m), and (L = 4.8 m, W = 4.2 m).
Figure 18: RMS displacement for each 1/3 octave band in Room 4-3 of Building 4-3 with different room sizes: (L = 6 m, W = 4.2 m), (L = 6 m, W = 4.8 m), (L = 4.8 m, W = 4.8 m), and (L = 4.8 m, W = 4.2 m).

17
Similarly, the average response in 1/3 octave bands is presented in Figure 17 and Figure 18. If the room size L = 6 m and W = 4.2 m is chosen as a reference, the increase of room width brings an obvious reduction in the response of Room 4-3 in the low frequency range 0-10 Hz, e.g., comparing the response in Room 4-3 for buildings with room size L = 6 m and W = 4.2 m, and L = 6 m and W = 4.8 m, respectively. It is also observed that a smaller room with L = 4.8 m and W = 4.2 m decreases the average response in Rooms 2-2 and 4-3 in the frequency ranges 16-20 Hz and 31.5-63 Hz, see Figure 17 and Figure 18.
4 Conclusions
This paper develops a parametric modelling and analysis approach to investigate the vibration transmission in lightweight buildings. In order to reduce the computational cost of a three-dimensional building, the two-leaf beam-stiffened floor and wall panels are modelled as composite shells with two skin layers and one equivalent orthotropic core. The equivalent properties of the homogenized orthotropic core layer of panels are obtained by numerical experiments.
The influence of geometric and configuration parameters of the building on vibration transmission are studied. The frequency response over equally distributed frequency points and average response over 1/3 octave bands are studied in the numerical examples. Some conclusions can be drawn here:
• Several frequency gaps are observed from the frequency response curve. A quite low response is obtained in these gaps due to the absence of structural Eigen modes. Furthermore, in these gaps, the response in a room far away from the source room is much (approximately 15 dB) lower than the response in a neighbouring room.
• The flanking transmission may play a significant role in vibration transmission in a building. The influence of introducing a neighbouring room in the x or/and y-directions, i.e. along the building or on top of the building, on the flanking transmission is discussed. It is found that in the low frequency range 6.3-16 Hz, the change to the building by adding one more storey has resulted into a significant influence on the response in Room 4-3, a room originally placed in the upper corner of the building. However, the response of Building 5-3 with one more room in the x-direction is only slightly different from the response of Building 4-3 in the same frequency range 6.3-16 Hz. When a higher frequency range is considered, e.g. in the range 31.5-50 Hz, Building 5-3 has the lowest average response among these buildings.
• The vibration transmission in buildings with different room sizes is analysed and discussed. If the room size L = 6 m and W = 4.2 m is chosen as a reference, the increase of room width brings an obvious reduction in the response of Room 4-3 in the low frequency range 0-10 Hz. It is also observed that a smaller room with L = 4.8 m and W = 4.2 m decreases the average response in Rooms 2-2 and 4-3 in the frequency ranges 16-20 Hz, and 31.5-63 Hz.

18
Based on the parameter study it may be concluded that changes to a building structure by means of reducing or increasing the number of rooms or the size of modules in a given direction can have a significant impact on the vibro-acoustic performance of the building. A modular, parametric FE model can be very useful for design purposes.
Acknowledgements This work has been funded by the EU InterReg Project “Silent Spaces” and Aalborg University. This support is gratefully acknowledged. References [1] L. Holterman and A. Petersson, “Vibrations in a Seven-storey Wood
Building”, Master’s Dissertation, Division of Structural Mechanics, Lund University, Sweden, ISSN 0281-6679, 2008.
[2] L.V. Andersen, P.H. Kirkegaard, K. Persson, N. Kiel and B. Niu, “A Modular Finite-Element Model for Analysis of Vibration Transmission in Multi-storey Lightweight Buildings”, in B.H.V. Topping, (Editor), “Proceedings of the Eleventh International Conference on Computational Structures Technology”, Civil-Comp Press, UK, 2012.
[3] N. Kiel, B. Niu, L.V. Andersen and K. Persson, “Different Modelling Approaches to Coupling Wall and Floor Panels within a Dynamic Finite-element Model of a Lightweight Building”, in B.H.V. Topping, (Editor), “Proceedings of the Eleventh International Conference on Computational Structures Technology”, Civil-Comp Press, UK, 2012.
[4] Dassault Systèmes Simulia Corp., Providence, RI, USA, “ABAQUS Analysis User’s Manual Version 6.11”, 2011.
[5] J.N. Montero and D. Bard, “Reflection and Transmission Properties of a Wall-Floor Building Element: Comparison between Finite Element Model and Experimental Data”, in Conference Proceedings of the ACOUSTICS 2012 HONG KONG, Hong Kong, PR China, May 13–18, 2012.
[6] O. Flodén, K. Persson, A. Sjöström, N. Olhoff, “Model Reduction in Dynamic Finite Element Analysis of Lightweight Structures”, in B.H.V. Topping, (Editor), “Proceedings of the Eleventh International Conference on Computational Structures Technology”, Civil-Comp Press, UK, 2012.
[7] M.C. Remillieux, R.A. Burdisso, G. Reichard, “Transmission of Sonic Booms into a Rectangular Room with a Plaster–Wood Wall using a Modal – Interaction Model”, Journal of Sound and Vibration, 327, 529-556, 2009.