Embed Size (px)
Citation preview

Vanguard Engineering Vibration Monitoring Presentation
Outline• 1. Current Program ( 8 minutes)
– History– MethodologyQ & A
• 2. Proposed Program (16 minutes)– Theory– Methodology– ImplementationQ & A
• 3. Discussion of Vibration Parameters and Measurement Locations (8 minutes)Q & A

Vanguard Vibration Monitoring Presentation

T. C. Rathbone?

Most attribute the beginning of the modern era of industrialvibration measurement to T.C. Rathbone. Rathbone, then ChiefEngineer, Turbine and Machinery Division, for the Fidelity andCasualty Company of New York, originated the first guidelinesfor judging machine condition from vibration measurements in apaper published in 1939. The paper, titled “Vibration Tolerance”and published in Power Plant Engineering, provided a guide forcondition assessment based on vibration velocity from approximately60 cpm (1 Hz) to 7,200 cpm (120 Hz).
The Rathbone paper introduced a number of profound ideasincluding a set of amplitude versus frequency severity curves thatapproximated constant velocity around the rotating frequencies oftypical steam turbine generators. The Rathbone severity criteriawere based on observations and represent the first known methodfor equating vibration amplitude with condition – and by implication,service life and risk of failure. It is amazing to recognize thatthe concepts and severity criteria developed by T. C. Rathbonecontinue to be the basis of many vibration monitoring programs today; seventy two years later!
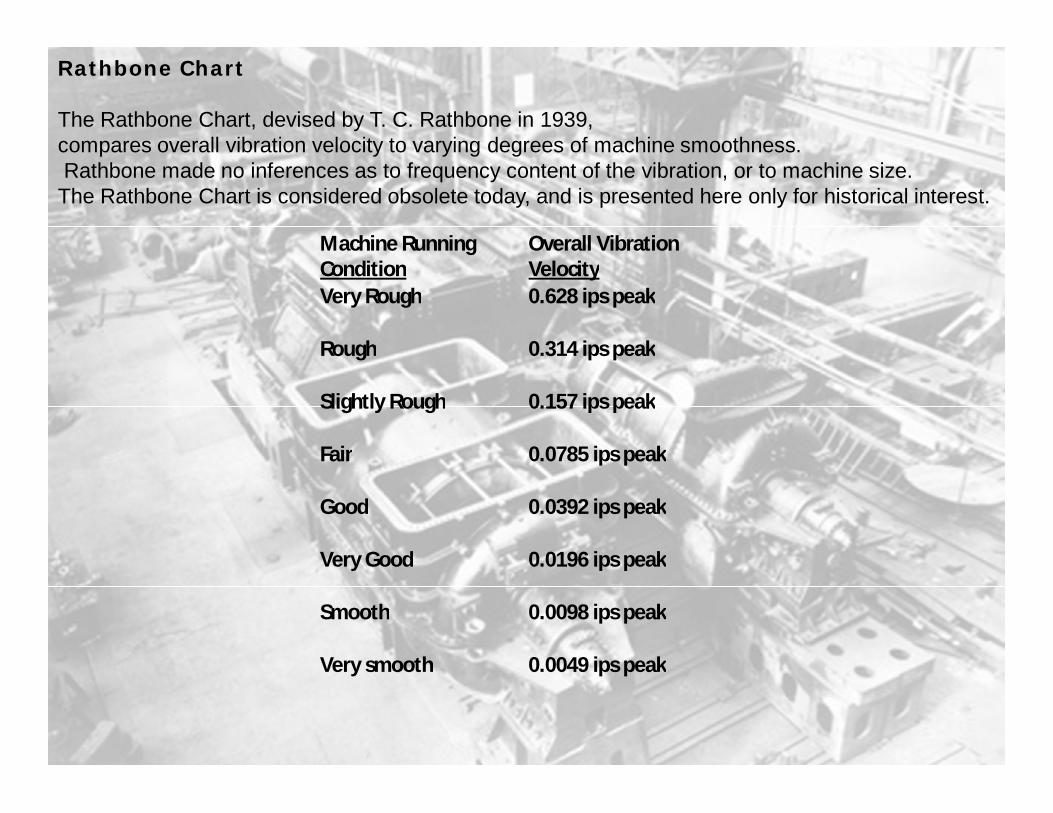
Machine Running Condition
Overall Vibration Velocity
Very Rough 0.628 ips peak
Rough 0.314 ips peak
Slightly Rough 0.157 ips peak
Fair 0.0785 ips peak
Good 0.0392 ips peak
Very Good 0.0196 ips peak
Smooth 0.0098 ips peak
Very smooth 0.0049 ips peak
Rathbone Chart
The Rathbone Chart, devised by T. C. Rathbone in 1939, compares overall vibration velocity to varying degrees of machine smoothness.Rathbone made no inferences as to frequency content of the vibration, or to machine size.
The Rathbone Chart is considered obsolete today, and is presented here only for historical interest.


Fast Forward to…

The Vibration Spectrum

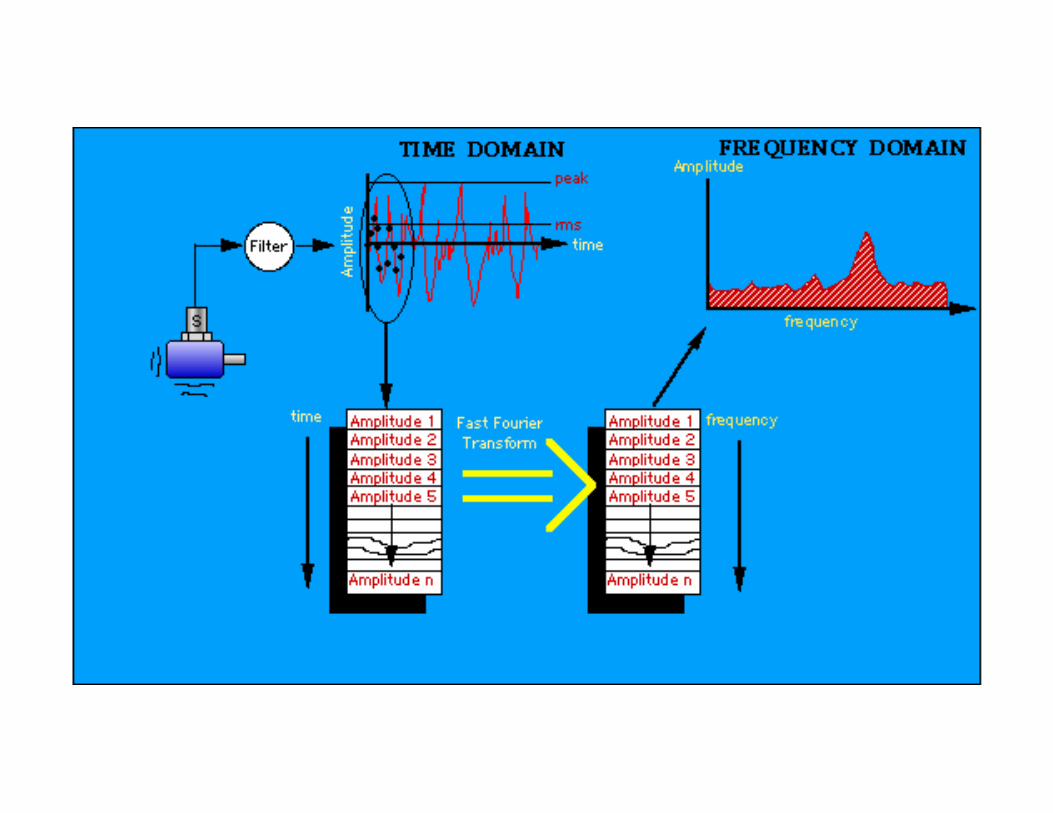


Every machine or group of machine elements moves in ways that produce repetitive vibration at precisely defined frequencies.
These vibration frequencies can be determined from a failure modes analysis and the geometry of the machine elements and located in the vibration spectrum. The vibration spectrum allows us to see the vibration caused by coupling inaccuracies, gear mesh, bearing faults, and many other sources.

“Standard” Methodology
Acquire Data
Vibration Severe?
NO
YES Determine Defect
Frequencies / Acquire
spectrum
Vibration at defect
frequencies?
NO
YES
DiagnosisVibration Severe?
Recommend Action
YES
NO

Questions and Answers

Proposed Program -
The Extra Mile

How do we determine Machine Condition?
n We at Vanguard believe that the only reliable method of assessing machine health from vibration measurements is through trending, -that is, monitoring changes in a machine's vibration spectrum. And not just trending total, peak or other gross vibration parameters, but trending the amount of vibration at the specific frequencies associated with machine faults or other condition related issues.

How do we determine Machine Condition?
n Now, using special signal processing techniques and statistical analyses, we can monitor the progress of any developing machine fault that results in increasing vibration at specific frequencies. Once we determine the maximum amount of vibration we're going to allow at a fault frequency before we repair the machine, we can trend the amount of vibration caused by the particular fault and predict how much time is left before the repair should be made.

Vanguard Methodology
Acquire Data
Fault and condition confirmed
?
Determine Defect
Frequencies for all machines /
Acquire Baseline Spectra
Inspect / Repair Dates predicted?
NO
YES
Diagnosis
Vibration Severe?
Recommend Action
YESNO
Set Inspect and Repair
levels
NOYES
The Extra Mile

Implementation Example

Program Setup
(Baseline Survey) Baseline Spectrum
Measured amounts of vibration at each defect frequency. Inspect and Repair levels calculated as 2.5X and 10.0X baseline.
Red cursors correspond to specific defect frequencies

Reporting
n Once the program is set up, Vanguard takes the vibration measurements from the machines, processes the data and prepares the report.
n The report is designed to provide relevant information to the entire range of personnel - from high level management to engineering and maintenance staff.


Executive SummaryCustomer: Sample Customer
VANGUARD ENGINEERING, INC.
VIBRATION MONITORING REPORT EXECUTIVE SUMMARY
Data Taken: 12/1/2010 Report Date: 12/4/2010 Measurement Point Comment Recomm endation
6
CCW Fan #6A M.P. 331 – 334 CCW Fan #6BM.P. 335 – 338 CCW Fan #5B M.P. 339 – 342 CCW Fan #4B M.P. 343 – 346 CCW Fan #3B M.P. 347 – 350 CCW Fan #2B M.P. 351 – 354 CCW Fan #1B M.P. 355 – 358 Nitrogen Gen. Air Compressor #1 M.P. 359 – 362 Nitrogen Gen. Air Compressor #2 M.P. 363 – 366
Not running. Not running. Not running. No problems noted. No problems noted. W e note an increasing trend in Front Fan Bearing FTF (Cage Defect frequency) vibration. We have a June, 2011 Repair Date with 90% Prediction Confidence. Accelerometers have been removed from the fan. No problems noted. Not running.
No action needed at th is time. No action needed at th is time. No action needed at th is time. No action needed at th is time . No action needed at th is time. Since we are in the range between Inspect and Repair, we will conduct some diagnostics to verify the prediction. Although the vibration level is “Low” (0.02 ips), the trend is significant, and you should begin planning to replace this bearing during the April outage. We will re install these at our next opportunity. No action needed at th is time. No action needed at th is time.

Overall Summary
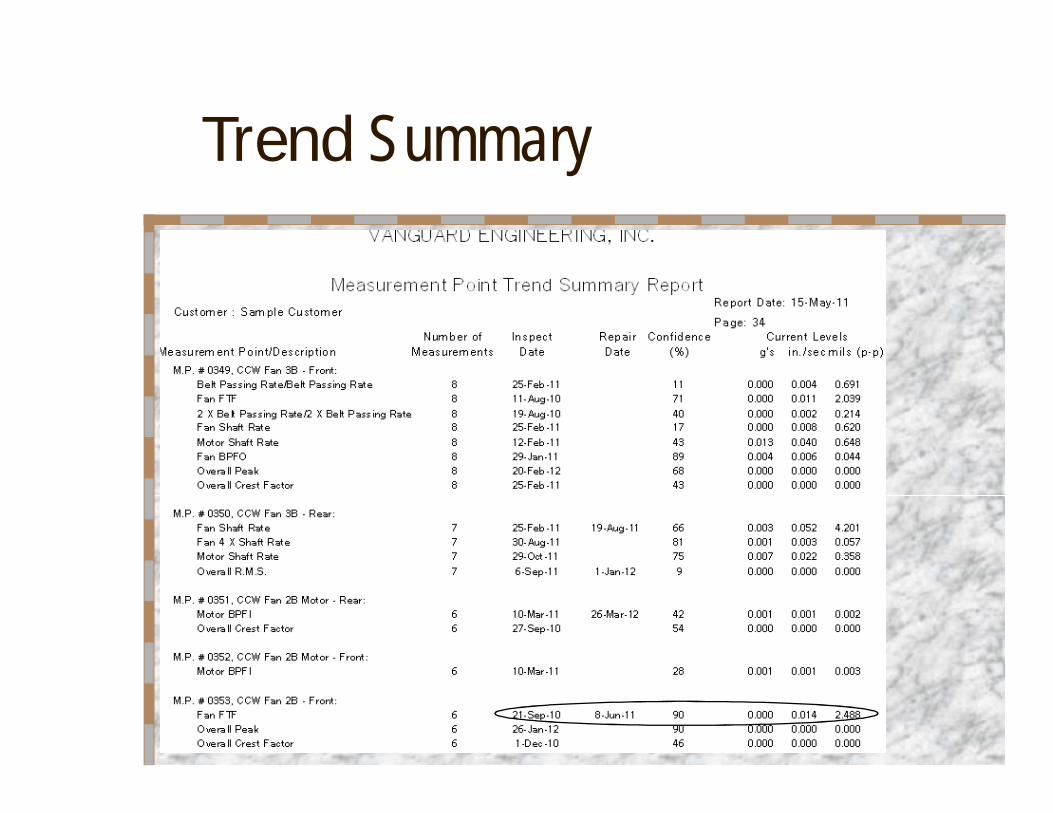
Trend Summary

Measurement Point Report
n The currentspectrum
can be visually
compared to the
baseline.

Measurement Point Report
n Trends of individual trouble spots and time to maintenance estimates can be examined ...

Measurement Point Report
n … and displayed.VANGUARD ENGINEERING, INC.
PREDICTIVE MAINTENANCE REPORTCustomer: Measurement Point No.: 353Description: CCW Fan 2B - Front
Report Date: 12/01/10
acceleration g
1x10⁻³
2x10⁻³
05/10 08/10 11/10 02/11 05/11 08/11 11/11 02/12 05/12
INSPECT09/21/10
REPAIR06/08/11
Fan FTF 1.79 Hz.
Prediction Confidence = 90 %
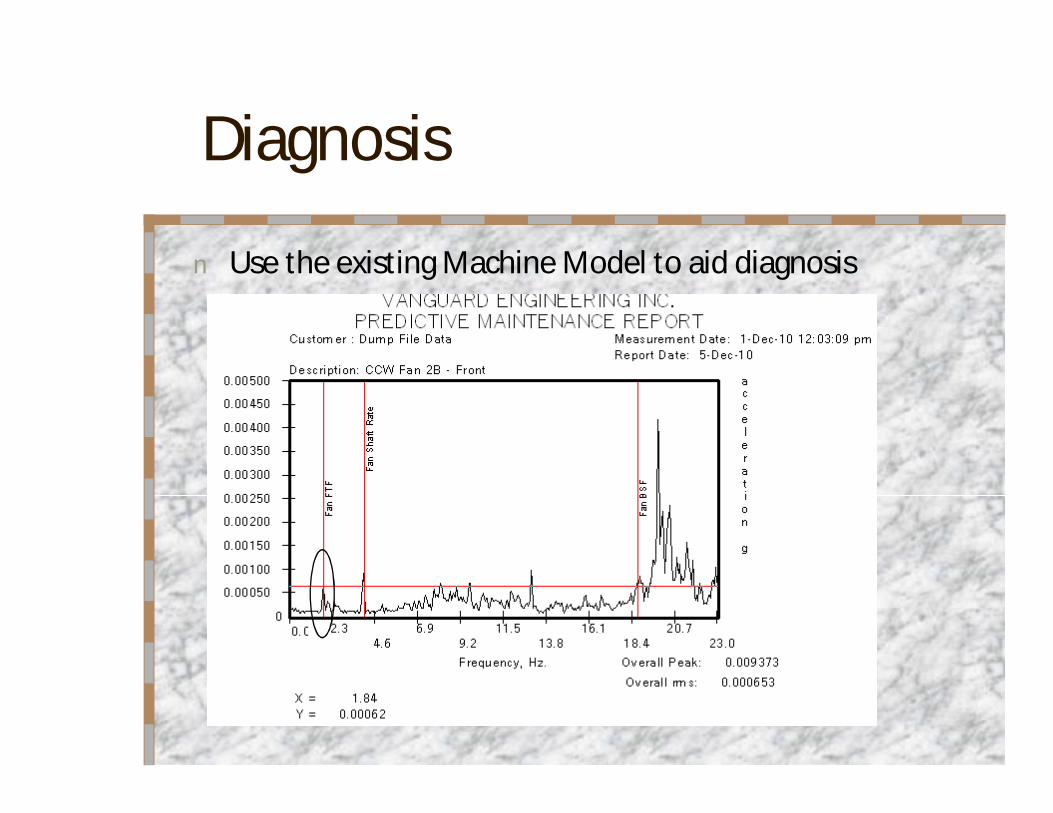
Diagnosis
n Use the existing Machine Model to aid diagnosis

Summary

Vanguard Engineering Will …
n Install measurement point mounting pads.
n Perform Failure Modes Analysis and determine frequencies to be monitored.
n Set up monitoring database.n Take baseline data.n Set Inspect and Repair levels.n Take periodic data.n Provide monitoring reports.

Vanguard Support Services
n Follow - on diagnostics.n Field Balancing.n Laser Alignment.n Infrared Thermography.n Operational Deflection Shape Analysis.nMotor Current Signature Analysis.
The Extra Mile = Value Added
n Failure modes determined by custom-developed Machine Models.
n Monitors defect development that might go unnoticed by current methodology.
n Machine condition assessment based on individual nominals, not just arbitrary absolutes.
n Time-To-Maintenance and Prediction Confidence estimates provide optimized maintenance planning guidance.