Embed Size (px)
Citation preview
Innovative Systems Design and Engineering www.iiste.org
ISSN 2222-1727 (Paper) ISSN 2222-2871 (Online)
Vol.6, No.8, 2015
7
Vibration Control Analysis of Aircraft Wing by Using Smart
Material
Hussein Abdulridha Abdulameer Dr. Hatem R. Wasmi
Department of Mechanical Engineering, College of Engineering, University of Baghdad, Iraq
Abstract
Many of the mechanical systems exposed to undesired vibrations. These vibrations are removed by using active
vibration control (AVC) and hence stability the response of the system. Smart structure technology is used for
vibration reduction. Therefore the aircraft wing is embedded by Piezoelectric as a sensor and actuator. This
material has fast response times and generates large amounts of force. Active vibration control was achieved by
used output feedback control. An aircraft wing is numerically modelled with a used shell element and a couple
filed analysis on piezoelectric between the displacement and the voltage. Output feedback control has been
inserted to a finite element method by using ANSYS parametric design language (APDL). The control of free
and forced vibration for smart structure was investigated. Free vibration is produced by aerodynamic force (lift
force) at maximum speed of the aircraft and by the initial condition. Harmonic excitation (sin wave) is
considered in the forced vibration control by using a piezoelectric shaker. Active vibration control was studied
with different control gains and actuation voltages which affected the vibration control. The effect of changing
the position of PZT, collected pair on mass and stiffness of smart structure as passive control (Control OFF) was
investigated and then the optimal location was found. Experimental works for active vibration control of smart
structure have been presented to verify the closed loop simulations. Free vibration, force vibration and natural
frequency are obtained for experimental works by LABVIEW programs. It was observed that APDL ANSYS
results were well matched with the experimental results. Settling time for free vibration, when the control OFF, is
15s, and when the control ON it is 3s. Displacement Amplitude for force vibration when the control is OFF it is
± 0.04m and when the control is ON it is ± 0.0005m.
Keywords: Smart material, Aircraft wing, Active vibration control.
1. Introduction
The basic functions of an aircraft wing structure are to transmit and resist the applied loads. It consists of thin
shell structures supported by longitudinal stiffening members and transverse frames to enable it to resist bending,
compressive and torsional loads. In spite of this strong structure, the undesired vibration is generated because of
the aerodynamic effect. This makes it able to model lighter mechanical systems withstand higher mechanical
loads at higher speeds without any vibration. Smart materials and active control methods can be used to remove
the undesired vibration by automatic modification of the system's structural response or controlled by applying
counter force that is reverse to original force but equal in amplitude to the original vibration to achieve the
desired response. As a result two opposite force cancel each other and structure becomes stable. The system
mainly requires actuators, sensors and control mechanism that performs well when vibration occurs. Active
vibration control finds its application in all the modern day machines, Engineering structures, bridges, trusses,
buildings, mechanical systems, automobiles, electronics etc. As it needs only a little actuation voltage hence it
does not requires any external power source, the power can be directly derived from the host machine itself. As
the electronics is also developing at a very fast rate hence the size of a processor is also reducing, which is very
useful in the design of the control system.
2. Aircraft Wing Structure
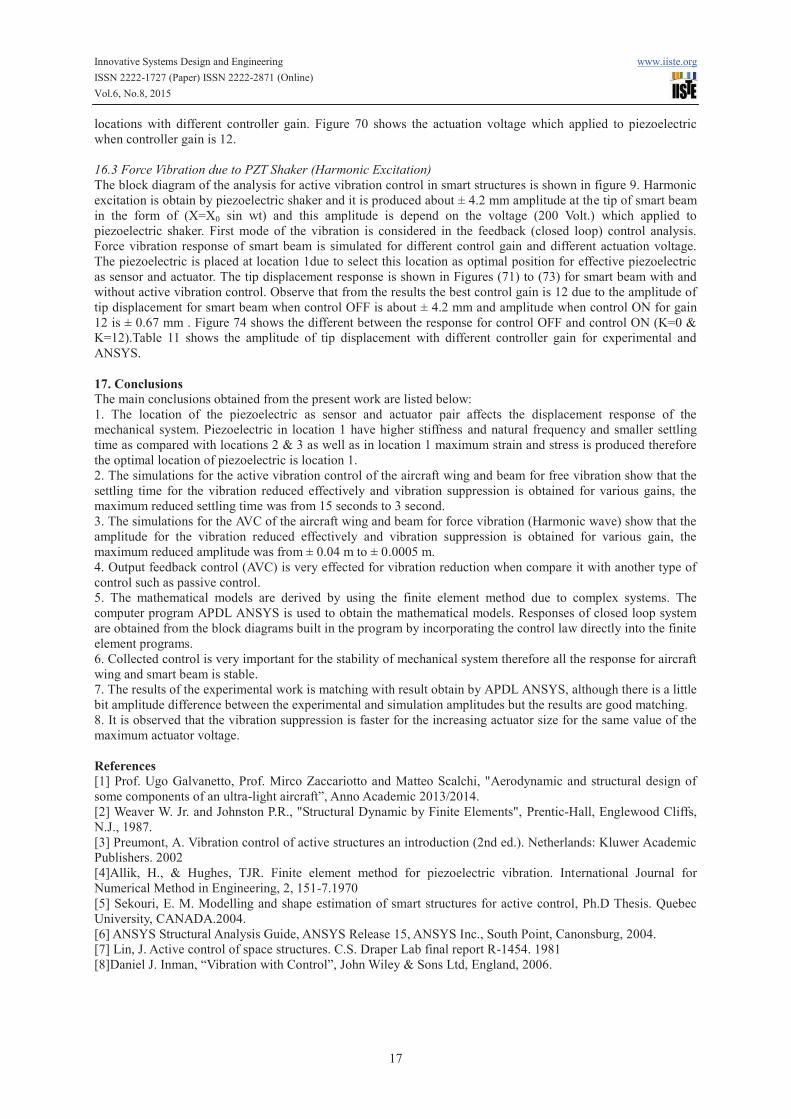
The airfoil type is HQ 3.5/10.This airfoil has been designed by Helmut Quabeck. The total wing span measures
5m so the spars are the most important structural component of the wings. Merlo’s wing has a total of four spars: a main central spar, a front spar, a back spar and the spar at which the control surface, the flap, is attached. The
first two spars, the main and the front, are expected to carry most of the load. They are built in the same way,
being the front one a smaller version of the main spar. The spar consist of two beams made of fir wood that run
all the way from the aircraft plane of symmetry to the rib located at 1.8m from the effective wing root. The total
length of the main spar is 2.1m, including 300mm from the plane of symmetry of the aircraft to the beginning of
the wing. The beams of the main spar are tapered from a width of 100mm at the intersection with the fuselage to
a width of 50mm at the last rib. The front spar has two constant-width beams of 30mm. The ribs are placed
perpendicularly to the wooden beams at a constant interval of 150mm. Thus, in the main part of the wing are
allocated 1800/150 = 12 ribs, plus one at the beginning, making a total of 13 ribs without the ribs for wing tip.
Between the ribs, two vertical side beams made of birch plywood are glued to the main beams. The horizontal
beams plus the side plates make a sort of hollow-rectangular cross-section. The height of the cross-section is not
indicated since it must match the thickness of the airfoil at each section. For this reason the spars result to be
Innovative Systems Design and Engineering www.iiste.org
ISSN 2222-1727 (Paper) ISSN 2222-2871 (Online)
Vol.6, No.8, 2015
8
slightly tapered also in the vertical direction. Referring to the effective root airfoil, the center of the main spar is
located at 320mm from the leading edge, while the front is located at 100mm from the leading edge. The last two
spars are made of carbon rovings, with a constant hollow-circular cross section of diameter 20mm. The thickness
is assumed to be of 0.8mm. The back spar cross-section center is located at approximately 540mm from the
leading edge at the first rib. The back spar is placed perpendicularly with respect to the rib plane. The flap spar is
located approximately at 12% of the airfoil chord from the trailing edge, resulting inclined relatively to the ribs.
The ribs are cut between the back and the flap spar, leaving enough room for a ±45◦ rotation of the flap. The
wing tip skin is sustained by a total of three ribs. The first is located at 100mm from the wing end, the middle at
150mm from the first one and the last at the tip end therefore the total number of ribs including tip wing is
sixteen. The wing tip will be connected to the main wing with a carbon-carbon tube as the ones used for the back
and flap spars. The tube is placed into the main spar, starting from the 9th rib and going into the tip, ending at the
middle tip rib and called front spar tip. The first tip rib is also connected with a 12mm aluminum axle to the back
spar and called back spar tip. [1] The wing structure is shown in the Figure 1.
3. Aircraft wing materials
The wing skin material selection is fundamental due to the skin function. The skins have been modelled using
various layers of glass fiber in epoxy matrix. This material presents an orthotropic behaviour is made of 9 layers
of glass fiber in epoxy matrix. The layers have been placed respectively at [0/−45/+45/90◦/0/90/+45/−45/0] as shown in the Figures 2. Wood is still an excellent material for the construction of light aircrafts due to its good
strength-to-weight ratio & long fatigue life, longer than aluminium or steel. Wood mechanical behaviour is
typically orthotropic: it has different properties (Modulus of elasticity, strength etc.) in the direction of three
perpendicular axes. Based on the foregoing above the material chose for main & front spars are silver fir wood
and birch plywood for each spar. They are built in the same way, the spar consist of two horizontal beams made
of silver fir wood. Between the ribs, two vertical side beams made of birch plywood are glued to the main beams.
The birch plywood, also called aircraft plywood, is widely used in the construction of aircraft models. In fact, it
is obtained by gluing with resin very thin birch veneers at high temperature and pressure. In this way, all the
defects are discarded, and the hardened resin adds resistance to the material, making the compression strength
almost equal to the tension, and reducing the anisotropic effect. The thickness of birch plywood is 1.2mm, made
of three 0.4mm layers. The layers have been placed respectively at [0/90/0] as shown in the Figure 3.The
thicknesses of silver fir wood beams are five different thicknesses have been used, respectively of 5, 10, 15, 20
and 25mm. The different sections defined for the fir beams have been associated to different areas. The thickest
section of 25mm has been associated to areas located from the beginning of the spar to the second rib, for a total
length of 300 + 150 = 450mm. The section of 20mm thickness has been associated with areas from the second to
the third spar, the one of 15mm thickness with areas from the third to the fourth and the one of 10mm thickness
with areas from the fourth to the seventh. The remaining part of the fir beam has been associated with the section
of 5mm thickness. Figure 4 shows the variation of thickness at the different ribs. For the back and flap spars of
the wing chose carbon-carbon pipes (carbon fiber in carbon (epoxy) matrix) to get highly resistant, light and
space-saving beams. Carbon-carbon may be considered an isotropic material. The ribs are made of 10mm thick
flex foam sheets (M-130). Flex foam is an expanded closed cell PVC. It is good rigidity and strength-to-weight
ratio. Mechanical properties are shown in table1.
4. Wing Specification
The specifications of smart aircraft wing which used in this paper are shown in table 2 and figure 5.
5. Finite Element Method
Finite element modeling for smart aircraft wing is presented to evaluate the stiffness, mass and damping matrix
of the mechanical system. After obtain the mathematical modeling for free & force vibration, i.e. the set of
partial differential equations (Equations of Motion) and boundary conditions, has been numerically solve by
using the Mechanical APDL (ANSYS) program to evaluate the natural frequency, mode shape, free vibration
response with or without control and force vibration response with or without control. The finite element method
must be used to solve the problem due to the complexity of the smart wing structure and boundary conditions. A
precise mathematical model is required for the controller design for vibration control to predict the structure's
response.
5.1 Stiffness Matrix [k]e for Shell Element
The stiffness matrix could be obtained from calculating the strain energy U. Applying the principle of variation
approach [2], the strain energy for the element may be written as:
( )òòò=V
e
T
e dVU se2
1 (1)
Innovative Systems Design and Engineering www.iiste.org
ISSN 2222-1727 (Paper) ISSN 2222-2871 (Online)
Vol.6, No.8, 2015
9
Where:
[ ]de B=
(2)
[ ]es ¢¢=¢ D (3)
Substituting equations (2) and (3) in equation (1) yields,
[ ] [ ][ ] e
V
TT
e dVBDBU dd úû
ùêë
é= òòò2
1 (4)
Or
[ ] ee
T
e KU dd2
1=
(5)
Where, [ ]eK is the element stiffness matrix and takes the form;
[ ] [ ] [ ][ ]òòò=V
T
e dVBDBK (6)
5.2 Consistent Mass Matrix [M]e for Shell Element
The mass matrix [ ]eM might be obtained by calculation the kinetic energy KE [2], and can be written as:
[ ] [ ] e
V
TT
e dVNNKE drd && úû
ùêë
é= òòò2
1 (7)
Or,
[ ] ee
T
e MKE dd &&
2
1= (8)
Where, [ ]eM is the consistent mass matrix and is defined as:
[ ] [ ] [ ]òòò=V
T
e dVNNM r (9)
Where, [ ]N is the shape function matrix.
5.3 Equation of Motion for Finite Element
The equation of motion (or dynamic equation) can be derived, using the energy balance principle which involves
that "the summation of the structure energies is stationary", i.e., the summation of kinetic energy, dissipation
energy, strain energy and potential energy is stationary, or
StationaryPEUDEKE =+++ (10)
If these energies are defined in terms of a nodal displacement vectord , then,
( ) 0=+++¶¶
PEUDEKEd (11)
The potential energy PE (with the absence of body forces) can be written as:
( )tFWPE e
T
ed-=-= (12)
Where, ( )tFe is the nodal forces vector.
Substituting equations (5), (8), and (12) in equation (11) gives,
[ ] [ ] [ ] ÷ø
öçè
æ -++
)(2
1
2
1
2
1
2
1tFKCM e
T
e
T
ee
T
eee
T
eee
T
e
e
dddddddd
&&&&
=0 (13)
The derivation of the first term of the upper equation is obtained as follows:
[ ] [ ] [ ]( ) [ ] eeeeee
T
e
ee
eee
T
e
e
MMdt
dM
dt
dM dddd
ddd
ddd
&&&&&
&
&& ==÷ø
öçè
æ
¶¶¶
=÷ø
öçè
涶
2
1
2
1
The other terms can be easily derived to get the final form of the dynamic equation of finite element.
[ ] [ ] [ ] )(tFKCM eeeeeee =++ ddd &&&
(14)
(15)
Where and are the structural damping constant
6. Piezoelectric Equations
The unstressed in one dimensional dielectric medium, the displacement of electric D (charge per unit area C/m2)
is related to the field of electric E (V/m) by.
D = e E (16)
Where:
e = dielectric constant of the Piezoelectric
As well as in one dimensional elastic body placed in zero field of electric, the stress T (N/m2) and the strain S
are related by

Innovative Systems Design and Engineering www.iiste.org
ISSN 2222-1727 (Paper) ISSN 2222-2871 (Online)
Vol.6, No.8, 2015
10
S = s T (17)
Where:
s = compliance of the Piezoelectric (inverse of the Young modulus).
For piezoelectric material, the mechanical and electrical constitutive equations are coupled.
S = sE T + d E (18)
D = d T + εT E (19)
Where in Equation (18):
d = piezoelectric constant relate the strain to the field of electric E in the absence of mechanical stresses.
sE = the compliance when the electric field E is constant.
Where in Equation (19):
d relates the electric displacement D to the stress under zero field of electric E (m/V or Coulomb/Newton).
εT = dielectric constant under constant stress.
If the direction of the polarization synchronizes with direction 3 then constitutive equation for the sensing and
actuation mechanisms can be rewritten in matrix form [3]:
Actuation:
S11 s11 s12 s13 0 0 0 T11 0 0 d31 E1
S22 s12 s22 s23 0 0 0 T22 0 0 d32 E2
S33 s13 s23 s33 0 0 0 T33 0 0 d33 E3
2S23 0 0 0 s44 0 0 T23 0 d24 0
2S13 0 0 0 0 s55 0 T13 d15 0 0
2S12 0 0 0 0 0 s66 T12 0 0 0 (20)
Compliance Coupling
Sensing:
D1 0 0 0 0 d15 0 T11 ε11 0 0 E1
D2 0 0 0 d24 0 0 T22 0 ε22 0 E2
D3 d31 d32 d33 0 0 0 T33 0 0 ε33 E3
Coupling T23 permittivity
T13
T12 (21)
Examining actuator equation (20), when field of electric E3 is applied parallel to the direction of polarization, the
extension is observed along same direction (direction of polarization) and its amplitude is controlled by the
piezoelectric coefficient constant d33. Shrinkage is obtained along the direction one (1) and two (2) orthogonal
to the electric field and its amplitude of which is governed by d31 and d32 respectively. Piezoceramic has an
isotropic behaviour in the plane d31 = d32.
7. Finite Element Method for piezoelectric
Mechanical APDL (ANSYS) program offers three and two dimensional piezoelectric coupled field elements in
order to modelling smart structures with piezoelectric sensors / actuators. Static, modal, transient analysis and
full harmonic can be performed with this finite element program. They have the capability of modelling
piezoelectric. Piezoelectric elements have four degree of freedom (DOF) at each node (ux, uy, uz and volt). In
this case of vibration reduction, it is necessary use ‘coupled-field analysis’ to couple the interaction between
electric field and applied stress therefor coupled field elements that consider electrical and structural coupling are
required in order to perform the finite element analysis of smart structure. The coupled field element shall be
containing all necessary nodal DOF.
7.1 Finite Element Formulation for Piezoelectric
Piezoelectricity is considered a linear theory in which the elastic, piezoelectric, and dielectric coefficients are
treated as constants. Constitutive equations that Mechanical APDL (ANSYS) use to model piezoelectric material
are rearranged in matrix form as the following [4].
{T} [c] [e] {S}
{D} [e] T
[-ε] {-E} (22)
Therefore, Mechanical APDL (ANSYS) only considers these material properties for piezoelectric three
dimension elements, including elastic stiffness matrix or compliance matrix, piezoelectric matrix [e] or [d] and
permittivity matrix.
For finite element piezoelectric, using shape functions and nodal solution variables can be obtain the
displacements and electrical potentials for element domain:
{uc} = [Nu]
T {u} (23)
Vc = [NV]
T {V} (24)
0 0 0 T0 0 0 T
0 0 0 T
0 0 0 T
0 0 T
0 T
0 0 0 (20)
0 T
0 0 T
0 0 0
0 T
0 0 T
0 0 0
Coupling T
0 0 E
0 E
0 0 E
0 E
2
{T} [c] [e] {S}
{D} [e]
{T} [c] [e] {S}
{D} [e]
{T} [c] [e] {S}
ε] {{T} [c] [e] {S}
ε] { E}

Innovative Systems Design and Engineering www.iiste.org
ISSN 2222-1727 (Paper) ISSN 2222-2871 (Online)
Vol.6, No.8, 2015
11
Where
{uc} = displacements for element domain in x, y, z directions
Vc = electrical potential for element domain
[Nu] = displacement shape functions matrix
[NV] = electrical potential shape function
{u} = nodal displacements vector
{V} = nodal electrical potential vector
Then the strain vector {S} and electric field vector {E} are related to the displacements and potentials
respectively,
{S}= [Bu] {u} (25)
{E}= - [BV] {V} (26)
Where:
∂/∂x 0 0
0 ∂/∂y 0
[Bu]= 0 0 ∂/∂z
∂/∂y ∂/∂x 0
0 ∂/∂z ∂/∂y
∂/∂z 0 ∂/∂x (27)
∂/∂x
[BV]= ∂/∂y {NV}
T
∂/∂z (28)
Mechanical response of piezoelectric elements can be expressed by the equation of motion [5]:
{div[T]} + {f} = ρ{ü} (29)
Where T, f, ρ and ü are stress, body force in unit volume, density and acceleration, respectively.
Electrical response of piezoelectric elements can be described by Maxwell’s equation: {∂D/∂x} = 0 (30)
With the application of variational principles on the mechanical equilibrium equation, Equation (29) and the
electrical flux conversation equation, Equation (30), in conjunction with the approximate field of equation (23,
24, 25, 26) and the constitutive properties in Equation (22), the piezoelectric finite element formulation can be
derived in terms of nodal quantities:
Where:
[M] = mass matrix derived from density and volume
[K] = mechanical stiffness matrix derived from elastic matrix
[Kz] = piezoelectric stiffness matrix derived from piezoelectric matrix
[Kd] = dielectric stiffness matrix derived from dielectric matrix
{F} = mechanical force vector
{L} = charge vector
[M], [K], [Kz] and [K
d] matrices are expressed as:
Structural mass matrix: [M] = v∫ ρ [Nu][N
u]
T dv (32)
Structural stiffness matrix: [K] = v∫ [Bu]
T c [B
u] dv (33)
Piezoelectric coupling matrix: [kz] = v∫ [Bu
]T
e [BV] dv (34)
Dielectric conductivity matrix: [Kd] = v∫ [BV]
T ε [BV] dv (35)
Energy coefficients are calculated for each piezoelectric element as follows:
Elastic energy: UE = 1/2 {S}T [c] {S} (36)
Dielectric energy: UD = 1/2 {E}T [ε] {E} (37)
Electromechanical coupling energy: UM = - 1/2 {S}T [e] {E} (38)
Potential energy: Ep = UE + UD (39)
8. Element Type of Smart Aircraft Wing in Mechanical APDL (ANSYS)
The smart wing of the aircraft consists of spars, ribs, skin and piezoelectric therefore the wing will be divided
into elements for the isotropic, orthotropic and coupled field to perform the finite element analysis of smart
structures. The number of mesh which used for smart wing is 11149 elements and for smart beam is 1872
elements.
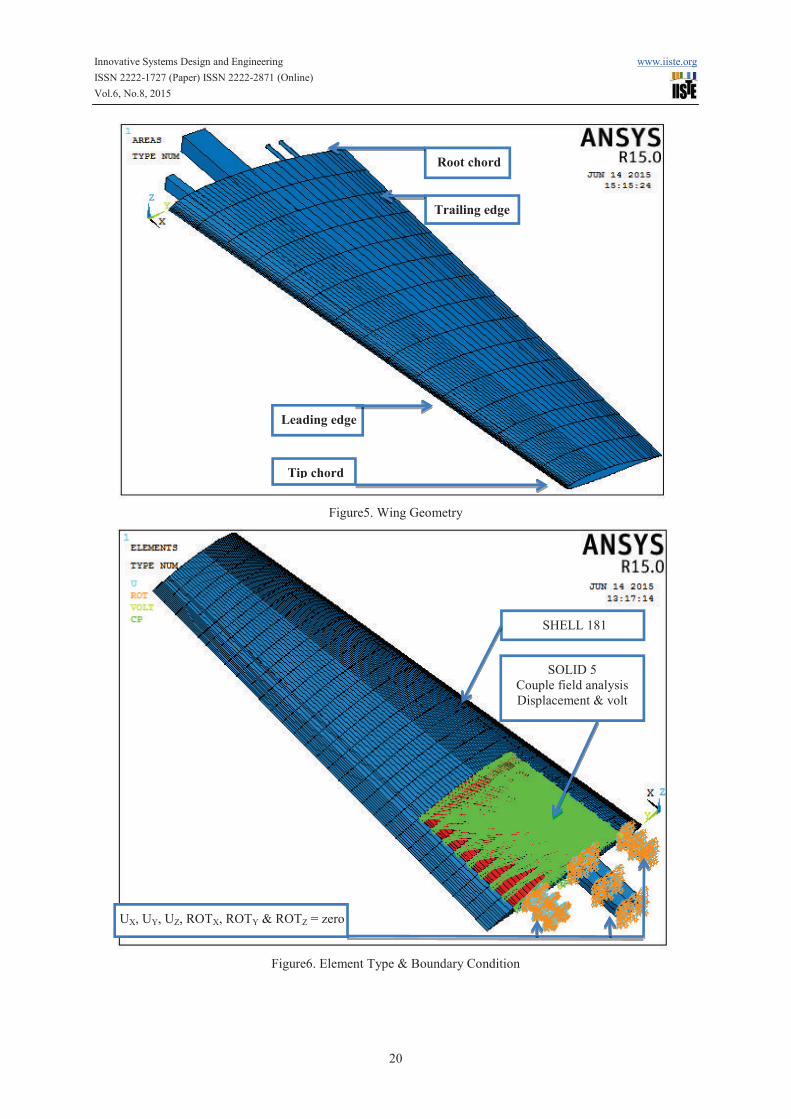
8.1 SHELL181 Element Description:
SHELL181 is appropriate for analyzing thin to thick shell structure. It has translations in the x, y and z directions
and rotations about the x, y, and z-axes therefor six degrees of freedom at each node and it is four node elements.
∂/∂x 0 0
]=
∂/∂z 0 ∂/∂x
]=
Mechanical response
∂/∂y {N∂/∂z
Mechanical response

Innovative Systems Design and Engineering www.iiste.org
ISSN 2222-1727 (Paper) ISSN 2222-2871 (Online)
Vol.6, No.8, 2015
12
Change in shell thicknesses are accounted for analyses. SHELL181 can be used for layered applications for
modeling composite shells or sandwich construction. The accuracy in modeling composite shells is governed by
the first-order shear-deformation theory (usually referred to as Mindlin- eissner shell theory). The element
formulation is based on logarithmic true stress and strain measures. [6]
8.2 SOLID5 Element Description:
SOLID5 has a 3-D magnetic, thermal, electric, piezoelectric and structural field capability with limited coupling
between the fields. The element has 8 nodes. Each node has ux, uy and uz displacements along x, y, and z axis,
respectively. With up to 6 DOF at each node. When used in structural and piezoelectric analyses, SOLID5 has
large deflection and stress stiffening capabilities. A prism shaped element is formed by defining duplicate node
numbers. The prism shaped element may be useful in modeling a system that has a geometric curvature (e.g.,
cylinder). When chosen this type of piezoelectric, Mechanical APDL ANSYS will only consider the behaviors of
SOLID5 in ux, uy, uz and volt degrees of freedom. It should be noted that ux, uy and uz indicate the
displacements in the global coordinate system x, y and z directions, while volt indicates the difference in
potential energy of the electrical particles between two locations. [6] The element type and boundary condition is
shown in the figure 6.
9. Output Feedback Control (AVC)
Output feedback is a theory for closed-loop system for smart mechanical structures being controlled by position
and or velocity feedback. The systems have the form as the following [7]
Where, the vector represents external disturbance forces (such as aerodynamic force) and the vector
represents the control force stem from the action of r force actuators and defined as the following
Here, the r ×1 vector u represents the r input, one for each control device (actuator). The matrix represents the
locations on the structure of any actuators or devices being used to supply the forces u. such as,
electromechanical or piezoelectric actuator are attached to the structure. The feedback of the velocity and
position, let y denoted s×1 vector of sensor outputs as the following
Here, and are s × n matrices of displacement and velocity influence coefficients, with structure obtained by
the sensor locations and the electronic gains associated with the transducers used to measure the various state
variables and here the s denotes the number of sensors. Equation (42) represents those coordinates which are
measured as part of the active control system and is the mathematical model of the signal processing and
transducer used to measure the structural response. In this paper taken the matrix zero due to don’t use velocity feedback. The special form of the input vector u is chosen as the following
Here the r × s matrix consists of feedback constant gains. The form of control law (equation 43) is output
feedback, due to the input is proportional to the measured output for the response . If Equation (41) is
substituted into Equation (40) to yield the closed-loop system as the following [8]:
In this case, the control vector u is a function of the response coordinates of interest, denoted by the vector y, i.e.
. Equations (42), (43) and (44) can be representation in the block diagram of Figure (7).
10. Active Vibration Control Simulation in Smart Structures
All of the analyses are performed with using mechanical APDL (ANSYS). Control action is inserted into the
finite element model of multi degrees of freedom vibration system. Controls performance is estimated in the
finite element environment describing the outputs and inputs of the system step by step. The reference of input
value is taken as zero in the feedback (closed loop) vibration control system. The instantaneous value of the
voltage (VS) (strain rate) for the sensor location at time step is subtracted from zero to obtain the error signal
value. Error signal is the difference between the zero (input reference) and the sensor signal to obtain inverted
signal for each time step to generate reverse force to the original vibration. The control gain (KC) and amplifier
gain (KV) are multiplied by the error value to calculate the voltage value (VA) and used this voltage as the input
to the actuator node at a time step. The value of the control gain (KC) is taken differently for obtain the best
vibration control. The processes are continuous with the selected time step until the response is reached for
steady-state value. The differential control action require smaller time step for higher precision. ts is the settling
time at which the steady state of response is reached. The natural frequencies of open-loop system are found for
all piezoelectric location to compare the stiffness and the settling time of smart structure and hence selected the
optimal location of piezoelectric as passive control.

Innovative Systems Design and Engineering www.iiste.org
ISSN 2222-1727 (Paper) ISSN 2222-2871 (Online)
Vol.6, No.8, 2015
13
10.1 Free Vibration due to Aerodynamic Force
The block diagram of the analysis for active vibration control in smart structures is show in Figure 8. Free
vibration is performed due to applied the aerodynamic force (lift force) on the aerodynamic center of the smart
aircraft wing at the analysis of the first time step (before beginning of closed loop system) and then give this
force zero at beginning of closed loop system to obtain free vibration due to force. KC & KV are the control and
power amplification factors, respectively. KV is taken as 100 by inspection PZT amplifier gain. The voltage
values (VS) of the sensor location are taken as the feedback loop. The proportional control (KC) is only applied.
Thus, the proportional constant for the voltage of actuator (VA) is the multiplication of KC* KV .The value of
actuator voltage (VA) is change in each time step corresponding to the voltage sensor (VS) and the multifunction
of KC & KV are constant in each time step. The calculated deflection UZ is observed to evaluate the
performance for the response of vibration control. Effective actuation and sensing of control action depend on
the locations of actuators and sensors. The actuator and sensor locations are very important to obtain maximize
actuator effective. The positions of the aircraft wing at the mechanical strain is maximum are the best location
for actuators and sensors. The objectives of the control are to place all of the actuators and sensors in multi
different areas. Modal analysis of the aircraft wing is required to design the locations of actuators and sensors.
10.2 Free Vibration due to Initial Displacement
Static analysis is performed by applying the Initial Displacement to the tip of the smart aircraft wing. All nodal
displacements are obtained for the Initial Displacement of the tip and save these displacements in matrix form.
Initial condition is describe using these nodal displacements for all nodes of the smart aircraft wing and then
applied these displacements as initial condition (IC) to obtain free vibration. Initial Displacement at the tip of
smart aircraft wing is obtaining approximately from applied the aerodynamic force in previous section. The
block diagram of this analysis is shown in Figure 9.
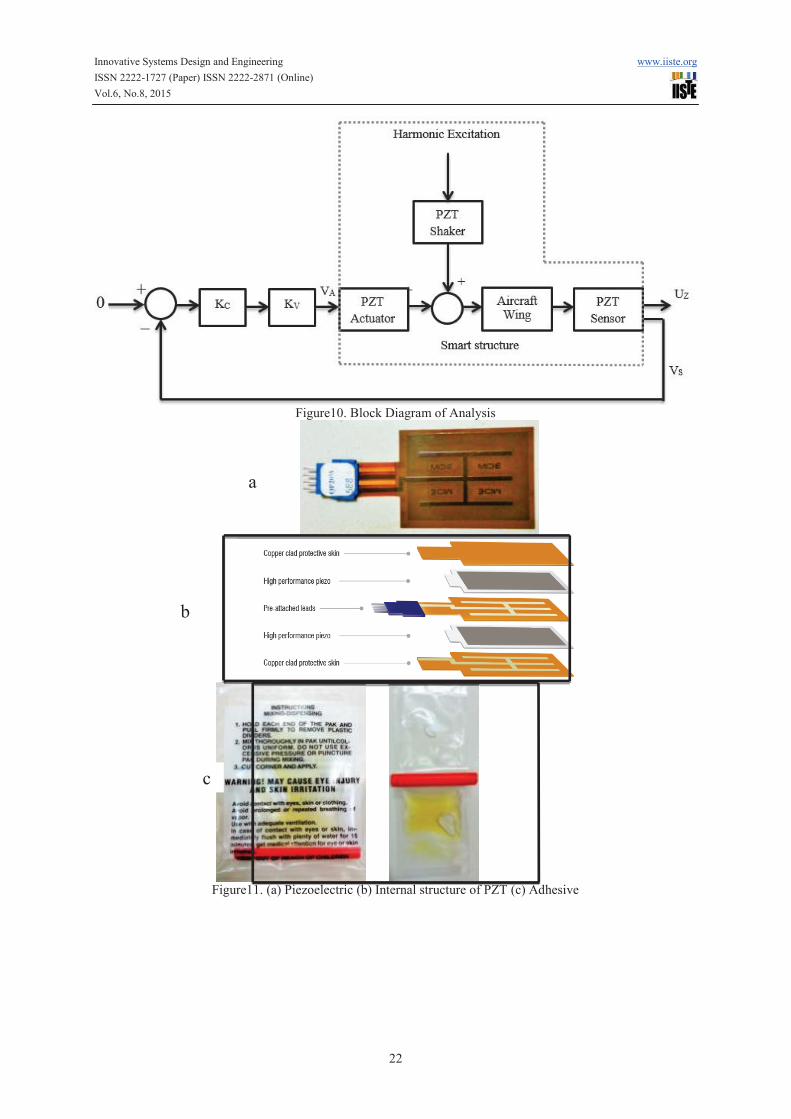
10.3 Force Vibration due to PZT Shaker (Harmonic Excitation)
First mode of the vibration is considered in the feedback (closed loop) control analysis. Block diagram of the
closed feedback (closed loop) is given in Figure 10. Force vibration is obtained from PZT shaker this shaker is
programing to provide the smart structure harmonic excitation (Sine Wave) and then control this excitation by
AVC. Control action is achieved with the script code after the finite element model of the smart aircraft wing
with PZT shaker is constructed. Harmonic excitation is created in the finite element model before the feedback is
beginning. Then, the first step is solved by applying the excitation voltage to the PZT shaker. Hence, the nodal
solutions of the finite element model are known for the next step. The excitations are applied again in the first
step of the feedback. The voltage known from the first step is read from PZT sensor location. Error signal is
obtained after the voltage value is calculated. The actuation voltage (VA) to be applied for the piezoelectric
actuator is found by multiplying error signal by the gain KC & KV. Therefore, the analysis starts on step by step
for a specific time after vibration amplitudes (response) reach steady-state.
11. Experimental Work
The experiments are conducted to verify the simulation results. Piezoelectric as actuator, sensor & shaker have
been tested for active vibration control on cantilever aluminium beam type 7075 T6 which is used in aircraft
manufacturing. First, modal analysis is done to find natural frequency. Second, free vibration of the beam under
tip initial displacement is considered. In free vibration the aluminium smart beam is embedded of two
piezoelectric (PZT) patches. One of the piezoelectric patches is used as controlling actuator while the other
piezoelectric patch is used as vibration sensor. Third, the active control of a smart beam under forced vibration is
considered. The aluminium smart beam is embedded of three piezoelectric patches. One of the piezoelectric
patches is used as controlling actuator while the second piezoelectric patch is used as vibration sensor and the
third piezoelectric patch is used as vibration generating shaker. The smart beam is harmonically excited by the
piezoelectric shaker at its fundamental frequency. AVC for free vibration and under harmonic excitation was
achieved using output feedback control. The signals for all cases are found experimentally and also by the
simulation to compare the results between them. The experimental results are obtained by using Lab VIEW
program. Control OFF and Control ON vibration signals are obtained for various gains. Dynamic behaviour at
the tip of the beam is evaluated for the uncontrolled and controlled responses. Closed loop simulations for smart
beam are performed by APDL also. The simulation and experimental results are compared. It is observed that the
simulation results obtained by the finite element procedure are in good agreement with the experimental results.
12. Hardware Devices
The hardware devices for active vibration control are illustrated as the following

Innovative Systems Design and Engineering www.iiste.org
ISSN 2222-1727 (Paper) ISSN 2222-2871 (Online)
Vol.6, No.8, 2015
14
12.1 High Voltage Amplifier of PZT (HVPZT)
This devise is consist of three high-voltage amplifiers type PI Model E-507 that offer high performance and wide
bandwidth, sensor and position servo control modules type E-509 and display modules for modular PZT
controller type E-515. The output voltage is 1100v.
12.2 Data Acquisition (DAQ - PCI Express 6259)
National Instruments M Series high-speed multifunction data acquisition (DAQ) devices are optimized for
superior accuracy at fast sampling rates. Devices feature are fast settling times at high scanning rates, ensuring
16-bit accuracy even when measuring all channels at maximum speeds, Noise-reducing, compatible for control
applications, 16 analog inputs, 24 digital I/O lines, analog and digital triggering, two counter/timers, contain six
DMA channels to maximize data throughput without using PC processing time, with four waveform analog
outputs and two 80 MHz counter/timers. M Series devices can execute multiple control loops simultaneously
with a single device. For higher-count control loops, With the NI Soft Motion Development Module for
LABVIEW and create a complete motion controller with M Series devices. The sampling rate of input is 1.25
MS/s. The sampling rate of output is 2.8 MS/s.
12.3 Data Acquisition (DAQPad-6016)
The National Instruments DAQPad-6016 multifunction data acquisition (DAQ) devices provide plug-and-play
connectivity via USB for acquiring, generating, and logging data in a variety of portable and desktop
applications. DAQ Pad devices with screw terminals or BNC connectors provide direct connectivity so easily
connect sensors and signals without extra cost. Devices feature are 16-bit resolution, 16analog inputs at up to
200 KS/s, 2analog outputs for accurate output signals and multiple signal connectivity options.
12.4 Function Generation (WAVETEK Model 191)
WAVETEK model 191, a 20 MHz pulse/Function generator, is a precision source of sine, triangle, square and
pulse waveforms plus dc voltage. All can be externally modulated. Output can be continuous or can be triggered
or gated by external signal or front panel switch. Amplitude of the waveforms is variable from 30 V down to 1.5
mV. DC reference of the waveform can be offset positively or negatively
12.5 Sensor, Actuator and Shaker
QUICKPACK MIDE QP20W double layer piezoelectric type is use as structural sensors transducers, actuator
and shaker attaching them either directly to a data acquisition device. Piezoelectric shall be attached to the main
structure by special piezoelectric adhesive. This type of piezoelectric can be used as sensor and actuator at same
time. Piezoelectric and adhesive are shown in figure 11.
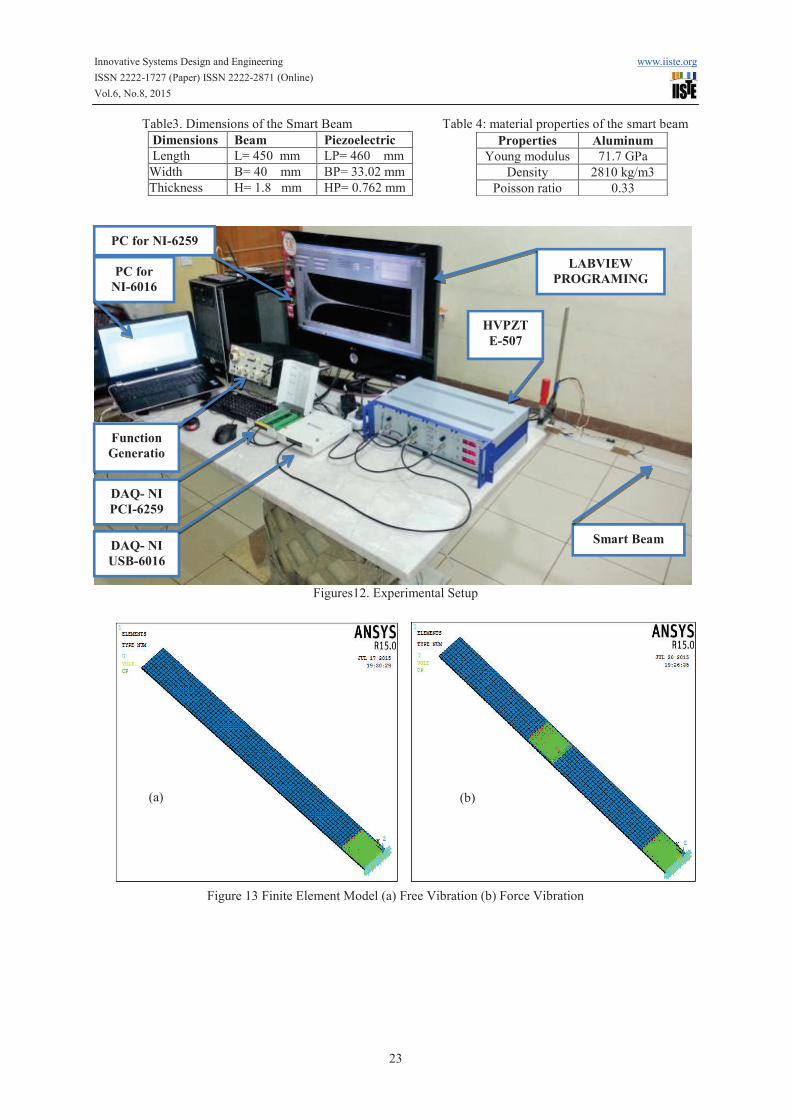
13. Experimental System
A smart beam is produced as a test specimen to be used in the experiments for the comparison with simulation
results. The smart beam consists of an aluminium beam, piezoelectric patches as an actuator and a sensor. The
dimensions and material properties of the smart beam are given in table 3and table 4. The experimental setup is
shown in Figures 12. In the experimental setup, multifunction analog input and analog output (PCI-6259) data
acquisition (DAQ) cards of NI are utilized for data acquisition and control action for the sensor and actuator as
well as used multifunction analog input and analog output (USB-6016) data acquisition (DAQ) cards is utilized
for data acquisition for piezoelectric shaker or used function generation (WAVETEK) to generate harmonic
vibration. The sensor voltage (strain rite) data is acquired with the analog input card through the input module.
Later, the output signal is simultaneously sent through by the analog output card after a control signal is
calculated. Then the control signal is sent to E-507 high voltage amplifier (HVPA) in order to actuate the
piezoelectric patch. The input signal to the HVPA is limited by ± 2V due to the gain of E-507 HVPA is 100. The
tip displacements of the beam are measured by calibration between the sensor voltages and tip displacements UZ
and hence produced curve fitting equation then program this curve fitting equation in LABVIEW program so
that displacement data is available in high accuracy. Personal computers having DAQ cards can work as a
controller such a real time control application. Synchronization of multiple DAQ cards is very important for
acquiring and sending the data. For the synchronization of DAQ cards used in the closed loop control experiment,
time step is 0.001s. The block diagrams of the experimental analysis for free & force vibration are shown in
figure 8&9. The codes developed by LABWIEW in this paper are given in Appendix (A1).
14. Closed Loop Simulation of Smart Beam
The finite element model is created using SOLID45 and SOLID5 for the aluminium beam and the PZT patch
after material properties are defined to script file in Mechanical APDL ANSYS. Cantilever boundary conditions
are applied to the finite element model. The finite element model of the smart beam for free and force vibration

Innovative Systems Design and Engineering www.iiste.org
ISSN 2222-1727 (Paper) ISSN 2222-2871 (Online)
Vol.6, No.8, 2015
15
is shown in Figure 13 (a) & (b). The block diagrams of the analysis for free & force vibration are shown in
Figure 8 & 9. The active control of a smart beam under free & force forced vibration is analysed. The smart
beam is harmonically excited by the piezoelectric shaker at its fundamental frequency. The natural frequencies,
uncontrolled and controlled time responses of a cantilever smart beam can be obtain with the simulations. The
piezoelectric actuator is placed near the root of the beam to perform effective control. The piezoelectric shaker
placed in the middle of the beam to generate evenly harmonic excitation. The different in the result between
finite elements and experimental of the time response and frequency domain is related to the FE results are
expected to be high since perfect boundary conditions and electromechanical coupling conditions are assumed.
However, in the frequency domain, the experimental and simulation results for the first mode are very close to
each other as well as in time domain experimental and simulation results are very close to each other.
15. Result and Discussions for Smart Aircraft Wing
The results of free vibration, force vibration and active control vibration are investigated for smart aircraft wing
and smart beam. First, the natural frequencies and mode shapes are found with and without piezoelectric patch as
well as the effects of changing the position of piezoelectric are presented. Second, the free vibration
(displacement response in time domain) for all PZT position is obtained as passive control to select the optimal
location for PZT. Third, active control vibration is applied for free and force vibration by used output feedback
control to remove the undesired vibration.
15.1 Natural Frequency & Mode Shape
The location of PZT patch on wing is change at three different positions as shown in figure 14 to 16. Natural
frequencies and Mode shapes of six natural frequencies for the wing without and with PZT patch at three
locations are shown in table 5 and figure 17 to 20. The effect of add piezoelectric as sensor and actuator to the
wing is increase the natural frequencies due to the stiffness increase (natural frequency changes directly with
stiffness and indirectly with mass) and hence settling time is reduced. This method of changing stiffness of
structure is called passive control and will see this effect in the section of free vibration. The effect of changing
the location of PZT as sensor and actuator from location 1 to location 2 is decrease the natural frequencies due to
the stiffness decrease and hence settling time is increase. The effect of changing the location of piezoelectric as
sensor and actuator from location 1 to location 3 is decrease the natural frequencies due to the stiffness decrease
and hence settling time is increase. Observe that the stiffness is decrease when the PZT location away from the
place of installation.
15.1 Free Vibration due to Aerodynamic Force
The block diagram of the analysis for active vibration control in smart structures is show in figure 8. Maximum
aerodynamic force (lift force) is equal to 8176 N at maximum speed of aircraft (316 km/h) for this model [1].
Free vibration response of three cases of aircraft wing is simulated for different control gain (Control OFF &
Control ON), time range and actuation voltage. Figures 21 show the tip displacement response of aircraft wing
without piezoelectric. The tip displacement responses for sensor and actuator at location 1 are shown in Figures
22 to 26, for location 2 are shown in Figures 27 to 29 and for location 3 are shown in Figures 30 to 32 for the
wing with and without active vibration control (Control OFF & Control ON). Observe that from the result of
location 1 the best control gain for gain 20 and maximum actuation voltage 500 due to the response reach steady
state at 3 sec (smaller settling time and amplitude). While the response reach steady state when control OFF at
15 s. Figure 33 shows the actuation voltage which applied to piezoelectric when controller gain is 20. Figure 34
shows the different between the response for control OFF and control ON of gain 20. Note that from the result of
location 2 when comparison with results of location 1 the stiffness and natural frequency are decrease and hence
settling time take more time for the response to reach steady state and it is 14 s while for loaction1 settling time
is 10s when control OFF as well as the amplitude of location 2 is bigger of amplitude of location 1 as shown in
figure 35. However, the best control gain is also for gain 20 and maximum actuation voltage 500 for location 2
due to the smaller settling time and amplitude of tip displacement. Observe that from the result of location 3
when comparison with results of location 1 and 2 the stiffness and natural frequency are decrease and hence
settling time take more time for the response to reach steady state and it is 20 s while for loaction1and 2 settling
time is 10s and 14s respectively when control OFF as well as the amplitude of location 3 is bigger of amplitude
of location 1 as shown in figure 36 and it is the best control gain is also for gain 20 and maximum actuation
voltage 500 for location 3. Finally from the results of location 1, 2 and 3 the optimal location for piezoelectric as
sensor and actuator is the location 1 due to high stiffness and natural frequency and smaller settling time for
passive and active control also in this location maximum strain and stress is produced. Table 6 shows the settling
time for all locations with different controller gain and actuation voltage.
Innovative Systems Design and Engineering www.iiste.org
ISSN 2222-1727 (Paper) ISSN 2222-2871 (Online)
Vol.6, No.8, 2015
16
15.2 Free Vibration due to Initial Displacement
The block diagram of the analysis for active vibration control in smart structures is shown in figure 9. Initial
Displacement 4.4cm is applied to the tip of the wing to obtain the free vibration. The general behaviour of results
for this section is similarity to previous section. The tip displacement responses for sensor and actuator at
location 1 are shown in Figures 37 to 39, for location 2 are shown in Figures 40 to 42and for location 3 are
shown in Figures 43 to 45 for the wing with and without active vibration control (Control OFF & Control ON).
Figure 46 shows the actuation voltage which applied to piezoelectric when controller gain is 20 for location 1.
Figure 47 shows the different between the response for control OFF and control ON of gain 20 for location 1.
Note that from the result of location 2 & 3 when comparison with results of location 1 the stiffness and natural
frequency are decrease and hence settling time take more time for the response to reach steady state (ts=15 for
location 2 & ts =20 for location 3) while for loaction1 settling time is 10s when control OFF as well as the
amplitude of location 2 & 3 is bigger of amplitude of location 1 as shown in figure 48 therefor the best control
gain in location 1 is also for gain 20 and maximum actuation voltage 500 due to the smaller settling time and
amplitude of tip displacement also in this location maximum strain and stress is produced. Based on the above
results the optimal location for piezoelectric as sensor and actuator is the location 1(near from fixed end) due to
high stiffness and natural frequency and smaller settling time for passive and active control. Table 7 shows the
settling time for all locations with different controller gain and actuation voltage.
15.3 Force Vibration due to PZT Shaker (Harmonic Excitation)
The block diagram of the analysis for active vibration control in smart structures is shown in figure 10.
Harmonic excitation is obtain by piezoelectric shaker and it is produced about ± 4 cm amplitude at the tip of
aircraft wing in the form of (X=X0 sin wt) and this amplitude is depend on the voltage which applied to
piezoelectric shaker. First mode of the vibration is considered in the feedback (closed loop) control analysis.
Force vibration response of smart aircraft wing is simulated for different control gain and different actuation
voltage. The piezoelectric is placed at location 1due to select this location as optimal position for effective
piezoelectric as sensor and actuator. The tip displacement response is shown in Figures 49to 53 for aircraft wing
with and without active vibration control. Note that from the results the best control gain is 60 and maximum
actuation voltage is 500 due to the amplitude of tip displacement for aircraft wing when control OFF is about ± 4
cm and amplitude when control ON for gain 60 is ± 0.5 mm that mean all undesired vibration are removed and
aircraft wing become safe from unwanted vibration which cause crack, fatigue, buckling …etc. Table 8 shows the amplitude of tip displacement with different controller gain and actuation voltage.
16. Results for Smart Cantilever Beam
The following results for comparison between Mechanical APDL ANSYS and experimental work by using
LABVIEW program.
16.1 Natural Frequency & Mode Shape
The location of PZT patch on beam is change at three different positions as shown in figure 54 to 56. Cantilever
beam is embedded with three piezoelectric as sensor, actuator and shaker. The location of PZT shaker at the
middle of beam and hence natural frequency and stiffness are reduced and settling time is increase in case the
sensor and actuator at location 1.The locations of the sensor, actuator and shaker on cantilever beam are shown
in figure 57.Natural frequencies and Mode shapes of three natural frequencies are shown in table 9 and figure 58
to 62 for the beam without PZT, with PZT patch at three locations and with PZT shaker. The effect of add
piezoelectric as sensor and actuator to the cantilever beam is increase the natural frequencies due to the stiffness
increase and hence settling time is reduced. Frequency response is shown in figure 63 (a) & (b).
16.2 Free Vibration
The block diagram of the analysis for active vibration control in smart structures is shown in figure 9. Initial
Displacement 1cm is applied to the tip of the cantilever beam to obtain the free vibration. The general behaviour
of results and Discussions for smart aircraft wing is similarity to smart beam. Free vibration response of three
cases of smart beam is simulated for different control gain, time range and actuation voltage. The piezoelectric
sensor and actuator are placed at location 1, 2 & 3. The tip displacement response is shown in Figures (64 a & b)
to (65 a & b) for location 1 and for location 2 is shown in Figures (66) to (67) and for location 3 is shown in
Figures (68) to (69). Note that from the result of location 2 & 3 when comparison with results of location 1 the
stiffness and natural frequency are decrease and hence settling time take more time for the response to reach
steady state (ts=20 for location 2 & ts =25 for location 3) while for loaction1 settling time is 15s when control
OFF as well as the amplitude of location 2 & 3 is bigger of amplitude of location 1 therefor the best control gain
in location 1 is gain 12 and maximum actuation voltage 180 due to the smaller settling time and amplitude of tip
displacement also in this location maximum strain and stress is produced. Table 10 shows the settling time for all
Innovative Systems Design and Engineering www.iiste.org
ISSN 2222-1727 (Paper) ISSN 2222-2871 (Online)
Vol.6, No.8, 2015
17
locations with different controller gain. Figure 70 shows the actuation voltage which applied to piezoelectric
when controller gain is 12.
16.3 Force Vibration due to PZT Shaker (Harmonic Excitation)
The block diagram of the analysis for active vibration control in smart structures is shown in figure 9. Harmonic
excitation is obtain by piezoelectric shaker and it is produced about ± 4.2 mm amplitude at the tip of smart beam
in the form of (X=X0 sin wt) and this amplitude is depend on the voltage (200 Volt.) which applied to
piezoelectric shaker. First mode of the vibration is considered in the feedback (closed loop) control analysis.
Force vibration response of smart beam is simulated for different control gain and different actuation voltage.
The piezoelectric is placed at location 1due to select this location as optimal position for effective piezoelectric
as sensor and actuator. The tip displacement response is shown in Figures (71) to (73) for smart beam with and
without active vibration control. Observe that from the results the best control gain is 12 due to the amplitude of
tip displacement for smart beam when control OFF is about ± 4.2 mm and amplitude when control ON for gain
12 is ± 0.67 mm . Figure 74 shows the different between the response for control OFF and control ON (K=0 &
K=12).Table 11 shows the amplitude of tip displacement with different controller gain for experimental and
ANSYS.
17. Conclusions
The main conclusions obtained from the present work are listed below:
1. The location of the piezoelectric as sensor and actuator pair affects the displacement response of the
mechanical system. Piezoelectric in location 1 have higher stiffness and natural frequency and smaller settling
time as compared with locations 2 & 3 as well as in location 1 maximum strain and stress is produced therefore
the optimal location of piezoelectric is location 1.
2. The simulations for the active vibration control of the aircraft wing and beam for free vibration show that the
settling time for the vibration reduced effectively and vibration suppression is obtained for various gains, the
maximum reduced settling time was from 15 seconds to 3 second.
3. The simulations for the AVC of the aircraft wing and beam for force vibration (Harmonic wave) show that the
amplitude for the vibration reduced effectively and vibration suppression is obtained for various gain, the
maximum reduced amplitude was from ± 0.04 m to ± 0.0005 m.
4. Output feedback control (AVC) is very effected for vibration reduction when compare it with another type of
control such as passive control.
5. The mathematical models are derived by using the finite element method due to complex systems. The
computer program APDL ANSYS is used to obtain the mathematical models. Responses of closed loop system
are obtained from the block diagrams built in the program by incorporating the control law directly into the finite
element programs.
6. Collected control is very important for the stability of mechanical system therefore all the response for aircraft
wing and smart beam is stable.
7. The results of the experimental work is matching with result obtain by APDL ANSYS, although there is a little
bit amplitude difference between the experimental and simulation amplitudes but the results are good matching.
8. It is observed that the vibration suppression is faster for the increasing actuator size for the same value of the
maximum actuator voltage.
References
[1] Prof. Ugo Galvanetto, Prof. Mirco Zaccariotto and Matteo Scalchi, "Aerodynamic and structural design of
some components of an ultra-light aircraft”, Anno Academic 2013/2014. [2] Weaver W. Jr. and Johnston P.R., "Structural Dynamic by Finite Elements", Prentic-Hall, Englewood Cliffs,
N.J., 1987.
[3] Preumont, A. Vibration control of active structures an introduction (2nd ed.). Netherlands: Kluwer Academic
Publishers. 2002
[4]Allik, H., & Hughes, TJR. Finite element method for piezoelectric vibration. International Journal for
Numerical Method in Engineering, 2, 151-7.1970
[5] Sekouri, E. M. Modelling and shape estimation of smart structures for active control, Ph.D Thesis. Quebec
University, CANADA.2004.
[6] ANSYS Structural Analysis Guide, ANSYS Release 15, ANSYS Inc., South Point, Canonsburg, 2004.
[7] Lin, J. Active control of space structures. C.S. Draper Lab final report R-1454. 1981
[8]Daniel J. Inman, “Vibration with Control”, John Wiley & Sons Ltd, England, 2006.
Innovative Systems Design and Engineering www.iiste.org
ISSN 2222-1727 (Paper) ISSN 2222-2871 (Online)
Vol.6, No.8, 2015
18
Figure1. Wing Structure
Figure2. Angles of layer Figure3. Angles of layer
Figure4. Reduction of Thickness on the Main Spar Beams
Back spar
Flap spar
Rib
Front
spar
Main
spar

Innovative Systems Design and Engineering www.iiste.org
ISSN 2222-1727 (Paper) ISSN 2222-2871 (Online)
Vol.6, No.8, 2015
19
Table1. Mechanical Properties
Item & Material Mechanical Properties
Wing Skin
Glass fiber
Density [kg/m3] 1630
Modulus of Elasticity EX [Pa] 15.8E+9
Modulus of Elasticity EY [Pa] 4E+9
Poisson’s ratio υxy 0.24
Shear Modulus Gxy [Pa] 4.14E+9
Main & Front Spars
Silver Fir Wood
Density [kg/m3] 400
Modulus of Elasticity EX [Pa] 10E+9
Modulus of Elasticity EY [Pa] 0.35E+9
Poisson’s ratio υxy 0.33
Shear Modulus Gxy [Pa] 0.82E+9
Main & Front Spars
Birch Plywood
Density [kg/m3] 720
Modulus of Elasticity EX [Pa] 13E+9
Modulus of Elasticity EY [Pa] 0.75E+9
Poisson’s ratio υxy 0.451
Shear Modulus Gxy [Pa] 1.02E+9
Back, Flap & Front Tip Spars
Carbon-Carbon Pipe
Density [kg/m3] 1600
Modulus of Elasticity E [Pa] 80E+9
Poisson’s ratio υxy 0.33
Back Tip Spar
Aluminum
Density [kg/m3] 2780
Modulus of Elasticity E [Pa] 70E+9
Poisson’s ratio υxy 0.33
Ribs
Flex Foam M-130
Density [kg/m3] 130
Modulus of Elasticity E [Pa] 0.108E+9
Poisson’s ratio υxy 0.49
Table2. Data of Selected Wing
Total Wing span (m) 5
Wing area (m2) 3.208
Aspect ratio 7.79
Taper ratio 0.54166625
Mean aerodynamic chord (m) 0.6643
Root chord (m) 0.8
Tip chord (m) 0.433333
Position of aerodynamic center X= 0.8148 & Y=0.2566
Sweep angle along leading edge 6.34°
Wing shape Trapezoidal in X & Y
Innovative Systems Design and Engineering www.iiste.org
ISSN 2222-1727 (Paper) ISSN 2222-2871 (Online)
Vol.6, No.8, 2015
20
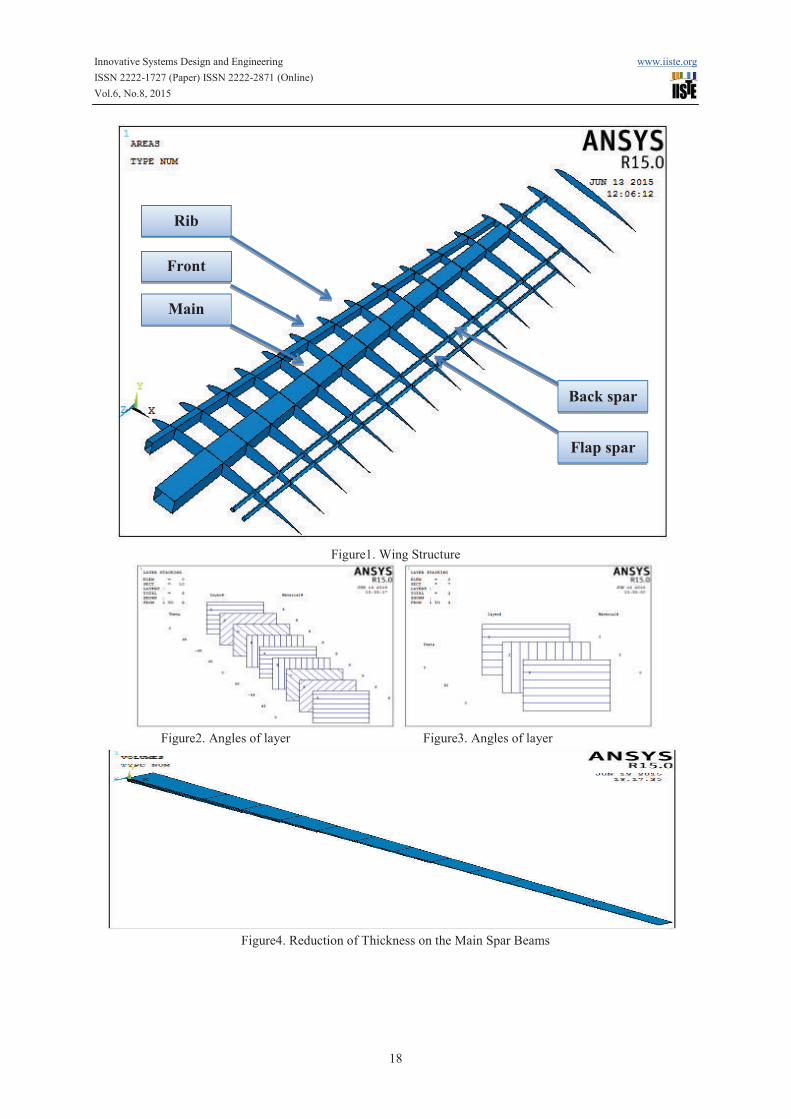
Figure5. Wing Geometry
Figure6. Element Type & Boundary Condition
Leading edge
Tip chord
Root chord
Trailing edge
SHELL 181
SOLID 5
Couple field analysis
Displacement & volt
UX, UY, UZ, ROTX, ROTY & ROTZ = zero

Innovative Systems Design and Engineering www.iiste.org
ISSN 2222-1727 (Paper) ISSN 2222-2871 (Online)
Vol.6, No.8, 2015
21
Figure7. Block Diagram of Output Feedback System
Figure8. Block Diagram of Analysis
Figure9. Block Diagram of Analysis
Innovative Systems Design and Engineering www.iiste.org
ISSN 2222-1727 (Paper) ISSN 2222-2871 (Online)
Vol.6, No.8, 2015
22
Figure10. Block Diagram of Analysis
Figure11. (a) Piezoelectric (b) Internal structure of PZT (c) Adhesive
a
b
c
Figure11. (a) Piezoelectric (b) Internal structure of PZT (c) Adhesive
Innovative Systems Design and Engineering www.iiste.org
ISSN 2222-1727 (Paper) ISSN 2222-2871 (Online)
Vol.6, No.8, 2015
23
Table3. Dimensions of the Smart Beam Table 4: material properties of the smart beam
Dimensions Beam Piezoelectric
Length L= 450 mm LP= 460 mm
Width B= 40 mm BP= 33.02 mm
Thickness H= 1.8 mm HP= 0.762 mm
Figures12. Experimental Setup
Figure 13 Finite Element Model (a) Free Vibration (b) Force Vibration
Properties Aluminum
Young modulus 71.7 GPa
Density 2810 kg/m3
Poisson ratio 0.33
PC for NI-6259
PC for
NI-6016
Function
Generatio
n
DAQ- NI
PCI-6259
DAQ- NI
USB-6016
HVPZT
E-507
Smart Beam
LABVIEW
PROGRAMING
(a) (b)

Innovative Systems Design and Engineering www.iiste.org
ISSN 2222-1727 (Paper) ISSN 2222-2871 (Online)
Vol.6, No.8, 2015
24
Figure14. (a) Actuator location1 Figure14. (b) Sensor location1
Figure15. (a) Actuator location 2 Figure15. (b) Sensor location 2
Figure16. (a) Actuator location 3 Figure16. (b) Sensor location 3
Sensor Actuator
Sensor
Sensor
Actuator
Actuator

Innovative Systems Design and Engineering www.iiste.org
ISSN 2222-1727 (Paper) ISSN 2222-2871 (Online)
Vol.6, No.8, 2015
25
Table5. Frequency of Aircraft Wing
Frequency
HZ
N.F without PZT N.F with PZT at 1 N.F with PZT at 2 N.F with PZT at 3
f 1 6.2396 7.1695 6.4744 5.9129
f 2 28.701 29.683 28.919 29.967
f 3 36.067 37.182 35.785 34.084
f 4 51.154 53.149 51.278 49.463
f 5 63.859 63.453 64.578 66.307
f 6 98.185 96.062 98.367 99.465
Figure17. (a) First mode shape Figure17. (b) Second mode shape
Figure17. (c) Third mode shape Figure17. (d) Forth mode shape
Figure17. (e) Fifth mode shape Figure17. (f) Sixth mode shape

Innovative Systems Design and Engineering www.iiste.org
ISSN 2222-1727 (Paper) ISSN 2222-2871 (Online)
Vol.6, No.8, 2015
26
Figure18. (a) First mode shape at PZT1 Figure18. (b) Second mode shape at PZT1
Figure18. (c) Third mode shape at PZT1 Figure18. (d) Forth mode shape at PZT1
Figure18. (e) Fifth mode shape at PZT1 Figure18. (f) Sixth mode shape at PZT1
Figure19. (a) First mode shape at PZT2 Figure19. (b) Second mode shape at PZT2

Innovative Systems Design and Engineering www.iiste.org
ISSN 2222-1727 (Paper) ISSN 2222-2871 (Online)
Vol.6, No.8, 2015
27
Figure19. (c) Third mode shape at PZT2 Figure19. (d) Forth mode shape at PZT2
Figure19. (e) Fifth mode shape at PZT2 Figure19. (f) Sixth mode shape at PZT2
Figure20. (a) First mode shape at PZT3 Figure20. (b) Second mode shape at PZT3
Figure20. (c) Third mode shape at PZT3 Figure20. (d) Forth mode shape at PZT3
Figure20. (e) Fifth mode shape at PZT3 Figure20. (f) Sixth mode shape at PZT3

Innovative Systems Design and Engineering www.iiste.org
ISSN 2222-1727 (Paper) ISSN 2222-2871 (Online)
Vol.6, No.8, 2015
28
Figure21. Tip Displacements Response
Figure22. (a) Tip displacement Response (K=0) Figure22. (b) Displacement at time step 10s
Figure23. (a) Tip displacement Response (K=10, Figure23. (b) Displacement at time step 5s
V max. =500)

Innovative Systems Design and Engineering www.iiste.org
ISSN 2222-1727 (Paper) ISSN 2222-2871 (Online)
Vol.6, No.8, 2015
29
Figure24. (a) Tip displacement Response (K=20, Figure24. (b) Displacement at time step 10s
V max. =270)
Figure25. (a) Tip displacement Response (K=20, Figure25. (b) Displacement at time step 10s
V max. =500)
Figure26. (a) Tip displacement Response (K=40, Figure26. (b) Displacement at time step 5s
V max. =500)

Innovative Systems Design and Engineering www.iiste.org
ISSN 2222-1727 (Paper) ISSN 2222-2871 (Online)
Vol.6, No.8, 2015
30
Figure27. Tip displacement Response (K=0) Figure28. Tip displacement Response (K=20,
V max. =270)
Figure29. Tip displacement Response (K=20, Figure30. Tip displacement Response (K=0)
V max. =500)
Figure31. Tip displacement Response (K=20, Figure32. Tip displacement Response (K=20,
V max. =270) V max. =500)

Innovative Systems Design and Engineering www.iiste.org
ISSN 2222-1727 (Paper) ISSN 2222-2871 (Online)
Vol.6, No.8, 2015
31
Figure33. Actuation Voltage for K=20 Figure34. Different between response K=20
Figure35.Different between the Responses Figure36.Different between the Responses
Table6. Settling Time
Control Gain (K) Max. Actuation Voltage Settling Time(s)
Location 1 Location 2 Location 3
0 0 10 14 20
20 270 4 7 13
20 500 3 5 10
Figure37. Tip displacement Response (K=0) Figure38. Tip displacement Response (K=20,
V max. =270)

Innovative Systems Design and Engineering www.iiste.org
ISSN 2222-1727 (Paper) ISSN 2222-2871 (Online)
Vol.6, No.8, 2015
32
Figure39. Tip displacement Response (K=20, Figure 40. Tip displacement Response (K=0)
V max. =500)
Figure41. Tip displacement Response (K=20, Figure42. Tip displacement Response (K=20,
V max. =270) V max. =500)
Figure 43 Tip displacement Response (K=0) Figure 44 Tip displacement Response (K=20,
V max. =270)
Figure 45 Tip displacement Response (K=20, Figure46. Actuation Voltage for K=20
V max. =500)

Innovative Systems Design and Engineering www.iiste.org
ISSN 2222-1727 (Paper) ISSN 2222-2871 (Online)
Vol.6, No.8, 2015
33
Figure47. Different between response K=20 Figure48. Different between the responses
Table7. Settling Time
Control Gain (K) Max. Actuation Voltage Settling Time(s)
Location 1 Location 2 Location 3
0 0 10 15 20
20 270 4 5.5 11
20 500 3 4.8 10.2
Figure49. Tip displacement Response (K=0) Figure50. Tip displacement Response (K=20,
V max. =270)
Figure51. Different between responses for Figure52. Different between responses for
K=0 and K=20 (V Max. =270) K=0 and K=20 (V Max. =500)

Innovative Systems Design and Engineering www.iiste.org
ISSN 2222-1727 (Paper) ISSN 2222-2871 (Online)
Vol.6, No.8, 2015
34
Figure53. Different between response for K=0 and K=60 (V Max. =500)
Table8. Amplitude of Tip Displacement
Control Gain (K) Max. Actuation Voltage Amplitude (M)
0 0 ± 0.04
20 270 ± 0.011
20 500 ± 0.0031
60 500 ± 0.0005
Figure54. PZT locations 1 Figure55. PZT locations 2
Figure56. PZT locations 3 Figure57. PZT Shaker location

Innovative Systems Design and Engineering www.iiste.org
ISSN 2222-1727 (Paper) ISSN 2222-2871 (Online)
Vol.6, No.8, 2015
35
Table9. Natural frequencies
Frequency
HZ
Without
PZT
Experimental ANSYS With PZT Shaker
Location 1 Location 1 Location 2 Location 3 Experimental ANSYS
f 1 7.3170 8.2 8.5938 8.2249 7.8615 7.59 8.1046
f 2 45.853 51 52.676 45.784 43.301 51 50.435
f 3 128.55 142 144.09 121.41 121.96 138 138.30
Figure58. (a) First mode shape Figure58. (b) Second mode shape
Figure58. (c) Third mode shape Figure 59. (a) First mode shape at PZT1
Figure59. (b) Second mode shape at PZT1 Figure59. (c) Third mode shape at PZT1

Innovative Systems Design and Engineering www.iiste.org
ISSN 2222-1727 (Paper) ISSN 2222-2871 (Online)
Vol.6, No.8, 2015
36
Figure60.(a) First mode shape at PZT2 Figure60. (b) Second mode shape at PZT2
Figure60. (c) Third mode shape at PZT2 Figure61. (a) First mode shape at PZT3
Figure61. (b) Second mode shape at PZT3 Figure61. (c) Third mode shape at PZT3
Figure62. (a) First mode shape with Shaker Figure62. (b) Second mode shape with Shaker
Figure62. (c) Third mode shape with Shaker

Innovative Systems Design and Engineering www.iiste.org
ISSN 2222-1727 (Paper) ISSN 2222-2871 (Online)
Vol.6, No.8, 2015
37
Figure63. (a) Experimental Frequency Response Figure 63. (b) ANSYS Frequency Response
with Shaker with Shaker
Figure64. (a) Experimental Tip displacement Figure64. (b) ANSYS Tip displacement
Response (K=0) Response (K=0)
Figure65. (a) Experimental Tip displacement Figure65. (b) ANSYS Tip displacement
Response (K=12) Response (K=12)

Innovative Systems Design and Engineering www.iiste.org
ISSN 2222-1727 (Paper) ISSN 2222-2871 (Online)
Vol.6, No.8, 2015
38
Figure66. Tip displacement Response (K=0) Figure67. Tip displacement Response (K=10)
Figure68. Tip displacement Response (K=0) Figure69. Tip displacement Response (K=10)
Table10. Settling Time
Control
Gain (k)
Experimental ANSYS
Location 1 Location 1 Location 2 Location 3
0 15s 15s 20s 25s
12 2.5s 1s Over Damping
10 2.8s 4s
Figure70. Actuation Voltage for controller gain K= 12

Innovative Systems Design and Engineering www.iiste.org
ISSN 2222-1727 (Paper) ISSN 2222-2871 (Online)
Vol.6, No.8, 2015
39
Figure71. Experimental & ANSYS Figure72. Experimental & ANSYS
Tip Displacement Response (K=0) Tip Displacement Response (K=10)
Figure73.Experimental & ANSYS Figure74. Different between Responses
Tip Displacement Response (K=12) for K=0 and K=12
Table11. Amplitude of Tip Displacement
Control Gain (K) Amplitude (M) Amplitude (M)
Experimental ANSYS
0 ± 0.0046 ± 0.0042
10 ± 0.00092 ± 0.00083
12 ± 0.00074 ± 0.00067
Innovative Systems Design and Engineering www.iiste.org
ISSN 2222-1727 (Paper) ISSN 2222-2871 (Online)
Vol.6, No.8, 2015
40
Append
ix (A1)
ACTIVE
VIBRATIO
N
CONTROL
OUTPUT
FEEDBAC
K
SYSTEM

Innovative Systems Design and Engineering www.iiste.org
ISSN 2222-1727 (Paper) ISSN 2222-2871 (Online)
Vol.6, No.8, 2015
41
Modal
Analysis
Frequency
Response

Innovative Systems Design and Engineering www.iiste.org
ISSN 2222-1727 (Paper) ISSN 2222-2871 (Online)
Vol.6, No.8, 2015
42
Harmonic
Excitation
Sine Wave

The IISTE is a pioneer in the Open-Access hosting service and academic event management.
The aim of the firm is Accelerating Global Knowledge Sharing.
More information about the firm can be found on the homepage:
http://www.iiste.org
CALL FOR JOURNAL PAPERS
There are more than 30 peer-reviewed academic journals hosted under the hosting platform.
Prospective authors of journals can find the submission instruction on the following
page: http://www.iiste.org/journals/ All the journals articles are available online to the
readers all over the world without financial, legal, or technical barriers other than those
inseparable from gaining access to the internet itself. Paper version of the journals is also
available upon request of readers and authors.
MORE RESOURCES
Book publication information: http://www.iiste.org/book/
Academic conference: http://www.iiste.org/conference/upcoming-conferences-call-for-paper/
IISTE Knowledge Sharing Partners
EBSCO, Index Copernicus, Ulrich's Periodicals Directory, JournalTOCS, PKP Open
Archives Harvester, Bielefeld Academic Search Engine, Elektronische Zeitschriftenbibliothek
EZB, Open J-Gate, OCLC WorldCat, Universe Digtial Library , NewJour, Google Scholar