Embed Size (px)
Citation preview

Modern Applied Science June, 2009
59
Vibration-Based Fault Diagnosis of Hydraulic
Pump of Tractor Steering System by Using Energy Technique
Kaveh Mollazade (Corresponding author) Department of Agricultural Machinery Engineering, Faculty of Biosystems Engineering
University of Tehran, P.O. Box 4111, Karaj 31587-77871, Iran Tel: 98-918-972-0639 E-mail: [email protected], [email protected]
Hojat Ahmadi
Department of Agricultural Machinery Engineering, Faculty of Biosystems Engineering University of Tehran, P.O. Box 4111, Karaj 31587-77871, Iran
Mahmoud Omid
Department of Agricultural Machinery Engineering, Faculty of Biosystems Engineering University of Tehran, P.O. Box 4111, Karaj 31587-77871, Iran
Reza Alimardani
Department of Agricultural Machinery Engineering, Faculty of Biosystems Engineering University of Tehran, P.O. Box 4111, Karaj 31587-77871, Iran
Abstract This paper focuses on a problem of vibration-based condition monitoring and fault diagnosis of pumps used in the tractor steering system. The vibration signal from a piezoelectric transducer was captured for the following conditions: normal pump, journal-bearing with inner face wear, gear with tooth face wear, and journal-bearing with inner face wear plus gear with tooth face wear for three working levels of pump speed (1000, 1500, and 2000 rpm). Then Power Spectral Density (PSD) of vibration spectra was then calculated. Results showed that peak value of PSD was occurred in the frequency range between 70-120 Hz for all conditions. Comparison of numerical data produced by calculation the area under PSD v. frequency diagram showed that energy technique is an effective method for fault diagnosis of external gear hydraulic pumps. Keywords: Power spectral density, Vibration signal, External gear pump, Fault diagnosis 1. Introduction Nowadays, hydraulic pumps are more widely used in the power transmission system of automobiles and tractors as a main part of their hydraulic system. Steering system of modern tractors is equipped with both mechanical and hydraulic systems. Use of hydraulic power in the steering system can provide a facilitated steering for driver of tractor in the hard condition of farm lands. Hydraulic pumps are available in several types and are consisting of rotating and reciprocating parts (Srivastava, 2006). The detection and understanding of condition degradation in the pump is important for pump design and maintenance. For pump condition monitoring, the processing and analysis of the measured signal is the common way of extracting reliable feature representative of the pump condition (Mollazade et al., 2008). Condition monitoring provides information on the health and maintenance requirement of machinery and is used in a wide range of industrial applications. Parameters such as vibration, temperature, lubricant quality and power
Vol. 3, No. 6 Modern Applied Science
60
consumption can be used to monitor the mechanical status of equipment (James et al., 2004). In general, fault detection and diagnosis is a broad and active area of research. There are a large volume of papers that deal with this subject (Huang, 2001). In many applications the problem of fault detection and diagnosis is a crucial issue that has been theoretically and experimentally investigated with different types of approaches (Basseville and Nikiforov, 1993). Monitoring and failure detection improves the reliability and availability of an existing system. Since various failures degrade relatively slowly, there is potential for fault detection at an early stage. This avoids the sudden, total system failure which can have serious consequences. It is important in the context of condition monitoring to distinguish fault detection from fault diagnosis. Fault detection is the decision if a fault is present or not while fault diagnosis provides more information about the nature or localization of the failure. This information can be used to minimize downtime and to schedule adequate maintenance action (Chafei et al., 2008). The use of vibration and acoustic emission (AE) signals is quite common in the field of condition monitoring of rotating machinery. By comparing the signals of a machine running in normal and faulty conditions, detection of faults like mass unbalance, rotor rub, shaft misalignment, gear failures and bearing defects is possible. These signals can also be used to detect the incipient failures of the machine components, through the on-line monitoring system, reducing the possibility of catastrophic damage and the machine down time (Samanta et al., 2003). In recent years, on-line and automatic types of fault detection and diagnostic systems have been gaining considerable amount of business potential. The need for automating industrial processes and optimizing the cost of maintenance has stimulated the research and development of faster and robust fault diagnosis (Wuxing et al., 2004). Attempts have been made towards classification of the most common type of rotating machinery problems, defining their symptoms and search for remedial measures (Nalinaksh and Satishkumar, 2001). Signal processing methods have been widely used to extract fault feature of vibration signals. Fast Fourier Transform (FFT), which has been the dominating analysis tool for feature extraction of stationary signals, could produce the statistical average characteristics over the entire duration of the data (Akaike, 1974; Haloui et al., 2006). However, it fails to provide the whole and local features of the signal in time and frequency domain. FFT suffers from some limitations. Among these limitations, the FFT is not efficient to describe the non-stationarities introduced by faults in the vibration signal. The second limitation and the most important one is the frequency resolution, which is the ability to distinguish the spectral responses to two or many harmonics. Another limitation is due to the windowing of data which appears during the FFT processing. In order to overcome these performance limitations inherent to the FFT approach, many modern spectral estimation techniques have been proposed during the last two decades (Jones, 1974; Cadzow, 1982; Bekka, and Chikouche, 1999). Power spectral density (PSD) is one of those methods that is reported by several research works (Gibson, 1972; Norton and Karczub, 2003). Hence, the subject of this research was to diagnose the common faults of steering system hydraulic pump of Massey Ferguson MF 285 model tractor based on vibration monitoring and power spectral density method. 2. Material and Methods 2.1 Experimental works A number of carefully designed experiments were carried out a hydraulic pump of steering system of Massey Ferguson MF 285 model tractor. This pump is an external gear hydraulic pump. This pump uses two rotating gears which un-mesh at the suction side of the pump to create voids which allow atmospheric pressure to force fluid into the pump. The spaces between the gear teeth transport the fluid along the outer perimeter of the housing to the discharge side, and then the gears re-mesh at the center to discharge the fluid. The gears are supported by Journal-bearings on both sides, which allow high discharge pressure capabilities. The motion of the motive gear is directly produced by tractor engine. Figure 1 shows the components of this pump. Under the consideration of the degree of damage to the external gear pump, and the influence of economic cost, the faults were simulated mainly in the pump during the experiment. Vibration signals were collected for both normal condition and several different abnormal conditions (see Table 1 and Figure 2). Faulty parts were selected from the several pumps that were worked for a long time periods and their faults led to reduce of their efficiencies. The working speed of main shaft of the pump was set at approximately 1000, 1500, and 2000 rpm of engine rotational speed. With the sensor mounted on body of gear housing of the pump, vibration signals were measured for various fault conditions by on-line monitoring when tractor was working at a stationary situation. The sensor used is a piezoelectric accelerometer (VMI-102 model) which was mounted on the flat surface of pump using hand mounting technique because of aluminized substance of the gear housing of the pump. The sensor was connected to the signal-conditioning unit (X-Viber FFT analyzer), where the signal goes through a charged amplifier and an analogue-to-digital converter (ADC). The vibration signal in digital form was saved on computer through a USB port for further analyses. The software SpectraPro-4 that accompanies the signal-conditioning unit was used for recording the signals directly in the computer’s secondary memory. The signal was then read from the memory and processed to extract the Fast Fourier
Modern Applied Science June, 2009
61
Transform (FFT) of vibration spectrum. The sampling rate was 1000 Hz. After calculating FFT of vibration signals, power spectral density (PSD) was calculated and then graph of PSD versus frequency was plotted for each spectrum. 2.2 Theoretical principles 2.2.1 Fast Fourier Transform FFT is applied in order to convert time domain signals X(n) into the frequency domain (Brigham, 1988; Yang and Penman, 2000):
∑−
=
−=
1
0
2)(1)(
N
n
Nfni
enxN
fXπ , f=0, 1, 2, …, N-1 (1)
where f is the discrete frequency. 2.2.2. Power Spectral Density (PSD) PSD function shows the strength of the variations (energy) as a function of frequency. In other words, it shows at which frequencies variations are strong and at which frequencies variations are weak (Irvine, 1998). It can be obtained from the FFT as follows. The complex spectrum of a vibration x(t) in the time range (t1, t2) for any frequency f in the two-sided frequency domain (-f, +f) can be stated as (2) (Howard, 2002).
dtetxfXt
t
ift∫ −=2
1
2)()( π (2)
If x(t) is expressed in units of m/s2, X(f) is expressed in units of (m/s2)/Hz. From the complex spectrum, the one-sided PSD can be computed as (3).
)()(2
)(12
2
ttfX
fPSD−
= (3)
where the factor 2 is due to adding the contributions from positive and negative frequencies. The PSD divides up the total power of the vibration. To see this, we integrate it over its entire one-sided frequency domain (0, f):
∫∫
−=
f
t
t
tt
dttxdffPSD
0 12
2
)(
)()(
2
1 (4)
This is precisely the average power of the vibration in the time range (t1, t2). However, if the FFT of vibration signal be used, then the PSD may be calculated directly in the frequency domain by following formula (Irvine, 2000; Howard, 2002):
fGPSD rms
2
= (5)
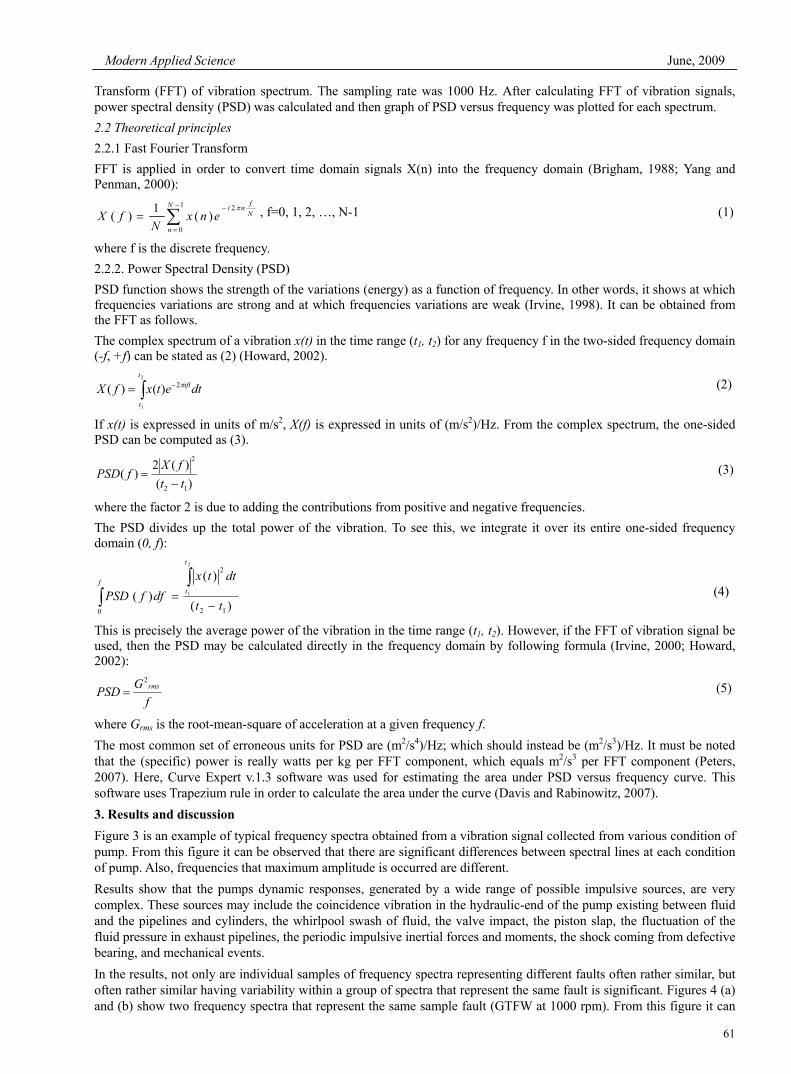
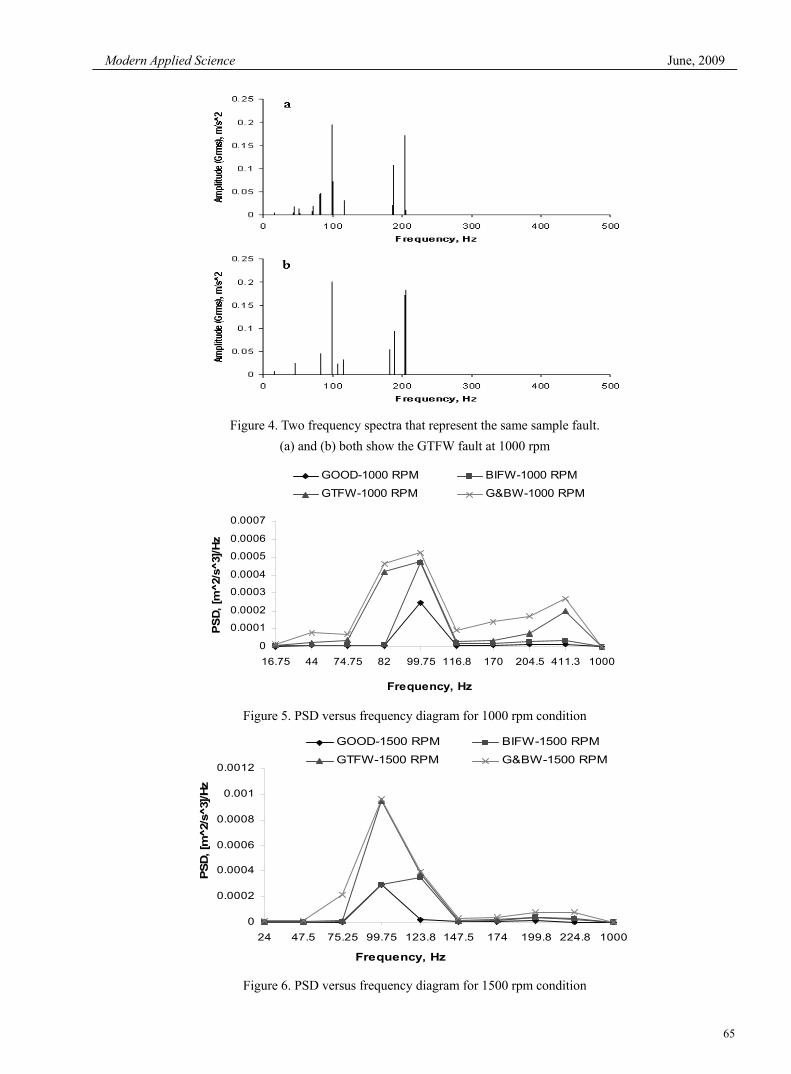
where Grms is the root-mean-square of acceleration at a given frequency f. The most common set of erroneous units for PSD are (m2/s4)/Hz; which should instead be (m2/s3)/Hz. It must be noted that the (specific) power is really watts per kg per FFT component, which equals m2/s3 per FFT component (Peters, 2007). Here, Curve Expert v.1.3 software was used for estimating the area under PSD versus frequency curve. This software uses Trapezium rule in order to calculate the area under the curve (Davis and Rabinowitz, 2007). 3. Results and discussion Figure 3 is an example of typical frequency spectra obtained from a vibration signal collected from various condition of pump. From this figure it can be observed that there are significant differences between spectral lines at each condition of pump. Also, frequencies that maximum amplitude is occurred are different. Results show that the pumps dynamic responses, generated by a wide range of possible impulsive sources, are very complex. These sources may include the coincidence vibration in the hydraulic-end of the pump existing between fluid and the pipelines and cylinders, the whirlpool swash of fluid, the valve impact, the piston slap, the fluctuation of the fluid pressure in exhaust pipelines, the periodic impulsive inertial forces and moments, the shock coming from defective bearing, and mechanical events. In the results, not only are individual samples of frequency spectra representing different faults often rather similar, but often rather similar having variability within a group of spectra that represent the same fault is significant. Figures 4 (a) and (b) show two frequency spectra that represent the same sample fault (GTFW at 1000 rpm). From this figure it can
Vol. 3, No. 6 Modern Applied Science
62
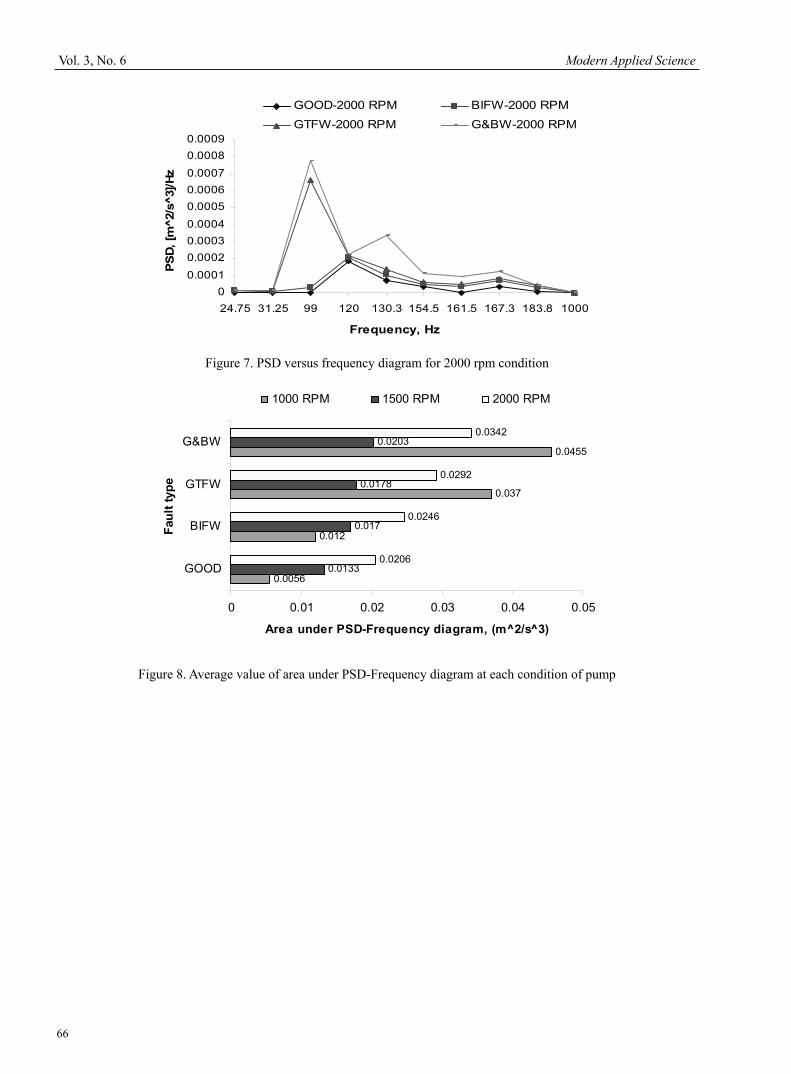
be observed that there are obvious differences between these two samples of pump. For other conditions similar results were observed. The challenge is to provide early detection capability as well as distinction between fault types with a low risk of false alarms. In the fault diagnosis of pump, the frequency spectra of vibration signals contain complicated information of the running condition. Therefore it can be concluded that use of FFT is not suitable for diagnose of pump faults. Similar findings were reported by Wang and Hu (2006) for five-plunger pumps and Wang and Chen (2007) for centrifugal pumps. They reported that in the early stages of a fault, effects of noise are so strong that the symptoms of a fault are not evident. In order to devise a simple fault diagnosis, PSD function of frequency spectra was calculated. Diagram of PSD curves versus frequency for each condition of pump are shown in the figures 5 to 7. Results showed that peak value of PSD was occurred in the frequency range between 70-120 Hz for all conditions. At first glance it can be observed that the area under PSD-Frequency curves is different for different condition of pump. This characteristic can be used in the fault classification of pump. Therefore, the area under PSD-Frequency diagram for 10 spectra at each condition was calculated and the average of them is shown in Figure 8. According to this figure, area is increased by increasing the fault severity at each working speed. At GOOD and BIFW fault types of pump, maximum value of area was for 2000 rpm condition, but this value was at maximum for 1000 rpm condition at GTFW and G&BW condition. 4. Conclusion The applications of the technique presented in this work are intended to be an analysis tool that can be used like an aid in the incipient detection problem of tractor steering pump faults. Summary of conclusion can be stated as follows: 1) Fault diagnosis of hydraulic pump is difficult using spectrum of vibration signals alone. 2) It is difficult to identify the symptom parameters for diagnosis by which all fault types can be distinguished perfectly. 3) Energy technique (calculation of area under PSD v. Frequency diagram) is suitable to diagnose several fault types that may be occurred at an external gear hydraulic pump. Therefore this technique can be used as a simple and reliable method for fault diagnosis of MF285 tractor steering pump. 4) Results of this study can be used as an input for automatic fault diagnosis systems such as neural network and fuzzy logic. References Akaike, H. (1974). A new look at the statistical model identification. IEEE. Transactions on automatic control, AC-19(6). Basseville, M., & Nikiforov, I. V. (1993). Detection of abrupt changes – theory and applications. Englewood Cliffs: Prentice-Hall Inc., Simon & Schuster Company. Bekka, R. E., &. Chikouche, D. (1999). Pouvoir de detection et de résolution de la méthode AR: Application aux signaux courts. Revue Sciences &c Technologie, Univ. Constantine, 12, 49- 53. Brigham, E. (1988). Fast fourier transform and its applications. Prentice Hall Press. Cadzow, J. A. (1982). Spectral estimation: an overdetermined rational model equation approach. Proc. IEEE, 70(9), 907-937. Chafei, S., Zidani, F. R., Nait-said, M., & Boucherit, S. (2008). Fault detection and diagnosis on a PWM inverter by different techniques. Journal of Electrical Systems, 4(2), 1-12. Davis, P. J., & Rabinowitz, P. (2007). Methods of numerical integration. (2nd Edition). Dover Publications. Gibson, B. (1972). Power Spectral Density: a fast, simple method with low core storage requirement, M.I.T. Charles Stark Draper Laboratory Press. Haloui, N., Chikouche D., Benidir, M., & Bekka,R. E. (2006). Diagnosis of gear systems by specral analysis of vibration signals using synchronous cepstre technique. ESTS Internationl Transactions on Communication and Signal Processing, 8 (1), 27 –36. Huang, B. (2001). Detection of abrupt changes of total lest square models and application in fault detection. IEEE Transactions on Control Systems Technology, 9(2), 357-367. Howard, R. M. (2002). Principles of random signal analysis and low noise design: The power spectral density and its applications. Wiley-IEEE Press. Irvine, T. (1998). An introduction to spectral functions. Vibration Data Press. Irvine, T. (2000). Power spectral density Units: [G2 / Hz]. Vibration Data Press.

Modern Applied Science June, 2009
63
James, E. P., Tudor, M. J., Beeby, S. P., Harris, N. R., Glynne-Jones, P., Ross, J. N., & White, N. M. (2004). An investigation of self-powered systems for condition monitoring applications. Sensors Actuarors, 110, 171-176. Jones, R. H. (1974). Identification and autoregressive spectrum estimation, IEEE. Transaction on automatic control, AC-131(13). Mollazade, K., Ahmadi, H., Omid, M., & Alimardani, R. (2008). An intelligent combined method based on power spectral density, decision trees and fuzzy logic for hydraulic pumps fault diagnosis. International Journal of Intelligent Systems and Technologies, 3(4), 251-263. Nalinaksh, S., & Satishkumar, V. D. (2001). Artifcial neural network design for fault identification in a rotor-bearing system. Mechanism and Machine Theory, 36, 157-175. Norton, M. P., & Karczub, D. G. (2003). Fundamentals of noise and vibration analysis for engineers. Cambridge University Press. Peters, R. D. (2007). A new tool for seismology-the cumulative spectral power. Georgia: Mercer University Press. Samanta, B., Al-Balushi, K. R., & Al-Araimi, S. A. (2003). Artificial neural networks and support vector machines with genetic algorithm for bearing fault detection. Engineering Application of Artificial Intelligence, 16, 657-665. Srivastava, A. k., Georing, C. E., Rohrbach, R. P., & Buckmaster, D. R. (2006). Engineering principles of agricultural machines. (2nd ed.). Michigan: St. Joseph Press. Wang, J., & Hu, H. (2006). Vibration-based fault diagnosis of pump using fuzzy technique. Measurement, 39: 176–185. Wang, H. Q. & Chen. P. (2007). Fault diagnosis of centrifugal pump using symptom parameters in frequency domain. Agricultural Engineering International: the CIGR Ejournal. Manuscript IT 07 005. Vol. IX. Wuxing, L., Tse Peter, W., Guicai, Z., & Tielin, S. (2004). Classification of gear faults using cumulants and the radial basis function network. Mechanical Systems and Signal Processing, 18, 381-389. Yang, D. M., & Penman, J. (2000). Intelligent detection of induction motor bearing faults using current and vibration monitoring. Proceedings of COMADEM 2000, 1, 461-470. Table 1. Pump faults taken into consideration
Number Fault type Label of Fault
1 Normal pump GOOD 2 Journal-bearing with inner face wear BIFW 3 Gear with tooth face wear GTFW 4 Mixture of faults number 2 & 3 G&BW
Figure 1. Main components of an external gear pump
Journal Bearing
Gears
Gear Housing
Vol. 3, No. 6 Modern Applied Science
64
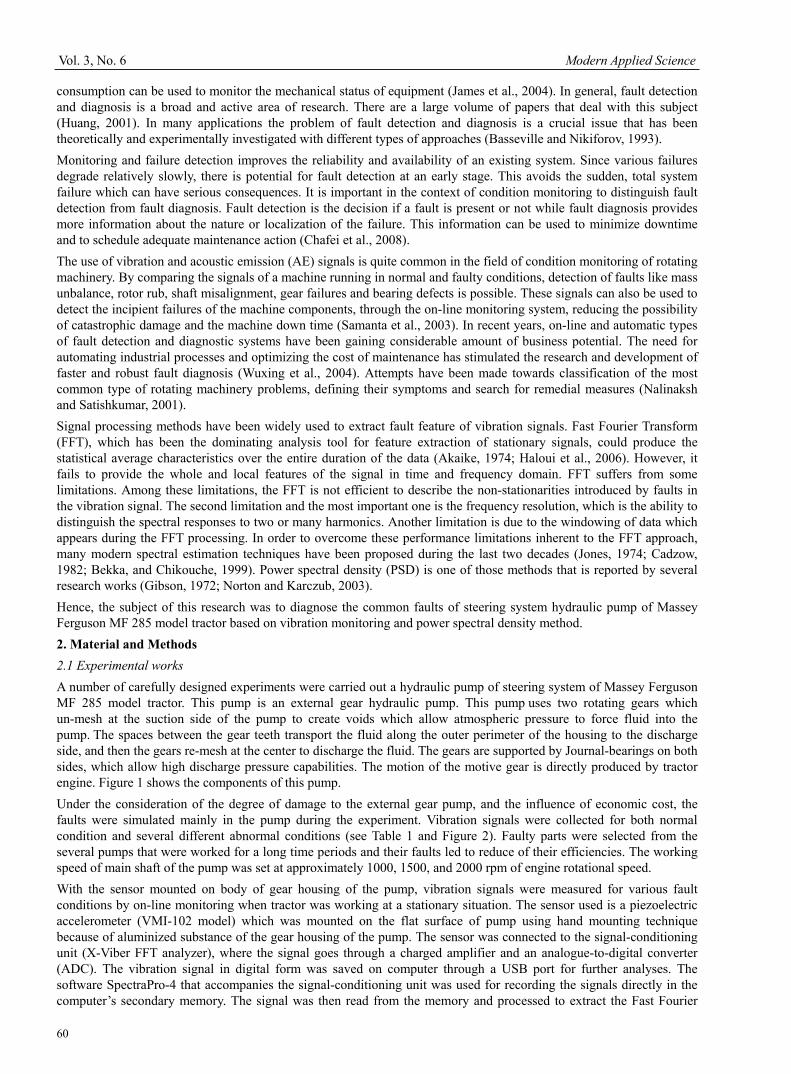
Figure 2. a. View of gear with tooth face wear, b. View of good gear,
c. View of good journal-bearing, d. View of journal-bearing with inner face wear
Figure 3. Frequency spectra of pump in a. 1000 rpm, b. 1500 rpm, and c. 2000 rpm
Modern Applied Science June, 2009
65
Figure 4. Two frequency spectra that represent the same sample fault.
(a) and (b) both show the GTFW fault at 1000 rpm
0
0.0001
0.0002
0.0003
0.0004
0.0005
0.0006
0.0007
16.75 44 74.75 82 99.75 116.8 170 204.5 411.3 1000
Frequency, Hz
PS
D, [m
^2/s
3]/H
z
GOOD-1000 RPM BIFW-1000 RPM
GTFW-1000 RPM G&BW-1000 RPM
Figure 5. PSD versus frequency diagram for 1000 rpm condition
0
0.0002
0.0004
0.0006
0.0008
0.001
0.0012
24 47.5 75.25 99.75 123.8 147.5 174 199.8 224.8 1000
Frequency, Hz
PSD
, [m
^2/s
3]/H
z
GOOD-1500 RPM BIFW-1500 RPM
GTFW-1500 RPM G&BW-1500 RPM
Figure 6. PSD versus frequency diagram for 1500 rpm condition
Vol. 3, No. 6 Modern Applied Science
66
00.0001
0.00020.00030.0004
0.00050.00060.0007
0.00080.0009
24.75 31.25 99 120 130.3 154.5 161.5 167.3 183.8 1000
Frequency, Hz
PSD,
[m^2
/s^3
]/Hz
GOOD-2000 RPM BIFW-2000 RPM
GTFW-2000 RPM G&BW-2000 RPM
Figure 7. PSD versus frequency diagram for 2000 rpm condition
0.0056
0.012
0.037
0.0455
0.0133
0.017
0.0178
0.0203
0.0206
0.0246
0.0292
0.0342
0 0.01 0.02 0.03 0.04 0.05
GOOD
BIFW
GTFW
G&BW
Faul
t typ
e
Area under PSD-Frequency diagram, (m^2/s 3)
1000 RPM 1500 RPM 2000 RPM
Figure 8. Average value of area under PSD-Frequency diagram at each condition of pump