Embed Size (px)
Citation preview

Vertical Profiling: Understandingthe Behavior of Object-OrientedApplications
Matthias Hauswirth, Amer DiwanUniversity of Colorado at Boulder
Peter F. Sweeney, Michael HindIBM Thomas J. Watson Research Center
Presented by: Irantha Suwandarathna

Outline
What is Vertical Profiling Motivations Implementation Case studies Conclusions
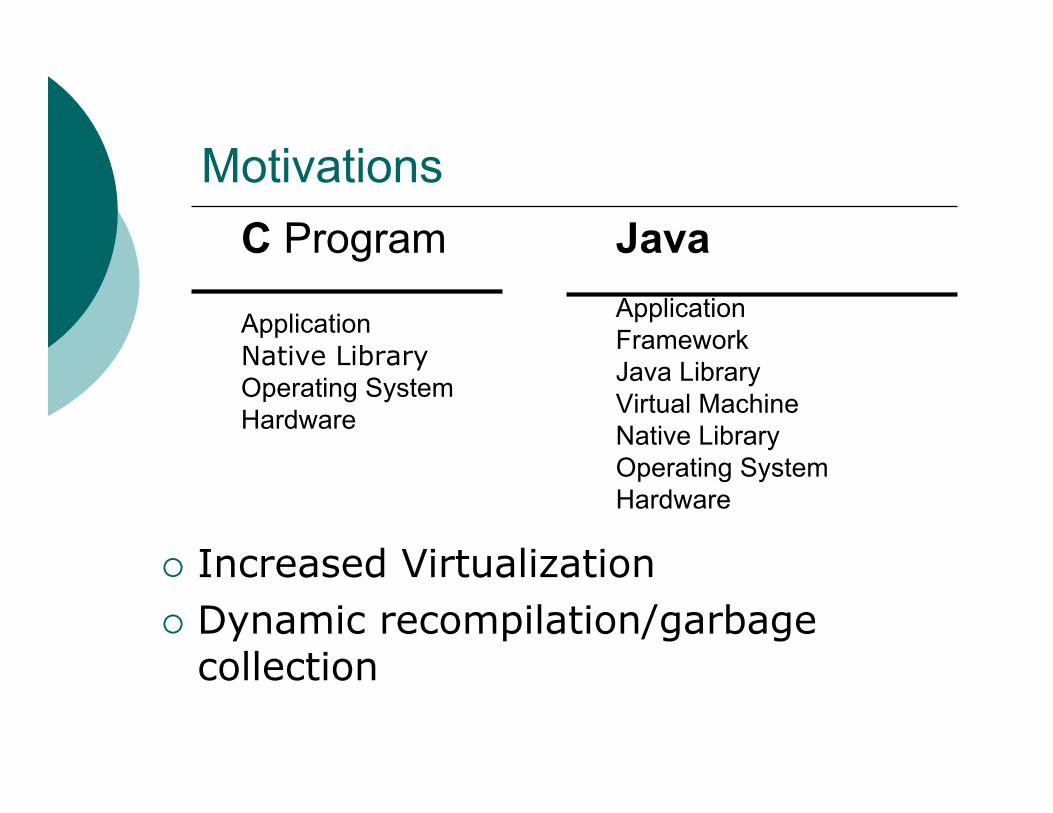
Motivations
Increased Virtualization Dynamic recompilation/garbage
collection
ApplicationFrameworkJava LibraryVirtual MachineNative LibraryOperating SystemHardware
Java
ApplicationNative LibraryOperating SystemHardware
C Program

Implementation
One trace file for JikesRVM Thread Virtual Processor ID, Thread ID, Real Time, Real Time duration , Compiled Method ID, Monitor Values
Only 1 thread execute in measurementperiod
Real time value to merge trace files &durations for non-VM Threads
Meta file for ID name mappings

Where Monitor values are kept
Native code Instrumentations PThread specific storage
Java level Instrumentations Virtual Processor object

Measurement Overhead
With 148 Software performancemonitors

Perturbation Analysis
End-to end perturbation for HPM Runs with no collection during execution 5 runs & taking the average
Temporal impact of HPM Qualitative analysis with their knowledge
Impact of SPMs on HPMs Runs with & without SPMs
Impact of SPMs on SPMs Qualitative analysis with their knowledge

Validation
Hypothesis about the cause Eliminate the cause See whether phenomenon is gone

Case Studies
Primary performance Metric Instructions Per Cycle (IPC)

Gradual Increase in jbb
50 transactions per time slice From previous studies
Optimized code has 32% higher IPC Increase IPC low LSU flushes
15.2% LSU flushes in optimized code 0.1% LSU flushes in un-optimized code
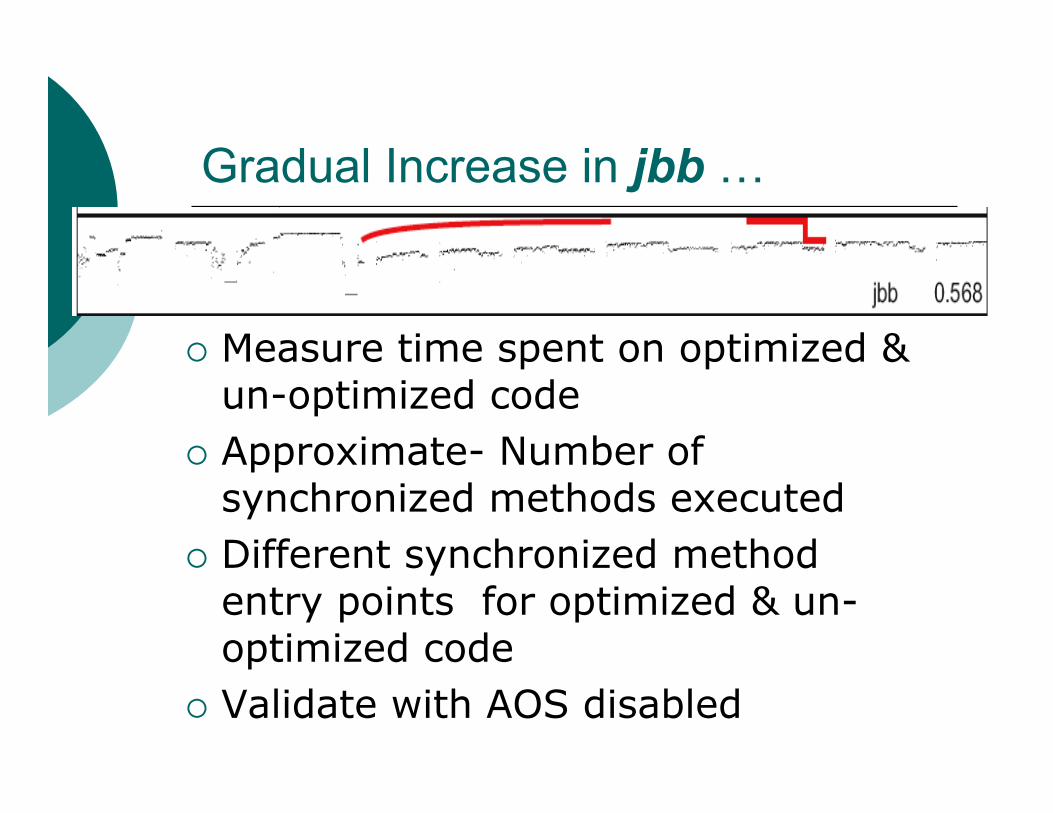
Gradual Increase in jbb …
Measure time spent on optimized &un-optimized code
Approximate- Number ofsynchronized methods executed
Different synchronized methodentry points for optimized & un-optimized code
Validate with AOS disabled

Gradual Increase in jbb …

Sudden Increase in compress
Two long running methods Compress & decompress
1st jump compress optimized 2nd jump decompress optimized Instrumentation
Top of the stack method ID Most recently optimized method

Sudden Increase in compress …

Dip before GC in HSQL
Adaptive heap resizing App. runs out of memory Trigger GC page fault exceptions low IPC Instrumentation
Number of virtual page requests CPU cycles with exceptions disabled Number of bytes allocated in JAVA

Dip before GC in HSQL …
Cross correlation MmapBytes & AllocBytes 0.9995
Validation – disable adaptive heap resizing

Periodic Pattern in Db
Each Pattern corresponds to a Shellsort run
L2 cache not enough to keep theworking set drop in IPC
-0.916 correlation between IPC &L2 cache miss rate
Measure set size

Periodic Pattern in Db …
Validation Object in lining IPC drop start at larger set size

Why lot of small time slices in Multi-Threaded benchmarks?
For jbb 1 worker thread – 2221 time slices More than 1 – 10,441 time slices
Small time slices High lock contention
Thread yield end time sliceprematurely

Why lot of small time slices in Multi-Threaded benchmarks?
Decrease in wall clock time Increase in CPU time Samples – Lock Yields = constant

Where Lock contention Happens

Instrumentation & Layers
Approach Browsing Searching

Problems with statistical correlation
Low even frequency No linear relationships Leverage points Direction of causality

Difficulties of this approach
Knowledge on all layers H/W ,OS, VM ,Libraries , Application
Required metrics not known Perturbation Not automated
Thousands of metrics to manuallyinspect

Conclusions
Vertical profiling can be used tounderstand performance phenomenain modern multi layers systems.