Embed Size (px)
Citation preview

Vertical integration in sports
Bachelor Thesis Organization & Strategy, 2010 Paul Tips S469657 Eric Dooms 7.914 words

1
Table of Contents
Chapter 1 Introdution ................................................................................................. 3
1.1 Introduction...................................................................................................... 3
1.2 Problem Indication ........................................................................................... 3
1.3 Problem statement .......................................................................................... 3
1.4 Research Questions ........................................................................................ 4
1.5 Research Design and Data Collection ............................................................. 5
1.6 Structure of the thesis ...................................................................................... 5
2. Competitive advantage through vertical integration ............................................... 6
2.1 Introduction...................................................................................................... 6
2.2 Reasons .......................................................................................................... 6
2.3 Transaction costs ............................................................................................ 6
2.4 Competitive advantage .................................................................................... 8
2.5 Conclusion....................................................................................................... 9
3. Vertical integration and competitive advantage in sports ..................................... 10
3.1 Introduction.................................................................................................... 10
3.2 The sport business ........................................................................................ 10
3.3 Owner behaviour ........................................................................................... 11
3.4 Winnig as competitive advantage .................................................................. 11
3.5 Business results as competitive advantage ................................................... 12
3.6 Conclusion..................................................................................................... 15
4. Consequences of vertical integration on the competitive balance of MLB ............ 16
4.1 Introduction.................................................................................................... 16
4.2 Winning percentages 2000 – 2009 ................................................................ 17
4.3 Postseason 2000 – 2009 ............................................................................... 18
4.4 Championships 2000 – 2009 ......................................................................... 19
4.5 Historic perspective ....................................................................................... 20
4.6 Financial performance ................................................................................... 22
4.7 Conclusions ................................................................................................... 23
Chapter 5 Conclusion, discussion and recommendations ....................................... 24
5.1 Introduction.................................................................................................... 24
5.2 Conclusion..................................................................................................... 24
5.3 Discussion ..................................................................................................... 24
5.4 Recommendations ......................................................................................... 25
References .............................................................................................................. 26
Appendix A Major League Baseball Division ........................................................... 30
Appendix B Wins / losses 2000 – 2009 ................................................................... 31

2
Appendix C SPSS Output........................................................................................ 32
Appendix D Major League Baseball playoff format .................................................. 33
Appendix E Postseason appearances ..................................................................... 34
Appendix F Historic overview .................................................................................. 35
Appendix G Franchise values .................................................................................. 36
Appendix H Profit / loss values ................................................................................ 37

3
Chapter 1 Introdution
1.1 Introduction
In this first chapter the problem that this thesis is going to address is
introduced and the questions this thesis will try to answer to come to a conclusion
and suggestions about how the problem can be handled are clarified.
1.2 Problem Indication
Apart from many publicly listed companies the trend of multiple business and
multinational operations is also emerging in other kinds of organizations. While we
have seen vertical integration in the industrial business world since the beginning of
the twentieth century (Coase, 1937) this development took long to gain ground in the
sports world. The first good example of this development are the 1980s the Major
League Baseballs (MLB) Chicago Cubs which their owners the Tribune Corporation
used to extend the national market for the Tribunes World's Greatest Network
(WGN). The trend of vertical integration really took a flight in the mid-1990s though
when News Corp. bought the Los Angeles Dodgers, Walt Disney purchased the
Anaheim Angels and the Mighty Ducks of Anaheim, and Time Warner took over the
Atlanta Braves, Hawks and Trashers (Bellamy & Walker, 2005). Then, starting in
2002 Yankees Global Enterprises LLC (YGE) started operating the Major League
Baseball (MLB) team New York Yankees and its Minor League affiliates but also the
broadcasts of the team‟s games through its Yes Network. Ever since these first
starters this tradition has been followed by numerous organizations, both clubs and
governing bodies, in both the United States and Europe (Hoehn & Lancefield, 2003).
As shown this trend is only a very recent one, not more than 30 years old. It is
strange that it took sports organizations so long to get involved in vertical integration,
but more important to me is why they are doing it now. This thesis will try to find out
whether or not vertical integration has lead to a competitive advantage for sport
teams involved.
1.3 Problem statement
Can sustainable competitive advantage be achieved through vertical integration in
the sports industry?
In the industrial world one of the reasons to get involved in vertical integration is to
gain a sustainable competitive advantage over competitors. Extensive research has
been done into this (Stucky& White, 1993). Not so much attention has been paid to

4
vertical integration in the sports world though. I will try to find out how a sustainable
competitive advantage can be gained by sports organizations by vertically
integrating.
(A firm can be described as vertically integrated if it encompasses two single-output
production processes in which either (1) the entire output of the "upstream" process
is employed as part or all of the quantity of one intermediate input into the
"downstream" process, or (2) the entire quantity of one intermediate input into the
"downstream" process is obtained from part or all of the output of the "upstream"
process (Perry, 1990).)
1.4 Research Questions
How can sustainable competitive advantage be achieved through vertical
integration?
To research if competitive advantage can be achieved through vertical integration we
first need to research how competitive advantage can be achieved using vertical
integration. Because there is not a lot of scientific study on the way this is done in the
sports world I will study the industrial business world, look at how it‟s done there and
then try to link that to the world of sports.
How can competitive advantage be measured in sports?
After I have established that vertical integration can lead to a competitive advantage
it is important to know how competitive advantage can be measured in sports. Apart
from financial results there are of course also the results, winning or losing, on the
playing field and probably these two results are related. How do stakeholders look at
these advantages and which do they find most important.
What are the consequences of vertical integration on the competitive balance
in MLB?
After we have established how competitive advantage can be measured in sports I
will single out Major League Baseball and try to establish whether or not baseball
organisations that have gotten vertically integrated have gained a competitive edge
over their competitors that have not moved in that direction.

5
1.5 Research Design and Data Collection
This research will be an exploratory research. The method that will be used is
a literature review but financial data and results of sports organizations will also be
reviewed. The focus will be on the Major League Baseball, with literature in the field
of sport management, strategic management and organizational behaviour being
studied.
This study will primarily use secondary data sources. These secondary data
will be gathered by using the services of the library of the University of Tilburg and
the University of Utrecht, in particular the search engines; ABI-inform, the NCC and
JSTOR. Validation whether or not an article is reliable can be done by checking if the
source is a reliable business journal. A list of reliable business journals is presented
in the course „business research‟. A problem with this can be that sports
management has only recently attracted vast scientific interest and its journals have
not really made it to the lists of top journals yet. The first research question of this
thesis gives me the change though to first study established articles on vertical
integration and competitive advantage which I can than link to the sports world.
To answer the third research question I also looked at sites that keep
baseball statistics such as baseball-reference.com and at Forbes‟ valuation of MLB
franchises.
1.6 Structure of the thesis
This thesis will consist of five chapters with this one being the first. Chapter 2 till 4 will
subsequently answer one of the research questions. In chapter 5 than the
conclusions and recommendations based on the findings in the previous chapters will
be given.

6
2. Competitive advantage through vertical integration
2.1 Introduction
Before I take a look at how competitive advantage can be achieved through
vertical integration we first need to define these two concepts.
According to Porter (1985) a firm's relative position within its industry determines
whether a firm's profitability is above or below the industry average. The fundamental
basis of above average profitability in the long run is sustainable competitive
advantage.
2.2 Reasons
Vertical integration can be defined as integrating two or more adjacent economic
stages under its ownership control. The outputs of earlier stages are then used all, or
in part as inputs for subsequent stages (Perry, 1978). The existence of vertically
integrated enterprises is evident throughout history and although it can generate
significant administrative and strategic costs through greater complexity and
commitment escalation (Mahoney, 1992) it continues to be a popular (Pitta, 1993)
and important strategy (Stuckey & White, 1993). According to Mahoney (1992)
reasons to vertically integrate can be divided into four different motives. These
motives are transaction costs incentives, strategic rationales, uncertainties regarding
price, and incentives related to output and/or input conditions. However, according to
Philips and Mahoney (1985) when we abstract transaction costs from these four
reasons there are no real motives for vertical integration left and it has no more
advantages then vertical contracting (i.e. exclusive dealings, resale price
maintenance, exclusive territories, etc.). In other words vertical integration for other
reasons then the transaction cost incentive will not lead to a clear competitive
advantage. Therefore, in this chapter we will focus on the transaction cost reason to
engage in vertical integration.
2.3 Transaction costs
The term transaction cost has caused much friction in the economic lexicon. Its
ambiguity comes from the problem that there are two literatures simultaneously
claiming ownership over the term (Allen, 1991). While sceptics claim that currently
the term “transaction costs” can include any cost that is convenient and elusive
enough to avoid critical examination (Niehans, 1987) advocates have compare the

7
words and its meaning to economic important words such as marginalism and
substitution (Cheung, 1983). I will use the definition first stated by Arrow (1969). He
defines transaction costs as „the costs of organizing the economic system‟. Following
Coase, transactions are sorted according to whether they take place within a firm or
on the open market. Market alternatives become dangerous when exchanges that
are repeated regularly involve transaction-specific capital and information processing.
Within firm transactions then provide a suitable alternative. Ownership of physical
capital limits the possibilities of opportunism that might be possible when capital is
owned by different owners. The structural entity of the firm also provides a basis for
more efficient information transfers. In terms of vertically related production
processes, the firm will integrate when the costs of transacting over markets
outweighs internal costs of management (Levy, 1985).
The transaction costs theory of vertical integration thus leads to specific
competitive advantage. These five, amongst others, are identified by Mahoney
(1992):
1. Profit: The profit incentive is probably the clearest source of competitive
advantage. Due to the fact that all profits falls under one company there are no
claims on them by other stakeholders so there is no need to negotiate over how to
divide these profits.
2. Coordination and control: A vertically integrated firm has better control of
opportunistic behaviour due to the authority relationship within the firm (Dow, 1987).
Divisional managers can more easily be required to cooperate with the general
behaviour of the company because they can be steered by promotions or financial
benefits. It usually is also more efficient to settle disputes within a company than
through court with a contractual stakeholder.
3. Audit and Resource allocation: According to Williamson (1975) the auditing powers
of the firm are superior to the auditing capabilities of contracting parties. Although this
is disputed by Grossman and Hart (1986) research done by Chandler (1977) into the
auditing improvements of merged railroad firms compared to railroad cartels
empirically proves Williamsons claim is very likely to be true. A firm has the legal
right to audit its own divisions but the right to audit outside contractors always has to
be contractual arranged which involves transaction costs (Mahoney, 1992). Also the
superior information on which a firm can base resource allocation to their divisions
prevents these divisions from strategically using their information and thus the risk of
detriment of profit through misinformation is eliminated (Crocker, 1983).
4. Communication: The standardization of language in between divisions of an
integrated company increases communication efficiencies and provides stability in

8
operations. While these advantages could be obtained through recurrent contracting
in that situation there is always the risk of opportunistic behaviour (Malmgren, 1961).
Firms are arguably better than markets in communicating because the incentives for
opportunism are reduced through much better auditing opportunities (also see point
3). Integrated firms thus have an information processing advantage over its non
integrated competitors and that advantage is even larger because it complements its
superior auditing capabilities (Sandler and Cauley, 1980).
5. Tax advantages: Coase (1937) was the first to link vertical integration to the
avoidance of sales taxes with respect to arms length contracting. More recently Bolch
and Damon (1978) found that petroleum firms in the United States found it profitable
to increase the price of crude oil relative to the price of final products in order to shift
as much of their reported earnings as possible to the raw material extraction stage,
which enjoys tax preferences associated with resource depletion. Similar results
were found by Scherer and Ross (1990) in their study of the copper, aluminium and
steel industries.
2.4 Competitive advantage
In this chapter, and also in the introduction the words competitive advantage have
been mentioned multiple times. But what exactly does competitive advantage entail?
According to Barney (2000) a competitive advantage is a value creating strategy, not
simultaneously being implemented by any current or potential competitors.
A sustainable competitive advantage is the same as the above mentioned definition
with the addition that these competitors are unable to duplicate the benefits of this
strategy. There are however some points to take into account considering this
definition. That a competitive advantage is sustained does not imply that it will "last
forever." It only suggests that it will not be competed away through the duplication
efforts of other firms. Unanticipated changes in the economic structure of an industry
may make what was, at one lime, a source of sustained competitive advantage, no
longer valuable for a firm, and thus not a source of any competitive advantage.
These structural revolutions in an industry culled "Schumpeterian Shocks" by for
example Rumelt & Wensley (1981), redefine which of a firm's attributes are
resources and which are not. Some of these resources, in turn, may be sources of
sustained competitive advantage in the newly defined industry structure (Barney,
1986). However, what were resources in a previous industry selling may be
weaknesses, or simply irrelevant, in a new industry setting. A firm enjoying a
sustained competitive advantage may experience these major shifts in the structure

9
of competition, and may see its competitive advantages nullified by such changes.
However, a sustained competitive advantage is not nullified through competing firms
duplicating the benefits of that competitive advantage.
This definition, combined with the resource based view, which assumes that firms
within an industry can be heterogeneous with respect to the strategic resources they
control and that resources may not be perfectly mobile within an industry can be
translated to the baseball strategy. This topic will be discussed in more detail in
chapter 3
2.5 Conclusion
According to D‟Aveni and Ravenscraft (1994) vertical integration results in
economies of integration, regardless of industry effects and economies of scope and
scale. Furthermore they find that both forward and backward integration contribute to
greatly reduced general and administrative expenditures. This suggests that that
integration does not increase the costs of hierarchy despite the need for greater
internal coordination with upstream and/or downstream lines of business. D‟Aveni
and Ravenscraft also found that the cost savings from general and administrative
expenses are most clearly linked to increased profitability and thus I think I can
conclude that vertical integration can lead to cost reduction and in that way can lead
to a sustainable competitive advantage.

10
3. Vertical integration and competitive advantage in sports
3.1 Introduction
This chapter of the thesis will discuss how competitive advantage can be
measured in sports. In the previous chapter the concepts of competitive advantage
and vertical integration have been explained and now it is time to translate this into
sports.
3.2 The sport business
Unlike businesses in other industries professional sport teams in any given
league not only compete against each other but also have to cooperate with these
same competitors to keep their right of existence. As noted by Neale (1964) and El-
Hodiri and Quirk (1974), the elimination of competition in professional sports
effectively eliminates the industry. Suppose the New York Yankees used their wealth
to buy up not only all the good players but also all of the teams in the American
League: no games, no gate receipts, no New York Yankees. The success of a
league is, at least to some extent, affected by the degree of uncertainty of outcome of
its contests and its seasonal competitions, or, in other words, by the degree of
balance among its teams. (Zimbalist, 2003). Fans tend to prefer contests between
equally matched sporting competitors. Again it is a peculiarity of the professional
team sports industry that, unlike other industries, increased monopolisation tends to
reduce profitability. This is variously known as the Louis-Schmelling or New York
Yankees paradox (Neale, 1964). Just as heavyweight boxing champions such as Joe
Louis need credible contenders to maximise their earnings, so too with top teams. As
is oft quoted, after a long period of dominating the American League in the 1950s,
the New York Yankees suffered a falloff in their gate attendances, only for this
decline to be reversed when they lost the championship. Fans lose interest in
contests that are a foregone conclusion.
Professional sports leagues also are different from „regular‟ industries in the
degree of public exposure they receive. Daily the results of games are reported
extensively by newspapers, radio, television, and on the internet. These results are
then discussed by millions of fans, which is a lot different from the quarterly numbers
of reported by companies in other industries.

11
3.3 Owner behaviour
The question is of course whether or not these unique features of sports leagues
lead the owners of these businesses to behave differently from owners of other
businesses. In other words to they seek other competitive advantages then owners of
businesses in other industries. In 1973 a sportswriter for the New York Times
Magazine, Leonard Koppett suggested they do:
“Club owners are not ordinary businessmen. To begin with, profit in itself is not
the owner‟s primary motive. Any man with the resources to acquire a major league
team can find ways to make better dollar-for-dollar investments. His payoff is in terms
of social prestige… A man who runs a $100m-a-year business is usually anonymous
to the general public; a man who owns even a piece of a ball club that grosses $5m a
year is a celebrity… This does not mean, of course, that ball clubs don‟t seek
profits… but the driving force is to be identified with a popular and successful team…
and that motivation leads to important variations from „normal‟ business behaviour.”
Economists agree with this perspective. Peter Sloane (1971) states in his
article on English soccer that ownership of a soccer team had more to do with
maximizing utility than with maximizing profit. In 1999 however Kesenne and
Jeanrenaud concluded that one of the most important differences between sports
clubs in the USA and Europe was that American clubs are business-type companies
seeking to make profits whereas the only aim of most European clubs so far is to be
successful on the field. As this thesis is focusing in Major League Baseball, an
American Sport, the rest of this chapter will focus on the view at competitive
advantage of American team owners.
3.4 Winnig as competitive advantage
In interviews owners of sports organisations usually do try to emphasise that
they are motivated strictly and mostly by civic pride and have non-selfish motives
while operating a sports team. As Joe Maloof, owner of the National Basketball
Associations Sacramento Kings put it in an interview in 2003: „We have one goal in
mind and that is to win a title. We‟re not going to rest until we have that for the city of
Sacramento and for our franchise. We‟ve never had a title and that‟s what we need to
get‟. Because what people say in interviews and how they really behave sometimes
has some discrepancies there have been economists that have studied empirical
data to find whether they tell the truth and are really utility-maximizers or also trying
to maximise their profits. The difference between these two is that if club owners are
indeed profit maximizers they would invest in their teams success until the expected
marginal revenue from an additional win is equal to the marginal cost, while utility
12
maximizers might invest beyond this point (Zimbalist, 2005). This implies that utility
maximising will put individual success above the success of the league and that
owners will spend as aggressively on players as possible even if this leads to the
creation of dynasties, teams winning championship after championship, possibly
leading to the before mentioned Louis-Schmelling or New York Yankees paradox.
Rottenberg (1956) suggests that a league with profit maximizing owners will lead to
greater competitive balance, El Hodiri and Quirk (1971) however argue that there will
always be differences based on market size and revenue potential of teams. There
findings are confirmed in a study that concludes that in the period between 1995 and
1999 profit maximizing teams in Major League Baseballs big markets pay free
agents, players without a contract, six times more than teams small markets.
There is however one problem with dividing owners in profit or utility
maximising and that is that one cannot exist without the other. If we assume that
owners maximize profit they are supposed to maximize earnings from fan attendance
and other endorsement deals. Fan attendance however is largely based on the
relative quality of the owners team (Vrooman, 1995). This means that he has to make
sure that he fields a competitive team, in other words, a team that wins a lot of
matches and has a yearly chance to compete for a championship. Thus, he also has
to be some kind of a utility maximizer to be able to be a profit maximizer. This also
goes the other way around; if the owner wants to win as many games as possible
this means he has to invest in the best, and thus most expensive, players available.
To be able to do that he has to make a profit otherwise he will be unable to do so and
thus unable to compete.
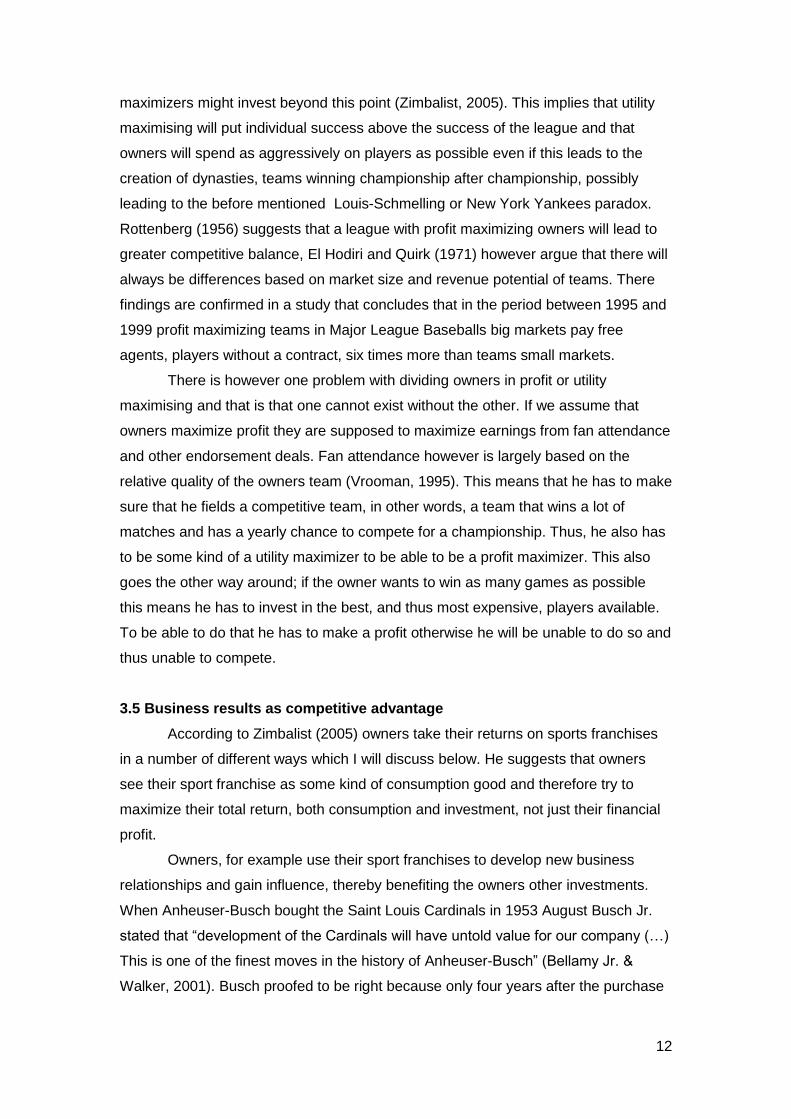
3.5 Business results as competitive advantage
According to Zimbalist (2005) owners take their returns on sports franchises
in a number of different ways which I will discuss below. He suggests that owners
see their sport franchise as some kind of consumption good and therefore try to
maximize their total return, both consumption and investment, not just their financial
profit.
Owners, for example use their sport franchises to develop new business
relationships and gain influence, thereby benefiting the owners other investments.
When Anheuser-Busch bought the Saint Louis Cardinals in 1953 August Busch Jr.
stated that “development of the Cardinals will have untold value for our company (…)
This is one of the finest moves in the history of Anheuser-Busch” (Bellamy Jr. &
Walker, 2001). Busch proofed to be right because only four years after the purchase

13
of the Cardinals Anheuser-Busch became the largest producer of beer in the United
States.
Another way owners can gain money through their sport franchise is through
the substantial capital gains sport franchises seem to generate. Using Forbes‟
valuation of baseball franchises I calculated that the average annual rate of
appreciation for franchises in Major League Baseball in the period between 2002 and
2009 was 9.79 percent. This puts it well above the return on the ownership of
common stock in this period which equals a depreciation of 2.59 percent for the
Standard & Poor‟s 500 Index through June 5th, 2009. These are however, all long
term returns and will not show up on the income statement of the sport franchise.
There are also a lot of ways for owners of franchise to obtain short term
gains. They might for example lend money to a partnership and then have that
partnership buy the team. The owner then in return receives interest payments over
the loan. An advantage of this is that these interest payments enter the team‟s
income statement as costs, lowering its book profits and thereby the amount of taxes
it has to pay. It is also common for owners to receive financial returns by benefiting
from salary, consulting fees and by hiring family members (Zimbalist, 2003). The
practice that is becoming more and more custom these days, and that is most
interesting for this thesis is how owners boost the performance of other companies in
their business empire through making favoured deals with the sport franchises they
own. When the owner makes a deal with own of his own companies he can off
course charge whatever price he wants, the money goes from one pocket into
another. In itself this does off course not give any gains because money put in the
sport franchise comes back through the other companies but there is no real money
made. Using an example shown in the book The Bottom Line by Andrew Zimbalist
this thesis will try to show you a couple of ways owners can try to use to make money
through this inter-business cooperation.
In 2001 the Chicago Cubs reported an income from local TV, radio and cable
fees of 23.6 million dollars. The other Chicago team, the White Sox, reported
revenue of 30.1 million dollars. This in itself does not seem strange but it is if you
take into account that the Cubs are by far the most popular team in the greater
Chicago area. This is clearly shown by the average viewer rating they received
during the 2001 season. The Cubs ratings were 3.8 and the White Sox‟s only 1.9.
This means that on average two times as many people watched a Cubs game as
compared to a White Sox game. In general this would off course lead to higher
incomes from commercials and fees paid by broadcasters (Gabszewicz et al, 2004).
These figures make more sense though if you know that the Cubs are owned by the

14
Tribune Cooperation, which also owns WGN, the company that broadcasts most of
the Cubs‟ games. According to website Broadcast & Cable the real value of the
Cubs‟ local media fees if sold on the open market would have been some 59 million
dollars. The Tribune Company is thus, transferring revenue away from the Cubs by
using so called transfer pricing. There is nothing illegal to this and it is often used in
the sports business, but why?
The first reason is that in a lot of professional American sports, such as
baseball, basketball and American football there is a so called revenue sharing
system. This system issues a tax on the all local media earnings a team receives.
This is done to compensate small market teams for the revenues they miss
compared to large market teams. It would take to many time to go to deep into this
scheme of revenue sharing but to give an impression, cities such as New York,
Chicago and Los Angeles are considered large markets, where as cities such as
Kansas City, Cincinnati and Milwaukee are considered small markets. Every league
has its own system to compensate these small market teams but in Major League
Baseball for example the large market teams, in 2001, had to pay 20 percent of their
reported income and in 2008 this percentage was up to 40 percent. For every dollar
not reported on the Cubs‟ income statement the owner thus saves anywhere up to 40
cents because broadcasting companies, off course, do not have to pay luxury tax to
Major League Baseball.
The second reason is that players in American sports leagues play under a
collective-bargaining agreement (CBA). Every so many years this collective
bargaining agreement has to be renegotiated and naturally owners want to keep
salaries as low as possible where players unions are off course always trying to get
the best deal for there players. By showing that there teams are hardly making any
profits owners try to persuade the unions to lower their demands. Whether or not this
works remains to be seen but when negotiating a new CBA in 2006 MLB reported
only an operating income of on average 12 million dollars per team, with large market
teams such as the New York Yankees and Chicago Cubs reporting a combined loss
of 42.1 million dollars.
Furthermore keeping profits of sporting franchise low might be useful when
baseball teams seek public funding when to improve their facilities as the New York
Yankees and the New York Mets recently did to build their new Yankee Stadium and
Citi Field ball parks and it also helps to justify higher ticket and concession prices.
15
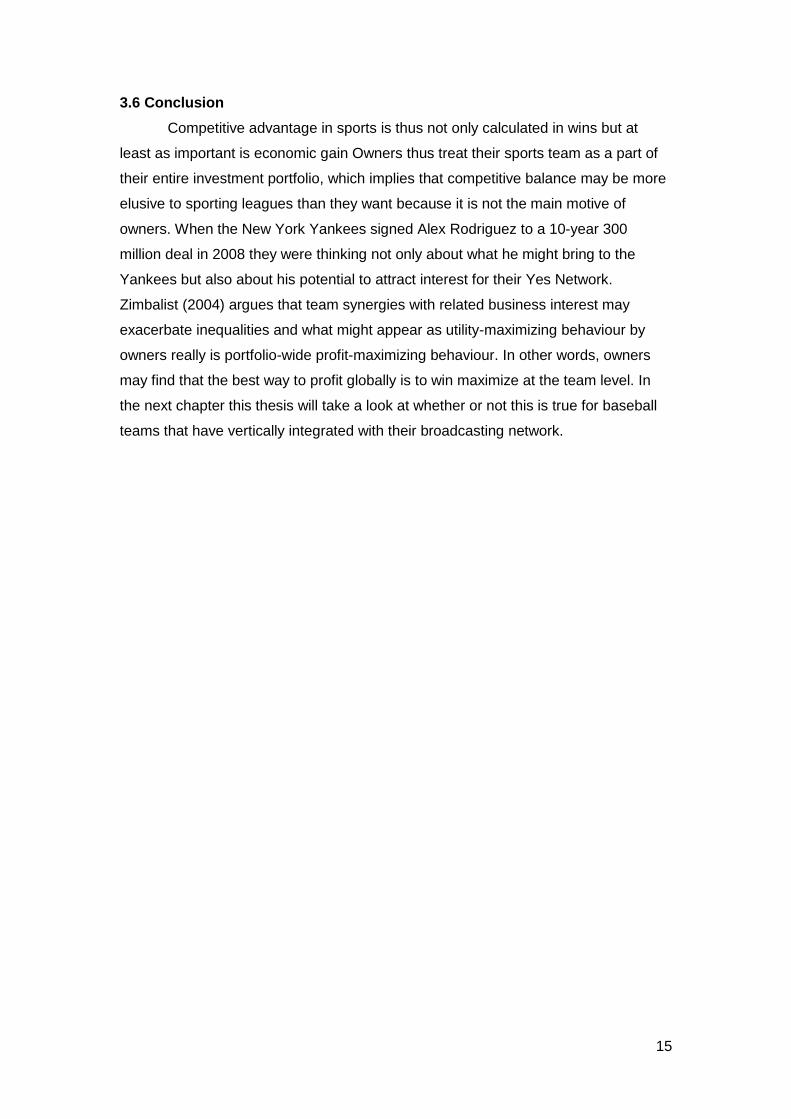
3.6 Conclusion
Competitive advantage in sports is thus not only calculated in wins but at
least as important is economic gain Owners thus treat their sports team as a part of
their entire investment portfolio, which implies that competitive balance may be more
elusive to sporting leagues than they want because it is not the main motive of
owners. When the New York Yankees signed Alex Rodriguez to a 10-year 300
million deal in 2008 they were thinking not only about what he might bring to the
Yankees but also about his potential to attract interest for their Yes Network.
Zimbalist (2004) argues that team synergies with related business interest may
exacerbate inequalities and what might appear as utility-maximizing behaviour by
owners really is portfolio-wide profit-maximizing behaviour. In other words, owners
may find that the best way to profit globally is to win maximize at the team level. In
the next chapter this thesis will take a look at whether or not this is true for baseball
teams that have vertically integrated with their broadcasting network.

16
4. Consequences of vertical integration on the competitive
balance of MLB
4.1 Introduction
In this chapter this thesis will discuss whether or not vertical integration has affected
the competitive balance in Major League Baseball over the last ten years. This period
has been chosen because during that time vertical integration with broadcasting
companies has taken a real flight. One important distinction that is made here is that
baseball organisations and broadcasting companies are considered vertically
integrated here when they are owner of their broadcasting network or are in the same
holding. We do not consider franchises that have exclusive broadcasting deals with a
regional sports network to be vertically integrated.
First this thesis will give some more details about the set up of Major League
Baseball. The Major Leagues consist of 30 teams divided in two leagues, the
National League and the American League. The National League consists of 16
teams while the American League hosts the remaining 14 teams. Both leagues are
divided in three divisions which are aligned through geographical position in the
country. Both leagues have an Eastern, Central and Western division. More details
can be found in appendix A. Within this environment there are seven franchises that
can be considered vertically integrated when using the before mentioned definition.
These franchises are:
The Boston Red Sox, which broadcasts it games through the New England Sports
Network (NESN) started in 1984, but integrated, with the Red Sox since 1999. Both
are owned by New England Sports Ventures LLC. Another team from a big city that
is vertically integrated are the New York Yankees, owned, just like their since 2000
operating broadcasting partner the Yes Network, by Yankee Global Enterprise LLC
also from New York are the New York Mets, who own their own SportsNet New York
network since 2006. Another vertically integrated team from the East coast are the
Philadelphia Phillies, who own a stake in their network Comcast SportsNet
Philadelphia, founded in 1997. The Kansas City Royals, who own a majority stake in
their broadcasting partner the Royals Sports Television Network which started in
2003 and ceased to exist in 2008 are a team from a smaller city just like the
Cleveland Indians, which are owned by the Dolan family, who also own the
SportsTime Ohio network that broadcasts the Indians games. The network started
broadcasting in 2006. The last team on the list are the Baltimore Orioles who own a

17
majority stake of 90 percent in the Mid-Atlantic Sports Network that was launched in
2005. (Walker & Bellamy, 2008)
4.2 Winning percentages 2000 – 2009
As established in the previous chapter the competitive advantage of a franchise is
not only measured in its competitive results but also in its financial results.
First the competitive results will be discussed. To do that an analysis will be made of
the teams‟ winning percentages, postseason appearances and championships over
the past ten years, and these results will be compared with the league average and
also with the results of the seven before mentioned teams in the last two decades of
the twentieth century. The data sheets on which these charts are based can be found
in appendices B.
With data obtained from www.baseball-references.com we can determine the
winning percentages over the past ten years for the 7 franchises. Winning
percentages can be defined as the number of games a team wins divided by the total
number of games played. As American baseball does not acknowledge any draws
matches are always concluded by one team winning and thus the other team losing.
The league average thus always comes to an even 0,500.
The winning percentages of the seven before mentioned teams are shown in the
chart below. This chart includes the years 2000 – 2009 and the percentages from the
starting year the teams were first vertically integrated. For the Yankees, Phillies and
Red Sox these percentage are the same because they have been vertically
integrated the whole decade.
Chart 1 Winning percentages 2000 - 2009 and since vertical integration
As the chart shows the winning percentages of 5 of the 7 franchises are above the
league average, with the Yankees, Red Sox and Phillies winning 5 – 20 percent more

18
games than the average. If we take a closer look at the winning percentages after the
franchises got vertically integrated we can see that for the New York Mets the
percentages go up even more. Where the Mets had a 0,504 percentage over the
entire decade it has a 0,531 winning percentage after vertical integration, thus after
2006. For the Cleveland Indians and the Baltimore Orioles though the winning
percentages have gone down since vertical integration. For the thesis there was also
an t-test performed on the data. Two datasets, one containing the average number of
wins per year for vertically integrated teams and one containing the same data for not
vertically integrated teams were tested against each other. Tested was whether or
not the average wins of vertically integrated teams were higher than that of not
vertically integrated team. This was done by testing the hypothesis H0 = Win VI >
Wins NVI, where VI stands for vertically integrated and NVI stands for Not Vertically
Integrated. The first test, done over the whole decade gave a t value of 1,422 which
makes us reject H0 at a 0,050 significance level. Testing shows that H0 can be
accepted at a 0,094 significance level. If data starting from 2005 is tested for the
same hypothesis it returns a t value of 1,793, which is also makes H0 rejected at a
0,050 significance level, but comes close because H0 can be accepted at 0,053
significance level. The SPSS output containing this data can be found in appendix C
4.3 Postseason 2000 – 2009
If we take a closer look at postseason appearances we see an even clearer
distinction. The post season is being played after all 162 matches of the regular
season have been played. Three division winners from both leagues and the team
with the best record not being a division winner from each league play is a playoff
format to determine the overall champion. An example of Major League Baseball‟s
postseason format is given in appendix D Getting into the postseason is very
lucrative to owner because it generates additional gate revenue and more exposure
because the team gets to play extra matches after the regular season has ended.
In the first chart below the postseason appearances for our seven integrated
franchises are given, as well as the league average and in the second chart we can
see the number of post season appearances for every team that made it to the post
season.

19
Chart 2 Postseason appearances per team 2000 - 2009
Chart 3 Division of all postseason appearances per team 2000 - 2009
These charts indicate that more than 25 percent of all postseason appearances of
the last decade have been made by these seven teams, with the Baltimore Orioles
and Kansas City Royals making none at all and thus bringing the actual number
down to 5 teams taking these places. This may not seem much but 8 places per year
have to be divided over 32 teams, which thus should give every team a 25 percent
chance to make the postseason. This chance is down to 23 percent because of these
teams taking this much places. The top three is taking even 18 of all places
available, making their chance to get to the postseason 60 percent, and bringing the
chances for the other teams down to 21 percent. The data used for this paragraph
and the next can be found in appendix E
4.4 Championships 2000 – 2009
The final statistic that has been researched concerning the last decade is the number
of championships won by the vertical integrated teams as compared to the rest of the
league. Chart 4, below, shows 5 of the 10 possible championships have been won by
9
6
32 2
0 0
2,66
0123456789
10
2000s
9
63
22
0
058
New York Yankees
Boston Red Sox
Philadelphia Phillies
Cleveland Indians
New York Mets
Baltimore Orioles
Kansas City Royals
Other teams

20
vertically integrated teams, with only three winning one or more actually and with the
other 5 going to the remaining 25 teams in the league.
Chart 4 Championships per team 2000 - 2009
To emphasise the difference even more, two of the three teams that were voted
Major Leagues Baseballs teams of the decade for the 2000‟s were vertically
integrated, these being the New York Yankees and the Boston Red Sox. The above
statistics also give you a good indication why. The Yankees finished first in winning
percentage that decade with the Red Sox coming in second and both finished first or
tied for first in postseason appearances and championships.
4.5 Historic perspective
The earlier data alone however doesn‟t yet prove that these vertically integrated
teams had gained a competitive advantage by vertically integrating, maybe all other
teams in the league just god worse at the same time leaving the door open for these
teams to step in. That is why this thesis also looks at how the performance of these
seven teams compares to their performance in the previous decades.
The graph below shows the winning percentages of the teams per decade and also
the league average (0,500).
2
2
1
0000
5
New York Yankees
Boston Red Sox
Philadelphia Phillies
Cleveland Indians
New York Mets
Baltimore Orioles
Kansas City Royals

21
Chart 5 Winning percentages per team per decade
As the graph shows the winning percentages of 4 of the 7 teams that have vertically
integrated have increased over the last decade. The Yankees have increased their
percentage by 0.049 percentage points and the Phillies even by .054. Only two
teams have over a period of 40 years seen their winning percentage dropped.
Also if we look at the number of postseason appearances we can see an increase in
the number of places taken by the seven teams over the last decade. Because the
number of postseason places has changed through the introduction of the wild card
the following chart shows the percentage of positions taken by the seven teams
instead of absolute numbers because that would create a distorted picture.
Chart 6 Postseason appearances per decade (percentages)
This chart also shows that some teams, for example the Yankees and Red Sox and
Phillies have made an improvement over their situation in previous decade. However,
the conclusion also has to be drawn that for some franchises, the Orioles and
Royals, being vertically integrated has not improved their situation on the playing
field. But, as we already concluded in the previous chapter competitive advantage is
not only measured by performance of the field, but also by the financial performance
of the franchise. This is where the next part of this chapter will focus on. An overview
of this data can be found in appendix F
0,400
0,450
0,500
0,550
0,600
0,650
1970s
1980s
1990s
2000s
0,0000,0200,0400,0600,0800,1000,1200,140
1970s
1980s
1990s
2000s

22
4.6 Financial performance
To analyse the financial performance of the franchises and the owners it would be
ideal if this thesis could study both the financial performance of the franchise itself
and that of the owner as well. Financial details about the owners are unfortunately
hard to obtain and despite several tries this study has been unable to determine how
much the owners of the seven integrated baseball teams have increased in value
since their franchises became vertically integrated. The values of the franchises on
the other hand are very easy to obtain because Forbes magazine does a yearly
ranking of the values of the MLB franchises. These values can be found in appendix
G.
In the graph below you can see how the value of the seven franchises has risen over
the past few years.
Chart 7 Team values per year 2002 - 2010 (million $)
On average the value of a Major League Baseball franchise rose more than 70
percent. The value of the seven integrated franchises rose with more than 80
percent. This is though mainly due to the fact that the value of the top 4 franchises
rose with over 105 percent. The value of the bottom three franchises only rose with a
little over 30 percent.
Another financial effect we looked at was that vertical integration allowed franchises
to substitute profits for losses by pricing products at favourable rates to other entities
within the chain. We would thus expect franchises that are vertically integrated to
have lower profits than other franchises in the league. The chart below shows the
seven teams operating income before interest, taxes, depreciation and amortization.
As the chart shows the profits of the vertically integrated teams are not really
consistent with the theory presented in the second chapter. Especially the Orioles,
Indians and Royals seem to have reported a normal operating income. When we look
at the four other franchises though their profits seem to be a little low considering
0
500
1000
1500
2000
2002 2003 2004 2005 2006 2007 2008 2009 2010
New York Yankees
Boston Red Sox
New York Mets
Philadelphia Phillies
Cleveland Indians
Baltimore Orioles
Kansas City Royals

23
their value as presented in the graph above, especially the fact that the Yankees,
Red Sox and Mets have reported several losses over the years while being in the
biggest markets in the US.
Chart 8 Profit/loss per year 2002 - 2010
It can be assumed that profits of these teams have somehow been diversified to
other divisions in the organisation. The Yes Network, affiliated with the Yankees, has
been reporting healthy profits since the day it started Fortune reported that the six-
year-old YES Network took in revenues of $340,5 million in 2006 and since then
network‟s revenues top a quarter billion and its profit margin is 60 percent.
4.7 Conclusions
It is hard to draw conclusions on the data provided in this chapter. As far as the
numbers obtained tell us four franchises, being the New York Yankees, Boston Red
Sox, New York Mets and Philadelphia Phillies have created or developed their
competitive advantage during the last decade both on the playing field as well as
financially. The Cleveland Indians have not shown real improvement but have still
fared much better than the Baltimore Orioles and the Kansas City Royals who have
been declining their play on the field during the last decade, and even before that and
have not been able to outperform the market financially either. The balance of power
in Major League Baseball has shifted, with fewer teams having a bigger impact on
the game in terms of winning as well as financially. Whether or not this is because of
the fact that they have vertically integrated with their broadcasting partner or due to
other circumstances needs further research.
-60
-40
-20
0
20
40
60
2002
2003
2004
2005
2006
2007
2008
2009
2010
24
Chapter 5 Conclusion, discussion and recommendations
5.1 Introduction
This final chapter of the thesis will give a conclusion, discussion and
recommendations based on the information presented to you in the previous
chapters.
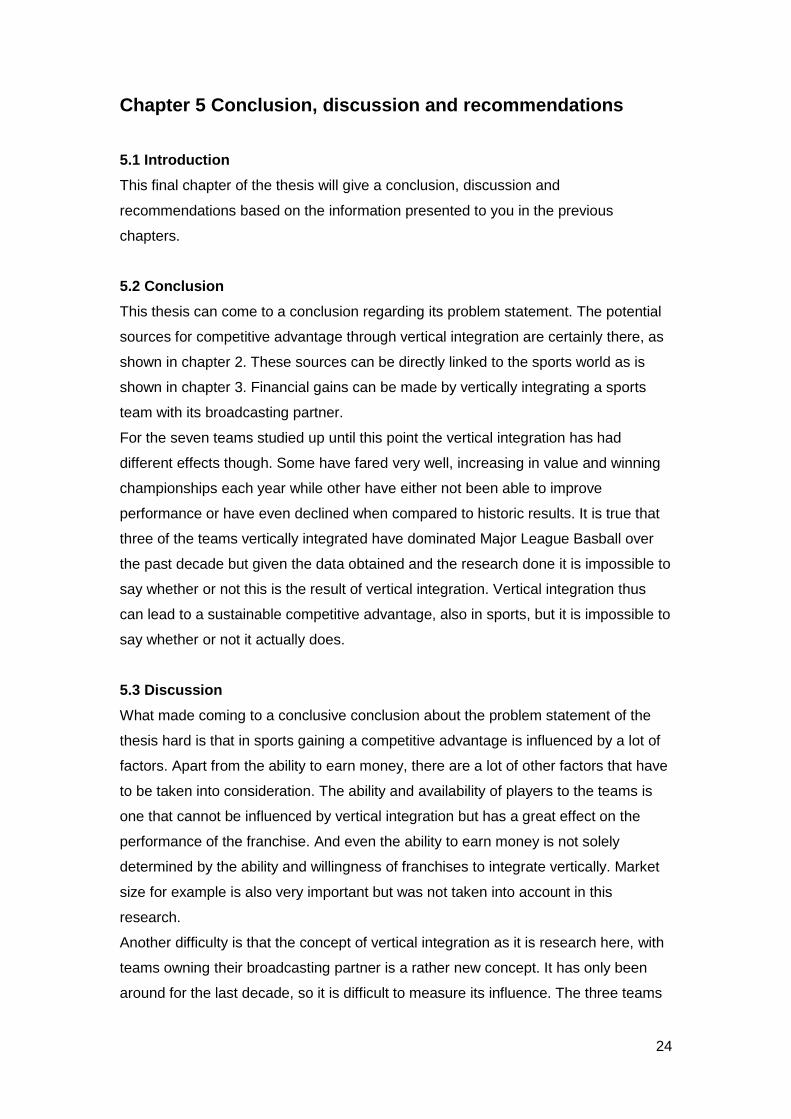
5.2 Conclusion
This thesis can come to a conclusion regarding its problem statement. The potential
sources for competitive advantage through vertical integration are certainly there, as
shown in chapter 2. These sources can be directly linked to the sports world as is
shown in chapter 3. Financial gains can be made by vertically integrating a sports
team with its broadcasting partner.
For the seven teams studied up until this point the vertical integration has had
different effects though. Some have fared very well, increasing in value and winning
championships each year while other have either not been able to improve
performance or have even declined when compared to historic results. It is true that
three of the teams vertically integrated have dominated Major League Basball over
the past decade but given the data obtained and the research done it is impossible to
say whether or not this is the result of vertical integration. Vertical integration thus
can lead to a sustainable competitive advantage, also in sports, but it is impossible to
say whether or not it actually does.
5.3 Discussion
What made coming to a conclusive conclusion about the problem statement of the
thesis hard is that in sports gaining a competitive advantage is influenced by a lot of
factors. Apart from the ability to earn money, there are a lot of other factors that have
to be taken into consideration. The ability and availability of players to the teams is
one that cannot be influenced by vertical integration but has a great effect on the
performance of the franchise. And even the ability to earn money is not solely
determined by the ability and willingness of franchises to integrate vertically. Market
size for example is also very important but was not taken into account in this
research.
Another difficulty is that the concept of vertical integration as it is research here, with
teams owning their broadcasting partner is a rather new concept. It has only been
around for the last decade, so it is difficult to measure its influence. The three teams

25
that have been vertically integrated for the whole decade have been outperforming
the market, while the teams that are not have been lagging behind. Is that because it
takes time to reap the benefits of vertical integration or does that have nothing to do
with it. What also needs to be taken into account is that all these factors influence
each other. If teams earn more money they can hire better players, which will make
them win more, which will lead to more people watching the teams matches, which
will lead to higher revenue, etcetera, etcetera, etcetera.
The final challenge for this research was that it is very hard to obtain financial
information about both the teams and their owners, which limits the research on the
influence vertical integration could have had on the financial positions of these
stakeholders.
Whether vertical integration in sports affects the competitive balance thus remains to
be seen. This research focused on Major League Baseball and found no conclusive
evidence. Fact is though that recently the „virus of vertical integration‟ has been
spreading to other sports, with European soccer being the newest development.
Teams like Real Madrid, Manchester United and FC Barcelona have recently started
their own TV networks. While these networks are still under development and for
example do not own the television broadcasting rights of the teams they are being
aired and it is not unlikely that eventually they will also obtain these rights.
5.4 Recommendations
So why do these teams do this if it is not clear if it has a positive effect on the teams‟
competitive advantage. That is one of the questions this thesis leaves unanswered.
Also this thesis focused on Major League Baseball but how do the findings relate to
other sports and what factors are of influence in that specific market. It would be
good to extend research into more branches of sports and into taking into account
more factors such as market size to really be able to determine whether or not
vertical integration does influence the competitive balance.
It will also be interesting to see how things have developed in 10 years. Has it
developed further, are more teams doing it, are other sports doing it or has it been
abandoned all together? Is it true that it takes time to gain from it, or will the
Cleveland Indians and Kansas City Royals never have any benefits from it and are
there thus other reasons that the New York Yankees, Boston Red Sox and
Philadelphia Phillies have been so dominant lately?
Finally being able to gain more insight into the financial position of the teams and
there owners might uncover other, not before thought of benefits, or drawbacks of
vertical integration.

26
References
Allen, D.W. (1991). What are transaction costs? Research in Law and
Economics. 14. pp 1-18
Arrow, K. (1969). The organization of Economic Activity. The analyses and
evaluation of public expenditure: The PPB System, Joint Economic
Committee, U.S. Government Printing Office, Washington D.C.
Barney, J. (1986) Organizational culture: Can it be a source of sustained
competitive advantage? Academy of Management Review. 11, 656-665
Barney, J (1991). Firm resources and sustained competitive advantage.
Advances in Strategic Management. 17, pp 203 - 227
Bellamy, R. & Walker, J. (2001). Baseball and television origins. The case of
the Cubs. Nine, 10, pp 31
Bellamy, R. & Walker, J. (2005). Whatever happened to synergy? A Journal of
Baseball History and Culture, 13.2, pp 19-30
Bellamy, R. & Walker, J. (2008). Center field shot: a history of baseball on
television. Bison Books
Bolch, B.W. & Damon, W.W. (1978). The depletion allowance and vertical
integration in the petroleum industry. Southern Economic Journal. 45. pp 241-
249
Burger, J. & Walters, S. (2003). Market size, pay, and performance: a general
model and application to Major League Baseball. Journal of Sports
Economics. 4. 108-125
Chandler, A.D. Jr. (1977). The visible hand: The Managerial Revolution in
American Business. Harvard University Press, Cambridge
Cheung, S.N.S. (1983). The contractual nature of the firm. Journal of Law and
Economics. 26. pp 1-21
Coase, R. H. (1937). “The nature of the Firm”. Economica, 4, pp 386-405
Crocker, K.J. (1983). Vertical integration and the strategic use of private
information. Bell Journal of Economics. 11. pp 683-693
Dow, G.K. (1987). The function of authority in transaction cost economics.
Journal of economics behavior and organization. 8. pp 13-38
El Hodiri, M. & Quirk, J. (1971). An Economic Model of a Professional Team
Sports League. Journal of Industrial Economics. 34. 297-310

27
Gabszewicz, J. J., Laussel, D. & Sonnac, N. (2004). Programming and
Advertising Competition in the Broadcasting Industry. Journal of Economics &
Management Strategy. 13. pp. 657-669.
Grossman, S.J. & Hart, O. (1986). The costs and benefits of ownership: A
theory of vertical and lateral integration. Journal of Political Economy, 94, pp
691-719
Hoehn, T. & Lancefield, D. (2003). Broadcasting and sport. Oxford review of
economic policy, 19, pp 552-568
Kerr, A. & Gladden, J. (2008). Extending the understanding of professional
team brand equity to the global marketplace. International journal of Sport
Management and Marketing, 3, pp 58-77
Levy, D. T. (1985). The transaction cost approach to vertical integration: an
empirical examination. The review of Economics and Statistics, 67, pp 438-
445
Lewis, M. (2004). Moneyball: the art of winning an unfair game. W.W. Norton
& Company
Mahony, J. T. (1992). The choice of organizational form: vertical financial
ownership versus other methods of vertical integration. Strategic Management
Journal, 8, pp 559-584
Major League Baseball divisional alignment retrieved from
http://www.billsportsmaps.com on May 20, 2010-06-11
Major League Baseball team statistics, retrieved from http://www.baseball-
almanac.com/yearmenu.shtml on March 31, 2010
Major League Baseball team values, retrieved from
http://www.forbes.com/business/sportsmoney/ on April 15, 2010
Malmgren, H.B. (1961). Information, expectations, and the theory of the firm.
Quarterly Journal of Economics. 75. pp 399-421
Neale, W. (1964). The Peculiar Economics of Professional Sports. Quarterly
Journal of Economics. 78. 1-14
Niehans, J. (1987). „Transaction costs‟, in Eatwell, John, Milgate, Murray and
Newman, Peter (eds). The New Palgrave: A Dictionary of Economics.
Macmillan, London
Perry, M. K. & Schmalensee, R. W. (1989). Chapter 4 Vertical integration:
Determinants and effects. Handbook of Industrial Organization, Elsevier.
Volume 1: pp 183-255.
28
Philips, A. & Mahoney, J. (1985). Unreasonable rules and rules of reason:
Economic aspects of vertical price-fixing. Antitrust Bulletin. 30. pp 99-115
Pitta, J. (1993). Score one for vertical integration. Forbes, 151, pp 88-89
Porter, M. E. (1985). "Competitive Advantage". The Free Press. New York,
NY.
Rottenberg, S. (1956). The baseball players market. Journal of Political
Economy. 64. 242-258
Rumelt, R & Wensley, R. (1981) In search of the market share effect.
Academy of Management Proceedings. 2-5
Sandler, T. & Cauley, J. (1980) A hierarchical theory of the firm. Scottish
Journal of Political Economy. 27. pp 17-29
Scherer, F.M. & Ross, D. Industrial Market Structure and Economic
Performance. Houghton Mifflin, Boston, MA.
Standard & Poor‟s 500 Index History retrieved from http://www.nyse.tv/s-and-
p-500-history.htm on March 15, 2010
Stucky, J. & White, D. (1993). When and when not to vertically integrate.
Sloan Management Review, 34, pp 71-83
Vrooman, J. (1995). A general theory of professional sports leagues. Southern
Economic Journal. 61. 971-990
Williamson, O.E. (1975). Markets and Hierarchies: Analysis and Antitrust
Implications. Free Press. New York, NY.
Zimbalist, A. (2003). Sport as business. Oxford Review of Economic Policy.
19. pp 503-511

29

30
Appendix A Major League Baseball Division
Figure 1 MLB Divisional alignment

31
Appendix B Wins / losses 2000 – 2009
Year
W L % PS W L % PS
2000 85 77 0,525 87 74 0,540 D, WSC
2001 82 79 0,509 95 65 0,594 D, WS
2002 93 69 0,574 103 58 0,640 D
2003 95 67 0,586 WC, LS 101 61 0,623 D, WS
2004 98 64 0,605 WC, WSC 101 61 0,623 D, LS
2005 95 67 0,586 WC* 95 67 0,586 D*
2006 86 76 0,531 97 65 0,599 D
2007 96 66 0,593 D, WSC 94 68 0,580 WC
2008 95 67 0,586 WC, LS 89 73 0,549
2009 95 67 0,586 WC 103 59 0,636 D, WSC
Decade 920 699 0,568 965 651 0,597
Year
W L % PS W L % PS
2000 94 68 0,580 WC, WS 65 97 0,401
2001 82 80 0,506 86 76 0,531
2002 75 86 0,466 80 81 0,497
2003 66 95 0,410 86 76 0,531
2004 71 91 0,438 86 76 0,531
2005 83 79 0,512 88 74 0,543
2006 97 65 0,599 D, LS 85 77 0,525
2007 88 74 0,543 89 73 0,549 D
2008 89 73 0,549 92 70 0,568 D, WSC
2009 70 92 0,432 93 69 0,574 D, WS
Decade 815 803 0,504 850 769 0,525
Year
W L % PS W L % PS
2000 74 88 0,457 77 85 0,475
2001 63 98 0,391 65 97 0,401
2002 67 95 0,414 62 100 0,383
2003 71 91 0,438 83 79 0,512
2004 78 84 0,481 58 104 0,358
2005 74 88 0,457 56 106 0,346
2006 70 92 0,432 62 100 0,383
2007 69 93 0,426 69 93 0,426
2008 68 93 0,422 75 87 0,463
2009 64 98 0,395 65 97 0,401
Decade 698 920 0,431 672 948 0,415
Year
W L % PS W L % PS
2000 90 72 0,556 80 82 0,494
2001 91 71 0,562 D 81 81 0,500 WSC
2002 74 88 0,457 83 79 0,512 WSC
2003 68 94 0,420 81 81 0,500 WSC
2004 80 82 0,494 80 82 0,494
2005 93 69 0,574 79 83 0,488 WSC
2006 78 84 0,481 82 80 0,506 WSC
2007 96 66 0,593 D, LS 76 86 0,469
2008 81 81 0,500 79 83 0,488
2009 65 97 0,401 83 79 0,512
Decade 816 804 0,504 804 816 0,496
WC = Wild card winner
LS = League Series
WS = World Series
WSC = World Series Champion
Baltimore Orioles
Rest of the league (average)Cleveland Indians
Kansas City Royals
D = Division winner
Boston Red Sox New York Yankees
New York Mets Philidelphia Phillies

32
Appendix C SPSS Output
Paired Samples Statistics
Mean N Std. Deviation Std. Error Mean
Pair 1 VI 81,9429 10 2,09654 ,66298
NVI 80,0571 10 2,09654 ,66298
Pair 2 VI > 2004 82,9714 5 2,45864 1,09954
NVI > 2004 79,0286 5 2,45864 1,09954
Paired Samples Test
Paired Differences
t df Sig. (2-tailed)
95% Confidence Interval of the
Difference
Mean Std. Deviation Std. Error Mean Lower Upper
Pair 1 VI - NVI 1,88571 4,19307 1,32597 -1,11383 4,88526 1,422 9 ,189
Pair 2 VI > 2004 – NVI > 2004 3,94286 4,91727 2,19907 -2,16275 10,04846 1,793 4 ,147
Paired Samples Correlations
N Correlation Sig.
Pair 1 VI & NVI 10 -1,000 ,000
Pair 2 VI > 2004 & NVI > 2004 5 -1,000 ,000

33
Appendix D Major League Baseball playoff format
Figure 2 MLB playoff format

34
Appendix E Postseason appearances
Postseason apperances per decade
2000s 1990s 1980s 1970s
New York Yankees 9 5 2 3
Boston Red Sox 6 4 2 1
Philadelphia Phillies 3 1 3 3
Cleveland Indians 2 5 0 0
New York Mets 2 1 2 1
Baltimore Orioles 0 2 1 5
Kansas City Royals 0 0 4 3
Other teams 58 38 30 24
Post season apperances (percentages)
2000s 1990s 1980s 1970s
New York Yankees 0,113 0,089 0,045 0,075
Boston Red Sox 0,075 0,071 0,045 0,025
Philadelphia Phillies 0,038 0,018 0,068 0,075
Cleveland Indians 0,025 0,089 0,000 0,000
New York Mets 0,025 0,018 0,045 0,025
Baltimore Orioles 0,000 0,036 0,023 0,125
Kansas City Royals 0,000 0,000 0,091 0,075
Other teams 0,725 0,679 0,682 0,600
World Series Wins per decade
2000s 1990s 1980s 1970s
New York Yankees 2 3 0 2
Boston Red Sox 2 0 0 0
Philadelphia Phillies 1 0 1 0
Cleveland Indians 0 0 0 0
New York Mets 0 0 1 0
Baltimore Orioles 0 0 1 1
Kansas City Royals 0 0 1 0
Other teams 5

35
Appendix F Historic overview
Teams
WP WSC WS POA WP WSC WS POA WP WSC WS POA WP WSC WS POA
Arizona Diamondbacks 0,497 1 1 3 0,509 0 0 1
Atlanta Braves 0,551 0 0 6 0,595 1 5 8 0,457 0 0 1 0,451 0 0 0
Baltimore Orioles 0,431 0 0 0 0,512 0 0 2 0,512 1 1 1 0,590 1 3 5
Boston Red Sox 0,568 2 2 6 0,523 0 0 4 0,525 0 1 2 0,556 0 1 1
Chicago Cubs 0,499 0 0 3 0,476 0 0 1 0,472 0 0 2 0,487 0 0 0
Chicago White Sox 0,529 1 1 3 0,526 0 0 1 0,486 0 0 1 0,469 0 0 0
Cincinnati Reds 0,464 0 0 0 0,521 1 1 2 0,499 0 0 0 0,592 2 4 6
Cleveland Indians 0,504 0 0 2 0,529 0 2 5 0,455 0 0 0 0,460 0 0 0
Colorado Rockies 0,474 0 1 2 0,478 0 0 1
Detroit Tigers 0,450 0 1 1 0,452 0 0 0 0,536 1 1 2 0,490 0 0 1
Florida Marlins 0,501 1 1 1 0,442 1 1 1
Houston Astros 0,514 0 1 3 0,529 0 0 3 0,522 0 0 3 0,495 0 0 0
Kansas City Royals 0,415 0 0 0 0,467 0 0 0 0,529 1 2 4 0,528 0 0 3
Los Angeles Angels 0,556 1 1 6 0,475 0 0 0 0,500 0 0 2 0,484 0 0 1
Los Angeles Dodgers 0,532 0 0 4 0,513 0 0 2 0,527 2 2 4 0,565 0 3 3
Milwaukee Brewers 0,458 0 0 1 0,478 0 0 0 0,514 0 1 2 0,458 0 0 0
Minnesota Twins 0,532 0 0 5 0,463 1 1 1 0,468 1 1 1 0,506 0 0 1
New York Mets 0,504 0 1 2 0,494 0 0 1 0,523 1 1 2 0,473 0 1 1
New York Yankees 0,597 2 4 9 0,548 3 3 5 0,547 0 1 2 0,555 2 3 3
Oakland Athletics 0,550 0 0 5 0,501 0 1 2 0,512 1 2 3 0,527 3 3 5
Philadelphia Phillies 0,525 1 2 3 0,471 0 1 1 0,501 1 2 3 0,509 0 0 3
Pittsburgh Pirates 0,421 0 0 0 0,498 0 0 3 0,470 0 0 0 0,569 2 2 6
San Diego Padres 0,474 0 0 2 0,487 0 1 2 0,486 0 1 1 0,415 0 0 0
San Francisco Giants 0,529 0 1 3 0,508 0 0 1 0,493 0 1 2 0,493 0 0 1
Seattle Mariners 0,517 0 0 2 0,493 0 0 2 0,430 0 0 0 0,386 0 0 0
St. Louis Cardinals 0,557 1 2 7 0,488 0 0 1 0,529 1 3 3 0,496 0 0 0
Tampa Bay Rays 0,429 0 1 1 0,407 0 0 0
Texas Rangers 0,479 0 0 0 0,519 0 0 3 0,462 0 0 0 0,465 0 0 0
Toronto Blue Jays 0,497 0 0 0 0,515 2 2 3 0,523 0 0 2 0,343 0 0 0
Washington Nationals 0,439 0 0 0 0,500 0 0 0 0,519 0 0 1 0,465 0 0 0
WP = Winning percentage
WSC = World series champions
WS = World series appearance
POA = Playoff appearances
Not available
Not available
Not available
Not available
Not available Not available
2000s 1990s 1980s 1970s
Not available Not available

36
Appendix G Franchise values
Values in million $ 2002 2003 2004 2005 2006 2007 2008 2009 2010
New York Yankees 730 849 832 950 1.026 1.200 1.306 1.500 1.600
Boston Red Sox 426 488 533 563 617 724 816 833 870
New York Mets 482 498 442 505 604 736 824 912 858
Los Angeles Dodgers 435 449 399 424 482 632 694 722 727
Chicago Cubs 287 335 358 398 448 592 642 700 726
Philadelphia Phillies 231 239 281 392 424 457 481 496 537
Los Angeles Angels of Anaheim 195 225 241 294 368 431 500 509 521
St Louis Cardinals 271 308 314 370 429 460 484 486 488
San Francisco Giants 355 382 368 381 410 459 494 471 483
Chicago White Sox 223 233 248 262 315 381 443 450 466
Houston Astros 337 327 320 357 416 442 463 445 453
Texas Rangers 356 332 306 326 353 365 412 405 451
Atlanta Braves 424 423 374 382 405 458 497 446 450
Seattle Mariners 373 385 396 415 428 436 466 426 439
San Diego Padres 207 226 265 329 354 367 385 401 408
Minnesota Twins 127 148 168 178 216 288 328 356 405
Cleveland Indians 360 331 292 319 352 364 417 399 391
Washington Nationals 108 113 145 310 440 447 460 406 387
Colorado Rockies 347 304 285 290 298 317 371 373 384
Arizona Diamondbacks 280 269 276 286 305 339 379 390 379
Baltimore Orioles 319 310 296 341 359 395 398 400 376
Detroit Tigers 262 237 235 239 292 357 407 371 375
Milwaukee Brewers 238 206 174 208 235 287 331 347 351
Kansas City Royals 152 153 171 187 239 282 301 314 341
Cincinnati Reds 204 223 245 255 274 307 337 342 331
Toronto Blue Jays 182 166 169 214 286 344 352 353 326
Florida Marlins 137 136 172 206 226 244 256 277 317
Tampa Bay Rays 142 145 152 176 209 267 290 320 316
Oakland Athletics 157 172 186 185 234 292 323 319 295
Pittsburgh Pirates 242 224 217 218 250 274 292 288 289

37
Appendix H Profit / loss values
Revenue in million $ 2002 2003 2004 2005 2006 2007 2008 2009 2010
New York Yankees 18,7 16,1 -26,3 -37,1 -50 -25,2 -47,3 -3,7 24,9
Boston Red Sox -11,4 -2,1 11,4 -11,3 -18,5 19,5 -19,1 25,7 40
New York Mets 14,3 11,6 -19,3 -11,2 -16,1 24,4 32,9 23,5 26,2
Los Angeles Dodgers -29,6 -25 -19,1 -7,4 13,4 27,5 20 16,5 33,1
Chicago Cubs 7,9 11,9 8,3 11,4 7,9 22,2 21,4 29,7 25,5
Philadelphia Phillies 2,6 -11,9 -12,5 6,1 14,8 11,3 14,3 17 14,5
Los Angeles Angels of Anaheim 5,7 -3,7 -5,5 -30 -2,6 11,5 15,2 10,3 12
St Louis Cardinals -5,1 -2 -11,1 -3,9 7,9 14 21,5 16,3 12,8
San Francisco Giants 16,8 13,9 0,7 6,9 11,2 18,5 19,9 6,6 23,5
Chicago White Sox -3,8 1,2 12,8 8,1 21,7 19,5 30,6 27,2 26,4
Houston Astros 4,1 -0,8 -1,9 9,6 30,2 18,4 20,4 3,8 7,1
Texas Rangers -6,5 -24,5 -28,5 2,9 24,7 11,2 17,2 24,5 4,7
Atlanta Braves 9,5 9,5 -0,3 15,4 27,6 14,8 28,1 13,8 1,5
Seattle Mariners 14,1 23,3 17 10,8 7,3 21,5 10,1 4,7 10,5
San Diego Padres 5,7 4,6 4,9 17,1 13 5,2 23,6 19,5 32,1
Minnesota Twins 3,6 0,4 -7,1 -0,5 7 14,8 23,8 29,4 25
Cleveland Indians -3,6 -1 10,4 27,2 34,6 24,9 29,2 42,6 10,1
Washington Nationals -3,4 -9,1 -8,3 -3 27,9 19,5 43,7 22,4 33,5
Colorado Rockies 6,7 7,1 -6,3 -7,8 16,3 23,9 26,2 26,8 20,1
Arizona Diamondbacks -3,9 -22,2 -15,2 -18,7 21,8 6,4 5,9 3,9 -0,6
Baltimore Orioles 3,2 12,4 9,1 34 21 17,1 7,7 17,4 19,4
Detroit Tigers 12,3 -5,3 0,3 7,9 3,5 8,7 4,6 22,9 -29,5
Milwaukee Brewers 18,8 -6,1 5,1 24,2 22,4 20,8 19,2 -26,3 10,2
Kansas City Royals 2,2 -11,2 6,6 3 20,8 8,4 7,4 9 8,9
Cincinnati Reds 4,3 4,9 11,7 22,6 17,9 22,4 19,3 3 17,8
Toronto Blue Jays -20,6 -23,9 0 7,8 29,7 11 -1,8 11,8 13,1
Florida Marlins 1,4 -14 -11,6 3 -11,9 43,3 35,6 43,7 46,1
Tampa Bay Rays -6,1 1,4 7,5 27,2 20,3 20,2 29,7 15,9 15,7
Oakland Athletics 6,8 6,6 11,2 5,9 16 14,5 15,4 26,2 22,1
Pittsburgh Pirates 9,5 -1,6 -0,3 12,2 21,9 25,3 17,6 17 15,6
League average 2,5 -1,3 -1,9 4,4 12,1 16,5 16,4 16,7 17,4