Embed Size (px)
Citation preview

Vertical Integration and the Market for Broadcast and Cable Television Programming
Austan Goolsbee Robert P. Gwinn Professor of Economics
University of Chicago, Graduate School of Business, American Bar Foundation and National Bureau of Economic Research
April 2007
________________________________________ Acknowledgements: This research was commissioned by the Federal Communications Commission but they are not responsible for its content. The results reflect the findings of the author alone. I would like to thank Rafael Kuhn and Jennifer Li for outstanding research assistance and Robert Gertner, Matthew Gentzkow, Luis Garicano, Betsey Stevenson, Joel Waldfogel, Justin Wolfers and seminar participants at the University of Pennsylvania for helpful comments.
Summary
Historically, regulators in the United States have been concerned about the potential for vertically integrated television entertainment companies—broadcast networks and cable systems which also produce content—to exclude rival programming or to otherwise exploit market power. Successive waves of deregulation and media mergers, however, have generated a tremendous amount of vertical integration in the television industry.
This paper examines the evidence on vertical integration in television programming. It documents its prevalence and presents findings relating to whether integrated producers systematically discriminate against independent content in favor of their own content. It focuses separately on two parts of the video market: primetime broadcast programming and cable network carriage.
For broadcast networks, the vertical integration issue relates to the major networks (e.g., CBS) owning the programs they decide to broadcast during primetime (each network owner also houses at least one major television production unit). The paper documents an extensive amount of vertical integration during primetime. That alone does not answer, however, whether broadcast networks are biased against independent shows. It might be more efficient for networks to make their own shows.
Matching the data on show ownership to data from Nielsen on ratings and advertising rates, the paper devises a market test for bias by testing whether broadcast networks seem to apply an easier standard for carrying their own shows than for carrying independent programming. The results indicate that they do have a significantly lower standard for their own programs. Independent programs need to generate something like 15 to 20 percent higher advertising revenues than comparable in-house programs to get on the air. But the tougher standard does not apply to fully independent programs which are treated almost exactly like the programs that they own. The higher standard seems to apply only to independent shows created by the owners of rival broadcast networks.
For cable, the question of vertical integration relates to the decision of cable systems to carry networks that they own. The data suggest that vertical integration has been getting less prevalent over time. The previous literature has found that cable systems are more likely to carry their own networks but there is considerable debate, though, about whether this results from efficiencies or from market power.
Although the data on cable networks are not sufficient to allow direct market tests like those used on the broadcast networks, they do suggest there is little evidence that vertically integrated networks enjoy major efficiencies over independent rivals on either the revenue or the cost side.
Looking at decisions of cable systems regarding what channels to carry shows that carriage rates for vertically integrated channels are higher on systems that own the given network but only in places where there is not much competition from DBS. This suggests, potentially, a problem for an efficiency based explanation for the behavior. These results form the basis of a potential method to be used in determining when a given market faces sufficient pressure that it be treated as competitive.
2

1. Introduction
Historically, regulators in the United States have been concerned about the
potential for vertically integrated television entertainment companies—broadcast
networks and cable systems which also produce content—to exclude rival programming
or to otherwise exploit market power. Successive waves of deregulation and media
mergers, however, have generated a tremendous amount of vertical integration in the
television industry.
This paper examines the evidence on vertical integration in television
programming. It documents its prevalence and presents findings relating to whether
integrated producers systematically discriminate against independent content in favor of
their own content. It focuses separately on two parts of the video market: primetime
broadcast programming and cable network carriage.
These two types of television have rather distinct kinds of vertical relationships.
For broadcast networks, the concern is over the networks owning the shows they
broadcast and the possibility that they might exclude independent programming. Explicit
legal restrictions on the ability of the networks to take financial stakes in the shows
(known as the financial interest and syndication or fin-syn rules) limited the networks'
ability to vertically integrate before 1995, when the rules were abandoned. At that point,
however, there was an immediate increase in ownership stakes by the broadcast networks
and, consequently, in the concern over what such integration implies for the ability of
independent programming to get on the air.
For cable television, the vertical integration concerns the distribution through
cable systems (and now through DBS systems) of cable networks (e.g., MTV).
3

Approaching 90% of the country subscribes to some form of multi-channel video today.
These distribution firms frequently also own some of the networks that they broadcast
over their distribution systems—like Time Warner owning the Turner networks it carries
on its cable systems. There are many public concerns that a vertically integrated media
company might make life difficult for independent cable network operators and try to
promote their own networks, instead.
This paper will document and explore the vertical relationships in these two parts
of the television programming marketplace.
At the outset, though, it is vital to consider the difference between the existence of
vertical integration in television programming and the rationale for it. To the extent
there is an existing literature examining some of these questions, it tends to have a hard
time answering the the nagging question of why such vertical relationships exist.
One view holds that vertical integration and foreclosing/self-promoting behavior
is a strategic move on the part of powerful monopolies and is anti-competitive in nature.
The other view, espoused by opponents of regulating such relationships, argue that
vertical integration comes about because it is more efficient, that a combined entity is
better able to create shows or networks that people will watch or to save money in
producing the shows or in some other way generate a synergy. In this view, if it is hard
for an independent to get its programming on the air, that is only natural. It need not
reflect monopoly power. Indeed, there are some analysts that argue it almost never
makes strategic sense for a company with market power in the distribution system to
favor its own product in a way that was anti-competitive (the so called 'Chicago School'
view).
4
This basic dichotomy oversimplifies the situation, of course. There are many
other, more subtle explanations for vertical integration and for self-promoting behavior.
An interested reader should consult survey discussions on the topic such as Motta (2004)
or Rey and Tirole (2005). But the discussion of both segments of the television market
will start from the premise that when asking about the fate of independent programming
in the market, we need to look beyond simply the basic statistics of how many there are
to see if there is evidence that the distributors are acting in an anti-competitive way.
One premise underlying the economics of vertical integration is the idea of
competition. If the self-promoting activities are strategic in nature and result from a
monopsonist exploiting their position, then as that market power falls, their ability to act
nefariously should be reduced. There has been considerable discussion since the
deregulation of the 1990s that almost every aspect of the television business has become
much more competitive than it was in years past. For broadcast networks, there have
been new entrants and there has been a major shift of viewers toward cable networks.
For cable systems, there is now significant direct competition from Direct Broadcast
Satellite (DBS) providers.
With this rise of competition as the backdrop, this study will reexamine the
evidence regarding vertical integration in primetime broadcast television and on
cable/DBS systems.
2. TELEVISION PROGRAMMING ON BROADCAST NETWORKS
2.1 Historical Background
5
Starting in 1970, the financial interest and syndication rules issued by the FCC
explicitly restricted the ability of major networks to take ownership stakes in various
types of programming. With the rise of cable networks, the expansion in the number of
broadcast networks, and the skepticism over whether it would really be in the interest of
broadcast networks to exclude rivals' programming, the fin-syn rules were abandoned.
Not surprisingly, there was an immediate increase in the vertical ownership of
broadcast programming. Caves (2005) documents that the networks' full or partial
ownerships stakes in the shows they broadcast rose by two thirds from 1995 to 1998—
from 28% to 46%.
This occurred in an era of considerable consolidation of media companies into
major conglomerates that combine multiple types of media and make vertical ties much
more likely. A company like Disney now owns film studios, several TV production
entities, a major broadcast network, and radio stations not to mention retail stores, theme
parks and many other properties. The owners of the other major broadcast networks—
Newscorp, CBS Corporation, GE, and Time-Warner—each have a massive number of
different media businesses involved in content creation and distribution.
There is, without question, a considerable interest in the operation of the
primetime programming choices of the major broadcast networks. It is important to note
at the outset, however, that the importance of this group has become much smaller over
time and that the degree of market power the big three networks once enjoyed in the
market for television programming has substantially diminished from its peak. As Caves
(2005) observes, in the 1970s the big three networks accounted for around 90 percent of
6
the prime-time viewing in the U.S. and already by 1996-1997, it was less than half and
has continued declining since then.
That said, they still remain extremely powerful television entities with the biggest
potential markets and it is worthwhile examining their behavior relating to the shows they
own and the shows they do not own.
2.2 Data
To examine the evolution of prime-time programming on broadcast networks, this
paper turns to several data sources. First, the International Television and Video
Almanacs , 2000-2005 (Quigley, 2000-2005) gives the ownership for major prime-time
shows each year from the 2000-2001 season to the 2004-2005 season.
The owners are matched to networks from publicly available industry sources in
cases where they are not obvious. Clearly when an NBC show's owner is
NBC/Universal, it is vertically integrated. There are other content creators, however, like
Spelling Television or Greenblatt-Janollari whose vertical integration is not as
immediately clear (CBS and Fox, respectively).
The data do not give the actual percentages owned by the various groups—many
shows have more than one owner—so the results will not examine the impact of minority
versus majority ownership. Following the previous literature, the regression results
below will not examine news programs, sports programs, movies or special programs.
Second, I match the Almanac data to data from the Nielsen Television Index
Report. These data give ratings and advertising rates (CPM) as well as the demographics
of the shows' viewers. These two data sources yield a sample of matches that tends to
7

have a good representation of the major shows, though relatively light representation of
very short-lived (less than a full season) shows. All told there are more than 200
different shows with between one and five years of data each.
I also take a completely independent sample of ownership using a different
methodology and data source to get more current information. For a single two week
period in late February and early March of 2007, this takes all shows scheduled to be
aired that week and uses the Internet Movie Database Television site to examine
ownership. I do not have Nielsen data to match to the IMDB sample, just the ownership
data. Data in Kagan World Media (2005) provides a third useful consistency check on
the Almanac data.
2.3 Basic Evidence on Vertical Integration of Broadcast Networks and Shows
The summary statistics for the extent of vertical integration in primetime
television are presented in tables 1 through 4.
Table 1 takes the matched data sample from the Almanac and the Nielsen Index
for the seasons 2000-2001 through 2004-2005 and documents the share of shows on a
given network that were produced by that network, i.e., the share that are vertically
integrated. Note these percentages are the percentage of self-owned shows (as opposed to
the amount of time).1
There was fairly substantial variation across the networks in this period. CBS was
the most vertically integrated with, in most years, around 60-85% of CBS shows having
1 And it is the share of shows on these networks that also satisfy the previously listed criteria such as being in the Television Almanac and matching to the Nielsen Television Index. In practice this excludes much of the short-lived programming. This measure also does not take account of the fact that some programs run more frequently or are longer than other programs. All shows are treated the same for computational purposes here.
8
at least partial ownership from a Viacom owned production company (e.g., Paramount).
NBC was the least, averaging less than 40% in most years (their purchase of Universal
took place in the last season of the table causing the share to jump substantially).
Looking across primetime as a whole, the share of vertically integrated shows did
not change much over these five years. The share hovers in the 55-59% range except for
the one 65% year in 2002-03.
For an alternative calculation of this concept, table 2 presents computations from
Kagan World Media's (2005) The Economics of Primetime Television which provide the
share of total minutes during primetime that were of vertically integrated content. This
excludes sports, movies and special programming and is based on the debut schedule.
Note this is a time based measure rather than a show based measure so a one hour show
counts for double a half-hour show, and so on. Despite being different measures of
integration, the ownership shares are fairly consistent across the two samples. The Kagan
data also shows CBS to be the most integrated and NBC to be the least.
Table 3 averages over the entire Almanac sample to compute an average for each
network and then looks at the shows that are not vertically integrated. The share of truly
independent programming—programming that is not owned by any company that also
owns a broadcast network—is fairly constant across the networks at around 18%. The
rest of the shows, around one quarter, are shows made by one broadcast network
affiliated company but shown on a different network (like the show The O.C. which was
made by Warner Brothers but broadcast on Fox). In this sample, Fox had the lowest use
of other network created programs in the sample (less than 7%) while the WB had the
highest (over 40%).
9

Finally, table 4 updates the numbers to 2007 using the information from the
Internet Movie Database Television site for a two week period in late February/early
March 2007. This table again computes the share of shows (not time) on primetime
television that were vertically integrated for each broadcast network.
One change from the earlier period to 2007 is that the two smaller networks—
UPN and the WB—merged to form a single network, the CW. Since the CW is partly
owned by Time-Warner and CBS (itself spun off from Viacom with a number of
production properties in late 2005), the chance that content on the combined network
would be produced by some unit within either of those two companies is obviously
higher than for either UPN or the WB alone.
The data show that the CW network has the highest vertical integration, at over
80% and all the other networks are in the 61-69% range. The average across all shows
was just short of 68% and the share of true independent programming only around 13%.
These may indicate an increase in the vertical integration share since the earlier data of
tables 1 and 3 but not necessarily. The sampling methodologies differ so they may not be
directly comparable. Tables 1 and 3 look only at shows that appear in the Television
Almanac and can be matched to the Nielsen report. Table 4 takes a specific two week
period and asks who owns each of the shows broadcast during that time.
However one chooses to measure vertical integration, however, the data document
that a large fraction, typically the majority of what is on any broadcast network during
primetime, was made "in house."
A different way to look at the question is to think about the shares for the
production side rather than the broadcast/distribution side. The top panel of tables 4 and
10

5 look at what share of the primetime shows owned/produced by the company that owns
a broadcast network actually end up being broadcast on that company's network. Table 4
looks at the 2000-2001 season through the 2004-2005 season. Table 5 looks at the period
in early 2007.
In the longer period, more than 85% of the primetime television programming
created by Disney (e.g., Touchstone Television, Buena Vista Television, ABC and so on)
appears on ABC. Since Viacom owns both CBS and part of UPN, its row presents two
alternative measures. Almost 58% of Viacom owned shows appear on CBS. Around
77% of Viacom owned shows appear on either CBS or UPN.
A relevant reference point for comparison is presented in the lower panel of each
table. This gives the ultimate broadcast network for independently produced programs—
those with no affiliation with a network company at all. In both tables, the distribution of
these independent shows is fairly evenly spread across the networks. Compared to these
independent shows, it is very clear that the output from in-house television production is
overwhelmingly more likely to show up on its own network than the independents' is.
Taken together, tables 1-6 suggest that primetime broadcast television is a heavily
vertically integrated endeavor and one can see that the life of an independent producer of
programming is likely to be rather difficult.
The prevalence of this behavior, however, is not the same as explaining why it
exists. While some industry participants argue that the data indicate powerful
conglomerates are exerting monopsony power or otherwise acting in an anti-competitive
manner, others argue that the shows are vertically integrated because that is the most
efficient or most natural way to structure the business (see the discussion in Caves, 2005).
11
Trying to answer why there is so much vertical integration is a great deal more
difficult than documenting its existence. There are some subtle ways to test, however,
using readily available data.
2.4 Testing for Network Bias Against Independent Shows
The question at hand is whether the broadcast networks discriminate against
shows they do not have an ownership stake in. Certainly the industry anecdotes
discussed in Caves (2005) suggest that network executives have been known to issue
what sound very much like ultimatums—"give us an ownership stake or we will not pick
up this show," and so on. The issue also comes up in the work of Barth (2003) on
renewal rates of vertically integrated shows.
But the efficiency view and the discrimination view, while both predicting
vertical integration, differ significantly in their predictions for other parts of the market
very much along the lines of the market based tests for discrimination in labor economics
first outlined by Nobel Laureate Gary Becker (1971; 1993).
If the efficiency view is what drives things, then the vertically integrated shows
should be better, in some sense, than the comparable independent shows. If
discrimination, then the vertically integrated shows should be worse.
This is an important point to understand. If the broadcast network is
systematically favoring its own shows over independent ones, then they should be
holding the independent shows to a higher standard and so, for the same time slot and the
same observable characteristics, we would expect to see broadcast network's integrated
12
shows performing worse than independents' do—because the marginal independent
shows never make it on the air while the marginal vertically integrated ones do.
The key for actually conducting this test is that we have data at the level of the
broadcast network and we can run a regression trying to explain their behavior. The
network trying to maximize its direct profit should, on the margin, choose between their
own shows and the shows of others such that the impact on profit is the same. I will
interpret this as being the decision of whether the observable measures of profit seem to
differ on the margin depending on who made the show, controlling for the time slot and
year of the show.
In this spirit, table 7 turns to the Nielsen data on all of the shows from the 2000-
2005 seasons and presents a series of multivariate regressions to test for evidence of
discrimination against independent programming. There are around 500 show-year
observations.
Each regression includes the dummy variables for the time slot (i.e., day x start
time), the network and the year as well as a dummy variable for whether the show is
vertically integrated with the network. The standard errors are clustered at the level of
the show since there is likely to be serial correlation across time for each show. The
regressions ask whether, on the margin, the vertically integrated shows on the air do
worse than the non-integrated shows.
Column (1) starts by looking at the log number of households watching the show.
The results suggest that on the margin, there is little evidence that vertically integrated
shows differ from non-vertically integrated shows in the same time slot. Just as many
people watch one as watch the other. There is no evidence of bias here.
13

But the number of viewers isn't what a broadcast network ought to be maximizing
if they are trying to make money. Column (2) looks at a potentially more appropriate
measure—the show's total advertising revenue. This is computed as the log of
advertising CPM rates (for a 30 second advertisement) times the number of households
viewing the show. Without a measure of costs, this measure of revenue is the closest
thing we have to short-run profits. These do not take account of the potential for
syndication, as will be relevant below. These regressions purposely exclude various
types of programs where cost differences would be particularly problematic such as news
programs which are almost always vertically integrated but also have a lower cost of
production than scripted programs thus could potentially skew the results.
The results in column (2) rather clearly point to the vertically integrated shows
performing worse than the independent ones. The independent shows are being held to a
higher standard. The integrated shows in the same time slot and the same season must
have 16% greater advertising revenues to get on the air. Notice that the result in column
(1) suggests this is being driven entirely by the rate advertisers are paying for the shows.
The number of viewers was not affected.
Column (3) repeats the regression of column (2) but adds a series of demographic
variables about the nature of the audience (from the Nielsen data)—the share of male
viewers, the share of eight different age groups, the share that is black, the share that
owns a VCR, the share that has each of three different household sizes, the share that has
each of three different educational attainment levels and has a high income. The results
show that the higher standard that the independent shows are held to is not simply a
reflection of the audiences being systematically different for independent shows relative
14
to vertically integrated ones. Even with these controls for the type of audience, the
advertising revenues on the margin are significantly lower for the vertically integrated
shows, consistent with them being held to a lower standard than the independents.
Caves (2005) has noted that advertisers value more than just the size and even the
demographics of the audience. As he says, advertisers pay significantly higher
advertising costs than a shows' observable audience characteristics would predict when
the shows are considered to be of higher quality (presumably because advertisers believe
that associating their brands with the better shows will lead to more purchases). So it is
not unheard of to find advertising differences across shows with the same demogrpahics
and audience sizes.
Column (4) breaks out the independent/non-vertically integrated programs into
two distinct groups. The first comprises truly independent programming—primetime
shows created and owned by entities that are not affiliated with any broadcast network.
The other comprises shows created by a company that owns a rival broadcast network.
The results from this regression show that the coefficient for the fully independent
programs is, in fact, almost identical to the coefficient on the vertically integrated shows
(the comparison group is the rival network created shows). On the margin the vertically
integrated shows have 25% less advertising revenue and the fully independent programs
23% less than independent programs made by rival networks. The networks appear to be
applying a higher advertising standard only to the shows created by their rival networks,
not by fully independent entities. They appear to treat the true independents the same
way they treat their in-house product.
15

This result is especially interesting in that it may suggest that while the difficulty
of getting independent shows on the air is great, that may be more attributable to the high
risk and high costs of producing programming and the escalation of such costs over time
than to the strategic squeezing of independent producers by the broadcast networks. It
also suggests that a cost based efficiency explanation—that networks apply a lower
revenue standard to their own programs because they can make them more cheaply
(either from eliminating double marginalization considerations or from better synergies
of some kind)—probably will not suffice since the truly independent creators of content
should not enjoy those efficiencies.
This is not to say that the picture is rosy for the true independents, by any means.
There is no information in these data about syndication profits from shows and the
differential coefficients of the fully independent producers relative to the rival networks
may simply reflect that the rival networks have more bargaining power over syndication
revenue than the fully independent producers do. In other words, if a broadcaster can't
get part of the syndication profits from the show's producer, they may require that show
to generate higher advertising revenue to put it on the air. That would look like the
pattern found in these results but would also mean that independent producers are in
weak bargaining positions.
Unfortunately, there is not publicly available information about the syndication
contracts of shows and who gets paid what. One suggestive piece of evidence comes
from column (5) where the impact of vertical integration and full independence are
allowed to vary for shows that have been on the air for six years or less (where
syndication is not certain) versus those that have been on the air for longer than six years
16
(where syndication is very likely if not already in existence). The results show that for
the young programs the standards for what gets on the air are more similar (the
coefficient on the young programs is derived by adding the two coefficients together)—
about 13% lower for the vertically integrated shows and 12% for the fully independent
ones relative to rival network's shows—than they are for the older programs whose
differentials are around 40 to 50%. The fact that the different standard for outside
network programming varies by the age of the show does not necessarily imply that it is
driven by syndication profits but it is consistent with that idea.
Taken together the evidence on broadcast television indicates a high degree of
vertical integration across all the networks and a small role for true independent
producers. It does not, however, document discrimination of broadcast networks against
such programming in favor of their own shows. There is only evidence of this kind of
bias against the shows created by other rival broadcast networks. Such programs need to
earn significantly higher advertising revenues than a comparable independent or in house
program to get on the air.
3. TELEVISION PROGRAMMING ON CABLE NETWORKS
3.1 Background
The other major outlets for television programming are, of course, cable and
satellite networks. These networks have increased in importance and quantity over time
and now account for the majority of television watched in the country. The last FCC
17

competition report indicates there were more than 530 such networks in 2005 (FCC,
2006).
Cable networks have a different type of vertical integration issue than do
broadcast networks. Namely, there are several major owners of cable systems such as
Time-Warner that also own several of the cable networks that appear on their cable
systems.
This type of vertical integration between content and distribution has generated a
history of both regulatory concern at the FCC and an academic literature studying the
subject. At various times the FCC has had restrictions regarding vertically integrated
cable systems such as restrictions on what share of channels can be owned by the parent
company and on the terms that carriage deals can take for internal versus external
networks. Issues of vertical integration have also been important in FCC merger
evaluations such as Time-Warner/Turner and Newscorp/DirecTV.
Some of these issues of vertical integration were more problematic when cable
systems had low channel capacity and the system owner's choice of networks was
extremely binding. With the advent of satellite and of digital cable, though, the channel
capacity has increased significantly (as has the number of available networks) so the
marginal channel not getting on the air is a much more niche network than in earlier
years. Nevertheless, the issue remains of substantial public interest.
The existing literature on the impact of vertical integration in cable television has
typically looked at the cable system level and the decision of whether to carry a network
or not. The literature has somewhat consistently found that cable systems are more likely
to carry their own networks than are similar non-vertically integrated systems. Most of
18

this research was conducted in the context of low channel capacity systems and little
competition (unlike today).
Important contributions from this literature include work using data from the
1980s and early 1990s such as Waterman and Weiss (1996, 1997), Chipty (2001), Ford
and Jackson (1997), and the work discussed in Owen and Wildman (1992). There is also
a more recent literature using more recent data including Wegener and Caves (2003),
Kang (2005), Chen and Waterman (2006), and Suzuki (2006). Some of these papers
have been explicitly concerned with the vertical integration of premium/pay cable
networks such as HBO while others have dealt with basic cable networks like CNN.
One of the important points raised in the discussion of this previous literature is
quite similar to the discussion above about the broadcast networks. Before one can
decide whether self-carriage is harmful, one needs to address the issue of whether the
existence of vertical integration is driven by efficiencies. This is not easy to do.
Some previous work has produced evidence that efficiencies may be important.
Ford and Jackson (1997) claim that vertically integrated networks save money on
programming costs. Chipty (2001) and Suzuki (2006) present evidence that vertical
integration can lower prices or, even when they raise prices, increase subscribership so
that, on net, the vertical integration increases consumer welfare.
Others have suggested a more strategic motivation, even in the more
contemporary period. Chen and Waterman (2006), for example, argue that even after the
supposed rise of competition from DBS, cable networks are still engaged in a new form
of exclusion whereby they relegate competitors' networks to digital tiers where fewer
people subscribe.
19
The ideal way to address this issue would have been to apply a market based test
like the one used above for the broadcast networks. This would entail looking at each
system and the amount of revenue coming in to that system from the marginal channels
they choose to carry and testing whether they apply a different threshold to their own
channels. Unfortunately, the data are not detailed enough to do that test. There is
network level data on the performance of channels nationally and there is system level
information about what networks a system carries but there is not system level data on
network performance.
So the evidence on the subject will be, by its nature, more suggestive than the
evidence available on the broadcast networks. Nevertheless, it provides some interesting
facts about the industry.
3.2 The Extent and Evolution of Vertical Integration Among Cable Networks
There have been several major shifts in the amount of vertical integration in the
industry over the years as well as in the market for multiple system operators (MSOs) and
DBS providers. The concentration, on a national basis, of the top companies has grown
over time with the considerable consolidation of cable and the rapid growth of DBS. On
a market-by-market basis, however, it has been the opposite. Each market has gone from
a virtual monopoly for the local cable franchise to a market where the cable franchise
shares the market with the two major DBS providers.
As the MSOs have shifted hands, the vertical integration of leading networks has
changed, as well. For example, when TCI was the leading MSO, they also owned a large
number of networks. They sold their cable systems to AT&T who divested most of the
20
networks. Newscorp has always owned a large number of networks and been
independent but then in the mid 2000s bought DirecTV, suddenly making all of their
networks vertically integrated.
Tables 8A and 8B show that of the top 15 networks as measured by the size of
their prime time audience, the share of vertically integrated networks has been falling
over time, from eight in 1997 to four in 2005. It has been falling in the wider market, as
well. As table 9 indicates, according to the FCC reports, the number of cable networks
has expanded dramatically in recent years but the expansion has been concentrated
mainly among independent networks not vertically integrated ones. The number of
networks increased by 359 in the ten years from 1996 to 2005. Independent networks
made up 311 of that 359, vertically integrated networks only 48. The share of networks
identified by the FCC as being vertically integrated has basically been cut in half over
this period—from almost 40% in 1996 to just over 20% in 2005.
So the initial evidence in cable looks fairly different that it does for broadcast
network shows in that it shows vertical integration to be on the decline. It is important to
remember, however, that in the world of cable networks, there are very few small scale,
independent operators. In this part of the market, independents are, themselves, giant
media companies like Disney and Viacom. It is difficult to find a single major cable
network owned by someone other than a major media conglomerate.
That said, it is still worth trying to understand why vertically integrated systems
tend to be more likely to carry their own channels than independent cable systems and
whether this can be attributed to market power.
21

3.3 The Performance of Cable Networks: In Search of Efficiency Explanations
The first data I examine are the national level information on cable network
performance.
With efficiency gains to vertical integration, the benefits of having more vertically
integrated subscribers should show up on either the revenue side or the cost side.
Networks with larger vertically integrated potential subscriber bases should either be
better at generating revenue (e.g., by creating programs to fit market demand or by
seeding and popularizing new networks) or else they should be better at creating
successful content more cheaply (e.g., by eliminating double marginalizing monopoly
markups or by keeping costs down with economies of scale). These have been the types
of efficiency claims made in the previous literature.
The data on 120 leading cable networks in Kagan World Media's (2006) The
Economics of Basic Cable Networks 2007 yields a sample of networks for a ten year
period from 1997 to 2006 that includes information on the number of subscribers, the
total programming expenses, the total revenues for each channel and then the total
number of viewers (average 24 hour ratings) for a smaller set of established networks. It
is not a balanced panel in that some of the networks enter after 1997.
I match to this sample to information taken from the FCC's Annual Video
Competition reports and their data on which networks were vertically integrated in the
given year and the size of those vertically integrated systems (in number of subscribers).
The measure of vertical integration used in the regressions is the ratio of potential vertical
subscribers to current subscribers for the network, i.e., the total number of subscribers to
22
cable systems owned by the network's parent divided by the total number of subscribers
to the channel at the start of the year.
There is a lot of variation in this measure across channels and across time. For a
channel like ESPN, which is owned by the non-vertically integrated Disney, this would
be zero in all years. For a channel like CNN which is owned by Time-Warner, this will
be the ratio of Time-Warner cable subscribers to CNN's total subscriber base in each
year. For a channel like F/X, whose owner Newscorp became vertically integrated late in
the sample, or BET which was owned by TCI (vertically integrated) and then sold to
Viacom (not vertically integrated), the ratio will be zero in some years and positive in
others.
The basic methodology will be to regress the performance of the network—
measured in subscribers, revenues, expenses, and so on—on the extent of vertical
integration for the network (with network and year dummies as controls).
Column (1) of Table 10A shows that doing this regression on the log number of
subscribers suggests that there is a very small negative effect of vertical integration on the
number of subscribers a channel has. So when a channel goes from being independent to
being integrated, it loses subscribers. Column (2) looks at the subscriber growth rate
rather than the number of subscribers and here finds a small positive coefficient.
Becoming vertically integrated leads the subscriber growth rate to increase by a small
amount.
Column (3) looks at the subset of networks where the Kagan data contains
information on the number of viewers as well as the number of subscribers. It shows
23
that, conditional on the number of subscribers, the number of viewers actually watching
the channel falls when it becomes vertically integrated.
Columns (4) to (6) look at the impact of becoming vertically integrated on the
amount of license revenue the network gets from the distribution systems, the amount of
advertising revenue they bring in and the amount they spend on programming (each
regression controls for the number of subscribers since that influences the dependent
variable directly). Here, again, there is very little evidence that vertical integration of a
channel has any noticeably beneficial impact on revenues or costs. The same network
performs exactly as well before and after it is vertically integrated.2
Some in the previous literature have argued that the efficiencies of vertical
integration flow only to start-up networks, not to well established ones. So Table 10B
presents the same regressions of Table 10A but restricts the sample only to networks
started since 1997. Among these younger networks, there are no major differences with
the results for all networks. There is no evidence that when new networks become
vertically integrated it increases subscribers or changes their subscriber growth rates.
The number of viewers, conditional on how many subscribers there are, actually seems to
fall (though here it is not significant), and there is no evidence that license revenue,
advertising revenue or programming cost adjust in a beneficial way when a network
vertically integrates.
2 An endogeneity concern with these regressions would be if the vertical ownership changes for a given network were endogenous to the performance of that network (i.e., if vertical owners sell networks whose performance is poor, say) but most of these ownership changes take place with the acquisition or divestment of massive media conglomerates. There is only a small amount of trading of individual networks between owners.
24

So collectively, the network level data does not suggest much of an impact of
vertical integration on the performance of basic cable networks. Perhaps that helps
explain why the degree of vertical integration has been falling over time.
3.4 Carriage Rates for Growing Networks in the Face of DBS competition: The Search
for Evidence on Propensities to Self-Carry
Next, I revisit the decisions of cable systems on what networks to carry. This has
been the main subject of the previous literature. Those papers have, rather consistently
found that vertically integrated systems are more likely to carry their own networks but
have disagreed over whether this is due to efficiency reasons or strategic foreclosure
reasons.
The regressions will use the same system level data used in previous work (but
updated to the present) which is Warren Publishing's Television and Cable Factbook
2007.3 This is the same data source used in much of the literature on the cable industry
such as Goolsbee and Petrin (2004), Crawford (2000), Chipty (2001), and others.
I restrict the sample to cable systems for whom the number of subscribers is not
missing and that have at least 5000 subscribers. Excluding the smaller systems reduces
the number of observations substantially but hardly affects the total subscribership across
the entire sample (because big systems predominate). This sample restriction yields
around 1,400 different cable systems. To this sample of systems, I match demographic
information from the census for the main county the cable system operates in.
3 The actual dataset used here was first edited by Greg Crawford who kindly provided it.
25
The basic methodology is to do a Probit regression of the system's {0,1} decision
to carry a network as a function of whether the system's parent owns the channel,
demographic variables, and characteristics of the system. The results will differ from the
previous literature, however, by adding an important variable to indicate the amount of
competition facing the cable system which is the share of DBS subscribers in the
television market.
Most previous work looked at system decisions at a time when they faced little
competition in distribution. For the anti-competitive explanation of their propensity to
carry their own networks, as the amount of competition rises in the market, their ability to
get away with self-promotion should be reduced. If they promote their own, inferior
channels, they should start losing customers to the unaffiliated DBS providers whose
only interest is in giving the customers exactly the networks they want. In practical
terms, the positive coefficient on vertical integration in the regression of carriage rates
should fall when the market's DBS share is higher.
Alternatively, the efficiency explanation of self-carriage does not suggest the
relationship should fall with higher DBS penetration. That argument holds that the cable
system really ought to be vertically integrated with the channels in question because they
enhance the system's ability to either deliver better content or to invest in relationship
specific assets or avoid double marginalization, or many others. How much competition
they face is not relevant.
Before looking in detail though, it is important to note that the historic literature
on vertical integration and the carriage decision no longer applies to most of the major
vertically integrated networks because all of them are carried on virtually all major cable
26

systems. This is readily apparent when looking at the top part of Table 11 which lists six
of the biggest vertically integrated networks–AMC, CNN, TBS, TNT, and Discovery.
Each one has carriage rates close to 100% in this sample for both affiliated and non-
affiliated cable systems. Clearly there is little scope for strategic behavior when every
system carries has enough capacity to carry all the major channels (although the work of
Chen and Waterman, 2006 does show that there may still be interesting decisions
regarding what networks get carried on the digital versus the analog tier).
A similar problem faces fledgling networks whose take up is extremely low on
both types of systems. So the results here will focus on wholly or partially vertically
integrated basic cable networks identified in FCC (2006) that have carriage rates between
5% and 90% in the sample of cable systems. This was 16 networks, though data sample
problems forced dropping four of these.4 The sample includes BBC America,
Boomerang, CNN International, FitTV, FUSE, G4, PBSKids, The Science Channel,
Style, The Travel Channel, TVOne, and WE.
The lower panel of table 11 gives the carriage rates for these channels among the
systems they are vertically integrated with and the ones they are not. In many cases, the
integrated systems are more likely to carry their own channels. But in many cases, the
opposite is true.
These raw sample means do not, however, answer whether the vertical systems
favor their own networks. If all the Time-Warner cable systems are in locations with
digital capacity and a large number of intensive TV watchers, for example, then they will
4 Likely because of name matching problems, the share of systems in the data reporting carriage of CourtTV, the Independent Film Channel, DiscoveryHealth and the Outdoor Life Network were so different from the subscriber counts in the Economics of Basic Cable Networks that I excluded them.
27
be more likely to carry the Time-Warner (and other) channels for those reasons but it will
look like it is due to vertical integration.
What is needed is a multivariate regression framework that estimates the impact
of vertical integration on the probability of carrying the network while controlling for the
impact of demographic factors in the system's area and for the system's characteristics.
The results will follow the previous literature on carriage decisions by including
as demographic variables information from the U.S. Census for the county the system
operates in. The variables are: population density, the population growth rate, the share
of the population that is Hispanic, the share of the population that is under 18, the share
of the population that is over 65, the average household size, the log of median income,
and the share of people that own their home.
For variables indicating the quality and/or capacity of the cable system the
regressions include the share of the cable system's plant that is fiber, a dummy for
whether the system is two-way capable, and a dummy for whether it is an analog only
system (i.e., no digital service is offered). Adding channel capacity did not change the
results but is missing from a large number of the system level observations and thus
dramatically reduced the sample. For that reason it is not included in the regressions.
The standard errors are clustered at the level of the system owner since the decisions of
the multiple systems owned by the same MSO are likely not to be truly independent.
The regressions also add the amount of DBS competition in the Designated
Market Area. As mentioned above, if the self-carriage rates for vertically integrated
cable systems decline with the amount of competition from DBS, this could be a sign that
28

the positive relationship does not have an efficiency explanation but is perhaps driven by
market power considerations.
In each case, the regression includes the DBS share interacted with the vertical
integration dummy (which should be negative if more DBS competition reduces the
positive self-carriage rates) and also the DBS share on its own in case the kinds of places
that have a lot of DBS subscribers differ in their unobservable tastes for the channel in
some systematic way.
Of the eleven networks listed in the tables 12A to 12K, nine show significant
evidence that having an ownership in a network makes systems significantly more likely
to carry it (and one that is positive but not significant). In this sense, the findings very
much comport with the previous literature. The interesting addition is that for nine of the
eleven networks, the higher is the DBS share in the local market, the more attenuated that
relationship becomes. For those nine, the interaction of vertical integration with the DBS
share has a significant negative coefficient.5 This evidence suggests, perhaps, an
explanation rooted in competitive pressures rather than efficiencies.
In each of these cases, it is also possible to ask at what level of DBS market share
would the vertical integration effect on carriage rates be reduced to zero. This is
computed simply by dividing the one coefficient by the other (and taking absolute
values). The DBS share is only a crude measure of competition but certainly if one
believed the coefficients were entirely documenting the way competition reduces market
5 For the one network not listed in the tables, FUSE, the probit showed a significant positive coefficient on vertical integration and a significant negative on the interaction with DBS but something in the data lead the standard errors to be absurdly small and the coefficients absurdly large. A linear probability model of carriage showed a very similar positive coefficient on vertical integration and a negative on the vertical integration interacted with the DBS share found for the other networks. Rather than try to figure out what feature of the data caused this strange probit result, it is simply excluded from the presentation.
29
power, this would give something like a threshold test for how large the competition
share must be for the cable system to lose its ability to promote its own channels. This is
listed for each network at the bottom of the table. The DBS share that makes the vertical
integration effect equal to zero averages around 20 to 25 percent and in all but one ranges
from 7 to 42.
This kind of calculation is obviously meant only to be suggestive. But applied
with better data to more narrowly defined markets, this type of approach might be able to
provide an empirical basis for the threshold-type exemptions often used by the FCC and
other regulatory agencies where certain markets or firms are exempted from regulation
when they have been deemed to be "competitive."
Thus for at least a subset of the networks there is evidence consistent with the
view that DBS competition reigns in the ability of cable systems to use a vertically
integrated position to promote their own channels. And the evidence at the network level
gives little evidence that that vertically integrated networks attract more subscribers,
grow faster, raise more ad revenue or licensing fees or have lower programming costs.
4 Conclusion
This study has documented the extent of vertical integration in television
programming and tried to explore some of the apparent motivations for it.
In broadcast television, the results show that vertical integration of networks into
the shows they broadcast is large and rising in numerous, independent data sets. Looking
at the decisions, the networks appear to treat independent programs differently than they
treat their own programs—requiring them to have higher advertising revenues to get on
30
the air. This rule of thumb does not seem to apply to fully independent programs, which
are treated exactly as the integrated programs are. The higher standard seems to be
reserved for shows owned by rival broadcast networks.
Among cable systems, the evidence suggests that vertical integration is a
shrinking part of the business as the number of networks in existence continues to expand
robustly while the number of vertically integrated networks has grown slowly. There is
not sufficient data to conduct a market test of discrimination like the one for broadcast
network shows but the data that do exist do not reveal any clear evidence of efficiencies
for channels that have a larger vertically integrated component. Further, the evidence on
self-carriage rates show that vertically integrated cable systems are more likely to carry
their own channels except in places where there is sufficient competition from DBS.
Both of these facts may be consistent with the view that the efficiency gains from vertical
integration today are relatively small and that competition has taken away the ability of
cable systems to take as much strategic advantage as they may have once done.
31
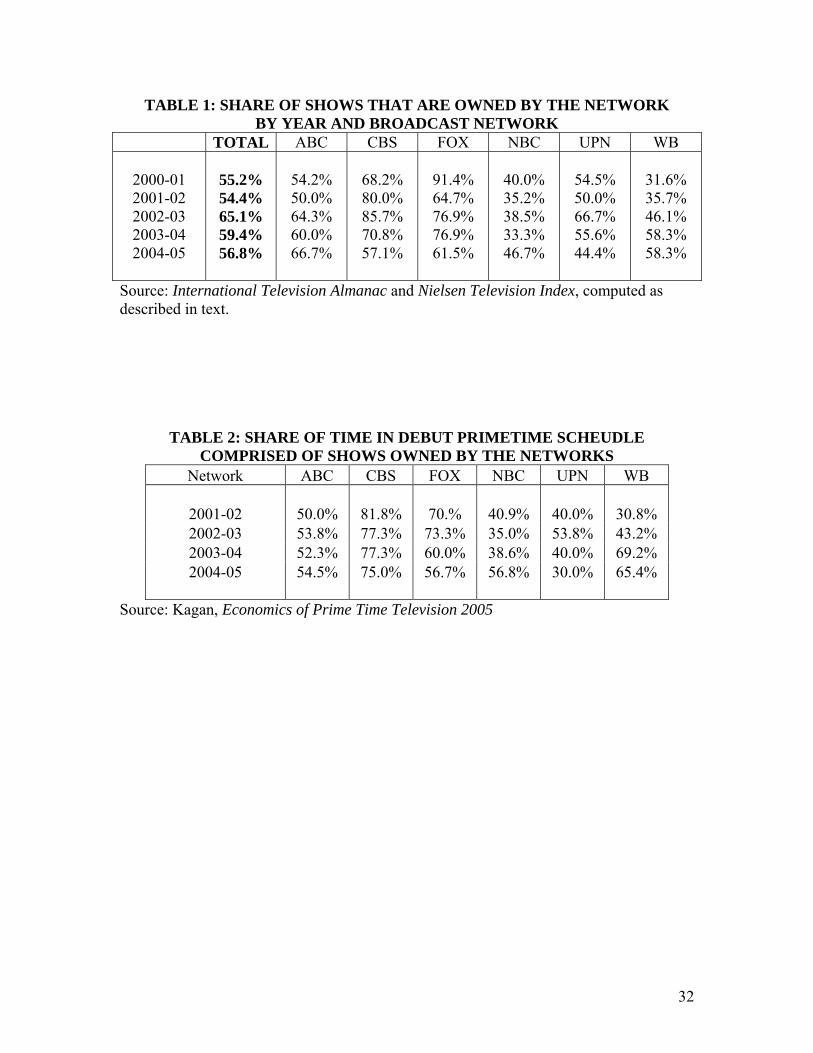
TABLE 1: SHARE OF SHOWS THAT ARE OWNED BY THE NETWORK BY YEAR AND BROADCAST NETWORK
TOTAL ABC CBS FOX NBC UPN WB
2000-01 2001-02 2002-03 2003-04 2004-05
55.2% 54.4% 65.1% 59.4% 56.8%
54.2% 50.0% 64.3% 60.0% 66.7%
68.2% 80.0% 85.7% 70.8% 57.1%
91.4% 64.7% 76.9% 76.9% 61.5%
40.0% 35.2% 38.5% 33.3% 46.7%
54.5% 50.0% 66.7% 55.6% 44.4%
31.6% 35.7% 46.1% 58.3% 58.3%
Source: International Television Almanac and Nielsen Television Index, computed as described in text.
TABLE 2: SHARE OF TIME IN DEBUT PRIMETIME SCHEUDLE COMPRISED OF SHOWS OWNED BY THE NETWORKS
Network ABC CBS FOX NBC UPN WB
2001-02 50.0% 81.8% 70.% 40.9% 40.0% 30.8% 2002-03 53.8% 77.3% 73.3% 35.0% 53.8% 43.2% 2003-04 52.3% 77.3% 60.0% 38.6% 40.0% 69.2% 2004-05
54.5%
75.0%
56.7%
56.8%
30.0%
65.4%
Source: Kagan, Economics of Prime Time Television 2005
32

TABLE 3: OWNERSHIP OF PRIMETIME SHOWS
BY BROADCAST NETWORK FOR 2000-2001 TO 2004-2005 SEASONS TOTAL ABC CBS FOX NBC UPN WB
Vertically Integrated Shows
58.0%
57.8%
72.2%
74.8%
38.6%
54.2%
44.3%
Shows Owned by Other Networks
23.5%
24.5%
11.1%
6.8%
37.3%
25.0%
41.4%
Fully Independent
Shows
18.5%
17.6%
16.7%
18.4%
24.1%
20.8%
14.3%
Source: International Television Almanac and Nielsen Television Index, computed as described in text.
TABLE 4: OWNERSHIP OF PRIMETIME SHOWS BY BROADCAST NETWORK FOR FEBRUARY/MARCH 2007
TOTAL ABC CBS FOX NBC CW
Vertically Integrated Shows
67.9%
66.7%
68.4%
66.7%
61.1%
81.8%
Shows Owned by Other Networks
19.3%
22.2%
21.1%
8.3%
27.8%
9.1%
Fully Independent
Shows
12.8%
11.1%
10.5%
25.0%
11.1%
9.1%
Source: IMDB.com (2007), computed as described in text.
33
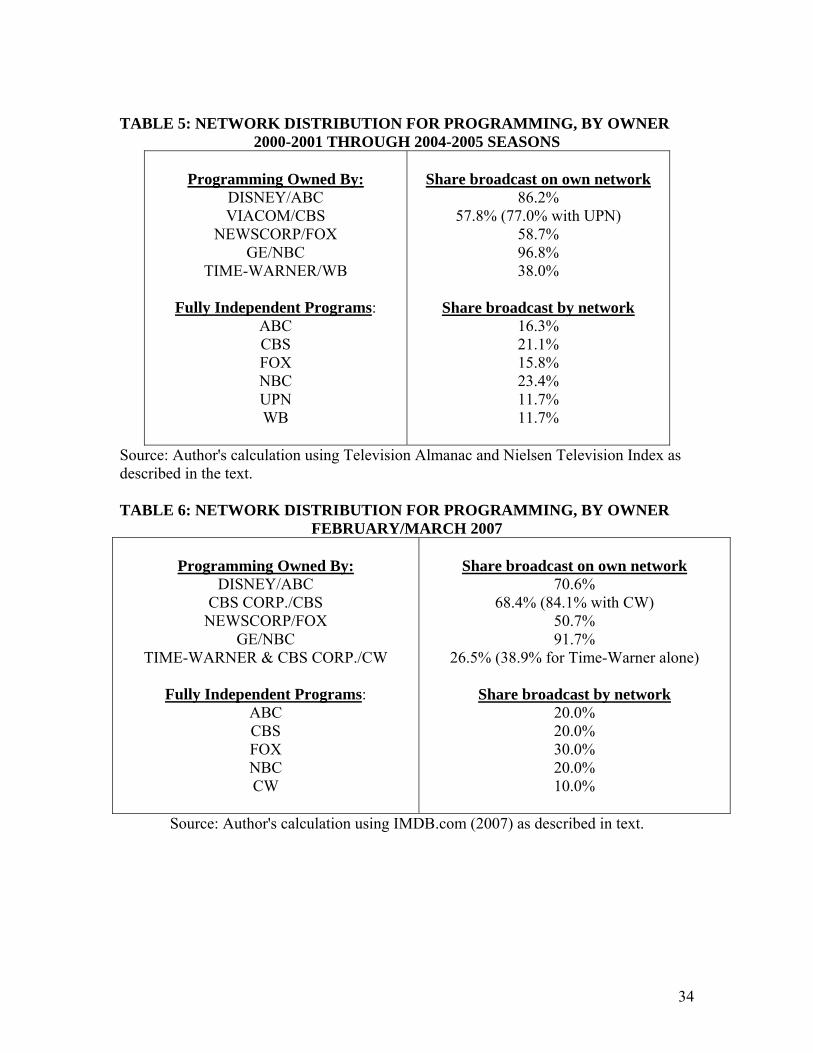
TABLE 5: NETWORK DISTRIBUTION FOR PROGRAMMING, BY OWNER
2000-2001 THROUGH 2004-2005 SEASONS
Programming Owned By: DISNEY/ABC VIACOM/CBS
NEWSCORP/FOX GE/NBC
TIME-WARNER/WB
Fully Independent Programs: ABC CBS FOX NBC UPN WB
Share broadcast on own network
86.2% 57.8% (77.0% with UPN)
58.7% 96.8% 38.0%
Share broadcast by network
16.3% 21.1% 15.8% 23.4% 11.7% 11.7%
Source: Author's calculation using Television Almanac and Nielsen Television Index as described in the text. TABLE 6: NETWORK DISTRIBUTION FOR PROGRAMMING, BY OWNER
FEBRUARY/MARCH 2007
Programming Owned By: DISNEY/ABC
CBS CORP./CBS NEWSCORP/FOX
GE/NBC TIME-WARNER & CBS CORP./CW
Fully Independent Programs:
ABC CBS FOX NBC CW
Share broadcast on own network
70.6% 68.4% (84.1% with CW)
50.7% 91.7%
26.5% (38.9% for Time-Warner alone)
Share broadcast by network 20.0% 20.0% 30.0% 20.0% 10.0%
Source: Author's calculation using IMDB.com (2007) as described in text.
34
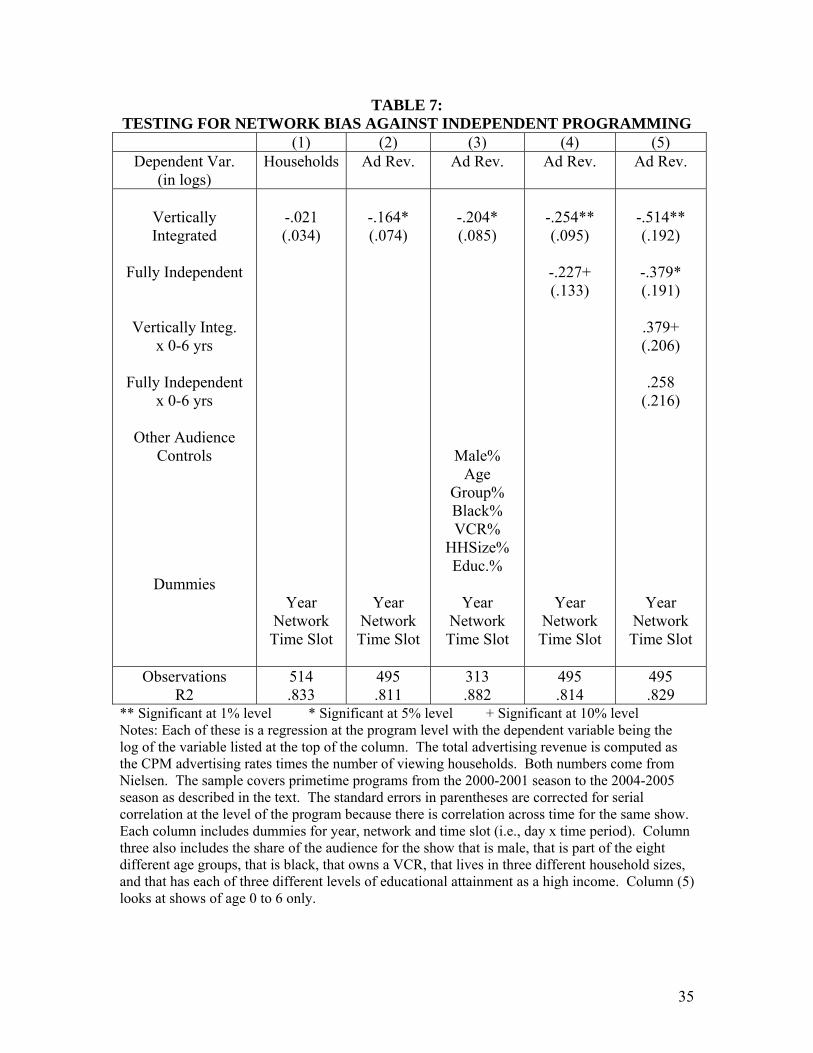
TABLE 7: TESTING FOR NETWORK BIAS AGAINST INDEPENDENT PROGRAMMING
(1) (2) (3) (4) (5) Dependent Var.
(in logs) Households Ad Rev. Ad Rev. Ad Rev. Ad Rev.
Vertically Integrated
Fully Independent
Vertically Integ. x 0-6 yrs
Fully Independent
x 0-6 yrs
Other Audience Controls
Dummies
-.021 (.034)
Year Network Time Slot
-.164* (.074)
Year
Network Time Slot
-.204* (.085)
Male%
Age Group% Black% VCR%
HHSize% Educ.%
Year
Network Time Slot
-.254** (.095)
-.227+ (.133)
Year
Network Time Slot
-.514** (.192)
-.379* (.191)
.379+ (.206)
.258
(.216)
Year Network Time Slot
Observations R2
514 .833
495 .811
313 .882
495 .814
495 .829
** Significant at 1% level * Significant at 5% level + Significant at 10% level Notes: Each of these is a regression at the program level with the dependent variable being the log of the variable listed at the top of the column. The total advertising revenue is computed as the CPM advertising rates times the number of viewing households. Both numbers come from Nielsen. The sample covers primetime programs from the 2000-2001 season to the 2004-2005 season as described in the text. The standard errors in parentheses are corrected for serial correlation at the level of the program because there is correlation across time for the same show. Each column includes dummies for year, network and time slot (i.e., day x time period). Column three also includes the share of the audience for the show that is male, that is part of the eight different age groups, that is black, that owns a VCR, that lives in three different household sizes, and that has each of three different levels of educational attainment as a high income. Column (5) looks at shows of age 0 to 6 only.
35
TABLE 8A: VERTICAL OWNERSHIP OF NETWORKS BY PRIMETIME RATINGS, 1997
1 TNT Time Warner (100%) 2 Nickelodeon/Nick at Nite 3 TBS Time Warner (100%) 4 USA Network 5 Lifetime Television 6 Arts & Entertainment (A&E) 7 ESPN 8 The Discovery Channel TCI (49%), Cox (24.5%) 9 The Cartoon Network Time Warner (100%) 10 The Family Channel 11 TNN (The Nashville Network) Time Warner (100%) 12 CNN Time Warner (100%) 13 Sci-Fi Channel 14 The Learning Channel TCI (49%), Cox (24.5%) 15 fX TCI (50%) Source: FCC (1997)
TABLE 8B: VERTICAL OWNERSHIP OF NETWORKS BY PRIMETIME RATINGS, 2005
1 Nickelodeon 2 TNT Time Warner (100%) 3 Nick at Nite 4 USA Network 5 Disney 6 Lifetime 7 Toon Disney 8 TBS Time Warner (100%) 9 Spike TV 10 Fox News Channel Newscorp (100%) 11 History Channel 12 ESPN 13 MTV 14 Discovery Channel Cox (24.5%) Advance (24.5%) 15 Sci Fi Channel Source: FCC (2006)
TABLE 9: NUMBER OF CABLE NETWORKS Year National
Networks Vertically Integrated
Independent Networks
1996 1997
2004 2005
172 245
388 531
68 95
89 116
104 150
299 415
Source: FCC (1997) and FCC (2006)
36
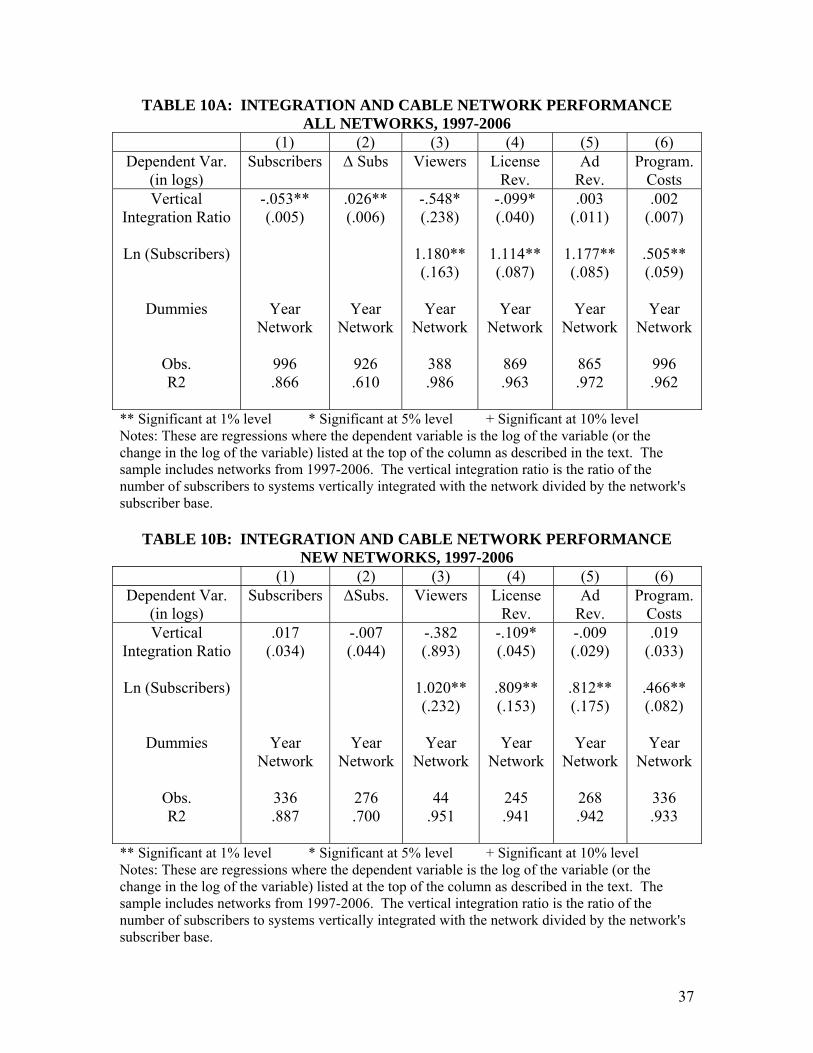
TABLE 10A: INTEGRATION AND CABLE NETWORK PERFORMANCE ALL NETWORKS, 1997-2006
(1) (2) (3) (4) (5) (6) Dependent Var.
(in logs) Subscribers Δ Subs Viewers License
Rev. Ad
Rev. Program.
Costs Vertical
Integration Ratio
Ln (Subscribers)
Dummies
Obs. R2
-.053** (.005)
Year Network
996 .866
.026** (.006)
Year Network
926 .610
-.548* (.238)
1.180** (.163)
Year
Network
388 .986
-.099* (.040)
1.114** (.087)
Year
Network
869 .963
.003 (.011)
1.177** (.085)
Year
Network
865 .972
.002 (.007)
.505** (.059)
Year
Network
996 .962
** Significant at 1% level * Significant at 5% level + Significant at 10% level Notes: These are regressions where the dependent variable is the log of the variable (or the change in the log of the variable) listed at the top of the column as described in the text. The sample includes networks from 1997-2006. The vertical integration ratio is the ratio of the number of subscribers to systems vertically integrated with the network divided by the network's subscriber base.
TABLE 10B: INTEGRATION AND CABLE NETWORK PERFORMANCE
NEW NETWORKS, 1997-2006 (1) (2) (3) (4) (5) (6)
Dependent Var. (in logs)
Subscribers ΔSubs. Viewers License Rev.
Ad Rev.
Program. Costs
Vertical Integration Ratio
Ln (Subscribers)
Dummies
Obs. R2
.017 (.034)
Year Network
336 .887
-.007 (.044)
Year Network
276 .700
-.382 (.893)
1.020** (.232)
Year
Network
44 .951
-.109* (.045)
.809** (.153)
Year
Network
245 .941
-.009 (.029)
.812** (.175)
Year
Network
268 .942
.019 (.033)
.466** (.082)
Year
Network
336 .933
** Significant at 1% level * Significant at 5% level + Significant at 10% level Notes: These are regressions where the dependent variable is the log of the variable (or the change in the log of the variable) listed at the top of the column as described in the text. The sample includes networks from 1997-2006. The vertical integration ratio is the ratio of the number of subscribers to systems vertically integrated with the network divided by the network's subscriber base.
37
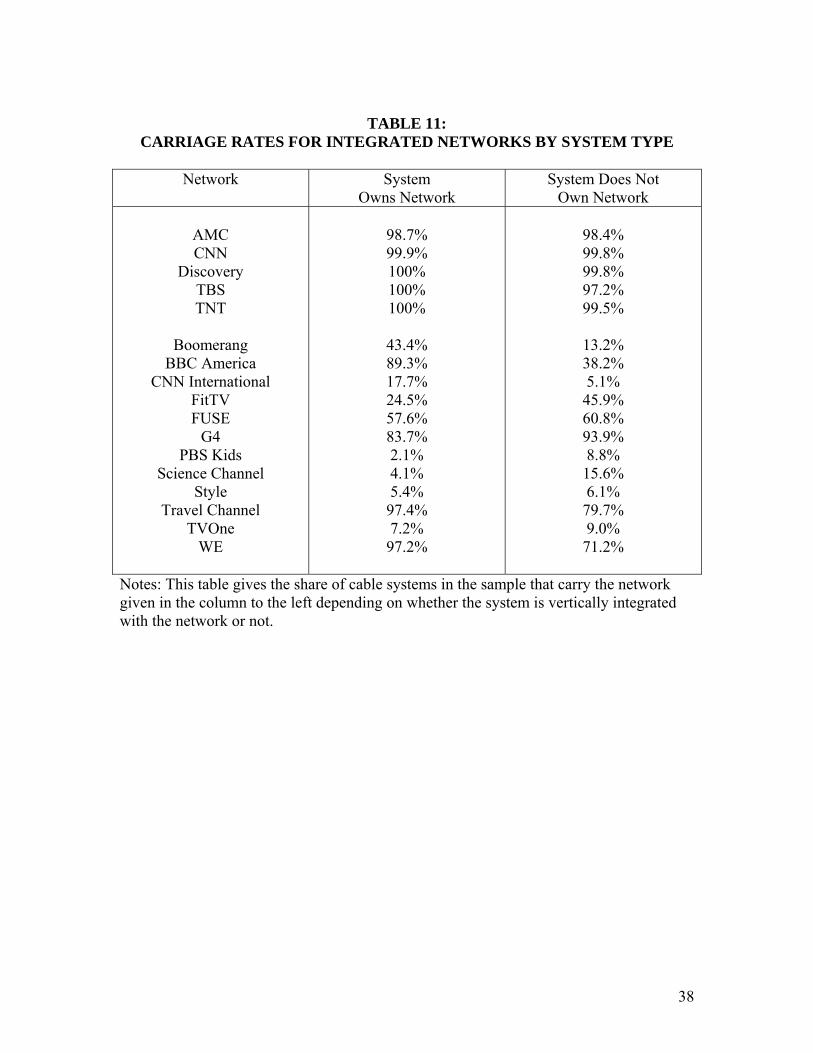
TABLE 11:
CARRIAGE RATES FOR INTEGRATED NETWORKS BY SYSTEM TYPE
Network System Owns Network
System Does Not Own Network
AMC CNN
Discovery TBS TNT
Boomerang
BBC America CNN International
FitTV FUSE
G4 PBS Kids
Science Channel Style
Travel Channel TVOne
WE
98.7% 99.9% 100% 100% 100%
43.4% 89.3% 17.7% 24.5% 57.6% 83.7% 2.1% 4.1% 5.4% 97.4% 7.2% 97.2%
98.4% 99.8% 99.8% 97.2% 99.5%
13.2% 38.2% 5.1% 45.9% 60.8% 93.9% 8.8% 15.6% 6.1% 79.7% 9.0% 71.2%
Notes: This table gives the share of cable systems in the sample that carry the network given in the column to the left depending on whether the system is vertically integrated with the network or not.
38
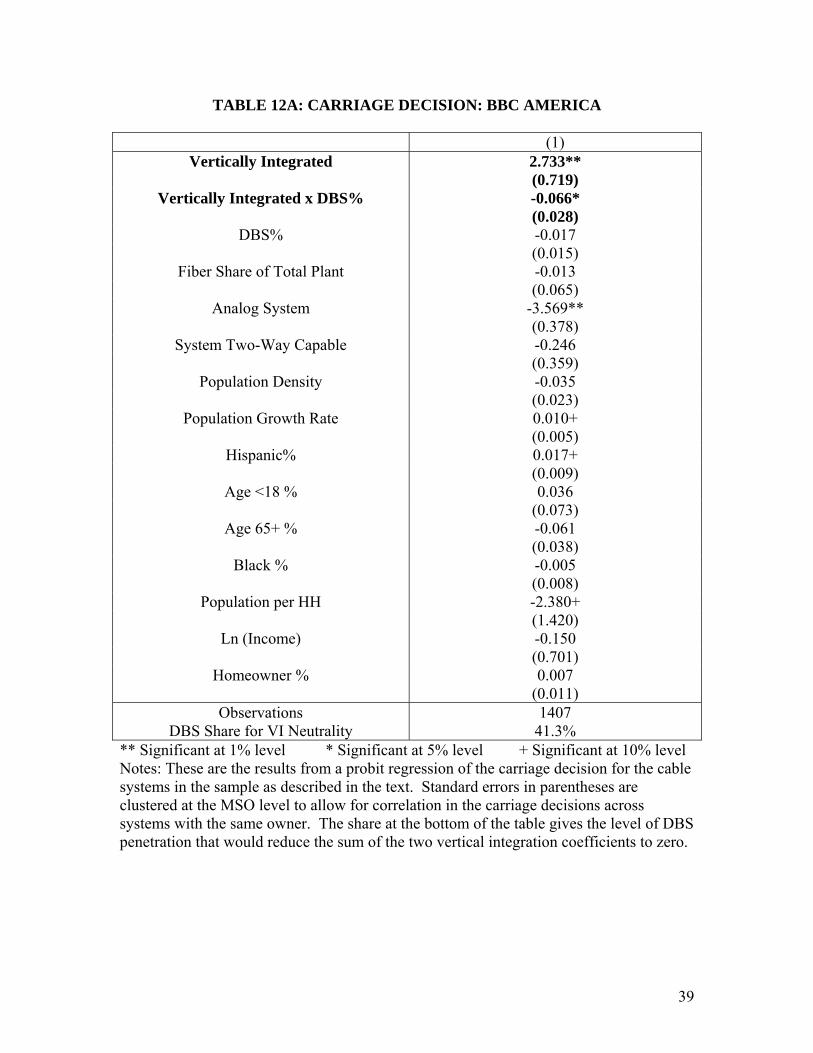
TABLE 12A: CARRIAGE DECISION: BBC AMERICA
(1) Vertically Integrated 2.733**
(0.719) Vertically Integrated x DBS% -0.066*
(0.028) DBS% -0.017
(0.015) Fiber Share of Total Plant -0.013
(0.065) Analog System -3.569**
(0.378) System Two-Way Capable -0.246
(0.359) Population Density -0.035
(0.023) Population Growth Rate 0.010+
(0.005) Hispanic% 0.017+
(0.009) Age <18 % 0.036
(0.073) Age 65+ % -0.061
(0.038) Black % -0.005
(0.008) Population per HH -2.380+
(1.420) Ln (Income) -0.150
(0.701) Homeowner % 0.007
(0.011) Observations
DBS Share for VI Neutrality 1407
41.3% ** Significant at 1% level * Significant at 5% level + Significant at 10% level Notes: These are the results from a probit regression of the carriage decision for the cable systems in the sample as described in the text. Standard errors in parentheses are clustered at the MSO level to allow for correlation in the carriage decisions across systems with the same owner. The share at the bottom of the table gives the level of DBS penetration that would reduce the sum of the two vertical integration coefficients to zero.
39
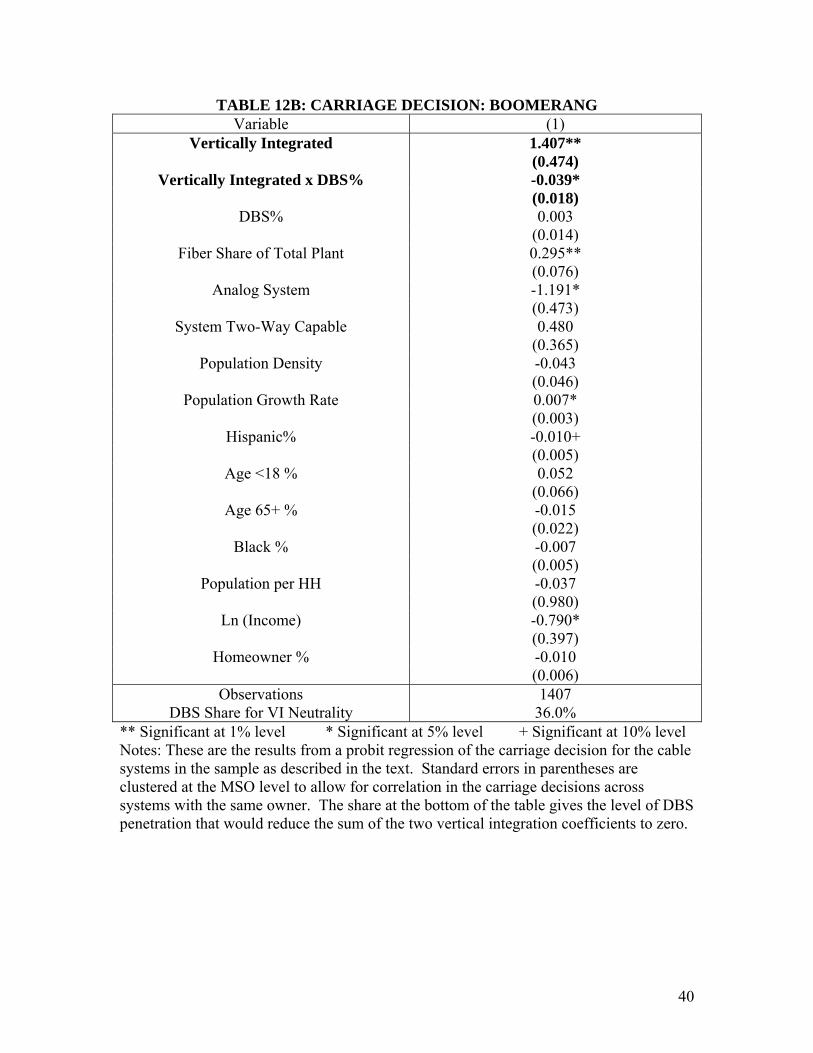
TABLE 12B: CARRIAGE DECISION: BOOMERANG Variable (1)
Vertically Integrated 1.407** (0.474)
Vertically Integrated x DBS% -0.039* (0.018)
DBS% 0.003 (0.014)
Fiber Share of Total Plant 0.295** (0.076)
Analog System -1.191* (0.473)
System Two-Way Capable 0.480 (0.365)
Population Density -0.043 (0.046)
Population Growth Rate 0.007* (0.003)
Hispanic% -0.010+ (0.005)
Age <18 % 0.052 (0.066)
Age 65+ % -0.015 (0.022)
Black % -0.007 (0.005)
Population per HH -0.037 (0.980)
Ln (Income) -0.790* (0.397)
Homeowner % -0.010 (0.006)
Observations DBS Share for VI Neutrality
1407 36.0%
** Significant at 1% level * Significant at 5% level + Significant at 10% level Notes: These are the results from a probit regression of the carriage decision for the cable systems in the sample as described in the text. Standard errors in parentheses are clustered at the MSO level to allow for correlation in the carriage decisions across systems with the same owner. The share at the bottom of the table gives the level of DBS penetration that would reduce the sum of the two vertical integration coefficients to zero.
40
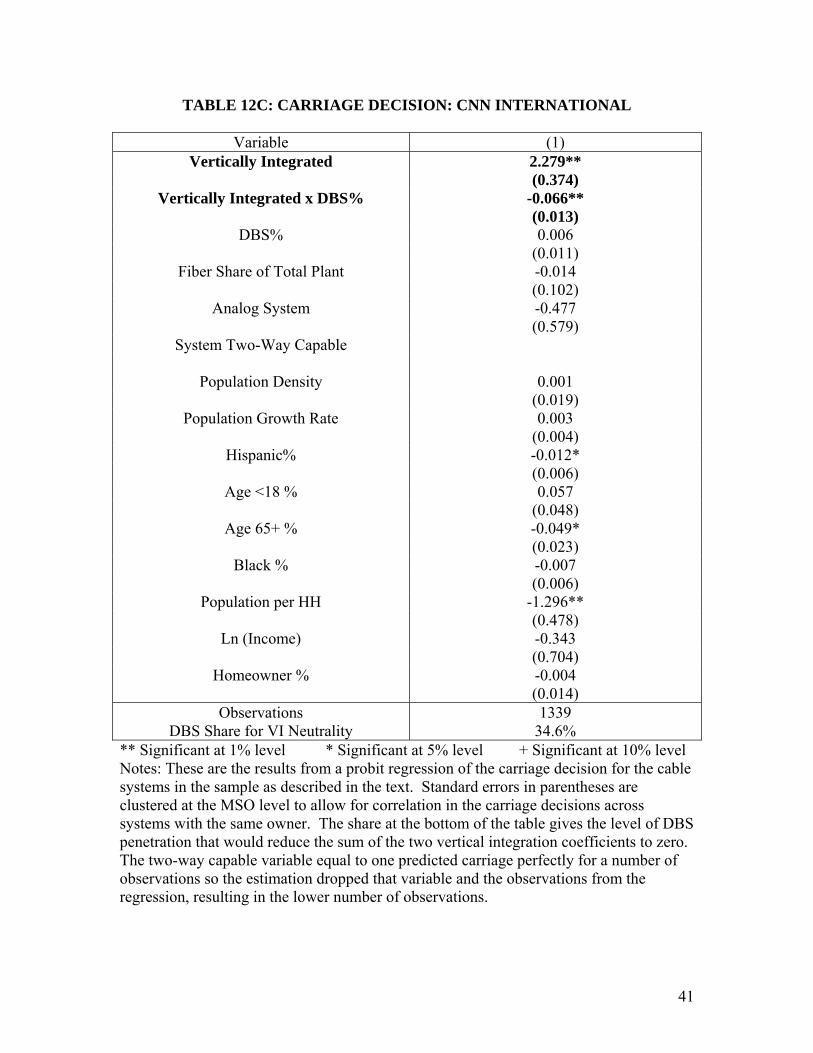
TABLE 12C: CARRIAGE DECISION: CNN INTERNATIONAL
Variable (1) Vertically Integrated 2.279**
(0.374) Vertically Integrated x DBS% -0.066**
(0.013) DBS% 0.006
(0.011) Fiber Share of Total Plant -0.014
(0.102) Analog System -0.477
(0.579) System Two-Way Capable
Population Density 0.001
(0.019) Population Growth Rate 0.003
(0.004) Hispanic% -0.012*
(0.006) Age <18 % 0.057
(0.048) Age 65+ % -0.049*
(0.023) Black % -0.007
(0.006) Population per HH -1.296**
(0.478) Ln (Income) -0.343
(0.704) Homeowner % -0.004
(0.014) Observations
DBS Share for VI Neutrality 1339
34.6% ** Significant at 1% level * Significant at 5% level + Significant at 10% level Notes: These are the results from a probit regression of the carriage decision for the cable systems in the sample as described in the text. Standard errors in parentheses are clustered at the MSO level to allow for correlation in the carriage decisions across systems with the same owner. The share at the bottom of the table gives the level of DBS penetration that would reduce the sum of the two vertical integration coefficients to zero. The two-way capable variable equal to one predicted carriage perfectly for a number of observations so the estimation dropped that variable and the observations from the regression, resulting in the lower number of observations.
41

TABLE 12D: CARRIAGE DECISION: FIT TV
Variable (1) Vertically Integrated 1.414**
(0.524) Vertically Integrated x DBS% -0.074*
(0.032) DBS% -0.002
(0.010) Fiber Share of Total Plant -0.109*
(0.050) Analog System -2.249**
(0.448) System Two-Way Capable -0.317
(0.300) Population Density 0.008
(0.020) Population Growth Rate -0.003
(0.003) Hispanic% -0.004
(0.007) Age <18 % -0.032
(0.026) Age 65+ % 0.021
(0.018) Black % -0.015*
(0.007) Population per HH 1.284*
(0.552) Ln (Income) -0.072
(0.381) Homeowner % -0.010
(0.012) Observations
DBS Share for VI Neutrality 1339
19.1% ** Significant at 1% level * Significant at 5% level + Significant at 10% level Notes: These are the results from a probit regression of the carriage decision for the cable
systems in the sample as described in the text. Standard errors in parentheses are clustered at the MSO level to allow for correlation in the carriage decisions across
systems with the same owner. The share at the bottom of the table gives the level of DBS penetration that would reduce the sum of the two vertical integration coefficients to zero. The two-way capable variable equal to one predicted carriage perfectly for a number of
observations so the estimation dropped that variable and the observations from the regression, resulting in the lower
42
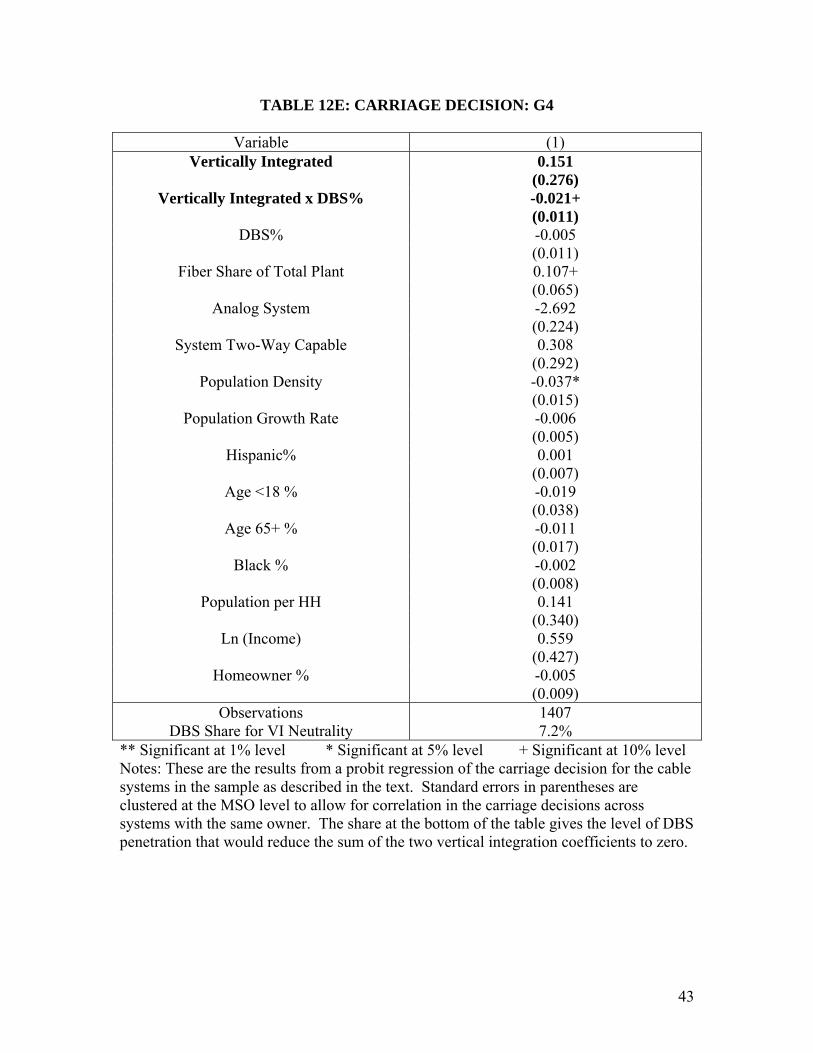
TABLE 12E: CARRIAGE DECISION: G4
Variable (1) Vertically Integrated 0.151
(0.276) Vertically Integrated x DBS% -0.021+
(0.011) DBS% -0.005
(0.011) Fiber Share of Total Plant 0.107+
(0.065) Analog System -2.692
(0.224) System Two-Way Capable 0.308
(0.292) Population Density -0.037*
(0.015) Population Growth Rate -0.006
(0.005) Hispanic% 0.001
(0.007) Age <18 % -0.019
(0.038) Age 65+ % -0.011
(0.017) Black % -0.002
(0.008) Population per HH 0.141
(0.340) Ln (Income) 0.559
(0.427) Homeowner % -0.005
(0.009) Observations
DBS Share for VI Neutrality 1407 7.2%
** Significant at 1% level * Significant at 5% level + Significant at 10% level Notes: These are the results from a probit regression of the carriage decision for the cable systems in the sample as described in the text. Standard errors in parentheses are clustered at the MSO level to allow for correlation in the carriage decisions across systems with the same owner. The share at the bottom of the table gives the level of DBS penetration that would reduce the sum of the two vertical integration coefficients to zero.
43

TABLE 12F: CARRIAGE DECISION: PBS KIDS
Variable (1) Vertically Integrated 2.043**
(0.689) Vertically Integrated x DBS% -0.156**
(0.028) DBS% -0.015
(0.020) Fiber Share of Total Plant 0.380*
(0.190) Analog System -0.602
(0.560) System Two-Way Capable
Population Density -0.035
(0.033) Population Growth Rate 0.016**
(0.005) Hispanic% -0.035
(0.018) Age <18 % -0.015
(0.054) Age 65+ % 0.078*
(0.033) Black % -0.025*
(0.011) Population per HH 0.897
(0.979) Ln (Income) 0.969+
(0.551) Homeowner % -0.049*
(0.020) Observations
DBS Share for VI Neutrality 1339
13.2% ** Significant at 1% level * Significant at 5% level + Significant at 10% level Notes: These are the results from a probit regression of the carriage decision for the cable systems in the sample as described in the text. Standard errors in parentheses are clustered at the MSO level to allow for correlation in the carriage decisions across systems with the same owner. The share at the bottom of the table gives the level of DBS penetration that would reduce the sum of the two vertical integration coefficients to zero. The two-way capable variable equal to one predicted carriage perfectly for a number of observations so the estimation dropped that variable and the observations from the regression, resulting in the lower number of observations.
44
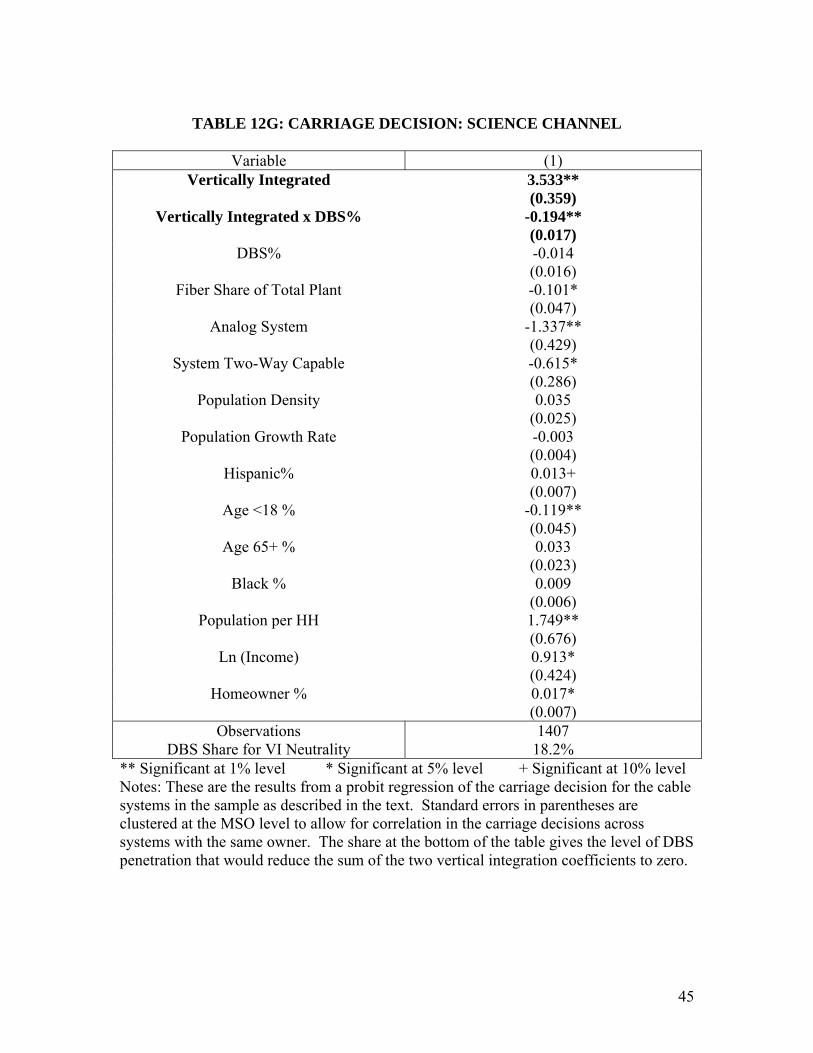
TABLE 12G: CARRIAGE DECISION: SCIENCE CHANNEL
Variable (1)
Vertically Integrated 3.533** (0.359)
Vertically Integrated x DBS% -0.194** (0.017)
DBS% -0.014 (0.016)
Fiber Share of Total Plant -0.101* (0.047)
Analog System -1.337** (0.429)
System Two-Way Capable -0.615* (0.286)
Population Density 0.035 (0.025)
Population Growth Rate -0.003 (0.004)
Hispanic% 0.013+ (0.007)
Age <18 % -0.119** (0.045)
Age 65+ % 0.033 (0.023)
Black % 0.009 (0.006)
Population per HH 1.749** (0.676)
Ln (Income) 0.913* (0.424)
Homeowner % 0.017* (0.007)
Observations DBS Share for VI Neutrality
1407 18.2%
** Significant at 1% level * Significant at 5% level + Significant at 10% level Notes: These are the results from a probit regression of the carriage decision for the cable systems in the sample as described in the text. Standard errors in parentheses are clustered at the MSO level to allow for correlation in the carriage decisions across systems with the same owner. The share at the bottom of the table gives the level of DBS penetration that would reduce the sum of the two vertical integration coefficients to zero.
45

TABLE 12H: CARRIAGE DECISION: STYLE
Variable (1) Vertically Integrated -0.035
(0.269) Vertically Integrated x DBS% -0.009
(0.008) DBS% -0.006
(0.006) Fiber Share of Total Plant -0.072
(0.112) Analog System -1.107
(0.570) System Two-Way Capable -0.680*
(0.293) Population Density -0.018
(0.018) Population Growth Rate -0.001
(0.003) Hispanic% 0.014*
(0.007) Age <18 % -0.047
(0.039) Age 65+ % -0.018
(0.016) Black % 0.004
(0.006) Population per HH -0.109
(0.557) Ln (Income) -0.168
(0.240) Homeowner % 0.005
(0.006) Observations
DBS Share for VI Neutrality 1407 0%
** Significant at 1% level * Significant at 5% level + Significant at 10% level Notes: These are the results from a probit regression of the carriage decision for the cable systems in the sample as described in the text. Standard errors in parentheses are clustered at the MSO level to allow for correlation in the carriage decisions across systems with the same owner. The share at the bottom of the table gives the level of DBS penetration that would reduce the sum of the two vertical integration coefficients to zero.
46

TABLE 12I: CARRIAGE DECISION: TRAVEL CHANNEL
Variable (1) Vertically Integrated 0.752+
(0.390) Vertically Integrated x DBS% 0.002
(0.008) DBS% -0.015*
(0.007) Fiber Share of Total Plant 0.140**
(0.051) Analog System -1.156**
(0.247) System Two-Way Capable 0.508+
(0.265) Population Density -0.014
(0.016) Population Growth Rate 0.002
(0.003) Hispanic% -0.005
(0.008) Age <18 % -0.004
(0.037) Age 65+ % -0.020
(0.013) Black % -0.012
(0.008) Population per HH -0.040
(0.451) Ln (Income) -0.315
(0.251) Homeowner % -0.009
(0.008) Observations
DBS Share for VI Neutrality 1407
-- ** Significant at 1% level * Significant at 5% level + Significant at 10% level Notes: These are the results from a probit regression of the carriage decision for the cable systems in the sample as described in the text. Standard errors in parentheses are clustered at the MSO level to allow for correlation in the carriage decisions across systems with the same owner. The share at the bottom of the table gives the level of DBS penetration that would reduce the sum of the two vertical integration coefficients to zero.
47
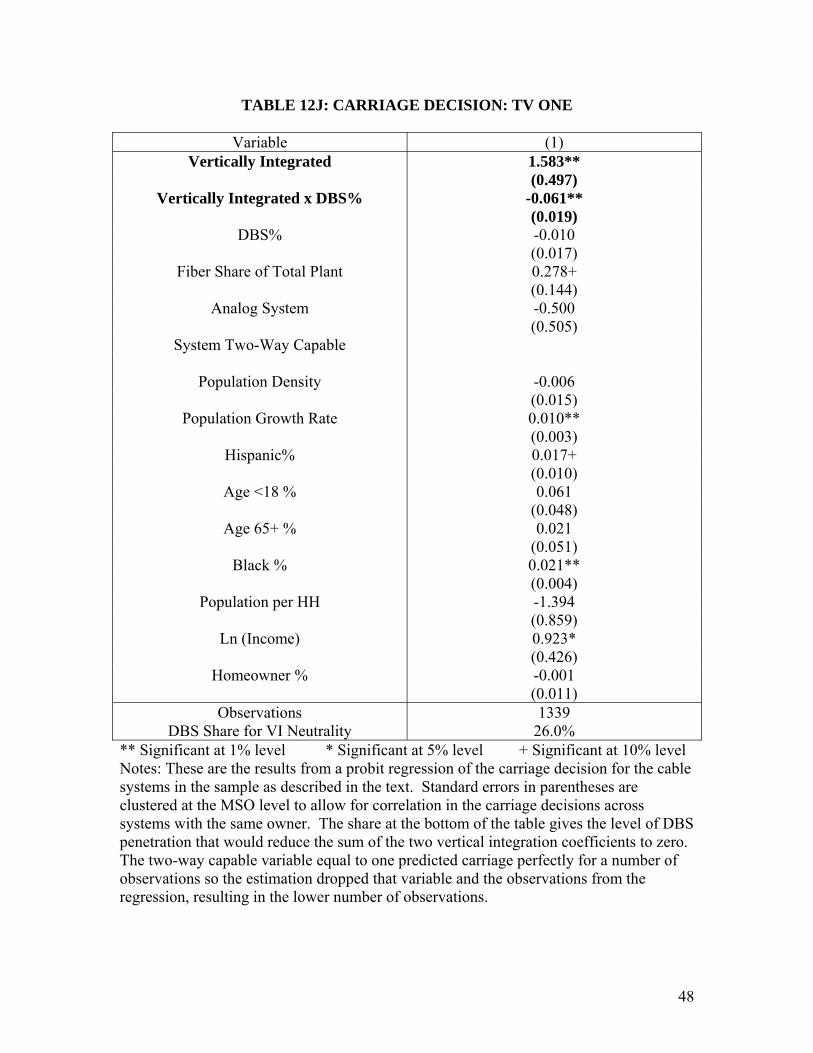
TABLE 12J: CARRIAGE DECISION: TV ONE
Variable (1) Vertically Integrated 1.583**
(0.497) Vertically Integrated x DBS% -0.061**
(0.019) DBS% -0.010
(0.017) Fiber Share of Total Plant 0.278+
(0.144) Analog System -0.500
(0.505) System Two-Way Capable
Population Density -0.006
(0.015) Population Growth Rate 0.010**
(0.003) Hispanic% 0.017+
(0.010) Age <18 % 0.061
(0.048) Age 65+ % 0.021
(0.051) Black % 0.021**
(0.004) Population per HH -1.394
(0.859) Ln (Income) 0.923*
(0.426) Homeowner % -0.001
(0.011) Observations
DBS Share for VI Neutrality 1339
26.0% ** Significant at 1% level * Significant at 5% level + Significant at 10% level Notes: These are the results from a probit regression of the carriage decision for the cable systems in the sample as described in the text. Standard errors in parentheses are clustered at the MSO level to allow for correlation in the carriage decisions across systems with the same owner. The share at the bottom of the table gives the level of DBS penetration that would reduce the sum of the two vertical integration coefficients to zero. The two-way capable variable equal to one predicted carriage perfectly for a number of observations so the estimation dropped that variable and the observations from the regression, resulting in the lower number of observations.
48
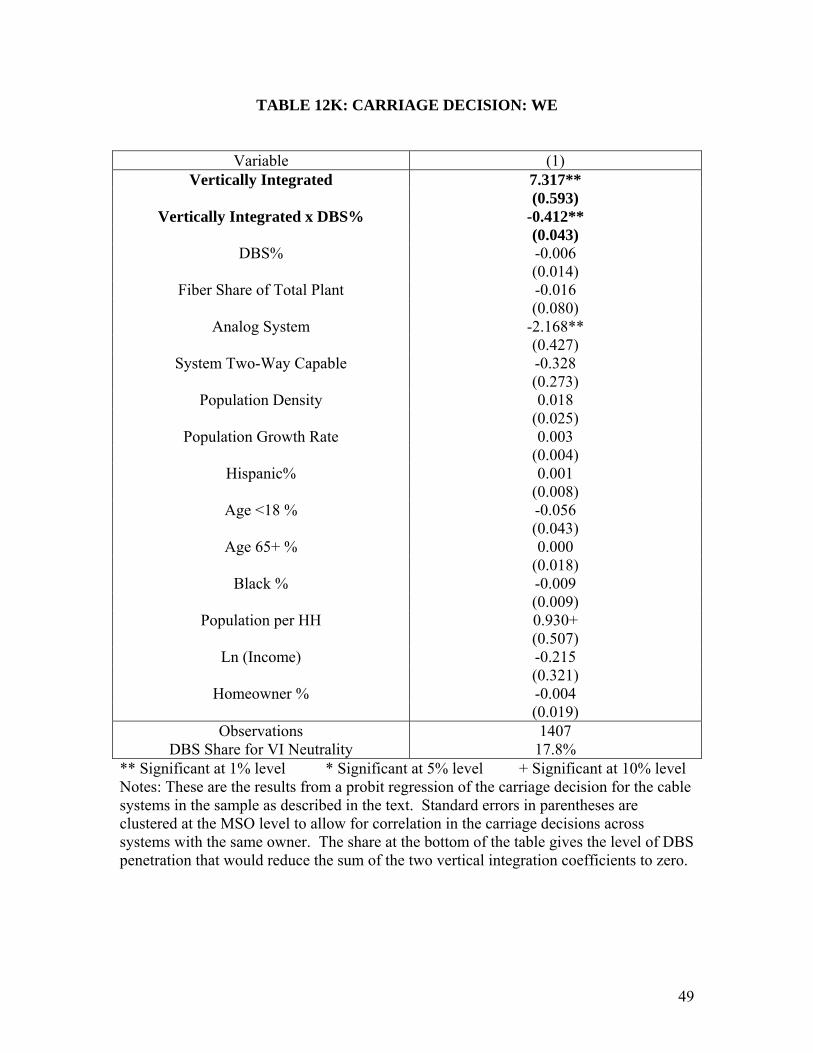
TABLE 12K: CARRIAGE DECISION: WE
Variable (1) Vertically Integrated 7.317**
(0.593) Vertically Integrated x DBS% -0.412**
(0.043) DBS% -0.006
(0.014) Fiber Share of Total Plant -0.016
(0.080) Analog System -2.168**
(0.427) System Two-Way Capable -0.328
(0.273) Population Density 0.018
(0.025) Population Growth Rate 0.003
(0.004) Hispanic% 0.001
(0.008) Age <18 % -0.056
(0.043) Age 65+ % 0.000
(0.018) Black % -0.009
(0.009) Population per HH 0.930+
(0.507) Ln (Income) -0.215
(0.321) Homeowner % -0.004
(0.019) Observations
DBS Share for VI Neutrality 1407
17.8% ** Significant at 1% level * Significant at 5% level + Significant at 10% level Notes: These are the results from a probit regression of the carriage decision for the cable systems in the sample as described in the text. Standard errors in parentheses are clustered at the MSO level to allow for correlation in the carriage decisions across systems with the same owner. The share at the bottom of the table gives the level of DBS penetration that would reduce the sum of the two vertical integration coefficients to zero.
49
BIBLIOGRAPHY Barth, David (2003), Essays on the economics of television program supply, Ph.D. Thesis, Northwestern University Becker, Gary S (1971), The Economics of Discrimination. Second edition. Chicago: University of Chicago Press. (August). Becker, Gary S. (1993), "Nobel Lecture: The Economic Way of Looking at Behavior." Journal of Political Economy 101(3): 385-409. Caves, Richard (2005), Switching Channels, Harvard University Press (Cambridge, Mass.). Chen, D., and D. Waterman (2006), “Vertical Ownership in Cable Television: A New Study of Program Network Carriage and Positioning,” Working paper for presentation at the TPRC annual conference, Sept. 29-Oct. 1, 2006, Washington, D.C. Chipty, Tasneem (2001). Vertical integration, market foreclosure, and consumer welfare in the cable television industry, The American Economic Review, 91 (3), 428-453. Crawford, Gregory (2000), "The Impact of the 1992 Cable Act on Household Demand and Welfare," The RAND Journal of Economics, Vol. 31, No. 3, 422-449. Autumn, 2000. Federal Communications Commission (Various), In the Matter of Annual Assessment of the Status of Competition in the Market for the Delivery of Video Programming, 2nd through 12th annual reports, 1995 to 2006. Ford, G. S. and J. D. Jackson (1997). “Horizontal Concentration and Vertical Integration in the Cable Television Industry.” Review of Industrial Organization 12(4): 501-518. Goolsbee, Austan and Amil Petrin (2004), "The consumer gains from direct broadcast satellites and the competition with cable TV," Econometrica 72 (2): 351-81 Kagan World Media (2006). Economics of Basic Cable Networks 2007. Carmel, CA: Kagan World Media. Kagan World Media (2005). Economics of Primetime Television 2005. Carmel, CA: Kagan World Media, 2005. Kang, Jun-Seok (2005), "Reciprocal Carriage of Vertically Integrated Cable Networks: An Empirical Study," working paper, Indiana University, August.
50

51
Motta, M. (2004). Competition Policy: Theory and Practice. Cambridge University Press, Cambridge, UK. Owen, B. M. and S. S. Wildman (1992). Video Economics. Cambridge, Massachusetts: Harvard University Press. Quigley Publishing Company (Various), International Television and Video Almanacs, 2000 – 2005. New York. Rey, P. and Tirole, J. (2005). A primer on foreclosure. In Armstrong, M. and Porter, R., editors, Handbook of Industrial Organization, volume 3. Elsevier Science, B.V., Amsterdam, forthcoming. Suzuki, Ayako (2006), "Vertical Integration in the U.S. Cable Industry" Discussion Paper 675, Osaka University. Waterman, D. and Weiss (1996), “The Effects of Vertical Integration Between Cable Television Systems and Pay Cable Networks.” Journal of Econometrics 72: 357-395. Waterman, D. and Weiss (1997), Vertical Integration in Cable Television, MIT Press (Cambridge, Mass.). Wegener, Richard and Richard Caves (2003), "Cable Networks and Cable Operators: Ownership Stakes and Decisions to Carry," Working Paper, Harvard University.