Embed Size (px)
Citation preview
1
Version 25 June 2015
UNEconomicCommissionforEurope
Expert Group on Resource Classification
DRAFT FOR PUBLIC COMMENT
Case Studies – Application of UNFC-2009 to Nuclear Fuel Resources Prepared by the Task Force on Application of UNFC-2009 to Nuclear Fuel Resources of
the ECE Expert Group on Resource Classification, under the coordination of Harikrishnan Tulsidas of the International Atomic Energy Agency
I. Introduction 1. The United Nations Framework Classification for Fossil Energy and Mineral Reserves and Resources 2009 (UNFC-2009) [1] can be applied to uranium and thorium resources. This marks an important step in the development of UNFC-2009. The Bridging Document between the “Red Book” (the Uranium Classification of the Organisation for Economic Co-operation and Development Nuclear Energy Agency (NEA) and the International Atomic Energy Agency (IAEA)) was endorsed by the United Nations Economic Commission for Europe (ECE) member States on 20 November during the annual meeting of the ECE Committee on Sustainable Energy held in Geneva, 19–21 November 2014, and subsequently issued [2]. 2. Bridging documents explain the relationship between UNFC-2009 and another classification system that has been agreed by the ECE Expert Group on Resource Classification as an aligned system. They incorporate instructions and guidance on how to classify estimates generated by application of that aligned system using the numerical codes of UNFC-2009. 3. Two international systems are used for classification and reporting of uranium and thorium deposits, the “Red Book” [3] and the Committee for Mineral Reserves International Reporting Standards (CRIRSCO) Template for solid minerals [4]. UNFC-2009, unlike other systems, covers the total resource base, including quantities that are not currently economic and the ‘unrecoverable’ part of the deposits. Exploration Results, Mineral Resources and Mineral Reserves for uranium and thorium deposits prepared under the CRIRSCO family of aligned codes and standards, can now be mapped to UNFC-2009 by applying the Bridging Document that already exists between the CRIRSCO Template and UNFC-2009. Understanding the total resource base is important for Governments in managing their national resources. II. Application of UNFC-2009 to Uranium and Thorium Resources -
Case studies 4. The eight case studies (A - H) that follow were prepared to demonstrate that estimated quantities of uranium and thorium resources can be transparently transferred to UNFC-2009. A. Case Study – Uranium Exploration and Mining in the Yili Basin, China 5. This case study was prepared by Mr. Li Shengxiang and Mr. Yu Hengxu of the China National Nuclear Corporation (CNNC). It provides considerations related to the application of

UNFC-2resourceResourcbe transpgiven toclassific 6. is a Mes(Figure Figure 1Geologi
Legend:PlioceneProterozboundarZhajistan
7. Shuixigo(J1-2sh) cFormatio 8. 1960s, th
2009 to estimes of this basces Classificaparently map the possible
cation system
The Yili Basso-Cenozoic 1). The coor
1 cal map of th
1-Holocenee; 6-Eocene-zoic; 12-Hercry of the basin Deposit; M
The uraniumou Group (J1can be furtheon (J1s) and
Uranium prohe prospectin
mates of uranin were orig
ation Systempped and trane developmen
ms.
sin, situated intermounta
rdinates of th
he Yili Basin
e; 2-Upper PlOligocene; 7cynian granitin; 18-U Dep
M-Mengqigue
m mineralizat1-2sh), the Lr divided intXishanyao F
ospecting wong focused o
nium resourceinally classif
m (CMRRCS)nsferred to Unt of a Bridg
in the westerain basin devehe centre of th
n
leistocene-H7-Jurassic; 8-te; 13-fault;
posit; 19-U oer Deposit; D
tion is mainlyower-Middleo three form
Formation (J2
ork began in on coal-type u
es in the Yilified accordin) and this cas
UNFC-2009.ging Docume
rn part of theeloped on thhe Yili Basin
Holocene; 3-M-Triassic; 9-U14-inferred f
occurrence; KD-Daladi Dep
y hosted in te Jurassic (F
mations, name2x) [5, 6].
this region inuranium reso
i Basin, Nortng to the Chise study demIn this conte
ent between t
e Tianshan The basement on are E81°05
Middle PleistUpper Paleozfault; 15-bur
K-Kujiertai dposit; H-Hon
the coal-bearigure 1). Theely, Badaowa
n the early 1ources; two c
th West Chinna Mineral R
monstrates thaext, considerathe CMRRCS
Tectonic Beltof an old Pre5, N43°50.
tocene; 4-Lowzoic; 10-Lowied fault; 16-
deposit; W-Wnghaigou De
ring clastic roe ore-hostingan Formation
950s. Duringcoal-type dep
na. The uraniReserves andat the quantitation may noS and UNFC
t, North Wesecambrian bl
wer Pleistocwer Paleozoi-unconformi
Wukuerqi Depeposit.
ocks of the g Shuixigou n (J1b), Sang
g the 1950s aposits – the D
2
ium d ties may ow be C-2009
t China, ock
ene; 5-c; 11-ity; 17-posit; Z-
Group gonghe
and Daladi
3
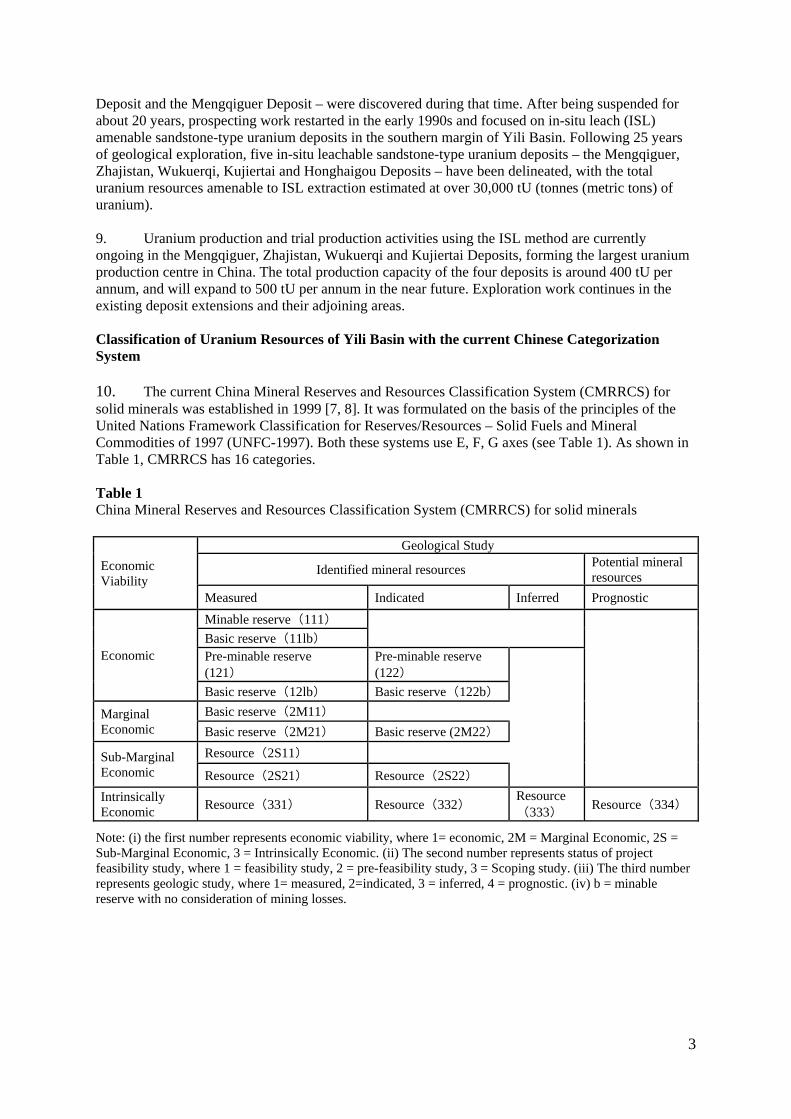
Deposit and the Mengqiguer Deposit – were discovered during that time. After being suspended for about 20 years, prospecting work restarted in the early 1990s and focused on in-situ leach (ISL) amenable sandstone-type uranium deposits in the southern margin of Yili Basin. Following 25 years of geological exploration, five in-situ leachable sandstone-type uranium deposits – the Mengqiguer, Zhajistan, Wukuerqi, Kujiertai and Honghaigou Deposits – have been delineated, with the total uranium resources amenable to ISL extraction estimated at over 30,000 tU (tonnes (metric tons) of uranium). 9. Uranium production and trial production activities using the ISL method are currently ongoing in the Mengqiguer, Zhajistan, Wukuerqi and Kujiertai Deposits, forming the largest uranium production centre in China. The total production capacity of the four deposits is around 400 tU per annum, and will expand to 500 tU per annum in the near future. Exploration work continues in the existing deposit extensions and their adjoining areas. Classification of Uranium Resources of Yili Basin with the current Chinese Categorization System 10. The current China Mineral Reserves and Resources Classification System (CMRRCS) for solid minerals was established in 1999 [7, 8]. It was formulated on the basis of the principles of the United Nations Framework Classification for Reserves/Resources – Solid Fuels and Mineral Commodities of 1997 (UNFC-1997). Both these systems use E, F, G axes (see Table 1). As shown in Table 1, CMRRCS has 16 categories. Table 1 China Mineral Reserves and Resources Classification System (CMRRCS) for solid minerals
Economic Viability
Geological Study
Identified mineral resources Potential mineral resources
Measured Indicated Inferred Prognostic
Economic
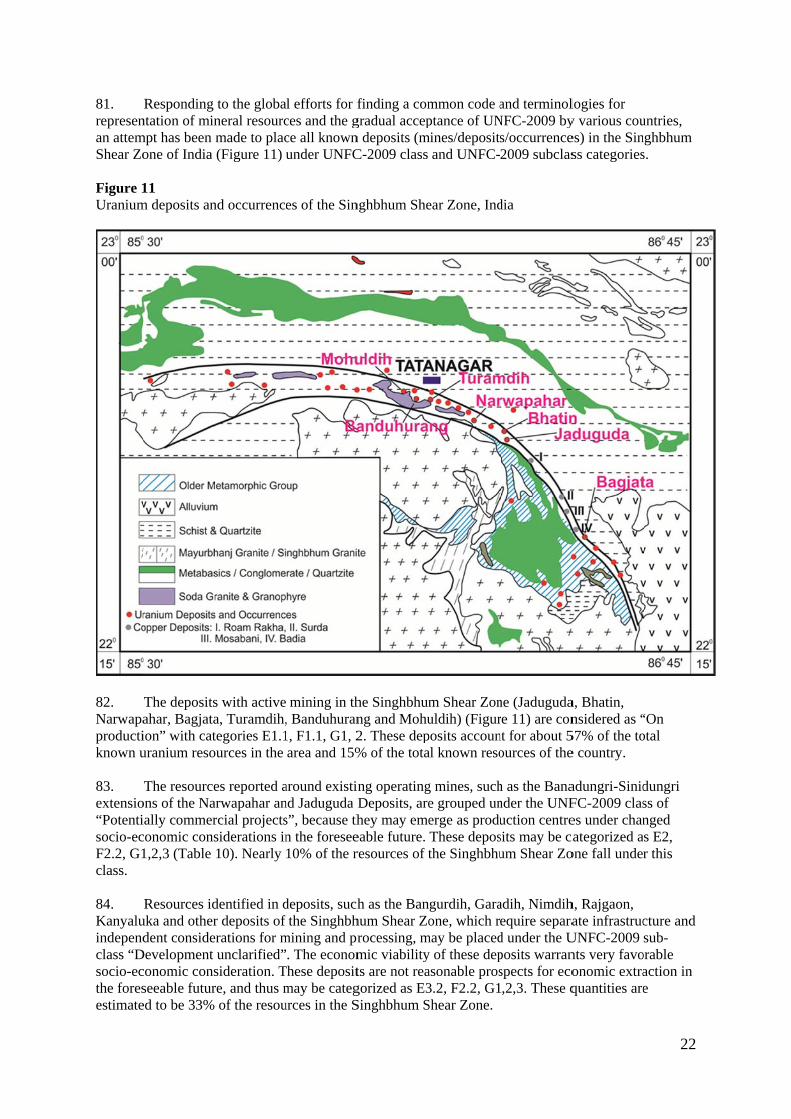
Minable reserve(111)
Basic reserve(11lb) Pre-minable reserve (121)
Pre-minable reserve (122)
Basic reserve(12lb) Basic reserve(122b)
Marginal Economic
Basic reserve(2M11)
Basic reserve(2M21) Basic reserve (2M22)
Sub-Marginal Economic
Resource(2S11)
Resource(2S21) Resource(2S22)
Intrinsically Economic
Resource(331) Resource(332) Resource(333)
Resource(334)
Note: (i) the first number represents economic viability, where 1= economic, 2M = Marginal Economic, 2S = Sub-Marginal Economic, 3 = Intrinsically Economic. (ii) The second number represents status of project feasibility study, where 1 = feasibility study, 2 = pre-feasibility study, 3 = Scoping study. (iii) The third number represents geologic study, where 1= measured, 2=indicated, 3 = inferred, 4 = prognostic. (iv) b = minable reserve with no consideration of mining losses.

4
11. The mapping of CMRRCS to UNFC-2009 is shown in Table 2. Table 2 Mapping of CMRRCS to UNFC-2009 Categories
No CMRRCS UNFC-2009 E F G E F G 1 Economic Measured Minable reserve 1 1 1 1 1 1 2 Economic Measured Basic reserve 1 1 1b 1 1 1 3 Economic Measured Pre-minable reserve 1 2 1 1 1.2, 1.3 1 4 Economic Measured Basic reserve 1 2 1b 1 1.2; 1.3 1 5 Economic Indicated Pre-minable reserve 1 2 2 1 1.2; 1.3 2 6 Economic Indicated Basic reserve 1 2 2b 1 1.2; 1.3 2 7 Marginal Economic Measured Basic Reserve 2M 1 1 2 2.1 1 8 Marginal Economic Measured Basic Reserve 2M 2 1 2 2.1 1 9 Marginal Economic Indicated Basic Reserve 2M 2 2 2 2.1 2 10 Sub-Marginal Economic Measured Basic reserve 2S 1 1 2 2.2 1 11 Sub-Marginal Economic Measured Basic reserve 2S 2 1 2 2.2 1 12 Sub-Marginal Economic Indicated Basic reserve 2S 2 2 2 2.2 2 13 Intrinsically Economic Measured Resource 3 3 1 2; 3.2; 3.3 2.1; 2.2; 2.3 1 14 Intrinsically Economic Indicated Resource 3 3 2 2; 3.2; 3.3 2.1; 2.2; 2.3 2 15 Intrinsically Economic Inferred Resource 3 3 3 2; 3.2; 3.3 2.1; 2.2; 2.3 3 16 Intrinsically Economic Prognostic Resource 3 3 4 3.2 3 4
12. Classification of the uranium resources of the Yili Basin was undertaken according to the mapping of CMRRCS to UNFC-2009 that is shown in Table 2 and results are shown in Table 3. Table 3 Classification of the Uranium Resources of the Yili Basin
Deposits UNFC-2009 Class UNFC-2009 Sub-Class
UNFC-2009 Categories
CMRRCS
Mengqiguer-2 (sandstone type)
Commercial Projects On production E1.1 F1.1 G2, E1.1 F1.1 G3
122b, 332a 333
Mengqiguer-1 (coal type)
Non Commercial Projects
Development not viable
E3.3 F2.3 G2, E3.3F2.3G3
332 333
Kujiertai Commercial Projects On production E1.1 F1.1 G1, E1.1 F1.1 G2, E1.1 F1.1 G3
121b, 122b, 332* 333
Zhajistan Commercial Projects On production E1.1 F1.1 G1 E1.1 F1.1 G2, E1.1 F1.1 G3
121b, 122b, 332* 333
Wukuerqi Commercial Projects On production E1.1 F1.1 G2, E1.1 F1.1 G3
122b, 332* 333
Daladi Non Commercial Projects
Development not viable
E3.3 F2.3 G2, E3.3 F2.3 G3
332 333
Honghaigou Potentially Commercial Projects
Development Pending E2 F2.1 G3 333
a Because detailed feasibility studies (DFS) or pre-feasibility studies (PFS) for the development of the deposit were done in the central area of the deposit and did not cover the extension area, the resources of the extension part of the deposit have not been converted into 122b from 332 in the existing CMRRCS report.

5
Application of UNFC 2009 to uranium deposits of the Yili Basin (a) Mengqiguer Deposit 13. The Mengqiguer Deposit is the largest uranium deposit in the Yili Basin. The deposit accounts for about 45 per cent of the total uranium resources of the Basin. The uranium ore bodies are mostly hosted in the Xishanyao Formation and the Sangonghe Formation. 14. The uranium mineralization discovered during the 1950s and 1960s was found to be hosted in coal beds (named as Mengqiguer-1). The quantity is small. Since this material is difficult to process, this kind of coal type uranium mineralization is considered as “Development not viable” with categories E3.3 F2.3 G2, E3.3 F2.3 G3 (Table 3). 15. The uranium mineralization discovered after 2000 was found in permeable sandstone layers, which allows the uranium to be extracted with the ISL method (named as Mengqiguer-2). The ISL-amenable uranium resources of the deposit account for about 43 per cent of the total resources of the basin. Since the on-going trial uranium production with the ISL method in the deposit shows positive commercial results, this type of sandstone type uranium mineralization is considered as “On production” with categories E1.1 F1.1 G2, E1.1 F1.1 G3 (Table 3). More geological work needs to be carried to increase the geological confidence of these resources. (b) Kujiertai Deposit 16. The Kujiertai Deposit is the second largest uranium deposit, the first ISL-mining uranium deposit in the Yili Basin, and also the first commercial ISL uranium production centre in China. The deposit accounts for about 23 per cent of total uranium resources of the basin. It was discovered in early1990s and the uranium ore bodies are mostly hosted in the permeable sandstone layers of the Xishanyao Formation and the Badaowan Formation. The uranium production of the deposit began in middle of 1990s using the ISL method. The uranium mineralization is considered as “On production” with categories E1.1 F1.1 G1, E1.1 F1.1 G2, E1.1 F1.1 G3. (c) Zhajistan Deposit 17. The uranium ore bodies of the Zhajistan Deposit are mostly hosted in the Xishanyao Formation and the Sangonghe Formation with the uranium resources constituting about 10 per cent of the total resources of the basin. The uranium mineralization is hosted in permeable sandstone layers and is being mined with the ISL method, in which case the uranium resources are considered as “On production” with categories E1.1F1.1G1, E1.1F1.1G2, E1.1F1.1G3. (d) Wukuerqi Deposit 18. The uranium ore bodies of the Wukuerqi Deposit are mostly hosted in the Xishanyao Formation and the Sangonghe Formation with the uranium resources constituting about 7 per cent of the total uranium resources of the basin. The uranium mineralization is hosted in permeable sandstone layers and is being mined with the ISL method, so the uranium resources are considered as “On production” with categories E1.1 F1.1 G2, E1.1 F1.1 G3. However, more geological work needs to be carried out to increase its geologic confidence. (e) Daladi Deposit 19. The Daladi Deposit is the earliest discovered uranium deposit in the Yili Basin. The uranium ore bodies are mostly hosted in the Xishanyao Formation and the Sangonghe Formation with the uranium resources being less than 3 per cent of the total resources of the Basin. The uranium mineralization is hosted in the coal beds and is difficult to process, so these uranium resources are considered as “Development not viable” with categories E3.3F2.3G2, E3.3F2.3G3.

6
(f) Honghaigou Deposit 20. The Honghaigou Deposit is a new deposit that was discovered in recent years, and the exploration and the pre-feasibility studies are still ongoing in the deposit. The uranium ore bodies are mostly hosted in the Upper Jurassic and the Xishanyao Formation with the uranium resources constituting about 12 per cent of the total resources of the basin. The uranium mineralization is classified into “333” in the current CMRRCS. However, considering that the uranium mineralization is hosted in permeable sandstone with similar mineralization characteristics to that of the Kujiertai Deposit, and that the deposit can be mined using the ISL method, the uranium resources are considered as “Development Pending” with categories E2 F2.1 G3. Conclusions 21. From this case study on the application of UNFC-2009 to the uranium resources in the Yili Basin, it can be concluded that if a comprehensive consideration of the project socio-economic viability and project status and feasibility is undertaken, the mapping of CMRRCS Classes to UNFC-2009 Classes will be relatively easy and straight forward. UNFC-2009, in particular with its Sub-classes, is a very useful uranium resources categorization tool because it can provide an overall picture of a uranium project. Additionally, UNFC-2009 can express the project more comprehensively and more precisely than UNFC-1997 and CMRRCS, especially in relation to project status and feasibility. B. Case Study – Application of UNFC-2009 to the uranium resources of the Azelik Deposit, Niger 22. This case study was prepared by Mr. Li Shengxiang of the China National Nuclear Corporation (CNNC) 23. The Azelik Uranium Deposit is located in the north-western region of Niger. It is a sandstone-type uranium deposit hosted in the Cretaceous strata of the Tim Mersoï Basin. Based on the geological survey, core observation and documentation, the uranium mineralization is related to hydrothermal fluid flow [9]. 24. In 2006, the China National Nuclear Corporation acquired the project and conducted an estimation of the uranium resources through application of the China Mineral Reserves and Resources Classification System (CMRRCS). The resource estimation was carried out prior to the Definitive Feasibility Study (DFS) being undertaken. In 2008, China National Nuclear Corporation completed the DFS for the project, following which construction of the mine began. 25. The aggregate uranium resources estimation according to CMRRCS before carrying out the DSF was 13,692 tonnes of uranium (tU). After completing the DFS, the aggregate resources according to CMRRCS were estimated to be 12,763 tU (Table 4), with the decrease caused by excluding some high-cost resources.
7
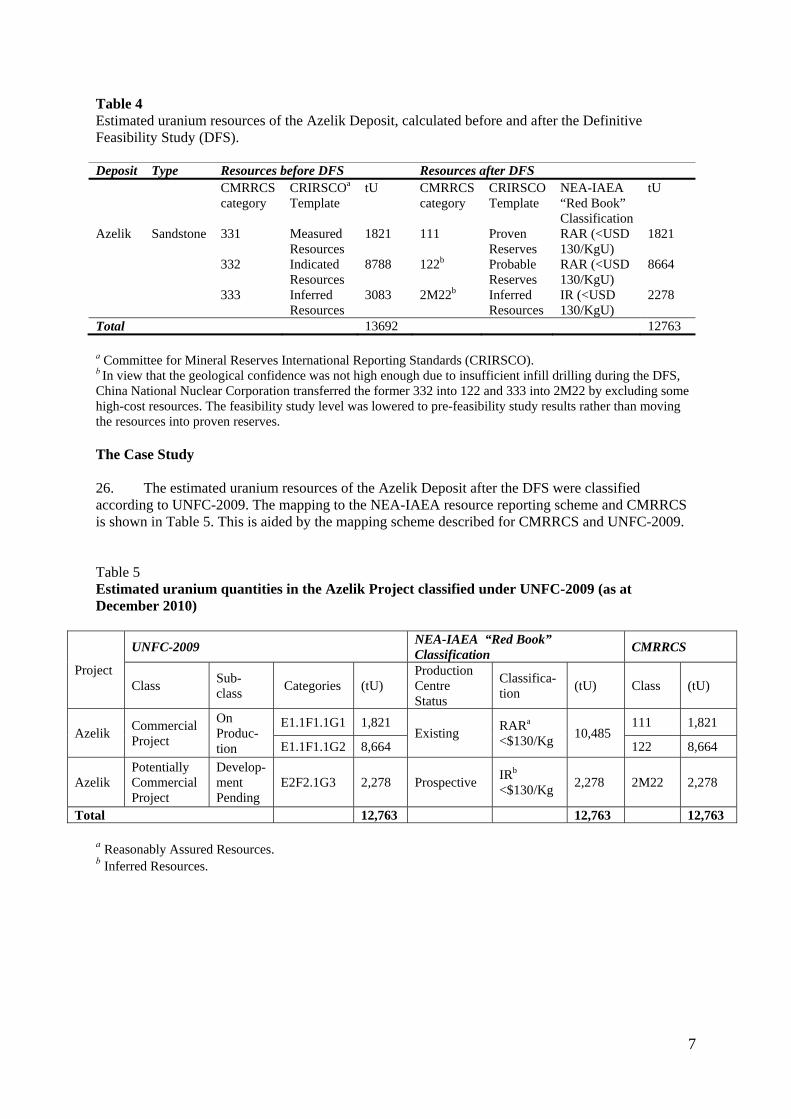
Table 4 Estimated uranium resources of the Azelik Deposit, calculated before and after the Definitive Feasibility Study (DFS). Deposit Type Resources before DFS Resources after DFS CMRRCS
category CRIRSCOa Template
tU CMRRCS category
CRIRSCO Template
NEA-IAEA “Red Book” Classification
tU
Azelik Sandstone 331 Measured Resources
1821 111 Proven Reserves
RAR (<USD 130/KgU)
1821
332 Indicated Resources
8788 122b Probable Reserves
RAR (<USD 130/KgU)
8664
333 Inferred Resources
3083 2M22b Inferred Resources
IR (<USD 130/KgU)
2278
Total 13692 12763
a Committee for Mineral Reserves International Reporting Standards (CRIRSCO). b In view that the geological confidence was not high enough due to insufficient infill drilling during the DFS, China National Nuclear Corporation transferred the former 332 into 122 and 333 into 2M22 by excluding some high-cost resources. The feasibility study level was lowered to pre-feasibility study results rather than moving the resources into proven reserves. The Case Study 26. The estimated uranium resources of the Azelik Deposit after the DFS were classified according to UNFC-2009. The mapping to the NEA-IAEA resource reporting scheme and CMRRCS is shown in Table 5. This is aided by the mapping scheme described for CMRRCS and UNFC-2009. Table 5 Estimated uranium quantities in the Azelik Project classified under UNFC-2009 (as at December 2010)
Project
UNFC-2009 NEA-IAEA “Red Book” Classification
CMRRCS
Class Sub-class
Categories (tU) Production Centre Status
Classifica-tion
(tU) Class (tU)
Azelik Commercial Project
On Produc-tion
E1.1F1.1G1 1,821 Existing
RARa
<$130/Kg 10,485
111 1,821
E1.1F1.1G2 8,664 122 8,664
Azelik Potentially Commercial Project
Develop-ment Pending
E2F2.1G3 2,278 Prospective IRb <$130/Kg
2,278 2M22 2,278
Total 12,763 12,763 12,763 a Reasonably Assured Resources. b Inferred Resources.

8
Conclusions 27. In this Case Study the cost categories as used in the NEA-IAEA “Red Book” classification are also used for each of the Classes. This example shows that mapping of the existing CMRRCS categories and quantities to the NEA-IAEA “Red Book” Classification and UNFC-2009 can be completed in a straightforward manner. 28. Even though the mapping of UNFC-2009 to CMRRCS has been defined only at a class level, the use of sub-classes – as in this case study – can add further information about the project and application of the UNFC-2009 principles and generic specifications. Thus, the full granularity of UNFC-2009 can be applied to derive maximum benefits. Observations, Conclusions and Recommendations 29. The work undertaken in preparing case studies A (Yili Basin, China) and B (Azelik Uranium Deposit, Niger) usefully demonstrates that quantities can be transparently transferred to UNFC-2009 from CMRRCS. 30. The Yili Basin case study highlighted issues related to the use of UNFC-2009 for In-situ Leaching (ISL). It was noted that there are examples in Australia, Kazakhstan and USA where the CRIRSCO Template is applied to ISL projects. In some cases this can generate debate due to the fact that the recovery factor is usually a major uncertainty. Application of UNFC-2009 can facilitate representation of this uncertainty through use of the G-axis categories. 31. The Azelik Uranium Deposit case study demonstrates that mapping of the existing CMRRCS categories and quantities to the NEA-IAEA “Red Book” Classification and UNFC-2009 can be carried out in a straightforward manner. 32. Even though the mapping of UNFC-2009 to CMRRCS has been defined only at a Class level, the use of Sub-classes – as in the Azelik Uranium Deposit case study – can add further information about the project and application of the UNFC-2009 principles and generic specifications. Hence, the full granularity of UNFC-2009 can be applied to derive maximum benefits. 33. The two case studies serve to confirm that there would appear to be a straightforward relationship between the CMRRCS Classes and the UNFC-2009 Classes and hence consideration may now be given to the development of a formalized Bridging Document between the two systems. C. Case Study - Application of UNFC-2009 to the uranium resources of Argentina 34. The case study was prepared by Mr. Luis López, National Atomic Energy Commission, Argentina. 35. Historically, uranium resources in Argentina have been classified and reported according to the NEA-IAEA resource reporting scheme (the “Red Book”) [3]. 36. In 2011, the National Atomic Energy Commission of Argentina (CNEA) reported about 20,000 tonnes of uranium (tU) as Identified Resources (Reasonably Assured Resources + Inferred Resources) for the production cost category <130 USD/kgU. In addition, about 11,000 tU of Canadian National Instrument 43-101 [10] certified resources have been reported in recent years by public mining companies [11, 12] (Figure 2). The total uranium resources of Argentina are thus approximately 31,000 tU in the aforementioned Identified Resources category (see Table 6). 37. UNFC-2009 allows the documentation and reporting of these uranium resources of the country. UNFC-2009, in addition to providing the project maturity of resources, considers social and

9
economic issues, including regulatory, legal and market conditions imposed by governments and markets, domestic demand, technological and industrial progress and the ever-present uncertainty. Table 6 Uranium Identified Resources in Argentina according to the NEA-IAEA classification scheme
Deposit Type RAR tU ≤ USD 130/kgU
IR tU ≤ USD 130/kgU
Sierra Pintada (CNEA)
Volcanic-related 3,900 6,110
Cerro Solo (CNEA)
Sandstone- hosted 4,420 4,810
Don Otto (CNEA)
Sandstone- hosted 130 300
Laguna Colorada (CNEA)
Volcanic-related 100 60
Laguna Salada (U3O8 Corporation)
Surficial 2,420 1,460
Meseta Central (UrAmerica Ltd)
Sandstone- hosted - 7,350
Sub Total
10,970 tU 20,090 tU
Total 31,060 tU
RAR – Reasonably Assured Resources IR – Inferred Resources 38. For the uranium resources of different projects of CNEA and mining companies, the criteria of UNFC-2009 concerning social and economic viability (E), technical feasibility (F) and geological knowledge (G) were defined at the sub-category level and grouped into major classes considered in this classification system, as shown in Table 7 [2]. 39. The identified uranium resources in Argentina are mostly located in the provinces of Chubut and Mendoza. These are areas where no metallic mineral mining projects are in operation. In addition, legislation is in place that markedly restricts uranium production, which needs to be taken into account when studying the social viability of the projects. In Chubut, projects need to wait for the Chubut provincial territory zoning provisions of Law 5001/2003, as well as the introduction of a mining regulatory framework for this jurisdiction [13]. Moreover, the operation of uranium mining and processing in Sierra Pintada will require major changes to the legislation, such as permitting of open pit mining and the use of sulphuric acid, both which are currently forbidden by Law 7722/2007 [14].

10
Table 7 Uranium Resources in Argentina shown according to UNFC-2009 and NEA-IAEA classifications
Project UNFC-2009 Class
UNFC-2009 Sub-class
UNFC-2009 Categories
Resources (tU)
NEA-IAEAProduction Centre Status
NEA-IAEA Classification
Resources (tU)
Total (tU)
Cerro Solo
Potentially Commer-cial Projects
Develop-ment Pending
E2 F2.1 G1
2,420
Prospective
RAR <$130/Kg
4,420 9,230
E2 F2.1 G2
2,000
E2 F2.1 G3
4,810 IR <$130/Kg
4,810
Sierra Pintada
Potentially Commer-cial Projects
Develop-ment on Hold
E2 F2.2 G1
2,700
Prospective
RAR <$130/Kg
3,900 10,010
E2 F2.2 G2
1,200
E2 F2.2 G3
6,110 IR <$130/Kg
6,110
Laguna Salada
Non Commer-cial Projects
Develop-ment Unclarif-ied
- -
Unclarified
RAR <$130/Kg
2,420 3,880
E3.2 F2.2 G2
2,420
E3.2 F2.2 G3
1,460 IR <$130/Kg
1,460
Meseta Central
Non Commer-cial Projects
Develop-ment Unclarif-ied
- -
Unclarified
RAR <$130/Kg
- 7,350 - -
E3.2 F2.2 G3
7,350 IR <$130/Kg
7,350
Don Otto
Non Commer-cial Projects
Develop-ment Unclarif-ied
E3.2 F2.2 G1
70
Unclarified
RAR <$130/Kg
130 430
E3.2 F2.2 G2
60
E3.2 F2.2 G3
300 IR <$130/Kg
300
Laguna Colorada
Non Commer-cial Projects
Develop-ment not Viable
E3.3 F2.3 G1
80
Not Viable
RAR <$130/Kg
100 160
E3.3 F2.3 G2
20
E3.3 F2.3 G3
60 IR <$130/Kg
60
40. To define the economic feasibility of CNEA’s projects, uranium prices in the international market are taken as a reference, not as a determining factor, considering that the raw material has a bearing of five to seven per cent in the total cost of nuclear energy in the country. Argentina so far has not pursued the objective to obtain dividends from the sale of uranium in international markets. For domestic use uranium is imported, which has implications for security of supply. 41. In recent years, an increase in exploration efforts has led to a significant increase in uranium resources and their level of knowledge, especially in the San Jorge Basin, which extends over about 180,000 km2 and hosts not only important uranium deposits, but also oil and gas resources. 42. In the Cerro Solo Deposit (Chubut Province), tonnage and grade estimated is expected to ensure sustained uranium production in the future. This blind deposit was discovered in 1971 and

11
since then, exploration and evaluation drilling programs have amounted to 100,700 metres. It is located in Cretaceous fluvial sandstones and conglomerates of the Chubut Group. In this paleochannel structure, the mineralized levels are 0.5 – 6 metres wide and 50 – 130 metres deep. The identified resources are 9,230 t U at approximately 0.2 % U, included in the < USD 130/Kg U production cost category [cost category as applied in [2]). The reported resources correspond to the two most studied mineralized bodies and the available geological knowledge indicates very good perspectives to develop new uranium resources in this mining property [15, 16, 17, 18] (Figure 3). 43. Currently, a programme to complete the feasibility study of the Cerro Solo Deposit is being carried out. As background, in 1997 the CNEA retained NAC International to complete a pre-feasibility study of the Cerro Solo uranium deposit, including geological model revision and ore reserves estimate, mining and milling methods and their costs, cash flow and risk analysis [19]. Also, the social-environmental baseline is being surveyed in cooperation with national universities and research councils. 44. Regarding by-products, it can be mentioned that though economic recovery of molybdenum has not been defined for the Cerro Solo Deposit, the potential economic benefits of income from this process justify further research and evaluation in both the extent of molybdenum reserves and its recovery. In addition, anomalous assays of rhenium were detected in Cerro Solo, and its potential should be the subject of further research. 45. The Sierra Pintada uranium deposit (Mendoza Province) belongs to the volcanic-related model, where mineralization is localized in Permian formations associated with synsedimentary acid volcanism [20, 21]. 46. The level of uncertainty in the estimation of remaining resources in Sierra Pintada is medium to high, which are evaluated to be 10,010 t U recoverable at a production cost below USD 130/Kg U [22]. 47. This deposit has been the focus of the most important uranium exploitation in the country, with a total production of 1,600 t U from 1975 to 1997, when the mining-milling facility was put in stand-by status for economic reasons. Therefore, feasibility has been partially demonstrated by the fact that this deposit was previously in operation, using an acid heap-leaching mining method. However, other alternatives have been considered for possible future production, including the use of alkaline leaching [23], bioleaching [24] and vat leaching [25] (Figure 4). 48. The Laguna Salada project (Chubut Province) includes the Guanaco and Lago Seco areas, corresponding to a surficial uranium-vanadium deposit. Mineralization occurs within 3 metres from the surface in soft, unconsolidated gravel. Uranium Identified Resources have been evaluated at 3,880 tU at grades ranging between 55 and 72 ppm U, while vanadium Identified Resources have been evaluated at 21,330 tV at grades ranging from 308 to 330 ppm V. 49. Initial metallurgical results show uranium and vanadium grades are increased between 3 and 11 times by simple screening, followed by rapid uranium-vanadium extraction using alkaline leaching in the Guanaco area of the deposit, while acid leach is very effective in the Lago Seco area. 50. Recently, U3O8 Corp has reported a favorable Preliminary Economic Assessment (PEA) for the Laguna Salada Deposit (Figure 5), based on previous NI 43-101 report, taking into consideration U-V comprehensive extraction. However, it can be considered that the PEA includes around 40% inferred resources; to the extent that follow up exploration activities can increase resources and their geological knowledge, the project could move to a UNFC-2009 class of Potentially Commercial Projects [26, 27]. 51. Meseta Central project (Chubut Province) is located in the vicinity of Cerro Solo and comprises the Graben, Plateau West and Plateau East deposits. Uranium mineralization is hosted by

12
siltstones, sandstones and conglomerates of the fluvial and lacustrine origin of the Cretaceous-aged Los Adobes Formation. Mineralized layers lie between 40 and 140 metres beneath the surface, are flat-lying or very gently dipping, and are up to 15 metres in thickness [28]. The total Inferred Resources for the project are 7,350 t U at an average grade of 260 ppm U. These resources used data from two drilling campaigns comprising 178 boreholes for a total of 21,450 metres of drilling. Boreholes are mostly on a 200 by 200 metres grid. As reported by UrAmerica Ltd., about 75% of the uranium resources evaluated are placed in confined aquifers layers. Therefore, further geological and hydrological studies will be addressed to determine the amenability to in situ leaching mining. The results of these studies could play a relevant role regarding the socio-economic viability of this project (Figure 6). 52. The Don Otto (Salta Province) Uranium Deposit is a tabular U-V subtype, occurring in the Cretaceous Yacoraite Formation of the Salta Basin; this basin covers approximately 150,000 ha, and is also known for its oil and gas potential. Don Otto was in operation from 1963 to 1981 and produced 201 t of U at 0.1%-0.2% U grade [29, 30]. When mapping to the E, F and G axes, the Don Otto Deposit is classified as a "non-commercial project" where development is not clarified. However, it should be highlighted that as this Deposit was previously in operation and current exploration/evaluation studies yielded very encouraging results, it could be possible in the future to move the project to a higher UNFC-2009 class. Additionally, enlargement of the mining property and resource augmentation are considered key factors to ensure the project feasibility. A comprehensive study that includes updating EIA reports, block-leaching research and development studies, feasibility of underground extraction, use of mobile ionic exchange plant, and uranium recovery from the former heaps and remediation of the site, are all factors that would aim in the same direction of increasing project viability [31, 32] (Figure 7). 53. The limited resources of Laguna Colorada (Chubut Province) [16] make it difficult to envisage extraction at present, unless the characteristics of the ore will allow treatment in a plant that may in the future be located in the area of Cerro Solo (Figure 8). 54. Ultimately, the Cerro Solo project appears to be the most promising uranium project in Argentina, and with realistic assumptions of possible market conditions and obtaining social license, there are prospects for extraction in the near future. 55. The application of UNFC-2009 as a complement to the NEA-IAEA Classification contributes to both a better understanding of the availability of reliable resources in Argentina as well as how these resources can contribute to the national nuclear energy program.
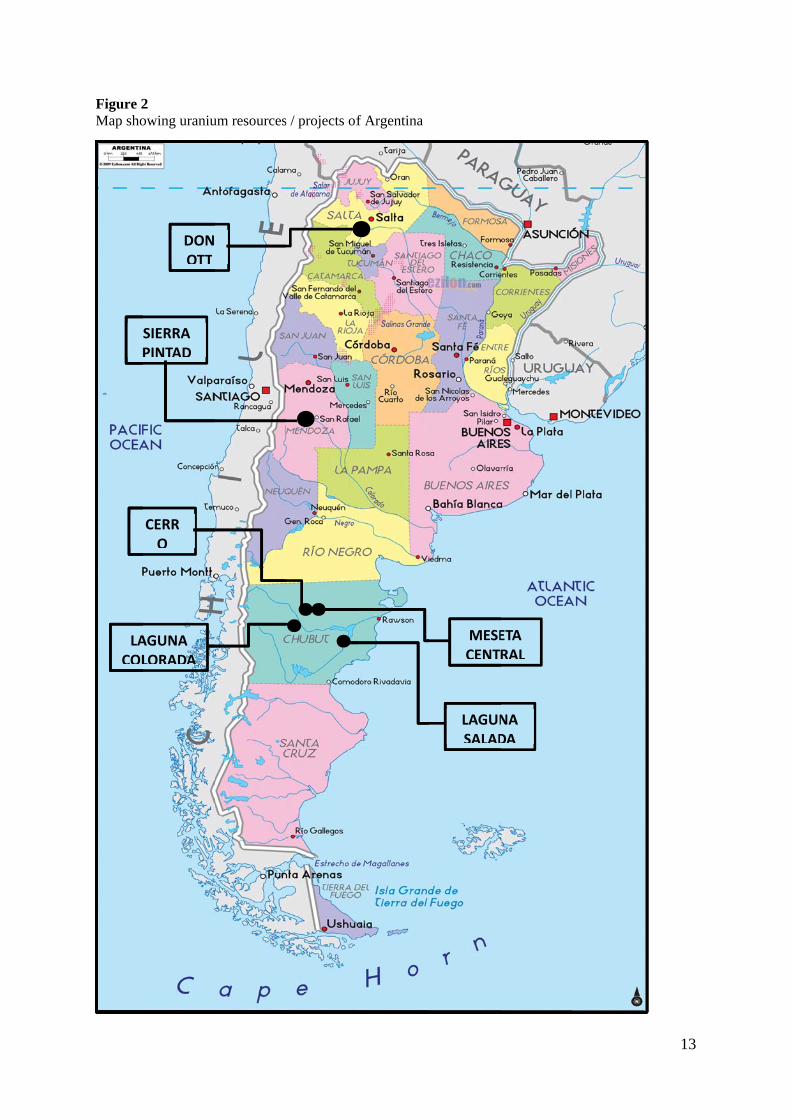
Figure 2Map sho
P
LACOL
2 owing uraniu
DONOTT
SIERRA PINTAD
CERRO
AGUNA LORADA
um resources
s / projects off Argentina
MESECENT
LAGUNSALAD
ETA RAL
NA DA
13
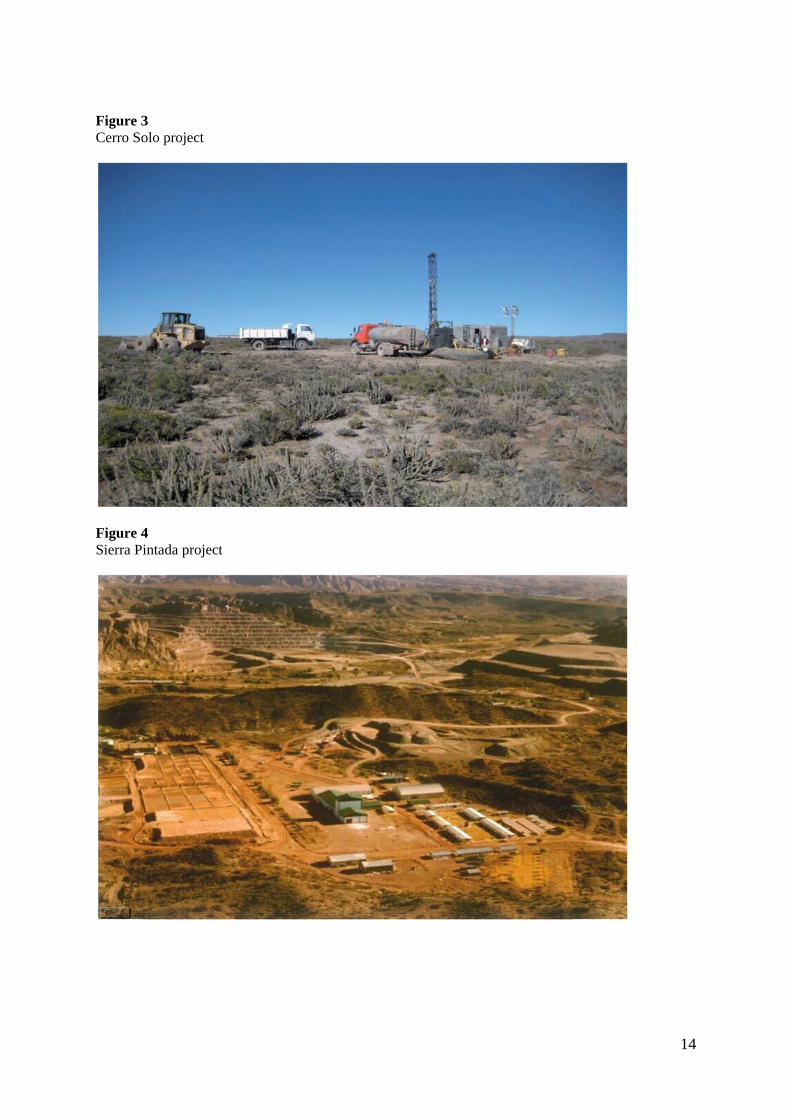
Figure 3Cerro So
Figure 4Sierra Pi
3 olo project
4 intada projecct
14

Figure 5Laguna
Figure 6Meseta C
5 Salada proje
6 Central proje
ect
ect
15

Figure 7Don Ott
Figure 8Laguna
7 to Deposit
8 Colorada Deeposit
16

17
D. Case Study - Application of UNFC-2009 to thorium resources of Brazil 56 This case study was prepared by Roberto Villas-Bôas, Center of Mineral Technology, Brazil. Summary of deposits 57. Thorium reserves within monazite were mined from beaches in Prado, south of Bahia, Brazil, beginning in 1886 by John Gordon. This monazite was exported to European markets, mainly, but not only, to Austria and Germany for the manufacture of the Auer gas lamp net bags. In fact, Brazil was the biggest player in Th markets until 1915, when surpassed by India, and until 1945, when alternatively India and Brazil disputed the first rank of Th production. In 1955, the Brazilian resources (identified domestic monazite quantities (in situ)), were roughly estimated as shown in Table 8. Table 8 Data from Apud Othon Leonardos, in Memória SBPC • Ata da Primeira Reunião 25/04/1956 [33] STATE 1000 t of monazite Rio Grande do Norte 50 to 100 Bahia 35 to 50 Espírito Santo 200 to 300 Rio de Janeiro 100 to 150 Minas Gerais 50 to 130 Brazil TOTAL 435 to 730 (300 to 600 in the original) 58. By 1942, a chemical processing plant to process monazite was built by ORQUIMA S.A., an industry located in the city of São Paulo; this operation was devoted to the manufacture of rare earths oxides, becoming a major exporter to the USA. Monazite-rich sands were also mined and beneficiated at the SUPRA/SULBA plant in Buena beach, Rio de Janeiro, until 1960. From this processing an inventory of about 2,000 t of mixed thorium chlorides, known as TORTA 2, is stockpiled at the Caldas Mine of Indústrias Nucleares do Brazil (INB) in Minas Gerais. 59. It is well known that by the mid-1960s the Mountain Pass mine in California, USA (case study F) came into full production and then dominated global rare earth element production. The Mountain Pass operation led global supply of rare earth elements until 1985, when China began their large-scale production of rare earths. By 2002, China dominated the market of rare earths oxides, while further setting thorium apart from rare earth element (REE) production. With almost no demand for thorium, this resulted in little geological exploration for thorium. However, due to a recent renewed interest in research related to thorium-based nuclear reactors, thorium-containing deposits could experience an increase in demand and hence a new evaluation of thorium deposits is needed. 60. The principal thorium containing deposits and types in Brazil are listed in the IAEA – Thorium Deposits database [34]; references are given in this database. 61. New rare earths ore deposits that might be of interest for their thorium content were recently (2013) registered and approved by the Brazilian National Department of Mineral Production (DNPM) [35]. 62. Thorium resource estimates are based on limited sampling and extrapolations, thus considered as estimates at the lowest level of geological confidence. Using UNFC-2009 as a classification system, these deposits might be classed generally as 3, 3, 3, except for the Buena mine, which previously had estimates at higher levels of confidence.

18
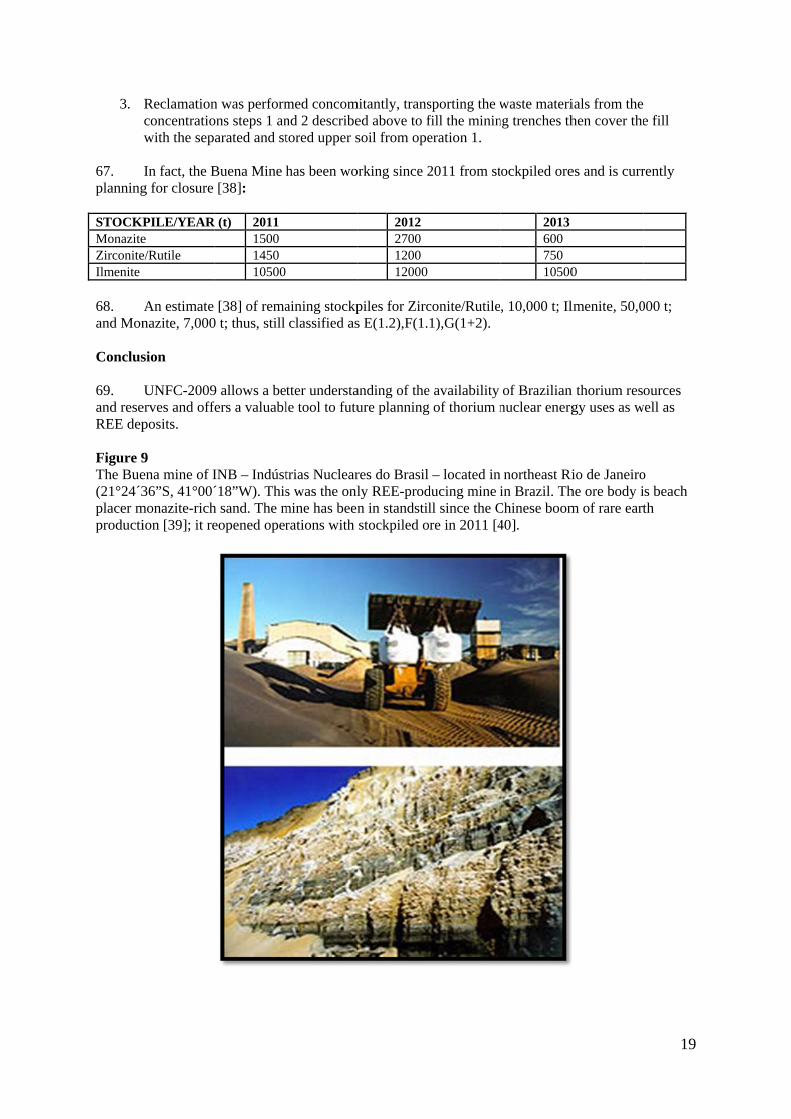
Mina Buena: Classification of the case study by UNFC-2009 63. As a monazite mine for rare earth elements (REEs), the Mina Buena, or Buena mine of INB (Figure 9), is classified as shown in Table 9:
E1.2 “Extraction and sale is not economic on the basis of current market conditions and realistic assumptions of future market conditions, but is made viable through government subsidies and/or other considerations.”
F1.1 “Extraction is currently taking place.” G1+G2 “Quantities associated with a known deposit that can be estimated with a high
level of confidence” (Proven Reserves) (G1) and “with moderate level of confidence” (Probable Reserves) (G2).
Table 9 Monazite resources of the Buena mine, São Francisco de Itabapoana, Rio de Janeiro. Source: Brazilian Minerals Yearbook, AMB, 2010 [36] Buena Mine Deposit
Quantities (metric tons)
Average Grade
CRIRSCO Classification
UNFC-2009 Categories
UNFC-2009 Class
UNFC-2009 Sub-Class
E F G
Total Monazite sands
608,690 * 0.103 % monazite
[37]
Proven + Probable
1.2 1.1 1+2 Commercial Project
On Production (based on old stockpiles)
ThO2 31.35 based on 5% ThO2 analysis of the TOTAL monazite *[36]
Proven + Probable
3.3 2.3 1+2 Non-Commercial Project
Development Unclarified (foreseen IF Th reactors become a reality)
* Proven and probable monazite and ThO2 resources based on an estimated total of 1 292 282 metric tons (tonnes) of monazite sands resources “in situ”, at Buena, São Francisco de Itabapoana, Estado do Rio de Janeiro. 64. On the other hand, there is no current market for thorium as a commodity. However, the large monazite resources represent a potential future source of thorium if needed or desired. 65. Mining in Buena was conducted in a very simple, logical and rational way: first, soil rich in organic matter was removed and stored for reclaiming purposes; second, overburden was then shoveled off; third, shoveling continued, which extracted the monazite-rich ores (ancient beach sands); fourth, trucks transported the ores to the physical beneficiation plant located nearby (Figure 10); fifth, concentrates and wastes were produced; and sixth, reclamation of the mined area was performed. 66. A two-step physical beneficiation process was performed, along with site reclamation:
1. Humphrey´s spirals concentrate the “heavy minerals” part of the “monazite sands”, producing a concentrate consisting of monazite, ilmenite, zirconite and rutile. Waste products from this operation—paleo seashore sands—were returned for the concomitant reclaiming operations.
2. Concentrates from step one were subjected to electromagnetic, electrostatic and further gravimetric operations to produce cleaner concentrates. The overall ore recovery was 85% for the heavy minerals.
3.
67. planning STOCKPMonaziteZirconiteIlmenite 68. and Mon Conclus 69. and reseREE dep Figure 9The Bue(21°24´3placer mproducti
Reclamationconcentratiowith the sep
In fact, the Bg for closure
PILE/YEARe e/Rutile
An estimate nazite, 7,000
sion
UNFC-2009erves and offposits.
9 ena mine of I36”S, 41°00´
monazite-richion [39]; it re
n was performons steps 1 anarated and st
Buena Mine [38]:
R (t) 2011 1500 1450 10500
[38] of rema0 t; thus, still
9 allows a befers a valuabl
INB – Indúst´18”W). Thish sand. The meopened oper
med concomnd 2 describetored upper s
has been wo
aining stockpclassified as
tter understale tool to futu
trias Nuclears was the onl
mine has beenrations with
mitantly, transed above to fsoil from ope
orking since 2
2012 2700 1200 12000
piles for Zircs E(1.2),F(1.
anding of theure planning
res do Brasilly REE-prodn in standstilstockpiled o
sporting the wfill the minineration 1.
2011 from st
conite/Rutile1),G(1+2).
e availability g of thorium n
– located inducing mine ll since the Cre in 2011 [4
waste matering trenches th
tockpiled ore
2013 600 750 10500
, 10,000 t; Il
of Brazilian nuclear energ
northeast Riin Brazil. Th
Chinese boom40].
ials from thehen cover the
es and is curr
0
lmenite, 50,0
n thorium resgy uses as w
io de Janeirohe ore body im of rare eart
19
e fill
rently
000 t;
ources well as
o is beach th

Figure 1S-X extrHo, Er, Y
E. 70. India an Introdu 71. Atomic belts andcopper bstretch cconceptsterrain a 72. SSZ. PreSSZ, pobasins o
73.
10 raction, semiYb, Y). Sour
Case Study
This case stund P. S. Parih
uction
India's uraniEnergy Comd geologicallbelt (Singhbhcontaining ovs and practic
along with gl
A total of 12esently, sevetential for urf India [3,41
Umra (MetaTummalapalKPM-WahkBodal-JajawLambapur-PRohil (MetaGogi (Uncon
A number of
i-commerciarce: [37]
y - Applica
udy was prephar, Atomic M
ium exploratmmission. Inily favorable hum Shear Zver 50 anomaces have undelobal develop
2 low-grade, en mines andranium depos]. These incl
amorphite typlle (Carbona
kyn-Tyrnai-Uwal (MetamorPeddagattu-Casomatite typnformity typ
f smaller dep
l plant in 199
ation of UN
pared by A. KMinerals Dir
ion programitially, the emareas of the one or SSZ) alies was disergone manypment of exp
small to medd two mills arsits has now lude:
pe), Rajasthate type), And
Umthongkut-rphite type),
Chitrial-Koppe), Rajasthane), Karnatak
posits are als
92–1993 (ex
NFC-2009 to
K. Sarangi, Urectorate for E
m started in 19mphasis of exsub-continen became a m
scovered in ey changes wiploration tool
dium size urre producingbeen recogn
an; dhra PradeshGomaghat (SChhattisgarh
punuru (Uncon;
ka.
so reported fr
xtracting La,
o Uranium
Uranium CorExploration
948–1949 aftxploration wnt. The maid
major successearly 1950s. Sith increased ls.
ranium deposg uranium fronized in other
h; Sandstone tyh; onformity ty
rom other pa
Ce, Pr, Nd, S
Deposits o
rporation of Iand Research
fter the formaas laid on theen effort in t story, whereSince then, uknowledge o
sits have beenom this provir Proterozoic
ype), Meghal
ype), Andhra
arts of India.
Sm, Eu, Gd,T
of India
India Ltd. Jah, India.
ation of the Ie existing mthe Singhbhue a uranium-uranium explon the geolo
en establishedince. Apart fc and Phaner
laya;
Pradesh;
20
Tb, Dy,
aduguda,
Indian ineral
um -bearing loration gy of the
d in the from the rozoic

21
Uranium resources in India 74. Nearly 160,000 tU are reported contained in 40 small to medium size deposits in the country [2]. Six major uranium provinces have been identified, which are the Singhbhum Shear Zone (Metamorphite type), Southern Cuddapah (Carbonate type), Northern Cuddapah (Unconformity type), Mahadek basin (Sandstone type), North Delhi Fold Belt (Metasomatite type) and Bhima basin (Unconformity type). A number of occurrences have also been established in other promising areas. 75. Of the total identified uranium resources in India, the Cuddpaha Basin (Proterozoic) in Andhra Pradesh accounts for 51%, the Singhbhum Shear zone (SSZ) (Proterozoic) in Jharkhand hosts 29%, the Mahadek Basin (Phanerozoic) in Meghalaya hosts 11%, the North Delhi fold belt (Proterozoic) in Rajasthan hosts 4%, the Bhima Basin (Proterozoic) in Karnataka hosts 2%, and the remaining uranium occurs in other Proterozoic basins of the country. Uranium deposits of India are of low grade (less than 0.1% U). Classification of uranium resources in India 76. Uranium resource estimation and reserve categorization in India is generally done following Indian Bureau of Mines (IBM) guidelines proposed in 1981 [42]. These guidelines are based on the concept of McKelvey system [43] and are comparable with the CRIRSCO Template. In 2003, the Indian Bureau of Mines made it mandatory to report mineral resources adopting the UNFC-1997 system. Currently, discussions are in progress to adopt UNFC-2009 for uniform reporting of all resources, including petroleum. However, reporting of uranium continues to be in earlier guidelines of IBM. 77. Uranium resources are also classified as per the NEA-IAEA classification scheme under the categories identified and undiscovered resources. Identified resources are normally not reported in cost categories in India. 78. With globalization of the Indian nuclear sector, there is a greater need for the Indian uranium industry to align its current system of resource/reserve estimation with global practices, reporting procedures, and associated risks. Accordingly, the uranium industry is attempting to orient its system of resource/reserve reporting procedures in line with global developments. Efforts are being made to assess different uranium exploration projects in the framework of UNFC-2009 class/subclass system. It has been appreciated that the inherent granularity in the UNFC-2009 class/subclass scheme shall help to classify the projects on the basis of their mineable status. 79. In India, two Government agencies—the Atomic Minerals Directorate for Exploration and Research (AMD) and the Uranium Corporation of India Ltd. (UCIL) under the Department of Atomic Energy are engaged in exploration and mining of uranium, respectively. The geological details (G axis) of almost all deposits discovered so far by the AMD have been extensively studied (G1 / G2 / G3). The technical feasibility studies (F axis) by UCIL are carried out on a case-by-case basis as more and more geological details emerge during the exploration. As the uranium is exclusively used by Government of India, the economic consideration (E axis) towards development of uranium deposits is not related to internal market-based production. Financial viability of Indian uranium deposits is to some extent related to national production scenarios reviewed time to time. Aligning uranium deposits in the Singhbhum Shear Zone (SSZ) to the UNFC-2009 class/subclass system 80. More than 46,000 tU resources have been established in the Singhbhum Shear Zone, a major uranium province in India. All the deposits in the province are of <0.1% U grade. Presently, seven deposits are being mined.
81. represenan attemShear Zo Figure 1Uranium
82. Narwapaproductiknown u 83. extensio“Potentisocio-ecF2.2, G1class. 84. Kanyaluindependclass “Dsocio-ecthe foresestimate
Responding ntation of minmpt has been one of India
11 m deposits an
The depositsahar, Bagjataion” with caturanium reso
The resourceons of the Naially commerconomic cons1,2,3 (Table
Resources iduka and otherdent conside
Development conomic consseeable futured to be 33%
to the globaneral resourcmade to plac(Figure 11)
nd occurrenc
s with activea, Turamdih,tegories E1.1ources in the
es reported aarwapahar anrcial projectssiderations in10). Nearly
dentified in dr deposits of
erations for munclarified”
sideration. Tre, and thus m of the resou
al efforts for fces and the gce all knownunder UNFC
es of the Sin
mining in th, Banduhuran1, F1.1, G1, 2area and 15%
around existinnd Jaduguda Ds”, because thn the foresee10% of the r
deposits, suchf the Singhbhmining and pr”. The economThese depositmay be categurces in the S
finding a comgradual accepn deposits (mC-2009 class
nghbhum She
he Singhbhumng and Mohu2. These dep% of the tota
ng operatingDeposits, arehey may eme
eable future. resources of t
h as the Banhum Shear Zorocessing, mmic viabilityts are not reagorized as E3Singhbhum S
mmon code aptance of UN
mines/depositsand UNFC-
ear Zone, Ind
m Shear Zonuldih) (Figur
posits accounal known reso
g mines, suche grouped unerge as produThese deposthe Singhbhu
gurdih, Garaone, which r
may be placedy of these depasonable pros3.2, F2.2, G1Shear Zone.
and terminolNFC-2009 bys/occurrence2009 subclas
dia
ne (Jadugudare 11) are connt for about 5ources of the
h as the Banander the UNFuction centresits may be cum Shear Zo
adih, Nimdihequire separad under the Uposits warranspects for eco,2,3. These q
logies for y various coues) in the Sinss categories
a, Bhatin, nsidered as “
57% of the toe country.
adungri-SinidFC-2009 clases under chancategorized aone fall under
h, Rajgaon, ate infrastruc
UNFC-2009 nts very favoonomic extraquantities are
22
untries, nghbhum s.
“On otal
dungri ss of nged s E2, r this
cture and sub-
orable action in e

23
Other deposits 85. Tummalapalle and its adjoining area in the Southern Cuddapah Basin report more than 70,000 tU of carbonate-type resources. Host rock characteristics and the lower grade of these deposits make them economically less attractive. But considering their large tonnage, extraction is expected to be sustainable in some part of these deposits. Implementation of the project at Tummalapalle is underway for a part of the indicated resources; studies are in progress for Tummalapalle extension blocks. UNFC code of E1.2, F1.2, G1, 2 for 17% of the resources of the basin at Tummalapalle; E2, F 2.1, G1,2,3 for 18% of the resources for extension of Tummalapalle; and E2, F2.2, G1,2,3 for the remaining resources of the adjoining area has been proposed (Table 11). Table 10 Uranium resources of the Singhbhum Shear Zone, India
Deposits UNFC-2009 Class UNFC-2009 Sub-Class
UNFC-2009 Categories
E F G
Jaduguda, Bhatin, Narwapahar, Bagjata, Turamdih, Banduhurang and Mohuldih
Commercial Projects
On production 1.1 1.1 1,2
Banadungri-Sinidungri, extensions of Narwapahar and Jaduguda
Potentially Commercial Projects
Development on Hold
2 2.2 1,2,3
Bangurdih, Garadih, Nimdih, Rajgaon, Kanyaluka and others
Non-Commercial Projects
Development Unclarified
3.2 2.2 1,2,3
86. The unconformity related deposits in the northern Cuddapah Province are also of low grade resources. Project activities are in progress for the development of some of these deposits. The geological aspects of these deposits are fairly well understood. A UNFC-2009 code of E2, F2.1, G1,2,3 has been proposed for some of the Northern Cuddapah uranium deposits. 87. Uranium resources in North Delhi Fold Belt (NDFB) province are also of low grade and the national economic considerations could permit extraction in future, subject to favourable findings in feasibility studies. Geological characteristics of these resources are fairly well established. A UNFC-2009 code of E2, F2.2, G1,2,3 is proposed for NDFB resources. 88. Uranium resources in the Bhima Basin are of medium grade and unconformity related. Implementation of the mining/extraction in this area is subject to some more technical studies and favorable socio-economic consideration. The geological aspects of the deposit have been fairly well understood and a UNFC-2009 code of E2, F2.1, G1,2 has been proposed for Bhima basin resources. 89. The sandstone-type deposits in Mahadek Basin in the state of Meghalaya are of low to medium grade and amenable for open pit mining. Geological aspects of these deposits have been adequately studied. A UNFC-2009 code of E2, F2.1, G1,2 is proposed for the resources at KPM (Domiasiat), which account for about 47% of the basin, and E3.3, F2.3, G2,3 for remaining resources (Wahkyn-Tyrnai-Umthongkut-Gomaghat - II and others of Mahadek basin) is proposed.

24
Table 11 Uranium resources of other deposits, India
Deposits UNFC-2009 Class UNFC-2009 Sub-Class
UNFC-2009 Categories
E F G
Tummalapalle Basin Commercial Projects On production 1.2 1.2 1,2
Tummalapalle Extension Potentially Commercial Projects
Development Pending
2 2.1 1,2,3
Adjoining areas of Tummalapalle Potentially Commercially Projects
Development on Hold
2 2.2 1,2,3
Northern Cuddapah Potentially Commercial Projects
Development pending
2 2.1 1,2,3
North Delhi Fold Belt Potentially Commercial Projects
Development on Hold
2 2.2 1,2,3
Bhima basin Potentially Commercial Projects
Development Pending
2 2.1 1,2
KPM (Domiasiat) of Mahadek basin
Potentially Commercial Projects
Development Pending
2 2.1 1,2
Wahkyn-Tyrnai-Umthongkut-Gomaghat – II and others of Mahadek basin
Non Commercial Projects
Development not viable
3.3 2.3 2,3
Exploration projects 90. Quantities estimated in several Exploration Projects totalling to 84,800 tU [3] have been assigned UNFC-2009 codes of E3.2, F3, G3,4.

25
Conclusion 91. The advantages of applying UNFC-2009 lies in its simplicity to quantify the judgment in a coded manner, which can be best understood and uniformly interpreted by professionals. It also provides a linkage to business processes and decision making. In the Indian uranium industry, although it has not yet become mandatory to report the status of project using UNFC-2009, the usefulness has been aptly realized by the professionals. However, it may not be complex to report the status of all mines/deposits/occurrences in this system while maintaining the existing system of reporting, since the industry is appropriately structured and well-regulated. The industry has a large base of experts/professionals to address complex issues on uranium exploration and mining in the country. F. Uranium In Malawi: Case Study on the Application of UNFC-2009 92. This case study was prepared by Cassius Chiwambo, Senior Mining Engineer, Ministry of Natural Resources, Energy and Mining, Malawi. Role of extractive industries in Malawi’s economy 93. Malawi, in southeastern Africa, occupies a thin strip of land between Zambia and Mozambique protruding southwards into Mozambique along the valley of the Shire River. In the north and northeast it also shares a border with Tanzania. Malawi is connected by rail to the Mozambican ports of Nacala and Beira. 94. Malawi’s economy has for many years been agro-based and this industry did not have the needed muscle to increase the country’s economy. Following the need to expand its economic base, Malawi made a firm decision to promote extraction of its mineral resources. Despite its previous idleness of the mining sector, which was as a result of lack of interest by the immediate post-colonial Government who focused on putting in place policies that promoted the agricultural sector, Malawi is now becoming one of the active mining countries in Africa, as evidenced by the various exploration and mining activities taking place currently. 95. The country’s macro-economic vision is indicated in the Malawi Growth and Development Strategy (MGDS). In this strategy, the Mining Sector is pointed out as one of the key priority sectors for economic growth. In view of this strategy, the Government’s policy direction is to have:
A viable and transparent fiscal and taxation regime that attracts investors in the minerals sector and ensures that a substantial amount of revenue is retained in Malawi.
A clear, transparent and equitable regulatory framework for the minerals sector. 96. This policy has resulted in massive exploration activities. From the exploration works, it has been revealed that the national geological endowment includes:
High-value minerals, such as uranium, heavy-mineral sands (HMS), rare earth elements (REEs), niobium, zircon, and tantalum;
Industrial minerals, such as phosphate, bauxite, gypsum, limestone, silica sand and clays; Energy resources, such as coal and uranium; and Precious and semi-precious stones and metals, such as ruby, aquamarine, and tourmaline.
97. The country has the third largest lake in Africa, Lake Malawi. This lake is situated in the highly anticipated Petroleum Occurrence Zone (POZ), situated in the Great African Rift Valley, which has lately been proven to have a huge potential for petroleum in Africa; this potential is evidenced by the discovery of oil in Lake Albert, which lies in the same rift system.
26
98. Since 2004, Malawi intensified activities such as policy formulation and capacity building in the minerals sector. Lately, investment in Malawi’s minerals sector has greatly increased. The Malawi government is committed to putting policies in place that will attract private sector participation in the exploration, exploitation, processing, and utilization of Malawi’s mineral resources. To this end, in March 2013, the Mines and Minerals Policy of Malawi was approved and launched by the Malawi government. The Government recognizes that the minerals sector has significant potential to contribute towards rapid economic growth and development of the country, as evidenced in its inclusion in the Malawi Economic Recovery Plan 2012. 99. The policy seeks to stimulate and guide private mining investment by administering, regulating and facilitating the growth of the sector through a well-organized and efficient institutional framework. The government will also intensify provision of extension services to the artisanal and small-scale miners and women miners. 100. The goal of the Mines and Minerals Policy is to enhance the contribution of mineral resources to the economy of the country, so as to move from being an agriculture-based economy to a mineral-based economy. 101. Currently, mineral production includes brick clay, coal, crushed stone, limestone, uranium, gemstones and ornamental stones (amethyst, garnet, ruby, sapphire, tourmaline, agate and rose quartz) [44]. Five coal mines are currently producing in Mchenga, Nkhachira, Kaziwiziwi, Eland and Lufira. Gemstones are being exploited in various mines in the Mzimba District and Nyala at Chimwazulu Hill. Limestone is being mined in Wimbe. A phosphate mine is located in Tundulu. Uranium mining and milling has been carried out in Kayelekera, but this operation is currently on standby status due to reductions in uranium prices. 102. In addition to this resource production, exploration is ongoing for gold, niobium, tantalum, titanium, zirconium, graphite, rare-earth elements and uranium. 103. In 2009, Malawi entered the international family of uranium producers with the start of operations at the Kayelekera Uranium mine in Karonga, which is being operated by Paladin Africa Limited. That event signalled a change in the wider fortunes of the African region as a uranium producer. In 2012, nearly 2% of the world uranium production came from Malawi. Uranium accounted for 8.4% of Malawi’s exports by value in 2011. It is now estimated that in production terms, Africa as a whole will be the fastest growing region for uranium production [3]. 104. All mining activities are under the control of the Department of Mines of the Ministry of Natural Resources, with environmental matters falling under the Department of Environmental Affairs in the same ministry. As more new discoveries of mineral deposits are being reported, the government realized its capacity shortfalls to efficiently govern the sector. Despite intensifying its own capacity building initiatives, which are also being supported by the international organizations such as the IAEA and the government’s cooperating partners, the exponential growth of the sector needs a consequent exponential growth of the government’s skills in managing it. Challenges in mineral resources reporting 105. One of the challenges that Malawi is facing is in the reporting on the mineral resources because they are reports by exploration companies. Malawi’s normal procedure is to give operators the freedom to report its exploration discoveries using the system that it prefers. At the end of the day the government benefits from knowing the resource findings for its own planning purposes, as well as reporting this data to other institutions, such as the Minerals Yearbook prepared by U.S. Geological Survey (USGS). Thus, government officials need to know and understand the various reporting systems. This has proven to be a great challenge.

27
106. The Mines and Minerals Act in ‘The first Schedule’ provides that it is the duty of the holder, or former holder of a Mineral Right to furnish information, submit reports or keep records. By having this provision, investors have been submitting reports using the format of their choice. This has been a challenge for the government, for its harmonised interpretation of the submitted reports entailed multi-skilled professionals to interpret such reports. Due to lack of such multi-skilled professionals in the sector, the government has been facing challenges in interpreting all of the submitted reports within the shortest period as it sometimes relies on sourcing experts to do the interpretation where necessary. Following this challenge, government made a decision to find a suitable reporting system for government’s purposes that will link with the formats generally used by investors. The government could then encourage the investors to use this reporting system for its purposes only. 107. Several systems were studied and some systems were found critical to several investors. During this exercise, it was noted that if one existing system (already being used by the companies in Malawi) was to be chosen; it meant the government was to either force or convince the other investors to adopt the one system that was recommended from the government’s perspective. This development was seen to be difficult and could result into suspicion and conflict of interest, because the Government is not required to operate in such a manner. 108. A further search was done and it came to the point when the Government realized the existence of UNFC-2009. 109. The Malawi Government studied UNFC-2009 and made a basic analysis of the country’s reported mineral resources by applying the UNFC-2009 Categories and Classes. As an example, the REE resources in Malawi could be classified as shown in Table 12. Table 12 Rare Earth Elements projects in Malawi
Area/Deposit Operator Ore (Million tonnes)
Average Grade %
(total REO)
UNFC-2009 Class
UNFC-2009 Sub-Class
UNFC-2009 Categories
Remarks
E F G
Kangankunde Lynas Co. Ltd
2.5 4.2
Poten-tially Commer-cial Project
Develop-ment Pending
2 2.1 2?
Advanced Exploration and delineation
Songwe Mkango Resources
13.2 1.62 2 2 2 Advanced Exploration and delineation
6.2 2.05 2 2 2 ? 18.6 2 2 3 ? 1.38 2 2 3
Mt Mulanje JOGMEC/Gold Canyon
- - 3 3 4 Early Exploration
Uranium resources of Malawi 110. One of the major uranium deposits in Malawi is the Kayelekera Deposit. In the early 1980s, the Department of Geological Surveys discovered uranium mineralization in the sandstone of Kayelekera. Thereafter, the Central Generating Board of Great Britain (CEGB) evaluated the deposit. Extensive drilling conducted from 1982 to 1988 defined an initial inferred resource of 9800 tU at an average grade of 0.13% U [3].

111. north tipof Permibroadly 112. within thdeposit acontaineMoreove 113. producer 114. Uraniumhosted inand zirco 115. mineralshad a go Figure 1View of
(Photo c Classific 116. as “Coma “Potenthe classthe end o
The Kayelekp of the Northian Karoo saparallel to, t
Historical sthe Kayelekerand in associed within theer, this coal i
Kayalekera ir (Figure 12)
Another potm is an imporn Proterozoicon as by-pro
Following ans sector, withood position
12 f the Kayalek
courtesy of C
cation of ur
Kayelekera immercial Projntially Commses amount toof June [45].
kera Uraniumh Rukuru Baandstones prethe Lake Mal
tudies indicatra area. Coaliation with th
e uranium resis of very low
is the first m).
ential uraniurtant by-prodc felsic schis
oducts.
n analysis ofh focus on rato enter into
kera Uranium
C. Chiwambo
anium resou
is currently tject” (E1F1.
mercial Projeo 16,412 t U.
m Deposit is asin. This Baeserved in a slawi section
te that econol is present inhe Kayelekersources and iw quality.
mine to have p
um resource iduct in the costs. Niobium
f Malawi’s padioactive mi
such an imp
m Mill, Malaw
o, Malawi)
urces
the only uran1G1,2) amouct” (E2F2.1G
U (Table 14).
a sandstone-asin contains semi-grabenof the East A
omically recon the project ra Uranium Dis therefore u
produced ura
is the Kanyikomplex polym
m and tantalum
preparedness inerals, in 20portant sector
wi
nium produciunt to 5,398 G1,2,3). Agg The quantit
-hosted urania thick (at le
n, located aboAfrican Rift S
overable resotenement ar
Deposit. Coaunavailable f
anium in Ma
ka Niobium Pmetallic ore m products w
and prioritie013 an IAEAr (Table 13).
ing project int U. Addition
gregate quantties are adjus
ium deposit, east 1 500 m out 35 km to System.
ources of uraea in two depal in the Kayfor commerci
lawi and is c
Project held within a peg
would be prod
es for the opeA expert team
n Malawi. Qunally, 11,014tities of the d
sted for deple
located closm thickness) s
the west of,
anium and coposits: the N
yelekera Depial extraction
currently the
by Globe Mgmatite quartduced with u
eration of its m found that M
Quantities esti4 t U is estimdeposit undeetion for min
28
se to the sequence and
oal exist Nkhachira
osit is n.
only
Metals. z vein, uranium
Malawi
imated mated as r both
ning to

29
117. The Kayelekera project was placed on care and maintenance in February, 2014 due to depressed uranium market conditions. The production has been suspended until sustained uranium price recovery occurs [45]. Since the project is maintaining the operational readiness to come to operation any time in the future, it may be designated as E1F1.1 under UNFC-2009. It can be further classified as “Developed Non-Producing”, analogous to petroleum projects described in the Bridging Document between PRMS and UNFC-2009 [3]. 118. A high level of granularity can be possible when using UNFC-2009. For regional development and sustainable planning of the project, this level of precision in reporting can be highly useful. 119. On a national level for governmental planning purposes, a lower level of granularity could be sufficient. All the uranium projects of Malawi can be classified under UNFC-2009 as shown in Table 15. Table 13 Uranium projects – country preparedness and priorities, Malawi
Country Status by Milestone Achieved
Geology & Exploration
Resource Evaluation & Reporting/ UNFC-2009 and NEA-IAEA Red Book
(Pre)-Feasibility, EIA, EMP and Production, including CX, HSE
Critical Dependencies/CCP
Actions
Malawi On Production/ Development Pending/ Exploration Projects
High potential in Karoo; Uranium associated with Niobium
Newest producer of U in Africa, Kaylekeera; Second mining project in country; New project feasibility studies underway; Exploration projects
Mineral sector a priority now to reduce poverty. Issues with Mineral Development Agreements
Capacity in mineral development agreement; sustainable development of Uranium resources; social communications
IAEA lead international peer-review of uranium operations
CCP – critical control point; CX – comprehensive extraction; EIA – Environmental Impact Assessment EMP – Environmental Management Programme; HSE – Health, Safety, Environment UNFC-2009 – United Nations Framework Classification (2009

30
Table 14 Uranium quantities of Kayelekera Deposit, Malawi, classified according to UNFC-2009 (Effective date: as of June 2014) Area/ Deposit
Operator Ore (tU) Average Grade (% U)
UNFC-2009 Class
UNFC-2009 Sub-Class
UNFC-2009 Categories
Remarks
E F G
Kayelekera-I
Paladin Africa Ltd
388 0.099
Commer-cial Project
On Produc-tion
1 1.1 1 Project under Care and Maintenance/ Developed Non-Producing
3993 0.075 1 1.1 2
1017 0.064 1 1.1 1 Stockpiles
Sub total E1F1G1+G2
5398
Kayelekera-II 639 0.086
Poten-tially Commer-cial Project
Devel-opment Pending
2 2.1 1
7548 0.059 2 2.1 2 2827 0.053 2 2.1 3
Sub total E2F2G1+G2+G3
11014
Total E1F1+E2F2G1+G2+G3
16412

31
Table 15 Summary of uranium projects in Malawi
Area/Deposit Operator Ore (tU) Average Grade (%U)
UNFC-2009 Class
UNFC-2009 Sub-Class
UNFC-2009 Categories
Remarks
E F G
Kayelekera - I Paladin Africa Ltd
5398 0.075 – 0.099
Commercial Project
On Production
1 1.1 1,2
In Care and Maintenance from early 2014 due to fall in market demand Effective Date: June, 2014 [46]
Kayalekera – II Paladin Africa Ltd
11014 0.053-0.086
Potentially Commercial Project
Develop-ment Pending
2 2.1 1,2,3
Effective Date: June, 2014 [46]
Kanyika Globe Metals and Mining
4632 0.0059-0.0093
Potentially Commercial Project
Develop-ment Pending
2 2.1 1,2,3
Recovery of uranium unclarified Effective Date: Jan 10, 2013 [47, 48]
Machinga Globe Metals and Mining
- - Exploration Project
3 3 4
Mhuju Globe Metals and Mining
- - Exploration Project
3 3 4
Songwe Mkango Resources
- - Exploration Project
3 3 4
Tambani Mkango Resources
- - Exploration Project
3 3 4
Rumphi District HBDK EMWAW Mining Co
- - Exploration Project
3 3 4
Chilumba and Extensions of Kayelelera and Mwankenja
Paladin Africa Ltd
- - Exploration Project
3 3 4
Conclusions 120. UNFC-2009 is an effective tool for reporting and management of uranium at regional and national levels. Higher granularity is important when reporting individual projects, and the information at this level of detail is important when addressing socio-economic issues at a regional level. The scheme also allows aggregation of the total quantities for comprehensive understanding. 121. UNFC-2009 is particularly important for national reporting where data is assimilated from different company sources, both from public reports as well as direct communications to the government. While most of the public reporting is done under international schemes suitable for the respective companies. Many companies that do not need public reporting could communicate quantities of uranium and other commodities to the government under the UNFC-2009 scheme. 122. The sustainable development of mineral commodities, such as uranium as a by-product in the case of Kanyika Project, is not only important for Malawi, but also for the nuclear industry as a whole. The uranium recovered in this manner has the least mining foot-print, does not become a detrimental factor for the environment, and is likely to bring overall socio-economic gains for the

32
country. Use of UNFC-2009 allows tracking of such sustainable possibilities, which is its major advantage. 123. The Government of Malawi’s overall information on the minerals industry can be strengthened when the reporting also considers Non-commercial Projects and Exploration Projects. These are the projects that could be expected to contribute to mineral production in the long term and thus have an impact on the economy over larger time-frames. 124. However, the effective use of UNFC-2009 needs comprehensive information on the principles, rules and guidelines. The associated bridging criteria to the existing reporting frameworks are also to be understood for its effective use. Further improvement in capacity in use of UNFC-2009 is required for introducing such a new scheme. 125. Currently, Malawi has just finalized a comprehensive Airborne Geophysical Survey Exercise. In this case, depending on the positivity of the survey results, Malawi expects a huge in-flow of transnational, as well as domestic investors, who will be interested in the information generated. This will mean a huge need for a homogenous reporting format, such as the use of the UNFC-2009. As such, the UNFC-2009 will very much benefit the country. G. United States—A thorium source in the Mountain Pass rare earth elements deposit, California, United States, and the application of UNFC-2009 126. This case study was prepared by Bradley S. Van Gosen, United States Geological Survey. Introduction 127. Historically, uranium and thorium deposits worldwide have been classified and reported according to the resource reporting scheme developed by NEA and IAEA. This system consists of a biaxial classification that considers the degree of geological knowledge and the production costs of uranium concentrate and (where applicable) thorium concentrate. 128. Thorium, similar to uranium, can be utilized as a nuclear fuel. Despite numerous projects and several pilot test reactors in several countries designed to evaluate thorium as a viable reactor fuel, thorium-based nuclear power has yet to be fully commercialized. Currently, research and development is being carried out on several concepts for advanced reactors including: high-temperature gas-cooled reactors (HTGR); molten salt reactors (MSR); Candu-type reactors; advanced heavy water reactors (AHWR); and fast breeder reactors (FBR). Federal government-supported projects, particularly in India and China, are focused on the development of thorium-based nuclear power [3]. Based on these activities, utilization of thorium as fuel is expected after 2020. 129. Because of the low demand for thorium, it has not been a primary target of exploration in the past. The research and development efforts mentioned above may increase the demands for thorium and likewise increase national and global evaluations of thorium deposits. 130. Mineral deposits that are rich in the rare earth elements (REEs) typically also contain anomalous enrichments in thorium. Primarily for this reason, the most likely sources of thorium in the foreseeable future will come from the recovery of thorium as a co-product of the mining and processing of REE deposits. 131. Production of REEs during the 1950s to the late 1980s came primarily from the United States, India, South Africa and Brazil. In 1927, Chinese geologists discovered REE deposits at Bayan Obo in the Inner Mongolia Autonomous Region. Mines and processing plants built at Bayan Obo began to produce REE concentrates in 1957 [49]. By 2002, China became the dominant producer of REEs in
33
the world [49]. During the more than 80 years following the discovery of Bayan Obo, REE deposits were found in 21 of China’s Provinces and Autonomous Regions [49]. In 2009, China reported its domestic extractable quantities of REEs as 18.6 million tonnes of REE oxide [50, p. 410]. China introduced a production quota on their REE industry in 2008 [49], which triggered a worldwide look for REE deposits in other countries. In recent years, deposits of REE resources have been assessed in Australia, Brazil, Canada, China, Finland, Greenland, India, Kyrgyzstan, Madagascar, Malawi, Mozambique, South Africa, Sweden, Tanzania, Turkey, the United States, and Vietnam [51, 52, 53]. 132. Actively mined REE ore deposits are economic on the basis of their REE production. Co-existing thorium-rich minerals could be evaluated as sources of by-product or co-product thorium if a market develops for thorium in the future. For now, the production of thorium as the primary product is thought to be uneconomic [3]. In the context of production, a by-product can be defined as the “output from a joint production process that is minor in quantity and/or net realizable value (NVR) when compared to the main products” [54]. By convention, by-products also are not inventoried, but the NRV from by-products is typically recognized as 'other income' or as a reduction of joint production processing costs when the by-product is produced. Co-product on the other hand is a major output from a joint production process that is significant in quantity and/or NVR. Co-products play an important role in the economic analysis of a mineral project. 133. In most REE-thorium-rich deposits, the most common thorium-bearing mineral is monazite, a REE–thorium–phosphate mineral. Thus, most of the thorium content in the majority of REE deposits is due to monazite, only occasionally due to other thorium-rich minerals, such as thorite (thorium silicate). Monazite can contain as much as 20 percent thorium oxide [55]; hence, thorium may be evaluated as a co-product in many REE deposits containing monazite. 134. Moreover, policy objectives of waste hierarchy, such as the European Union Waste Framework Directive (established in 1975 and revised in 2008), mandate disposal as the last and least desirable of the management options of any process residues [56, 57]. Reuse, recycling, energy recovery, and other potential uses are to be considered before materials are assigned as waste and presumptively disposed. 135. Monazite concentrate production is currently taking place in India, Malaysia, Vietnam, and Brazil, in decreasing order of production [52]. The Indian Bureau of Mines describes India’s coordinated effort to recover monazite from heavy-mineral sands then chemically treat the monazite to separate rare earths in composite chloride form and thorium as hydroxide upgrade [58]. The planned capacity of the monazite processing plant was established at 10,000 t per year in 2011, expected to be increased to 20,000 t per year in the future [58]. The recovery of thorium from monazite-rich ore is being considered for the Steenkampskraal deposit in South Africa, which is a REE mining and production project under development in 2014 [59, 60]. 136. The co-product occurrence of thorium and a general lack of economic interest in thorium have meant that thorium quantities were rarely, if ever, accurately defined in most countries. Information on estimated quantities of thorium was published between 1965 and 1981 in the biennial publication the “Red Book”, published jointly by the NEA and IAEA; the thorium estimates reported in these reports applied the same terminology as was used for uranium resources at that time. 137. In 2012, the United States reported identified domestic thorium quantities (in situ) of about 434,000 t of thorium [3]. The principal thorium deposit types in the United States are vein-type, carbonatite-hosted, and placers [61]. 138. UNFC-2009 allows the documentation and reporting of estimated known, inferred, and undiscovered thorium quantities. The UNFC-2009 classification scheme, in addition to providing the project maturity of mineral commodities, considers social and economic issues, including regulatory, legal and market conditions imposed by governments and markets, domestic demand, technological and industrial progress, as well as ever-present uncertainty of the foreseeable future.
34
Case study—Mountain Pass deposit, California, USA 139. This case study is a UNFC-2009 classification of a rare earth elements-thorium deposit in California, United States, classifying the deposit as both a source of rare earth elements (REEs) and as a potential source of thorium. Specifically, the deposit used in this example is the REE ore body developed by the Mountain Pass mine in southeast California, owned and operated by Molycorp Inc. (http://www.molycorp.com/) (Figure 13). The mine and onsite mineral processing plants exploit the largest known REE deposit in the United States—the Sulphide Queen carbonatite [62]. After an eight-year hiatus, Molycorp reopened operations at the mine in late 2010. The mining and ore-processing operations at Mountain Pass remain active at this time (2015); Molycorp announced goals of increased production in 2014. 140. The REE ore body of Mountain Pass represents a potential future source of thorium as a co-product of REE production. The thorium content in this ore body is primarily due to the mineral monazite, which is intimately intergrown with the REE ore minerals. Monazite concentrations range throughout the ore body from trace amounts to locally abundant [62]. 141. Molycorp Inc. reports that the Mountain Pass ore body—the Sulphide Queen carbonatite—contains Proven and Probable Reserves of 16.7 million tonnes of ore with an average grade of 7.98 percent REE oxides, applying a cut-off grade of 5 percent REE oxides [63]. A recent U.S. Geological Survey reconnaissance bulk sampling of ore exposed in the open-pit mine (about 1 tonne of composited ore was collected) found an average thorium content of approximately 0.025 percent within high-grade REE ore; this value is nearly identical to the thorium concentrations found in earlier geochemical studies of this carbonatite [64]. This thorium concentration suggests that each tonne of ore mined from the deposit contains roughly 0.25 kilograms of thorium on average. This estimate of Th content in the Sulphide Queen ore body is certainly an approximation based on limited sampling; monazite concentrations may prove to vary considerably across the carbonatite ore body as mining progresses. For discussion purposes, applying an ore body estimated to comprise at least 16.7 million tonnes of carbonatite, with an average thorium content of about 0.025 percent, there would be an estimated resource of at least 4200 tonnes of thorium at Mountain Pass. Since the estimates are based on limited sampling and extrapolation, it should be considered as an estimate in the lowest level of geological confidence. 142. The mining and processing operation at Mountain Pass is currently devoted only to the recovery and separation of REEs. No plans have been reported by the company to recover the thorium in the foreseeable future. At this time (2015), when the carbonatite of Mountain Pass is mined, processed, and the REEs are separated, the thorium moves with other residues into the tailings impoundment. Thus, it would require modification of the process flow-sheet and/or further reprocessing of the tailings in order to recover the thorium in the future. Classification of the case study according to UNFC-2009 143. As a mine and production operation for REEs, the Mountain Pass mine of Molycorp would be classified using UNFC-2009 as E1.1 F1.1 G1,2. That is, on its basis as a rare earth element operation, it is classified by these categories and sub-categories (Table 16): E1.1 “Extraction and sale is economic on the basis of current market conditions and realistic assumptions of future market conditions.” F1.1 “Extraction is currently taking place.” G1, G2 “Quantities associated with a known deposit that can be estimated with a high level of confidence” (Proven Reserves) and “with moderate level of confidence” (Probable Reserves).

144. content a
E
F2
G
Conclus 145. to both ainformatprogram Figure 1The Mouin the UnREE res
In contrast, vat a reconnai
3.3 “On theconsideextracti
2.3 “There limited
G3 “Quantilow lev
sion
The applicata better undetion on how
mmes.
13 untain Pass mnited States
source in the
viewed additissance level
e basis of reaered that therion and sale i
are no currenpotential.”
ities [of thorvel of confide
tion of UNFCerstanding ofthese source
mine of Moly(in 2014). ThUnited State
tionally as a l, this minera
alistic assumpre are not reain the foresee
nt plans to d
ium] associaence.”
C-2009 as a f the availabies may contri
ycorp, Inc. inhe ore body es. (Photogra
known, unutal deposit ma
ptions of futuasonable proseable future.
develop or to
ated with a kn
complementility of thoriuibute to futur
n southeast Cis a carbonat
aph by B. Va
tilized thoriuay be classifi
ure market cspects for eco.”
acquire addi
nown deposi
t to the NEAum in the Unre planning a
California. Ttite intrusionan Gosen, US
um deposit saied as E3.3 F
onditions, it onomic prosp
itional data a
it that can be
-IAEA Classnited States aand enactmen
his is the onln, thought to rSGS).
ampled for thF2.3 G3:
is currently spects for eco
at the time du
e estimated “
sification conas well as pront of nuclear
ly active RErepresent the
35
horium
onomic
ue to
with a
ntributes oviding r energy
E mine e largest

36
Table 16 REE and thorium resources of the Mountain Pass deposit, California, classified in UNFC-2009 scheme Mountain Pass deposit
Quantities (tonnes)
Average Grade (%)
CRIRSCO
Classification
UNFC-2009 Categories
UNFC-2009 Class
UNFC-2009 Sub-Class
E F G
Total REE
oxides
1 333 0001 7.98
(as oxide)
Proven + Probable Reserves
1.1 1.1 1,2 Commercial Project
On Production
Thorium 4 200 0.025 (elemental weight %)
Inventory2 3.3 2.3 3 Non-Commercial Project
Development Not Viable
1 Proven and probable REE reserves based on an estimated 16 700 000 tonnes of carbonatite ore (grades and tonnages for the REE reserves categories are combined in the public reporting) 2 Not defined in CRIRSCO template H. United States—Coles Hill Uranium Deposit, Virginia, and the application of UNFC-2009
146. This case study was prepared by Susan Hall, United States Geological Survey. Introduction 147. The case study presented here reviews the uranium resource estimates and summarizes the property situation of the Coles Hill Uranium Ddeposits. Uranium resources at Coles Hill are then classified following UNFC-2009.
148. The Coles Hill Deposit is located in Pittsylvania County, southern Virginia, USA (Figure 14). Coles Hill was discovered by the Marline Corporation who identified an outcropping surface radiometric anomaly in 1979. The deposit was delineated by Marline and UMETCO (a subsidiary of the Union Carbide Corporation) from 1979 to 1984. In all, 182 rotary holes (38,037 m (124,799 feet)) of drilling) and 74 core holes (19,836 m (65,082 feet) of drilling) were completed and define two distinct deposits, the North and South Coles Hill deposits [65]. Marline let their option to develop the property lapse in response to low uranium prices and a moratorium on uranium mining in Virginia that was passed in 1982. In 2006, a corporation formed by the majority property owner, Virginia Uranium LLC, consolidated 2,296 acres (929 hectares) in surface rights and 2,940 acres (1190 hectares) in mineral rights, which cover most of the north and south deposits. In 2008, Virginia Uranium drilled 3 core and 7 rotary holes, and re-logged 5 historic holes geophysically, to confirm earlier results. The Marline core was donated to, and is curated by, the Virginia Natural History Museum; the Marline core is stored on site along with the core drilled in 2008 by Virginia Uranium. Access to the property is good over secondary paved roads, and there is excellent infrastructure in the region. Geology 149. The deposits are hosted in Ordovician mylonitic quartzo-feldspathic orthogneiss and amphibolite of the Martinsville Intrusive Suite. Mineralized zones are characterized by sodium metasomatite alteration, chloritization, and hematization. The deposits are bounded by the Chatham Fault to the southeast, which marks the edge of a Triassic basin, and to the west and at depth by the Fork Mountain Schist (Formation) (Figure 14). The deposits are about 350 metres long and 250 metres wide [65]. The North Coles Hill deposit plunges about 20 degrees northeast, with mineralization identified at least 305 m (1000 feet) below the surface, and the South Coles Hill deposit plunges about 30 degrees southwest, with known mineralization to about 550 m (1800 feet)

below th30 to ov Resourc (a) 150. deposit iU3O8. Thwith a cosummardeposit b0.150 tosummarPincockUMETCestimateU3O8 at Figure 1Locationfrom [68
he surface [6ver 60 metres
ce estimates
Historic reso
The first “rein 1982 [67]his estimate ombination o
rized in Tableby the UMET
o 0.05%, utilirized in Tablek, Allen and HCO engineereed recoverabla cutoff of 0
14 n and regiona8]
6]. Mineralizs in length [6
ource estimat
eserve calcula. The in situ used cross sof down-holee 17. In 1984TCO Mineraizing polygone 17. UMETHolt [67], noed a pit desigle reserves at
0.050 % U3O
al geology o
zed zones ran66].
tes
ation” was coresource waection and gee gamma log4 another uraals Corporatinal estimatioCO did not c
or did they esgn, and applit 11 million
O8 [67].
f the Coles H
nge from thr
ompleted byas estimated weologic corre
gging and cheanium resourion. The estimon coupled wcalculate resestimate resouied this modelbs U3O8 at a
Hill uranium
ree to over 30
y Pincock, Alwith cutoff gelation methemical assayrce was estimmate calcula
with kriging; erves at the l
urces in the Nel to the Souta cutoff of 0.
deposit, sou
0 metres thic
llen and Holtgrades from 0ods of interp
ys [67]; estimmated for the
ted resourcethese estimalowest cutoffNorth Coles Hth Coles Hill150 % U3O8
uthern Virgin
ck along an i
t for the Cole0.150 to 0.02pretation coumated resourc
south Coless at cutoff gr
ates are also f grades applHill deposit. l deposit; the8, and 30 mil
nia, USA. M
37
nterval
es Hill 25% upled ces are Hill rades of
lied by
ey llion lbs
Modified

38
Table 17 In situ uranium resource estimates for the Coles Hill uranium deposit
(b) Mineral resource estimates
151. The 1980s era resources are termed historic and are generally not relied upon by the modern mining industry or financial community until verified by independent testing and estimated following standards set by the Canadian Institute of Mining, Metallurgy, and Petroleum Definition Standards on Mineral Reserves and Mineral Resources (CIM). Once standardized to CIM specifications, the resource is compliant with Canadian National Instrument 43-101 (NI-43-101) and deemed reliable. Companies operating in the U.S. typically follow Canadian securities guidance because it was developed specifically for the mining industry, and a great deal of exploration capital is generated through Canadian-based resource companies.
152. In 2007, a Technical report in compliance with NI 43-101 was prepared for Coles Hill [65]; however, this report did not include an updated resource estimate. In 2008, Behre Dolbear produced the first NI 43-101 compliant resource estimate [67]. Measured resources were calculated within a radius of 15 metres from a drill sample, and indicated resources were those from 15 to 60 metres from a drill sample. A 3-dimensional block model was constructed and modelled using inverse distance techniques with data input from only those drill holes that had been chemically assayed and whose drill orientation was known. The results were reported as an in-situ resource with no property restrictions, recovery or dilution factors or economic considerations. Plan and cross-section views of the deposits as represented by the block model created for this resource estimate are shown in Figures 15 and 16.
153. In 2013 a new ore resource estimate and preliminary economic assessment were completed for the deposits [66]. Additional downhole data, not available for the 2008 assessment, were used in this estimate. As well, drill holes without known survey data, excluded in the 2008 estimate, were used and considered as having been drilled vertically. A more detailed block model was constructed and kriging was used to incorporate geochemical data into the model. The results of this resource estimate are summarized in Table 17. The preliminary economic assessment was based on only a portion of this resource. For mine design, indicated resources using a cutoff of 0.06% U3O8 were selected. Although both surface and underground mining were considered, for this study an underground mine was designed. Further studies were recommended that might utilize a combination
Historic Measured and Indicated Reserve - 1982 (not NI 43-101 compliant)1
Historic Measured and Indicated Reserve - 1984 (not NI 43-101 compliant)2
Measured and Indicated Mineral Resource CIM - 20083
Indicated Mineral Resource CIM - 20134
Inferred Mineral Resource CIM - 20134
Cutoff Grade (% U3O8)
Million Pounds U3O8
Cutoff Grade (% U3O8)
Million Pounds U3O8
Cutoff Grade (% U3O8)
Million Pounds U3O8
Cutoff Grade (% U3O8)
Million Pounds U3O8
Cutoff Grade (% U3O8)
Million Pounds U3O8
South Coles Hill Deposit - - 0.200 15 - - 0.150 21 0.150 14 0.150 23 0.150 10 0.150 0.85 0.050 49 0.050 42 0.050 54 0.050 48 0.050 6 0.025 55 - - 0.025 72 0.025 69 0.025 12 North Coles Hill Deposit Indicated Resource 0.200 3 0.150 4 - - 0.150 4 0.150 2 0.150 0.04 0.050 42 - - 0.050 23 0.050 35 0.050 5 0.025 54 - - 0.025 47 0.025 64 0.025 18 1 Estimated by Pincock, Allen and Holt, Inc., August, 1982 [67]. 2 Estimated by UMETCO in 1984 [67]. 3 Estimated by Behre Dolbear, CIM standardized, NI 43-101 compliant [67]. 4 Estimated by Lyntec Inc. and BRS Engineering, CIM standardized, NI 43-101 compliant [66].

of open the depo 154. 166/kg Uconsiderthe depoeffect [6reserves CIM, N 155. as the toclassific2009 sysResourcprice of USD < 2forward category Figure 1Plan vie0.1% U3
pit and undeosit.
The preliminU) and basedred in the reposit continued66]. Because s.
NEA-IAEA a
Indicated miotal indicatedcation in Tabstems. Indica
ces in the NEUSD 64/lb U
260/kg U (Ucost categor
y (Table 18).
15 ew of the nor3O8 cutoff [6
erground met
nary economd on current uport, the depod to be the 1of this mora
and UNFC-2
ineral resourd and inferredle 18 [66]. Tated resource
EA-IAEA SysU3O8 (USD 1SD 100/lb Ury is unknow
rth (NCHD) a7]
thods of extr
mic assessmenunderstandinosit was econ982 morator
atorium, mine
2009 classific
rces used in td resources nThese resoures in the CIMstem [3]. The166/kg U), th
U3O8). For indwn. The NEA
and south (S
raction, and t
nt concludedngs of the connomically virium on uraneral resource
cation of res
the feasibilitynot included rces are classM system aree feasibility herefore the cdicated resou
A-IAEA syste
CHD) depos
this would ch
d that at a printinuity of oriable. The priium mining es at Coles H
sources at C
y study of thin the feasib
sified in the Ce equivalent tstudy of the cost category
urces not inclem recognize
sits as repres
hange the eco
ce of USD 6re, and a numimary risk rein Virginia, w
Hill cannot be
Coles Hill
e resources ability study, aCIM, NEA-IAto Reasonabldeposits is b
y under the Nluded in the fes inferred re
ented in a blo
onomic analy
64/lb U3O8 (mber of otheelated to minwhich is stille classified a
at Coles Hillare used as a AEA and UNly Assured based on a urNEA-IAEA sfeasibility stuesources as a
lock model u
39
ysis of
(USD r factors
ning of l in
as
l, as well basis for
NFC-
ranium system is udy, the
a separate
using a

Figure 1Cross seusing a 0
156. project ffeasibiliteconomimost appdevelopmresource Table 18Mineral NEA-IA
MillionpoundsU3O8
1
642
1323
303
1 Note th17 for a s2 Portion Hill depo3 Total InEngineer
16 ection view o0.1% U3O8 c
The UNFC cfeasibility (Fty (F), Indicaic assessmenpropriate becment pendines and inferre
8 resources of
AEA and UN
n s 1
CutoffGrade
(%U3O8
0.06
0.025
0.025
e total resourcsummary of thof those indic
osits [66]. ndicated and Iring [66].
of the north (utoff [67]
classificationF), geologic cated resourcent of Coles Hcause project
ng improvemed resources,
f the North aNFC-2009 cla
f e
8)
CIMClassific
IndicaResou
IndicaResou
InferrResou
ce estimated fhe mineral rescated resource
nferred Resou
(NCHD) and
n system provcertitude (G) es with a gra
Hill would falt activities arents in price , these would
and South Coassification sy
M cation
NEUR
Cla
ated urce
ReasAssuResothat cprodu<USD
ated urce
ReasAssuResounkncateg
red urce
InferReso
for the Coles Hsources estimaes used for mi
urce for the Co
d south (SCH
vides a mechand socio-ec
ade cutoff of ll into the F 2re on hold aw and access. d be likewise
oles Hill Depystems
EA-IAEA Uranium Resource assification
sonably ured ource (RAR) could be uced for D 260/kg U
sonably ured ource with nown cost gory
rred ource
Hill deposits iated for the deine design and
oles Hill depo
HD) deposits
hanism to caconomic viab0.05 % U3O2.2 category waiting justifConsidering
e classified a
posits (combi
UNFC-200Categorie
E F
3. 3 2.2
3.3 2.2
3.3 2.2
s not the sum eposits. d the prelimina
osits as calcula
as represente
tegorize projbility (E). W8 used in the (Table 18). T
fication for cg separately tas F 2.2.
ined) as class
09 s
UNFCCl
G
2 Non-CommProje
2 Non-CommProje
3 Non-CommProje
of entries in t
ary economic
ated by Lyntec
ed in a block
jects based oWhen conside
preliminaryThis classifi
commercial the total indi
sified in the
C-2009 lass
US
-mmercial
ect
Devnot
-mmercial
ect
Devnot
-mmercial
ect
Devnot
this column. S
assessment o
c Inc. and BR
40
k model
on ring
y cation is
cated
CIM,
NFC-2009 Sub-Class
velopment t viable
velopment t viable
velopment t viable
See Table
f the Coles
RS

41
157. When considering geologic certitude (G), indicated resources are moderately well understood based on projections made a relatively short distance from known mineralization (drill holes) and would therefore be classified G2. Estimates of inferred resources at Coles Hill are poorly defined because of limited drilling and an incomplete understanding of the continuity of mineralization and would fall into category G3. 158. Finally, when estimating socioeconomic viability (E) of resources at Coles Hill, all resource categories at Coles Hill are best categorized as E 3.3 because those resources are a) not economic at current market conditions, nor b) extractable due to a moratorium on uranium mining in the state of Virginia. Even if the resource at Coles Hill could be extracted economically, it will not be extracted due to the moratorium and is not therefore expected to be available for sale in the foreseeable future. There is great uncertainty in this particular classification category due to fluctuations in uranium prices and vagaries of political limitations on mining. If there were no moratorium on mining, resources in these categories would probably rise to the E2 category. In the situation where the mining moratorium was lifted, extraction would be feasible in the foreseeable future if uranium prices rise, thereby justifying this reclassification into E2. If this moratorium is lifted, and prices climb to closer to the price used in the pre-feasibility model, the classification in this category could change quickly and significantly. However, currently because of the E3.3 classification, this project would be considered “non-commercial”, with a UNFC-2009 subclass of “development not viable”. Conclusion 159. Examination of historic resource estimates and modern feasibility studies based on mineral resource classification systems used in the 1980s and NI 43-101 compliant classification systems for the Coles Hill deposits provide an incomplete understanding of the viability of the project. A moratorium on uranium mining in the state of Virginia adds another level of uncertainty to the probability that this resource will be produced in the foreseeable future. Applying UNFC-2009 to classify mineral resources estimated for the Coles Hill deposits illustrates how this system can add an increased level of understanding of the resource by reflecting the impact the moratorium has on the socio-economic viability of the project. Because of this moratorium, and current low uranium prices, development of the project is currently not viable. However if the moratorium is lifted, the classification under UNFC-2009 Singhbhum Shear Zone would likely change as this level of uncertainty is removed.
III. References [1] United Nations Framework Classification for Fossil Energy and Mineral Reserves and Resources (UNFC-2009); administered by the United Nations Economic Commission for Europe (ECE), Geneva, Switzerland. Available at http://www.unece.org/energy/se/reserves.html [2] UNECE (2014) Application of the United Nations Framework Classification for Fossil Energy and Mineral Reserves and Resources 2009 to nuclear fuel resources. Bridging Document between the Organisation of Economic Co-operation and Development Nuclear Energy Agency/International Atomic Energy Agency Uranium Classification and UNFC-2009. Available at http://www.unece.org/fileadmin/DAM/energy/se/pdfs/egrc/egrc6_apr2015/ECE.ENERGY.2014.6_e.pdf [3] Nuclear Energy Agency (NEA) Organization for Economic Co-operation and Development (OECD) and the International Atomic Energy Agency (IAEA) (2014) Uranium 2014: Resources, Production and Demand. OECD Report No. 7209, 504 p. [This is the most recent volume of the series informally referred to as the “Red Book”.] Available at http://www.oecd-nea.org/pub/

42
[4] CRIRSCO International Reporting Template for Exploration Results, Mineral Resources and Mineral Reserves; administered by the Committee for Mineral Reserves International Reporting Standards. Available at http://www.crirsco.com/template.asp [5] Li Shengxiang et al. (2002) Geologic Evolution and Uranium Metallogenic Regularity of the Yili Basin, Sandstone-type Uranium Deposits in China: Geology and Exploration Techniques, Atomic Energy Press, v. 9, p. 53–64. [6] Lin Shuangxin, Wang Baoqun, Li Shengxiang (2004) Characteristics of uranium mineralization and ore-controls of Kujieertai Deposit, Yili Basin, Xinjiang Autonomous Region. IAEA-TECDOC-1396, p. 79–90. [7] Classification for resources/reserves of solid fuels and mineral commodities, China National Standard GB/T17766-1999, issued by the State Bureau of Quality and Technical Supervision (in Chinese). [8] Specifications for uranium mineral exploration, China Geological and Mineral Resources Industry Standards DZ/T 0199-2002, issued by the Ministry of Land and Resources P.R. China ( In Chinese). [9] Nie Fengjun et al. (2009) Progress report on nuclear science and technology in China (Vol.1). Proceedings of academic annual meeting of China Nuclear Society, No.6. [10] Standards & Guidelines for Resources & Reserves—National Instrument 43-101; developed by the Canadian Securities Administrators (CSA). Available at http://web.cim.org/standards/MenuPage.cfm?sections=177,181&menu=229 [11] U3O8 Corporation (2011) http://www.u3o8corp.com [12] UrAmerica Limited (2014) http://www.uramerica.co.uk [13] Honorable Legislatura de la Provincia del Chubut (2003) http://www.legischubut2.gov.ar/digesto/lxl/XVII-68.html [14] Honorable Cámara de Diputados de la Provincia de Mendoza (2007) http://www.tribunet.com.ar/tribunet/ley/7722.htm [15] BENÍTEZ, A., FUENTE, A., MALOBERTI, A., LANDI, V., BIANCHI, R., MARVEGGIO DE BIANCHI, N., GAYONE, M. (1993) Evaluación de la Mina Nuclear Cerro Solo, Prov. del Chubut, XII Congreso Geológico Argentino, Proceedings T., volume V, p. 272–278. [16] FUENTE, A., GAYONE, M. (1999) Distrito uranífero Pichiñán, yacimientos Los Adobes, Cerro Cóndor y Cerro Solo, Chubut, In E. Zappettini (Ed.), Recursos Minerales de la República Argentina, Anales Nº 35 SEGEMAR, p. 1255–1259. [17] BIANCHI, R., PÁEZ, M. (2005) Tipificación y distribución de depósitos de uranio en la cuenca del Golfo de San Jorge, 16º Congreso Geológico Argentino, La Plata (Argentina), 20-23 September, Proceedings (CD-ROM). [18] Bianchi, R., Grüner, R. (2010) Uranium Exploration, Resources and Production in Argentina. Prepared for the NEA-IAEA Red Book 2011. CNEA internal report, unpublished. [19] NAC International (1997) Cerro Solo Uranium – Molybdenum deposit, Chubut Province, Argentina, Pre-feasibility study prepared for the CNEA, 169 p., internal report, unpublished.

43
[20] KLEIMAN, L. (1999) Mineralogía y petrología del volcanismo permo-triásico del Bloque San Rafael en el área de Sierra Pintada, provincia de Mendoza, y su relación con las mineralizaciones de uranio, PhD Thesis, University of Buenos Aires, unpublished. [21] SALVARREDI, J. (1999) Yacimiento Doctor Baulíes y otros depósitos del distrito uranífero Sierra Pintada, Mendoza, In E. Zappettini (Ed.), Recursos Minerales de la República Argentina, Anales Nº 35 SEGEMAR, p. 895–906. [22] NAVARRA, P., SARDIN, P., URQUIZA, L. (2006–2013) Tabulación de Recursos Uraníferos en Argentina, CNEA internal report, unpublished. [23] Maneschi, E., Tomellini, G. (1970–1980) Ensayos de lixiviación alcalina al mineral del Yacimiento Sierra Pintada, CNEA internal report, unpublished. [24] SILVA PAULO, P., ET AL. (2006) Evaluation of microbial leaching of uranium from Sierra Pintada ore. Preliminary studies at laboratory scale. IAEA Technical Meeting “Uranium Exploration, Mining, Production and Mine Remediation and Environmental Issues”, Mendoza. [25] PERRINO, J., TOMELLINI, G., NAVARRA, P. (2000–2005) Síntesis de ensayos de lixiviación mediante stalles en el yacimiento Sierra Pintada, CNEA internal report, unpublished. [26] Coffey Mining Pty Limited (2011) NI 43-101 Technical Report Laguna Salada Initial Resource Estimate, Prepared on behalf of U3O8 Corporation, 30 p., www.sedar.com [27] U3O8 Corporation (2014) Press Release, http://www.u3o8corp.com [28] Andrew Pedley Geological Consultant (2013) NI 43-101 Technical Report on the Paso De Indios Block Property Within the Central Plateau Project Located in the Chubut Province of Argentina, Prepared For UrAmerica Limited, 92 p., unpublished. [29] GORUSTOVICH, S. (1989) Metalogénesis del uranio en el Noroeste Argentino, PhD Thesis, University of Salta, unpublished. [30] ROMANO, H. (1999) Distrito Uranífero Tonco Amblayo, Salta, 1999, In E. Zappettini (Ed.), Recursos Minerales de la República Argentina, Anales Nº 35 SEGEMAR, p. 959–970. [31] LOPEZ, L. (2013) Perspectives of ISR Uranium Mining in Argentina (IAEA TC Project ARG3012/3014). IAEA Technical Meeting on Optimization of In Situ Leach (ISL) Uranium Mining Technology, Vienna (Austria), 15 -18 April 2013. [32] LOPEZ, L., SLEZAK, J. (2014) Technological transfer on in situ leaching (ISL) mining: A more sustainable alternative for uranium production in Argentina, Best Practices Dissemination Meeting INT/0/085, IAEA, Vienna (Austria), 3–4 February 2014. [33] Leonardos, O. (1956), In Memória SBPC • Ata da Primeira Reunião (In Portuguese). Available at http://www.sbpcnet.org.br/site/publicacoes/outras-publicacoes/caderno_digital/caderno_15.pdf [34] World Thorium Deposits and Resources (ThDEPO); database maintained by the International Atomic Energy Agency (IAEA). Available at https://infcis.iaea.org/THDEPO/About.cshtml [35] Paes de Andrade, R.H. (2013) – DNPM Sumário Mineral Brasileiro, terras raras. Available at https://sistemas.dnpm.gov.br/publicacao/mostra_imagem.asp?IDBancoArquivoArquivo=9006

44
[36] AMB (2010) Brazilian Minerals Yearbook. Available at http://www.dnpm.gov.br/dnpm/paginas/anuario-mineral/arquivos/ [37] Villas-Bôas, Roberto C. (2014) – Thorium, UNFC (3, 3, 3) in Brasil – URAM-2014. Available at http://www-pub.iaea.org/iaeameetings/cn216pn/Thursday/Session10/036-Villas-Boas.pdf [38] Ayoub, J.M.S. (2014) – Indústrias Nucleares do Brazil (INB), Personal communication [39] INB (2014) – Industrias Nucleares do Brasil http://www.inb.gov.br/pt-br/WebForms/interna.aspx?secao_id=62 [40] Da Silva, L.F. (2014) – Indústrias Nucleares do Brazil (INB), Personal communication [41] Sarangi, A. K. (2014) Uranium exploration, resources and production in India, Geo-Resources, Scientific Publishers (India), Volume Part II, chapter 25. [42] Report of the Committee on Standardization of Terminologies and Classification of Ore reserves, Geological Survey of India, 1981. [43] U.S. Bureau of Mines and the U.S. Geological Survey, 1980, Principles of a resource/reserve classification for minerals: U.S. Geological Survey Circular 831, 5 p. [44] Yager, Thomas, R. (2014) The Mineral Industry of Malawi. U.S. Geological Survey 2012 Minerals Yearbook. [45] Paladin Energy Ltd. Kayelekera-Malawi—Current Status. http://www.paladinenergy.com.au/default.aspx?MenuID=33 (accessed October 8, 2014). [46] Paladin Energy Ltd. Kayelekera-Malawi. "Geology & Resources." http://www.paladinenergy.com.au/default.aspx?MenuID=30 (accessed October 8, 2014). [47] Globe Metals & Mining Africa (Pty) Ltd. (2013) Updated JORC Resource Estimate – Kanyika Niobium Project. http://www.asx.com.au/asxpdf/20130107/pdf/42c9j20x760qf2.pdf (accessed October 8, 2014). [48] Globe Metals & Mining, 2014, Kanyika Niobium Project. http://www.globemetalsandmining.com.au/Projects/Kanyika-Niobium-Project.aspx#.VDUej2eSx8E (accessed October 8, 2014). [49] Tse, Pui-Kwan (2011) China’s rare-earth industry: U.S. Geological Survey Open-File Report 2011–1042, 11 p., http://pubs.usgs.gov/of/2011/1042/ [50] China National Bureau of Statistics (2010) China statistical yearbook, 2009: Beijing, China, China Statistics Press, 1,032 p. (In Chinese.) [51] Gambogi (2011) 2011 Minerals Yearbook—Rare Earths [Advance Release, U.S. Geological Survey], http://minerals.usgs.gov/minerals/pubs/commodity/rare_earths/myb1-2011-raree.pdf [52] Gambogi, Joseph (2014) Rare earths, U.S. Geological Survey Mineral Commodity Summaries, http://minerals.usgs.gov/minerals/pubs/commodity/rare_earths/ [53] Van Gosen, B.S., Verplanck, P.L., Long, K.R., Gambogi, Joseph, Seal II, R.R. (2014) The rare-earth elements—Vital to modern technologies and lifestyles: U.S. Geological Survey Fact Sheet 2014–3078, 4 p. Available at http://pubs.usgs.gov/fs/2014/3078/
45
[54] Wouters, M., Selto, F.H., Hilton, R.W., Maher, M.W. (2012) Cost Management: Strategies for Business Decisions, International Edition, McGraw-Hill, p. 535. [55] Long, K.R., Van Gosen, B.S., Foley, N.K., Cordier, Daniel (2010) The principal rare earth elements deposits of the United States—A summary of domestic deposits and a global perspective: U.S. Geological Survey Scientific Investigations Report 2010–5220, 96 p. Available at http://pubs.usgs.gov/sir/2010/5220/ [56] European Commission (2008) Waste Framework Directive, http://eur-lex.europa.eu/legal-content/EN/TXT/?uri=CELEX:32008L0098 [57] United Nations Environmental Program (2013) "Guidelines for National Waste Management Strategies Moving from Challenges to Opportunities". ISBN 978-92-807-3333-4 [58] Indian Bureau of Mines (2012) Indian Mineral Yearbook 2011 (Part-II), Rare Earths (Advance Release) (http://ibm.gov.in/IMYB%202011_Rare%20Earths.pdf) [59] Gambogi, Joseph (2014) Thorium. U.S. Geological Survey Mineral Commodity Summaries, http://minerals.usgs.gov/minerals/pubs/commodity/thorium/ [60] Great Western Minerals Group (2014) Great Western Minerals Group company website, http://www.gwmg.ca/mining-operations/overview [61] Van Gosen, B.S.; Gillerman, V.S.; Armbrustmacher, T.J. (2009) Thorium deposits of the United States—Energy resources for the future?: U.S. Geological Survey Circular 1336, 21 p. Available at http://pubs.usgs.gov/circ/1336/ [62] Castor, S.B. (2008) The Mountain Pass rare-earth carbonatite and associated ultrapotassic rocks, California: The Canadian Mineralogist, v. 46, no. 4, p. 779-806. [63] MOLYCORP, INC. (2012) Molycorp's rare earth reserves at Mountain Pass increase by 36%, Molycorp, Inc. press release, 9 April, 2012. [64] Staatz, M.H., Hall, R.B., Macke, D.L., Armbrustmacher, T.J., Brownfield, I.K. (1980) Thorium resources of selected regions in the United States: U.S. Geological Survey Circular 824, 32 p. [65] Christopher, P.A. (2007) Technical report on the Coles Hill uranium property Pittsylvania County, Virginia NI-43-101 report prepared for Virginia Uranium Inc.: NI 43-101 Technical Report, www.sedar.com, 49 p. [66] Kyle, L., and Beahm, D. (2013) NI 43-101 preliminary economic assessment update (revised), Coles Hill uranium property, Pittsylvania County, VA USA, prepared by Lyntek Incorporated, Lakewood, CO, 126 p. [67] Maxwell, R.D., Gibbs, B.L., Pool, T.C., and Keim, K.S. (2009) Technical report on the Coles Hill uranium property, Pittsylvania County, Virginia, United States of America prepared for Santoy Resources and Virginia Uranium Inc.: NI43-101 reported available at www.sedar.com, 87 p. [68] Hibbard, J.P., Tracy, R.J., and Henika, W.S. (2003) Smith River allochthon: A southern Appalachian peri-Gondwanan terrane emplaced directly on Laurentia?: Geology, v. 31, p. 215–218.
_________________