Embed Size (px)
Citation preview

The Following document is an actualisation of:
Module 1 Basics of Nutrition and General food Distributions / March 2000
Technical and Research Department
Module 1
The Basics of Nutrition
Action contre la Faim – France Version 1
2007

MODULE 1 – THE BASICS OF NUTRITION
© ACF – Technical and Research Department – 2007 2
SUMMARY
LEARNING OBJECTIVES Page 5
BIBLIOGRAPHY Page 6
DEFINITIONS Page 7
I- NUTRITIONAL STATUS Page 9
A- SIGNIFICANCE OF NEEDS AND RECOMMENDED INTAKES. Page 9
B- REQUIREMENTS AND DIETARY REFERENCE VALUES Page 10
1- ENERGY Page 10
1.1- Introduction Page 10 1.2- Definitions Page 12 1.3- Sources of dietary energy Page 13
1.4- Components of energy requirements Page 13
1.5- Calculation of energy requirements Page 14
1.6- Energy requirements Page 15
2- PROTEIN REQUIREMENT (Essential and Non-essential Amino Acids) Page 16 2.1- Essential Amino Acids Page 16
2.1.1- Balanced Intake - a limiting factor. Page 17
2.1.2- Supplementation / Combination / Complementation Page 17
2.2- Estimation of Protein requirements Page 17
3- LIPID REQUIREMENTS Page 18
4- CARBOHYDRATE REQUIREMENTS Page 19
5- WATER AND ELECTROLYTE REQUIREMENTS Page 19
6- VITAMIN REQUIREMENTS Page 20
6.1- Definitions Page 20
6.2- Vitamin A – Retinol Page 20
6.3- B- Complex Vitamins Page 23
6.3.1- Vitamin B1 - Thiamin - anti beriberi factor - anti neuritis Page 23
factor – aneurine
6.3.2- Vitamin B2 – Riboflavin Page 25
6.3.3- Niacin B3 - Vitamin B3 - Vitamin PP Page 26
6.3.4- Pantothenic Acid - Vitamin B5 Page 27
6.3.5- Vitamin B6 – Pyridoxine Page 28
6.3.6- Biotin - Vitamin H - Vitamin B8 Page 29
6.4- Folic acid - Vitamin B9 Page 30
6.5- Vitamin B12 - Part of Cobalamine family Page 32
6.6- Vitamin C - Ascorbic Acid Page 33
6.7- Vitamin D – Calciferol Page 34
6.8- Vitamin E – Tocopherol Page 35

MODULE 1 – THE BASICS OF NUTRITION
© ACF – Technical and Research Department – 2007 3
6.9- Vitamin K Page 35
7- MINERALS AND TRACE ELEMENTS Page 37 7.1 Calcium Page 37
7.2- Zinc Page 38
7.3- Copper Page 38
7.4- Magnesium Page 39
7.5- Iodine Page 40
7.6- Iron Page 41
7.7- Potassium Page 43
7.8- Other Trace Elements Page 43
II- FOODS Page 46
A- FOOD COMPOSITION Page 46
1- PROTEINS Page 46 1.2- Animal Products Page 46
2- LIPIDS Page 48 2.1- Fats of vegetable and animal origin Page 48
2.2- Butters and Margarine’s Page 50
2.3- Oil producing seeds and fruits Page 50
3- CARBOHYDRATES Page 50
3.1- Cereals Page 50
3.2- Roots and Tubers Page 52
3.3- Sugar Products Page 53
4- VITAMINS AND MINERALS Page 53 4.1- Vegetables Page 53
4.2- Fruits Page 53
5- ANTI-NUTRITIONAL FACTORS, CONTAMINANTS Page 53 5.1- Contaminants Page 54
5.2- Anti-Nutritional Factors Page 54
B- FOOD RATIONS Page 55
1- CALCULATION OF FOOD RATION Page 55 1.1- In practice: calculating a food ration Page 55
2- BALANCED FOOD RATIONS Page 57 2.1- Energy. Page 58
2.2- The Nutrients Page 58
III- MALNUTRITION Page 59
A- MICRONUTRIENTS Page 59
1- MICRONUTRIENTS CHARACTERISTICS Page 59

MODULE 1 – THE BASICS OF NUTRITION
© ACF – Technical and Research Department – 2007 4
2- TYPE 1 AND TYPE 2 MICRONUTRIENTS Page 59
B- THE DIFFERENT TYPES OF MALNUTRITION Page 60
1- TYPE I MALNUTRITION Page 60
2- TYPE II MALNUTRITION Page 60
2.1- Acute malnutrition / Wasting Page 60
2.1.1- Severe Acute Malnutrition (SAM) Page 60
2.1.2- Moderate Acute Malnutrition (MAM) Page 62
2.2- Chronic malnutrition / Stunting Page 63
2.3- Underweight malnutrition or Undernutrition (measured Page 63
by growth monitoring curve in most health book)
3- MEASUREMENTS OF MALNUTRITION Page 63
C- THE CAUSES OF MALNUTRITION Page 63
1- A CONCEPTUAL FRAMEWORK OF THE CAUSES Page 63
OF MALNUTRITION IN EMERGENCIES
2- ANALYSING THE DETERMINING FACTORS Page 65
OF NUTRITIONAL STATUS
2.1- -The underlying causes: Page 65
2.1.1- Food security Page 65
2.1.2- Public health – Basic health services and environmental health Page 65
2.1.3- Social environment Page 65
2.2- The basic Causes Page 66
EXERCICES Page 67

MODULE 1 – THE BASICS OF NUTRITION
© ACF – Technical and Research Department – 2007 5
TEACHING OBJECTIVES
After studying this module, you should be able to:
1- Define the individual needs and necessary nutritional requirements for different ages
2- Know the nutritional values of the principle foods and assess, to which degree, they can
cover the nutritional requirements of individuals
3- Calculate a balanced food ration (both in quality and in quantity)
4- Know the procedures to follow to enrich a food ration
5- Define type 1and type 2 micronutrients
6- Define the different types of malnutrition

MODULE 1 – THE BASICS OF NUTRITION
© ACF – Technical and Research Department – 2007 6
BIBLIOGRAPHY
ACTION CONTRE LA FAIM: Assessment and Treatment of Malnutrition in Emergency
Situations. Manual of Therapeutic Care anf Planning for a Nutritional Programme, 2001, page 58,
59 & 60. Claudine Prudhon
ACTION CONTRE LA FAIM: Les micronutriments et leurs carences. Capitalisation thématique /
Service Nutrition. Département Technique ACF-France, May 2006. Emilie de Saint Pol
BEGHIN I.: Guide for Nutritional diagnosis. WHO, Geneva, 1988, p84.
C.E.I.V (Centre d’Etude et d’Information sur les Vitamines): Vita Memo – The essential guide to
Vitamins.
DUPIN H., CUQ J.L.: Food and Human Nutrition. ESF, 1992.
DUPIN H., HERCBERG S.: Establishment of Recommended Nutrition Intakes. Complementary
to epidemiology and other disciplines. In: Nutrition and Public Health. Technique et
documentation Lavoisier 1985. p 437 - 778.
FAO / WHO / UNU : Human Energy requirements. Report of a joint FAO/WHO/UNU
Expert Consultation, Rome, 17-24 October 2001
FAO / WHO: Human Vitamin and Mineral Requirements. Report of a joint FAO/WHO
expert consultation, Rome, 2001
FAO.: Composition Tables
FAO: Family Nutrition Guide. By Ann Burgess FAO Consultant with Peter Glasauer FAO
Food and Nutrition Division, Rome 2004
Pr. GOLDEN M. & GRELLETY Y.: The Management of Acute, Severe Malnutrition. A
suggested manual for Xxxxxx. Draft 3.4, May 2004
Pr. GOLDEN M. & GRELLETY Y.: Guidelines for the management of the severely
malnourished. Draft 1, version October 2006 (from version August 2006)
HERCBERG S., DUPIN H., PAPOZ L., GALAN P.: Nutrition and Public Health: Political and
epidemiological approach. Technique et Documentation Lavoisier. 1985. p 709.
Pr. GOLDEN M. & GRELLETY Y.: The response to nutrient deficiency. Type 1 and type 2
responses, 2003
MC CANCE and WIDDOWSON’S: Composition Tables
OMS: Diet, nutrition and prevention of chronic disease. Rapport technique No. 797, 1990.
RICOUR C., GHISOLFI J., PUTET G., GOULET O., Treatment of Child Nutrition. Maloine,
Paris - 1993.
UNICEF: The State of the World’s Children, 1998
WATERLOW JC.: Protein Energy Malnutrition. Edward Arnold, London, 1992, p 402.

MODULE 1 – THE BASICS OF NUTRITION
© ACF – Technical and Research Department – 2007 7
SOME DEFINITIONS.
Food.
«Food can be considered as all that is a source of nourishment, that is to say, nutritional materials
that can be directly absorbed, but should not only be named by custom, desires and types of
civilisation»
Definition of the New and Popular Encyclopaedia – S.MAUNDER (1848).
«Foodstuffs comprising nutrients, therefore nourishment, able to satisfy the appetite, so appetising
and habitually consumed in a considered society and can therefore be considered customary».
(TREMOLIERE.S)
Feeding.
«The action of providing and consuming food» (Larousse).
Nutrients. All the elements or components either organically or inorganically composed contained in foods
and that can be utilised by the organism without suffering digestive transformation so that they
may be assimilated by the cells. The foods are transformed into nutrients by the digestive juices.
The proteins are the ‘forming’ or ‘building’ nutrients and the sugars and fats are the energetic
nutrients».
(Flammarion Medical Dictionary).
Nutrition. 1. The collection of processes whereby living organisms utilise food to ensure the life, their
growth, the normal functioning of organs and their tissues as well as the production of energy.
The idea of ‘nutrition’ is understood as ‘feeding’, but the two terms are not synonymous.
2. Science devoted to the study of food and their nutritional value, the reactions to the ingestion of nourishment as well as the variations in feeding whether the subject is ill or healthy. This
pluri-disciplined science is interested in the physiological and physio-pathological aspects, in
the technology and the economy of foodstuffs, in the psychosocial, sociological, historical and
geographical behaviour of food.
(Flammarion Medical Dictionary).
Nutritional Status. Status of the organism is the result of digestion, absorption and utilisation of food, as well as
factors of natural pathology. (Defined by World Health Organisation).
Nutritional Needs.
The nutritional needs are studied by physiologists and biologists. They are able to estimate to a
certain precision if, at the same time, criteria are set that are to be used for the evaluation of the
needs. (For example, the minimal necessary quantity of a given nutrient to compensate for all the
losses of the organism, to assure the metabolic functions where the nutrients are involved, as well
as maintaining the reserves). The condition in which the subject is confronted also has to be
defined. These would include the environment, previous nutritional status, composition of the
ration, etc.
Recommended Intakes.
The nutritional intakes are the chosen values by a group of experts which took into account not
only the scientific data concerning nutritional requirements, but also the nutrient absorption rate;

MODULE 1 – THE BASICS OF NUTRITION
© ACF – Technical and Research Department – 2007 8
the bioavailability; and the motivation and food practices of the people concerned and the extent
to which these habits are harmful to health. These recommended intakes can be defined as the
average quantities of each nutrients per person per day in order to satisfy the needs of a group of
individuals or a population to a level that ensures a good state of nutrition.
These intakes should be sufficiently large to satisfy the needs of almost all the individuals in a
group with specific characteristics (age, sex, height, activity and physique). (HERCEBERG S.,
DUPIN H, PAPOZ L, GALAN P. – Nutrition and Public Health: Epidemiological and Political
Approach to –Prevention – Paris: Lavoisier, 1985).

MODULE 1 – THE BASICS OF NUTRITION
© ACF – Technical and Research Department – 2007 9
I- NUTRITIONAL STATUS
A- SIGNIFICANCE OF NEEDS AND RECOMMENDED INTAKES
Human nutritional status is conditioned essentially by its relationship with its physical,
biological and cultural environment. Only an ecological approach can be allowed today to
understand the respective place of the many integrated determinants in the development of
nutritional problems, such as they are observed in our diverse human societies. These
determinants are of a very diverse nature: biological (physiological, metabolical), socio-
economic, socio-cultural, agricultural, demographic, political….
They all have an impact on the nutritional status of individuals, either by determining their
food intake or on their nutritional needs (depending on their way of life)
The nutritional status is good when food intake equals nutritional needs:
Factors affecting Nutritional Status.
NUTRITIONAL STATUS
NUTRITIONAL INTAKE NUTRITIONAL REQUIREMENTS
Loss, utilisation and reserves.
Individuals differ from one to another regarding their needs or the metabolic utilisation of
the nutrients, it is evident that the ‘recommended nutritional intakes’, calculated to satisfy the
grand majority of individuals, exceed the needs of a certain number of individuals. A lower
intake is not necessarily synonymous with deficiency, but the more the intake is deemed
deficient in relation to the recommended intake, the more the individual risks not satisfying
his or her proper level of requirements. The lower the intake, the higher the risk of developing
a deficiency.
There are two different ways of calculating the recommended intake:
1- Recommending high intakes: recommending « comfortable » intakes that cover the needs of 97.5 % of the population will reduce the risk of deficiency. This means that the intake
will exceed the needs of a great proportion of the population, and this method is used in the
case of nutrients that cannot cause adverse effect when taken in excess. These nutrients
are, for example, vitamins, minerals, proteins. However, a maximum intake should be
defined for some of these nutrients, like for example vitamins D and A, in order to avoid
certain side effects that can be linked to an intake that is too high compared to the needs.
2- Recommending intakes that correspond to the average needs of the population. In this
case, the recommended intake covers the needs of 50% of the population. This method is
used for energy. An excessive intake of calories can lead to overweight and obesity, which

MODULE 1 – THE BASICS OF NUTRITION
© ACF – Technical and Research Department – 2007 10
in turn can be the cause of different diseases. It is therefore not appropriate to recommend
an intake that is higher than the needs of the majority of the population. Recommended
energy intake is an average but there are huge differences between individuals as regards
their real energy needs.
The figures indicated by the Committee of experts, in France and in other countries, should
not in any case be taken as calculated ‘norms’. These are the ‘markers’, the indicative values
that are judged as desirable, not for an isolated individual, but for a group of individuals in
function of age, sex, as well as other parameters.
Source: «Food and Human Nutrition» DUPIN/CUQ
The calorific supply depends on the food in question. The foods hold their nutritional value
in a relatively limited number of substances, that are the nutrients. To distinguish:
- Macronutrients: Proteins, fats and sugars, which contain energy and certain minerals.
- Micronutrients: mostly vitamins and minerals assist in the utilisation of proteins, fats and
sugars.
Some nutrients present in food are very complex and need to be broken down (into cellular
nutrients) during digestion, so that the body can make use of them. Others, like vitamins and
minerals, can be absorbed straight away.
Categorisation of Principle Nutrients. Cellular nutrients
Proteins------------------------------ Digestion--------------> Amino Acids
Complex Fatty Acids-------------- Digestion--------------> Fatty Acid, glycerol,
cholesterol
Complex Carbohydrates---------- Digestion--------------> Glucose (sugars)
Simple Carbohydrates-----------
Minerals (in the form of salt) Direct Absorption----> Mineral Salts
Vitamins Vitamins
Water Water

MODULE 1 – THE BASICS OF NUTRITION
© ACF – Technical and Research Department – 2007 11
B- REQUIREMENTS AND DIETARY REFERENCE VALUES
1- ENERGY
1.1- Introduction
Human energy requirements are estimated from measures of energy expenditure plus the
additional energy needs for growth, pregnancy and lactation. Recommendations for dietary
energy intake from food must satisfy these requirements for the attainment and maintenance
of optimal health, physiological function and well-being. The latter (i.e. well-being) depends
not only on health, but also on the ability to satisfy the demands imposed by society and the
environment, as well as all the other energy-demanding activities that fulfil individual needs.
Energy balance is achieved when input (i.e. dietary energy intake) is equal to output
(i.e. total energy expenditure), plus the energy cost of growth in childhood and pregnancy, or
the energy cost to produce milk during lactation. When energy balance is maintained over a
prolonged period, an individual is considered to be in a steady state. This can include short
periods during which the dayto-day balance between intake and expenditure does not occur.
An optimal steady state is achieved when energy intake compensates for total energy
expenditure and allows for adequate growth in children, and pregnancy and lactation in
women, without imposing metabolic, physiological or behavioural restrictions that limit the
full expression of a person’s biological, social and economic potential.
Within certain limits, humans can adapt to transient or enduring changes in energy
intake through possible physiological and behavioural responses related to energy expenditure
and/or changes in growth. Energy balance is maintained, and a new steady state is then
achieved. However, adjustments to low or high energy intakes may sometimes entail
biological and behavioural penalties, such as reduced growth velocity, loss of lean body mass,
excessive accumulation of body fat, increased risk of disease, forced rest periods, and
physical or social limitations in performing certain activities and tasks. Some of these
adjustments are important and may even increase the chances of survival in times of food
scarcity.

MODULE 1 – THE BASICS OF NUTRITION
© ACF – Technical and Research Department – 2007 12
Principle of Balanced Energy:
CALORY INTAKE
RESERVES
ABSORBED ENERGY GLUCOSE Energy Stored ENERGY in the BLOOD TRIGLYCERIDES Energy Used ADIPOSE TISSUE AVAILABLE ENERGY MOBILISATION METABOLISM THERMOGENESIS PHYSICAL ACTIVITY
ENERGY SPENT
1.2- Definitions: An adequate, healthy diet must satisfy human needs for energy and all essential nutrients.
Furthermore, dietary energy needs and recommendations cannot be considered in isolation of
other nutrients in the diet, as the lack of one will influence the others. Thus, the following
definitions are based on the assumption that requirements for energy will be fulfilled through
the consumption of a diet that satisfies all nutrient needs. Energy requirement is the amount of food energy needed to balance energy expenditure in
order to maintain body size, body composition and a level of necessary and desirable physical
activity consistent with long-term good health. This includes the energy needed for the
optimal growth and development of children, for the deposition of tissues during pregnancy,
and for the secretion of milk during lactation consistent with the good health of mother and
child.
The recommended level of dietary energy intake for a population group is the mean energy
requirement of the healthy, well-nourished individuals who constitute that group.
Basal metabolic rate (BMR): The minimal rate of energy expenditure compatible with life. It
is measured in the supine position under standard conditions of rest, fasting, immobility,
thermoneutrality and mental relaxation. Depending on its use, the rate is usually expressed per
minute, per hour or per 24 hours.
Body mass index (BMI): The indicator of weight adequacy in relation to height of older
children, adolescents and adults. It is calculated as weight (in kilograms) divided by height (in
meters), squared.

MODULE 1 – THE BASICS OF NUTRITION
© ACF – Technical and Research Department – 2007 13
The acceptable range for adults is 18.5 to 24.9, and for children it varies with age.
Doubly labelled water (DLW) technique: A method used to measure the average total energy
expenditure of free-living individuals over several days (usually 10 to 14), based on the
disappearance of a dose of water enriched with the stable isotopes 2H and 18O.
Energy requirement (ER): The amount of food energy needed to balance energy expenditure
in order to maintain body size, body composition and a level of necessary and desirable
physical activity, and to allow optimal growth and development of children, deposition of
tissues during pregnancy, and secretion of milk during lactation, consistent with long-term
good health. For healthy, well-nourished adults, it is equivalent to total energy expenditure.
There are additional energy needs to support growth in children and in women during
pregnancy, and for milk production during lactation.
Heart rate monitoring (HRM): A method to measure the daily energy expenditure of free-
living individuals, based on the relationship of heart rate and oxygen consumption and on
minute-by-minute monitoring of heart rate.
Total energy expenditure (TEE): The energy spent, on average, in a 24-hour period by an
individual or a group of individuals. By definition, it reflects the average amount of energy
spent in a typical day, but it is not the exact amount of energy spent each and every day.
1.3- Sources of dietary energy
Energy for the metabolic and physiological functions of humans is derived from the chemical
energy bound in food and its macronutrient constituents, i.e. carbohydrates, fats, proteins and
ethanol, which act as substrates or fuels. After food is ingested, its chemical energy is released
and converted into thermic, mechanical and other forms of energy.
1.4- Components of energy requirements
Human beings need energy for the following:
� Basal metabolism. This comprises a series of functions that are essential for life, such as
cell function and replacement; the synthesis, secretion and metabolism of enzymes and
hormones to transport proteins and other substances and molecules; the maintenance of body
temperature; uninterrupted work of cardiac and respiratory muscles; and brain function. The
amount of energy used for basal metabolism in a period of time is called the basal metabolic
rate (BMR), Depending on age and lifestyle, BMR represents 45 to 70 percent of daily total
energy expenditure, and it is determined mainly by the individual’s age, gender, body size and
body composition.
� Metabolic response to food. Eating requires energy for the ingestion and digestion of food,
and for the absorption, transport, interconversion, oxidation and deposition of nutrients. These
metabolic processes increase heat production and oxygen consumption, and are known by
terms such as dietary-induced thermogenesis, specific dynamic action of food and thermic
effect of feeding. The metabolic response to food increases total energy expenditure by about
10 percent of the BMR over a 24-hour period in individuals eating a mixed diet.

MODULE 1 – THE BASICS OF NUTRITION
© ACF – Technical and Research Department – 2007 14
� Thermogenesis: To maintain a constant body temperature (near to 370C). Energy
expenditure for thermo-regulation is necessary in order to fight against the cold and varies
according to external temperatures.
WFP / UNHCR recommend an addition of 100 kcal, for each increment of five degrees below
200C
� Physical activity. This is the most variable and, after BMR, the second largest component
of daily energy expenditure. Humans perform obligatory and discretionary physical activities.
Obligatory activities can seldom be avoided within a given setting, and they are imposed on
the individual by economic, cultural or societal demands. They include daily activities such as
going to school, tending to the home and family and other demands made on children and
adults by their economic, social and cultural environment.
Discretionary activities, although not socially or economically essential, are important for
health, well-being and a good quality of life in general. They include the regular practice of
physical activity for fitness and health; the performance of optional household tasks that may
contribute to family comfort and well-being; and the engagement in individually and socially
desirable activities for personal enjoyment, social interaction and community development.
� Growth. The energy cost of growth has two components: 1) the energy needed to
synthesize growing tissues; and 2) the energy deposited in those tissues. The energy cost of
growth is about 35 percent of total energy requirement during the first three months of age,
falls rapidly to about 5 percent at 12 months and about 3 percent in the second year, remains
at 1 to 2 percent until mid-adolescence, and is negligible in the late teens.
� Pregnancy. During pregnancy, extra energy is needed for the growth of the foetus, placenta
and various maternal tissues, such as in the uterus, breasts and fat stores, as well as for
changes in maternal metabolism and the increase in maternal effort at rest and during physical
activity.
The increase in needs regarding pregnancy is particularly important to note for those women
having smaller reserves to support this rise. It is principally body fat that is expended at the
start of a pregnancy. Pregnant women should increase their food intake by 85 kcal/day in the
first trimester, 360 kcal/day in the second and by 475 kcal/day in the third.
� Lactation. The energy cost of lactation has two components: 1) the energy content of the
milk secreted; and 2) the energy required to produce that milk. Well-nourished lactating
women can derive part of this additional requirement from body fat stores accumulated during
pregnancy.
1.5- Calculation of energy requirements
The total energy expenditure of free-living persons can be measured using the doubly labelled
water technique (DLW)1 or other methods that give comparable results. Among these,
individually calibrated heart rate monitoring2 has been successfully validated. Using these
methods, measurements of total energy expenditure over a 24-hour period include the
metabolic response to food and the energy cost of tissue synthesis. For adults, this is
equivalent to daily energy requirements. Additional energy for deposition in growing tissues
is needed to determine energy requirements in infancy, childhood, adolescence and during
pregnancy, and for the production and secretion of milk during lactation. It can be estimated
1 Cf. 1.2- Definitions 2 Cf. 1.2- Definitions

MODULE 1 – THE BASICS OF NUTRITION
© ACF – Technical and Research Department – 2007 15
from calculations of growth (or weight gain) velocity and the composition of weight gain, and
from the average volume and composition of breast milk.
Total energy expenditure has also been measured in groups of adults, but this has been
primarily in industrialized countries. Variations in body size, body composition and habitual
physical activity among populations of different geographical, cultural and economic
backgrounds make it difficult to apply the published results on a worldwide basis. Thus, in
order to account for differences in body size and composition, energy requirements were
initially calculated as multiples of BMR. They were then converted into energy units using a
known BMR value for the population, or the mean BMR calculated from the population’s
mean body weight. To account for differences in the characteristic physical activity of the
associated lifestyles, energy requirements of adults were estimated by factorial calculations
that took into account the times allocated to activities demanding different levels of physical
effort.
The extra needs for pregnancy and lactation were also calculated using factorial estimates for
the growth of maternal and foetal tissues, the metabolic changes associated with pregnancy
and the synthesis and secretion of milk during lactation.
For further information on calculation formula, Cf. “Human energy requirements” Report of
a Joint FAO/WHO/UNU Expert Consultation Rome, 17-24 October 2001
Expression of requirements and recommendations
Energy requirements of the organism and energy content of foods are expressed in kilojoules
1 kcal =4.184 kJ; 1 kJ = 0.239 kcal
Gender, age and body weight are the main determinants of total energy expenditure. Thus,
energy requirements are presented separately for each gender and various age groups, and are
expressed both as energy units per day and energy per kilogram of body weight. As body size
and composition also influence energy expenditure, and are closely related to basal
metabolism, requirements are also expressed as multiples of BMR.
1.6- Energy requirements
Energy needs depend on age, weight, and physical activity. The FAO publishes
recommended energy intakes by age group, gender and physical activity

MODULE 1 – THE BASICS OF NUTRITION
© ACF – Technical and Research Department – 2007 16
DAILY RECOMMENDED INTAKES FOR ENERGY
SEX/AGE BODY WEIGHT ENERGY
Years kg kcal MJ
BOTH SEXES
0-6 months 6.0 524 2.19
6-11 months 8.9 708 2.97
1-3 12.1 1 022 4.28
4-6 18.2 1 352 5.66
7-9 25.2 1 698 7.10
GIRLS
10-17 46.7 2 326 9.73
SEX/AGE BODY WEIGHT ENERGY
Years kg kcal MJ
BOYS
10-17 49.7 2 824 11.81
WOMEN 55.0
18-59 2 408 10.08
Pregnant +278 +1.17
Breastfeeding +450 +1.90
60 and over 2 142 8.96
MEN 65.0
18-59 3 091 12.93
60 and over 2 496 10.44
Sources: Energy - FAO. 2004. Energy in human nutrition. Report of a Joint FAO/WHO/UNU Expert
Consultation. FAO Food and Nutrition Technical Paper Series, No. 1. Rome; Protein - WHO. 1985. Energy and
protein requirements. Technical Report Series 724. Geneva; Micronutrients - FAO/WHO. 2002. Human vitamin
and mineral requirements. Report of a Joint FAO/WHO Expert Consultation. Rome.
2- PROTEIN REQUIREMENT (Essential and Non-essential Amino Acids)
Proteins constitute the skeleton around which the cell arranges itself, according to a rigorous
composition. Certain proteins have particular physiological roles: producing skin and hair, the
material that contracts muscles, constitution of enzymes, anti-bodies and hormones...
This is why proteins are absolutely necessary for life. Proteins are needed for: maintenance, growth, reparation, pregnancy and lactation.
Protein food also is used to cover energy requirements but its main role is the formation of
amino acids, necessary for the complete synthesis of cells.
Protein foods Amino Acids Proteins in the Body
Digestion Synthesis of Proteins
2.1- Essential Amino Acids
Twenty Amino Acids are used by the organism. They can be classed into two categories:
- Amino Acids which can be synthesised by man or Non-essential Amino Acids.

MODULE 1 – THE BASICS OF NUTRITION
© ACF – Technical and Research Department – 2007 17
- Amino Acids which cannot be synthesised by man or Essential Amino Acids. There are 8
of these in total:
Phenylalanine, Tryptophan, Methionine, Lysine, Leucin, Isoleucine, Valine and
Threonine. There is a ninth essential amino acid for the infant in the first few months of life, this is
Histidine.
Essential Amino Acid intake is particularly important.
2.1.1- Balanced Intake - a limiting factor.
All the appropriate Amino Acids should be present in adequate proportions to satisfy the
needs for protein synthesis. If a single amino acid exist but in an insufficient quantity, it
becomes a limiting factor, meaning the synthesis is halted even with all the other amino acids
present until the least abundant exists in the correct quantities.
The most common limiting factors are:
* Lysine from cereals and their derivatives
* Methionine from legumes and foods of animal origin
Animal proteins contain adequate quantities of Essential Amino Acids.
2.1.2- Supplementation / Combination / Complementation
If a protein which is poor in a particular Amino Acid is combined with a protein rich in that
same Amino Acid, the biological value of the combination is improved: this practice is called
supplementation.
E.g. Rice + Meat
Fish + Maize
Peanuts and Millet Complement each other
Maize, Rice + Peanuts
Soya or Beans
2.2- Estimation of Protein requirements
- Requirements: level to safely cover 97.5% of the population to be covered.
- For children: (see tables 5 and 6)
- For adults: to securely cover protein requirements the level has been fixed at 0.75g/kg/24 hr
of high quality protein.
- For pregnant women: The supplement of protein corresponding to the safe level is 6g/day of
high quality proteins throughout the entire pregnancy.
- For Lactating Women: 16g of protein per day should be added during the first 6 months of
breastfeeding, and 12g/day during the second half of the first year.
The utilisation of protein depends on the energy supply
Proteins are used more efficiently, if a sufficient quantity of energy is supplied by the ration.
An inadequate energy supply could, like protein deficiency, be the cause of a negative
nitrogen balance.

MODULE 1 – THE BASICS OF NUTRITION
© ACF – Technical and Research Department – 2007 18
Conclusion
Energy supplied by proteins should represent 10 to 15 % of the total energy value of the
ration.
The organism does not make real stores of protein.
All Amino Acids which are not used by the body, either because of an excess, or because
they are not of the correct quality, are «burned», as a source of energy.
Table 5: Security level of proteins for infants and children aged 3 months to 10 years (both
sexes combined until 5 years)
Age 3 Median Weight
in kg
Safe Levels
g / kg g / day
3 - 5 months
6 - 8 months
9 - 11 months
12 - 23 months
24 - 35 months
36 - 59 months
5 - 6 years
7 - 9 years
7
8.5
9.5
11
13.5
16.5
20.5
27
1.85
1.65
1.50
1.20
1.15
1.10
1.00
1.00
13
14
14
13.5
15.5
17.5
21
27 Source WHO: Technical Report Series 724
Table 6: Safe Levels of proteins for Adolescents aged 10 - 18 years
Age Median
Weight
in kg
Median Height
in cm
Safe Level of Protein
g / kg g / day
Boys
10 -11 years
12 - 13 years
14 - 15 years
16 - 17 years
34.5
44
55.5
64
144
157
168
176
1.0
1.0
0.95
0.9
34
43
52
56
Girls
10 -11 years
12 - 13 years
14 - 15 years
16 - 17 years
36
46.5
52
54
145
157
161
163
1.0
0.95
0.9
0.8
36
44
46
42 Source WHO: Technical Report Series 724
3- LIPID REQUIREMENTS
Lipids are the constituents of fats, both animal and vegetable, which are mainly composed of
fatty acids. 3 Age in whole months or years

MODULE 1 – THE BASICS OF NUTRITION
© ACF – Technical and Research Department – 2007 19
Lipids play a role in the metabolic and structural balance of the body (cell membranes of
organs and tissues, the nervous system). They also constitute important energy stores, in the
form of adipose tissue.
A number of the fatty acids, which make up lipids, must be supplied by the diet, since they
cannot be synthesised by the human body. This being some of the poly-unsaturated fatty
acids (PUFA) which are essential; the two major ones being lineoleic and linolenic acid.
A deficiency in the dietary supply of essential fatty acids (EFA) (especially linoleic acid)
provokes metabolic disturbances. This affects both old and young, although the later in
particular.
Lipid intake is also important for the supply of lipid soluble vitamins (such as vitamins A and
E). Lipids should represent a minimum of 15% and a maximum 30% of total energy. EFA’s
should represent at least 3% of total energy supply.
4- CARBOHYDRATE REQUIREMENTS
Along with the lipids, carbohydrates supply most of the energy used and stored by the
organism.
Carbohydrates are the sugars:
- Complex: slow (starches): these are the cereals, roots and tubers
- Simple: rapid: these are the sugars and their derivatives, milk sugar (lactose) or fruit sugar
(fructose)
Sugar is essential for the production of energy in the brain (the brain only uses glucose, with
the sugar molecule).
5- WATER AND ELECTROLYTE REQUIREMENTS
70 - 80% of the body is water. Water is by far the most important constituent of the body
(present in all of the tissues). Water has various functions in the organism:
- Water is a vehicle and a solvent
- Water is a product of metabolic reactions
- Water is an element of temperature regulation
Water requirements vary according to: relative humidity, external temperature, physical
activity, weight (70% water) and age.
Water requirements are as follows:
Infants: - 0 - 3 months: 150 ml/kg/day
- 3 - 6 months: 125 ml/kg/day
- 6 - 12 months: 110 ml/kg/day
Water requirements for infants are supplied by maternal milk or milk substitutes.
Older children, adolescents and adults: 35 to 45 ml/kg/day based on life in a temperate
climate with moderate physical activity.
About half of this is supplied by drinks, the other half, by water contained in food and the
water produced by the organism during oxidation reactions. Water requirements increase in
people carrying out heavy muscular work (professional activity or sport) especially in warm
climates or environments, (summer or tropical areas).

MODULE 1 – THE BASICS OF NUTRITION
© ACF – Technical and Research Department – 2007 20
Water metabolism is closely linked to that of the electrolytes, especially sodium.
6- VITAMIN REQUIREMENTS
6.1- Definitions
Vitamins
Vitamins are organic substances, without energetic value as such, necessary for the function
of the body or for growth and are effective in very low doses. Hypovitaminosis (Vitamin
deficiency, clinical signs often appearing late) have the common characteristic of being cured
when the individual starts to consume the missing vitamin.
To cover requirements, this can be done over a period of time, not being necessary on a day
by day basis. The requirements are established for an ‘average person’ in a population,
variations, sometime significant, exist between individual people.
6.2- Vitamin A - Retinol
* Role:
- in vision
- essential for growth and for differentiation control of epithelial cells (conjunctiva,
cornea, bronchia, intestine)
- in bone growth, the synthesis of certain steroid hormones (progesterone),
- the immune system (resistance to infection).
* Main Natural Sources:
The main natural sources are animal in origin: liver, egg yolk, fish, whole milk, butter,
cheese.
The precursors of the vitamin, such as certain carotenoids, are present in many fruits and
vegetables. The most abundant carotenoid is beta-carotene (Provitamin A), it is present in
carrots, green vegetables, pumpkin, broccoli, melon, eggs and butter. Food is the unique
source of vitamin A.
* Units:
Vitamin A activity is expressed in ‘Retinol Equivalents’, or RE.
1 RE = 1 µg of Retinol = 3.31 IU = 6 µg of beta carotene = 12 µg of other carotenoids.
* Stability:
Vitamin A will be oxidised on contact with air or light, it is destroyed when present in fats if
they themselves are oxidised. It is stable when heated, although there are losses during
prolonged boiling. Combination of antioxidants (such as Vitamin E) protects vitamin A.
* Main interactions:
Oral Contraceptives can slightly decrease the hepatic reserves of Vitamin A. Infectious
diseases and parasitic infestations decrease Vitamin A reserves and conversely an insufficient
intake of Vitamin A decreases the resistance to disease. An acute protein deficiency disturbs
Vitamin A metabolism, a diet low in fat decreases the absorption of Vitamin A and
carotenoids. Vitamin A deficiency can cause anaemia. Vitamin E protects Vitamin A.

MODULE 1 – THE BASICS OF NUTRITION
© ACF – Technical and Research Department – 2007 21
* Recommended Nutrient Intakes:
Estimated mean requirement and safe level of intake for vitamin A
Mean requirement Recommended safe intake
Age group µg RE/day µg RE/day
Infants and children
0–6 months 180 375
7–12 months 190 400
1–3 years 200 400
4–6 years 200 450
7–years 250 500
Adolescents, 10–18 years 330–400 600
Adults
Females, 19–65 years 270 500
Males, 19–65 years 300 600
65+ 300 600
Pregnant women 370 800
Lactating women 450 850
Source: Adapted from FAO/WHO, Rome 1988 (69).
* Deficiency:
It is the main cause of blindness. The symptoms are a decrease in visual acuity in the half
light (dusk) and appearance of cutaneous lesions. Vitamin A deficiency is often associated
with other factors such as malnutrition or infections, the deficiency can be the cause of high
mortality rates.
Xerophthalmia 4Prevention programmes in the third world focus mainly on children between
the age of 6 months and 7 years. It is mostly children 6 months to year who have vitamin A
deficiencies. Vitamin A is stored in the liver and it is possible to constitute a reserve by
giving high doses orally 2 to 3 times a year:
100,000 IU for children aged 6 months to one year old
200,000 IU for children over a year
200,000 IU for mothers after the birth
Pregnant women are advised not to take more than 10,000 IU per day
Deficiencies can be the cause of excessive infant and child mortality, even if there are no
apparent symptoms of a deficiency. This has been shown in hospitals, where mortality due to
measles could be reduced by giving Vitamin A supplements. This might also apply to other
diseases like diarrhoea.
Vitamin A capsules also contain Vitamin E.
* Overdose:
Accidental overdose of Vitamin A have been observed for doses 20 to 50 times higher than
recommended intakes. There are risks of congenital malformation due to overdose during
pregnancy. It is for this reason that the use of capsules of 200,000 IU of Vitamin A is not
advised during pregnancy.
4 Xerophthalmia means dry eye. It as a condition that affects the cornea and the conjunctiva, by diminishing the
lacrymal secretions which usually cover the conjunctiva and the cornea.

MODULE 1 – THE BASICS OF NUTRITION
© ACF – Technical and Research Department – 2007 22
BETA CAROTENE or Provitamin A
* Main Natural Sources:
Vegetables and coloured fruits (Yellow, red and green) contain a lot of beta carotene, but the
amount depends on the season and their maturity.
* Units / Conversion Factors
1 Retinol Equivalent = 1 µg of Retinol (Vitamin A) = 6 µg of beta carotene = 3.31 IU of Vitamin A
= 12 µg of other carotenoids
* Recommended Nutrient Intakes:
The recommended food intakes of beta carotene are just until present incorporated into those
of Vitamin A.
* Risk groups for low levels
Smokers, Drinkers, women who take oral contraceptives and people on low incomes,
consuming little fresh produce.
* Stability
Dehydration of the fruits and vegetables can greatly reduce the vitamin levels, as well as
preservation by freezing.

MODULE 1 – THE BASICS OF NUTRITION
© ACF – Technical and Research Department – 2007 23
6.3- B- Complex Vitamins
The B-complex vitamins play a role in the composition of enzymic systems necessary for life.
Physiologic roles and deficiency signs of B-complex vitamins are presented in the following
table:
Vitamin Physiologic roles Deficiency Thiamin (B1) Co-enzyme functions in Beri-beri,
metabolism of carbohydrates polyneuritis, and
and branched-chain amino Wernicke-Korsakoff
acids syndrome
Riboflavin (B2) Co-enzyme functions in Growth, cheilosis, angular
Numerous oxidation and stomatitis, and dermatitis
reduction reactions
Niacin Co-substrate/co-enzyme for Pellagra with diarrhoea,
(nicotinic acid and hydrogen transfer with numerous dermatitis, and dementia
nicotinamide) dehydrogenases
Vitamin B6 Co-enzyme functions in Naso-lateral seborrhoea,
(pyridoxine, metabolism of amino acids, glossitis, and peripheral
pyridoxamine, and glycogen, and sphingoid bases neuropathy (epileptiform
pyridoxal) convulsions in infants)
Pantothenic acid Constituent of co-enzyme A and Fatigue, sleep
phosphopantetheine involved in disturbances,
fatty acid metabolism impaired coordination,
and, nausea
Biotin Co-enzyme functions in Fatigue, depression,
bicarbonate-dependent nausea, dermatitis,
carboxylations and muscular pains
Source: Report of a joint FAO/WHO expert consultation on human vitamin and mineral requirements
6.3.1- Vitamin B1 - Thiamin - anti beriberi factor - anti neuritis factor - aneurine
* Role
Essential in carbohydrate metabolism. Also plays a role in the transmission of nerve impulses
and in the respiratory chain.
* Main Natural Sources
Pork, dried vegetables, milk and eggs are relatively rich in this vitamin. The thiamin in cereals
is mainly contained in the outer husk of the grain.
* Stability
Thiamin is sensitive to heat, alkaline environments, oxygen and light. Normal cooking
destroys around 25% of the thiamin content of foods. For thiamin, it is recommended to keep
the cooking time to a minimum, in a covered pan with the least quantity of water. The use of

MODULE 1 – THE BASICS OF NUTRITION
© ACF – Technical and Research Department – 2007 24
the juice and the cooking water in stocks and sauces allows a part of the vitamin to be
recovered.
* Main Interactions
A certain number of foods can act as B1 antivitamins: coffee, tea, raw fish and certain cereals.
* Recommended Nutrient Intakes
Recommended nutrient intakes for thiamin
Recommended nutrient intake
Group mg/day
Infants and children
0–6 months 0.2
7–12 months 0.3
1–3 years 0.5
4–6 years 0.6
7–9 years 0.9
Adolescents, 10–18 years
Females 1.1
Males 1.2
Adults
Females, 19+ years 1.1
Males, 19+ years 1.2
Pregnancy 1.4
Lactation 1.5
Source: Report of a joint FAO/WHO expert consultation on human vitamin and mineral requirements
* Deficiency:
- Minor deficiency: A marginal deficiency can intervene under diverse circumstances:
pregnancy / lactation, high consumption of carbohydrates, intense physical activity, certain
illnesses ( dysentery, diarrhoea), regular consumption of alcohol....
A supplementary intake of thiamin is therefore necessary.
- Total deficiency: Two Illnesses due to B1 deficiency are known:
� Beriberi:
Manifested by neurological and cardio vascular problems, three forms exist:
- dry form: characterised by polyneuritis with severe muscle wasting
- wet form: with oedema, anorexia, muscle weakness, mental confusion, and the final stage
cardiac insufficiency.
- infantile form: whose symptoms (vomiting, convulsions, abdominal distension, anorexia)
appear very suddenly and cause death from cardiac arrest.
� Gayet - Wernicke - Korsakoff Syndrome:
It is more common. It can be found in people who regularly fast or vomit. The symptoms
range from confusion and mild depression to psychosis and coma.
* Overdose
Thiamin is used to compensate for the deficiency signs of Vitamin B1. Vitamin B1 is well
tolerated in health people, even in high doses. The oral security margin / range is large: up to
100 times the recommended daily intake.

MODULE 1 – THE BASICS OF NUTRITION
© ACF – Technical and Research Department – 2007 25
6.3.2- Vitamin B2 - Riboflavin
* Role
Occurs in the many metabolic reactions of carbohydrates, lipids and protein as well as in the
production of energy in the respiratory chain (Krebs cycle).
* Main Natural Sources
The richest sources are yeast and liver. The most common dietary sources however are milk
and milk products, meat eggs, dark green leafy vegetables and a small quantity in cereals.
Riboflavin of animal origin is absorbed better.
* Stability
Riboflavin is resistant to heat, but is sensitive to light. It can be lost in the cooking water of
foods.
* Main Interactions
Oral contraceptives have a negative influence on the absorption, the transport and the
metabolism of riboflavin.
* Recommended Nutrient Intakes
Recommended nutrient intakes for riboflacin
Recommended nutrient intake
Group mg/day
Infants and children
0–6 months 0.3
7–12 months 0.4
1–3 years 0.5
4–6 years 0.6
7–9 years 0.9
Adolescents, 10–18 years
Females 1.0
Males 1.3
Adults
Females, 19+ years 1.1
Males, 19+ years 1.3
Pregnancy 1.4
Lactation 1.6
Source: Report of a joint FAO/WHO expert consultation on human vitamin and mineral requirements
* Deficiency
Minor deficiency: Generally associated with the deficiency of various B group vitamins. It
can cause growth retard in children.
Total Deficiency: The symptoms are crimson red tongue with taste bud atrophy, shiny dry
lips, abnormally red, sometimes chapped and scabby, fissures in the corners of the mouth,
itching sebhorrea dermatitis with eruption and hyperpigmentation especially around the scrotum. Riboflavin deficiency is also accompanied by ocular symptoms, hypervascularisation of the
conjunctiva, itching, photophobia, and watery eyes.

MODULE 1 – THE BASICS OF NUTRITION
© ACF – Technical and Research Department – 2007 26
* Overdose
No secondary effects have been observed after excessive ingestion of riboflavin.
6.3.3- Niacin B3 - Vitamin B3 - Vitamin PP
* Role
Necessary for growth and is present / involved in the synthesis of hormones
* Main Natural Sources
Yeast, Liver, nuts, and pulses. Also poultry, lean meat and offal, fish are the largest dietary
sources of Niacin.
Tryptophan is an Amino Acid precursor of niacin. Tryptophan is found in meat, milk and
eggs.
1 Niacin Equivalent (NE) = 1 mg Niacin = 60 mg Tryptophan
* Main Interactions
The transformation of Tryptophan to Niacin can be affected by a deficiency of copper or
Vitamin B6 (Pyridoxine).
* Recommended Nutrient Intakes
Recommended nutrient intakes for niacin
Recommended nutrient intake
Group NEs/day5
Infants and children
0–6 months 26
7–12 months 4
1–3 years 6
4–6 years 8
7–9 years 12
Adolescents, 10–18 years 16
Adults
Females, 19+ years 14
Males, 19+ years 16
Pregnancy 18
Lactation 17
Source: Report of a joint FAO/WHO expert consultation on human vitamin and mineral requirements
* Deficiency
The signs of deficiency are non specific. Total deficiency leads to pellagra whose symptoms
are dermatitis, dementia, diarrhoea, and nervous problems.
It causes skin lesions especially around the wrists, elbows and neck. A characteristic glossitis
and stomatitis can be present. Nausea and Vomiting can lead to a precocious stage.
Deficiency can also lead to paralysis of the extremities in particular the legs. 5 NEs, niacin equivalents. 6 Preformed

MODULE 1 – THE BASICS OF NUTRITION
© ACF – Technical and Research Department – 2007 27
People at risk of niacin deficiency are those with an increased Niacin requirement, during
pregnancy, lactation, cancer patients, users of oral contraceptives, and in patients deficient in
protein.
* Security Margin
Doses of 30 mg to over 100 mg are considered harmless. Prolonged use of very high doses
should be under medical surveillance.
6.3.4- Pantothenic Acid - Vitamin B5
* Role
Essential for the preservation and repair of cells and tissues.
* Main Natural Sources
Yeast, offal (liver, kidney, heart, brain), meat, eggs, fish, milk, vegetables and wholegrain
cereals.
* Stability
Pantothenic Acid is destroyed by heat in alkaline or acidic solutions.
* Main Interactions
Various studies have shown that Vitamin B12 appears to facilitate the conversion of
Pantothenic Acid to Coenzyme A (vitamin A is one of the components of coenzyme A, which
is necessary for the combustion of fatty acids and carbohydrates in the cell and for the
transformation of carbohydrates into fatty acids). Other experiments have shown that
Ascorbic Acid decreases the severity of symptoms due to Pantothenic Acid deficiency.
* Recommended Nutrient Intakes
Recommended nutrient intakes for pantothenic acid
Recommended nutrient intake
Group mg/day
Infants and children
0–6 months 1.7
7–12 months 1.8
1–3 years 2
4–6 years 3
7–9 years 4
Adolescents, 10–18 years 5
Adults
Females, 19+ years 5
Males, 19+ years 5
Pregnancy 6
Lactation 7
Source: Report of a joint FAO/WHO expert consultation on human vitamin and mineral requirements
* Deficiency
Pantothenic acid, being widespread in foods, makes deficiency exceptional and never total. It
is therefore difficult to formulate a specific clinical table.
MODULE 1 – THE BASICS OF NUTRITION
© ACF – Technical and Research Department – 2007 28
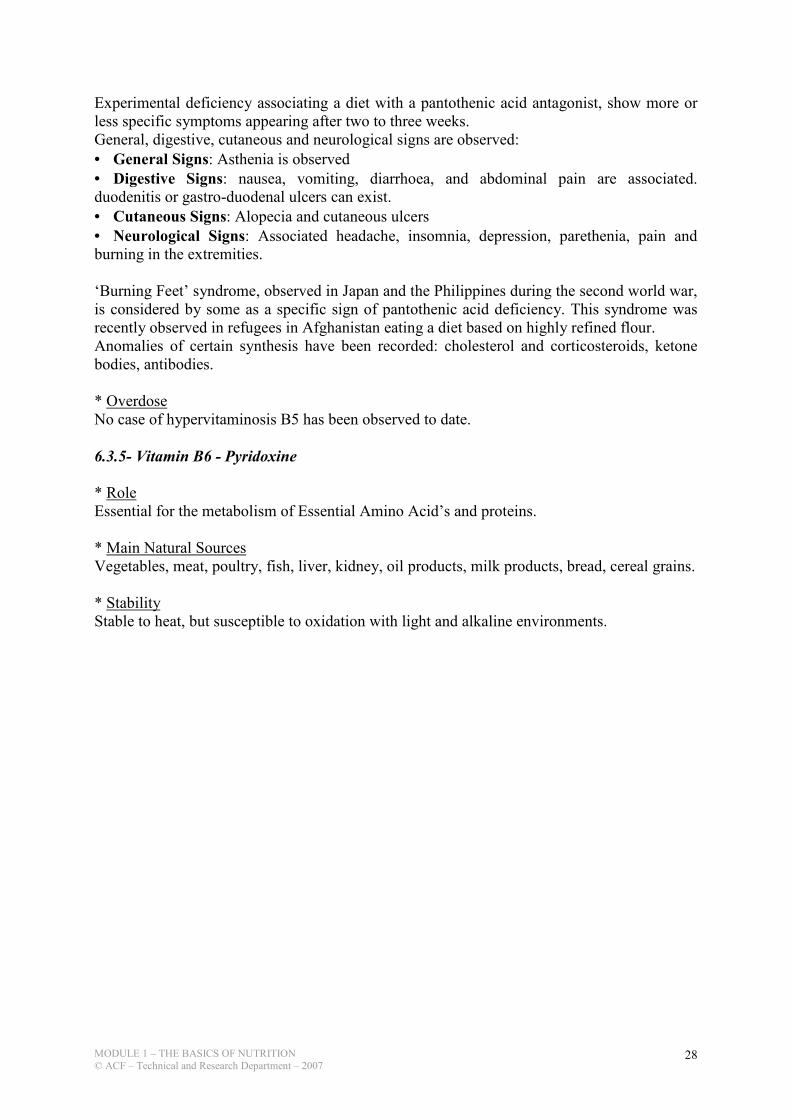
Experimental deficiency associating a diet with a pantothenic acid antagonist, show more or
less specific symptoms appearing after two to three weeks.
General, digestive, cutaneous and neurological signs are observed:
• General Signs: Asthenia is observed • Digestive Signs: nausea, vomiting, diarrhoea, and abdominal pain are associated. duodenitis or gastro-duodenal ulcers can exist.
• Cutaneous Signs: Alopecia and cutaneous ulcers • Neurological Signs: Associated headache, insomnia, depression, parethenia, pain and burning in the extremities.
‘Burning Feet’ syndrome, observed in Japan and the Philippines during the second world war,
is considered by some as a specific sign of pantothenic acid deficiency. This syndrome was
recently observed in refugees in Afghanistan eating a diet based on highly refined flour.
Anomalies of certain synthesis have been recorded: cholesterol and corticosteroids, ketone
bodies, antibodies.
* Overdose
No case of hypervitaminosis B5 has been observed to date.
6.3.5- Vitamin B6 - Pyridoxine
* Role
Essential for the metabolism of Essential Amino Acid’s and proteins.
* Main Natural Sources
Vegetables, meat, poultry, fish, liver, kidney, oil products, milk products, bread, cereal grains.
* Stability
Stable to heat, but susceptible to oxidation with light and alkaline environments.

MODULE 1 – THE BASICS OF NUTRITION
© ACF – Technical and Research Department – 2007 29
* Recommended Nutrient Intakes
Recommended nutrient intakes for vitamin B6
Recommended nutrient intake
Group mg/day
Infants and children
0–6 months 0.1
7–12 months 0.3
1–3 years 0.5
4–6 years 0.6
7–9 years 1.0
Adolescents, 10–18 years
Females 1.2
Males 1.3
Adults
Females, 19-50 years 1.3
Males, 19-50 years 1.3
Females > 50 years 1.5
Male > 50 years 1.7
Pregnancy 1.9
Lactation 2.0
Source: Report of a joint FAO/WHO expert consultation on human vitamin and mineral requirements
* Deficiency
Minor deficiency: It is rare that dietary intakes of Vitamin B6 provoke well defined signs of
deficiency.
Total Deficiency: A diet too low in Vitamin B6 can provoke hypochromic anaemia and a
decrease in the capacity of the organism to transform Tryptophan to nicotinic acid. People
susceptible to hypoviatminosis B6 are pregnant and lactating women, women taking high
oestrogen dose oral contraceptives, and people whose diet is rich in proteins are also at risk of
hypovitaminosis B6.
* Therapeutic Indications:
Pyridoxine deficiency of genetic origin cause certain forms of anaemia as well as anomalies
in Amino Acid metabolism. The therapeutic dose is between 40 and 200 mg / day.
A preventive treatment can be prescribed to pregnant and lactating women and those taking
oral contraceptives.
* Overdose
Doses over 50 - 100 times the recommended intakes can be prescribed but not more.
6.3.6- Biotin - Vitamin H - Vitamin B8
* Role
Essential to normal growth and function of the body. Plays a key role in the metabolism of
carbohydrates, lipids and proteins.
* Main Natural Sources
Yeast, liver, kidney, egg yolk, soya, different types of nuts and cereals.

MODULE 1 – THE BASICS OF NUTRITION
© ACF – Technical and Research Department – 2007 30
* Stability
Biotin is relatively stable.
* Main Interactions
Consumption of large quantities of raw egg white over long periods of time can provoke a
deficiency of Biotin.
* Recommended Nutrient Intakes
Recommended nutrient intakes for biotin
Recommended nutrient intake
Group µg/day
Infants and children
0–6 months 5
7–12 months 6
1–3 years 8
4–6 years 12
7–9 years 20
Adolescents, 10–18 years 25
Adults
Females, 19+ years 30
Males, 19+ years 30
Pregnancy 30
Lactation 35
Source: Report of a joint FAO/WHO expert consultation on human vitamin and mineral
requirements
* Deficiency
To demonstrate the symptoms volunteers consumed a diet deficient in biotin and rich in raw
egg white, after 3 to 4 weeks, they acquired lightly coloured flaky skin, although not itchy.
After 10 weeks, they were tired, depressed, sleepy, nauseous and lacking appetite. They
suffered muscular pain and troubles of sensibility, without modification of reflexes and
without other neuropathological signs. Their tongues were pale, with disappearance of taste
buds. Their skin was rich and squameuse, the appearance of anaemia and
hypercholesterolaemia was noted.
* Therapeutic Indications
Treatment of Biotin deficiency uses doses of 5 to 20 mg / day.
* Security Margins
No risk of toxicity in high doses.
6.4- Folic acid - Vitamin B9
* Role
Necessary for growth and the function of the nervous system and bone marrow.
* Main Natural Sources

MODULE 1 – THE BASICS OF NUTRITION
© ACF – Technical and Research Department – 2007 31
Liver, dark green leafy vegetables, beans, wheat grain and yeast. It is also found in other
vegetables, egg yolk, cheese, orange juice and wholemeal bread.
* Stability
Folic acid is unstable to cooking and to storage at ambient / room temperatures.
* Main Interactions
Oral contraceptives decrease the absorption of folic acid.
* Recommended Nutrient Intakes
Estimated average requirement (EAR) and recommended nutrient intake (RNI) for folic
acid expressed as dietary folate equivalents, by age group
Group EAR (µg/day) RNI (µg/day)
Infants and children
0–6 months 65 80
7–12 months 65 80
1–3 years 120 160
4–6 years 160 200
7–9 years 250 300
Adolescents, 10–18 years 300 400
Adults
19-65 years 320 400
+65 years 320 400
Pregnancy 520 600
Lactation 450 600
Source: Report of a joint FAO/WHO expert consultation on human vitamin and mineral
requirements
* Deficiency
Hypovitaminosis of folic acid is the most common vitamin deficiency. The first symptoms of
tiredness, irritability and loss of appetite are not specific.
Loss of appetite, abdominal pain, nausea and diarrhoea can be observed in acute deficiency.
Painful ulcers can develop in the mouth and pharynx. Cutaneous discoloration and hair loss
are equally possible. In pregnant women, the deficiency can cause premature birth or
malformation of the new born (spina-bifida).In childhood, the deficiency is characterised by a
late puberty and a retarded growth.
Deficiency of folate intake is still common in developing countries, combined in particular
with iron deficiency. Deficiency of folate absorption is observed in all illnesses involving
reduction of the surface or ability of absorption such as short intestinal resection, coeliac
disease, Chron’s disease. These pathologies also often provoke the combined malabsorption
of Vitamin B12 and iron.
* Therapeutic Indications
A multivitamin preparation can be used containing around 400 - 500 µg of folic acid, if there is a serious risk of deficiency.
Supplements can be given to pregnant women.

MODULE 1 – THE BASICS OF NUTRITION
© ACF – Technical and Research Department – 2007 32
* Overdose
No risk of toxicity at high doses.
6.5- Vitamin B12 - Part of Cobalamine family
* Role
Necessary for the formation of red blood cells, cells of the nerve ducts and various proteins.
Also participates in the metabolism of lipids and carbohydrates. This vitamin is essential for
growth.
* Main Natural Sources
Offal (Liver, kidney, heart, brain), meat, poultry, fish, eggs and milk products. Foods of
vegetable origin are a poor source of vitamin B12.
* Stability
Vitamin B12 is sensitive to light, oxygen, reducing agents, acidic or alkaline mediums, but is
stable to heat. Loss of activity during cooking is due to the passage of Vitamin B12 into the
meat juices or into the cooking water.
* Recommended Nutrient Intakes
Estimated average requirement (EAR) and recommended nutrient intake (RNI) for
vitamin B12, by age group
Group EAR RNI
(µg/day) (µg/day)
Infants and children
0–6 months 0.32 0.4
7–12 months 0.32 0.4
1–3 years 0.7 0.9
4–6 years 1.0 1.2
7–9 years 1.5 1.8
Adolescents, 10–18 years 2.0 2.4
Adults
19-65 years 2.0 2.4
+65 years 2.0 2.4
Pregnancy 2.2 2.6
Lactation 2.4 2.8
Source: Report of a joint FAO/WHO expert consultation on human vitamin and mineral
requirements
* Deficiency
The symptoms are very similar to those observed in folic acid deficiency. This deficiency is
essentially due to problems of absorption. It is rarely dietary in origin. On the other hand,
Vitamin B12 deficiency is a common problem for vegetarians.
* Overdose
No risk of toxicity seen in doses up to 30,000 times the recommended daily intake.

MODULE 1 – THE BASICS OF NUTRITION
© ACF – Technical and Research Department – 2007 33
6.6- Vitamin C - Ascorbic Acid
* Role
Necessary for the production of collagen (connective tissue protein). Repair of structures rich
in connective tissue (bone, cartilage, ligaments, capillary vessels....). Contributes to the health
of the gums and teeth. Aids the absorption of iron.
* Main Natural Sources
Citrus fruits, potatoes, cauliflower, broccoli, brussels sprouts, parsley, sweet peppers,
blackcurrants, certain exotic fruits.
* Stability
Sensitive to heat, light and oxygen. Prolonged storage and overcooking almost completely
destroy vitamin C.
* Recommended Nutrient Intakes
Recommended nutrient intakes (RNIs) for vitamin C
Group RNI
mg/day
Infants and children
0–6 months 25
7–12 months 30
1–3 years 30
4–6 years 30
7–9 years 35
Adolescents, 10–18 years 40
Adults
19-65 years 45
+65 years 45
Pregnancy 55
Lactation 70
Source: Report of a joint FAO/WHO expert consultation on human vitamin and mineral
requirements
* Deficiency
Deficiency symptoms are tiredness, lassitude, loss of appetite, somnolence, insomnia,
irritability, low resistance to infections and the appearance of haemorrhages at capillary level.
The total deficiency causes scurvy. The first signs of which, in general are bleeding gums and
loss of teeth. Sub cutaneous haemorrhages cause hypersensitive extremities and painful
movements. If scurvy is not treated in time with a sufficient Vitamin C intake, it will result in
gangrene and can cause death. NB. Scurvy is painful which is not the case with rickets.
* Therapeutic Indications
Main Indication is to prevent real deficiency; that is scurvy, as well as insufficient intakes
(tabagasme: pregnant or lactating women). In fact, 10 - 15 mg / day of Vitamin C is sufficient
to prevent scurvy.
It should be noted that a tomato ( on the condition that it is fresh) represents enough Vitamin
C for one week. Cases of scurvy are regularly reported in African camps where there is no
access to fresh produce.

MODULE 1 – THE BASICS OF NUTRITION
© ACF – Technical and Research Department – 2007 34
* Overdose
There is no risk for high doses.
6.7- Vitamin D - Calciferol
* Role
Important for the function of the muscles and nerves, coagulation of the blood, cellular
growth and the use of energy.
* Main Natural Sources
Fish oils and oily fish (sardines, herring, salmon, mackerel), eggs, meat, milk and butter.
* Units
Vitamin D activity is expressed in IU or in micrograms.
1 IU = 0.025 µg of cholecalciferol
* Stability
It is relatively stable in foods. Only exposure to light can cause greater losses.
* Recommended Nutrient Intakes
RNIs for vitamin D according to age groups
Group RNI
µg/day
Infants and children
0–6 months 5
7–12 months 5
1–3 years 5
4–6 years 5
7–9 years 5
Adolescents, 10–18 years 5
Adults
19-50 years 5
Older adults 51-65 years 10
Elderly adults + 65 years 15
Pregnancy 5
Lactation 5
Source: Report of a joint FAO/WHO expert consultation on human vitamin and mineral
requirements
* Deficiency
It can be seen in the form of muscle weakness, tetanus and an increase in the risk of infection.
Manifestations of Vitamin D deficiency are rickets in children and osteomalacia in adults,
particularly in menopausal women. The risk of deficiency can be due to fat malabsorption or a
very low exposure to sunlight.

MODULE 1 – THE BASICS OF NUTRITION
© ACF – Technical and Research Department – 2007 35
* Therapeutic Indications
Doses can be very high at the start of the treatment (75 - 100 µg / day that it 3000 - 4000 IU), the doses are then reduced to 1 or 2 times the recommended nutrient intake for long term
maintenance.
* Overdose
For Adults, the toxic dose is around 2.5 mg (100 000 IU) / day during 1 or 2 months.
For Children, it can be between 0.5 mg (20 000 IU) and 1.0 mg (40 000 IU).
Certain people who are very sensitive to Vitamin D can show signs of toxicity at much lower
doses.
Prophylactic doses of 1000 IU / day in the infant and of 5000 to 10 000 IU in the adult are
considered to be harmless.
Hypervitaminosis has no relation, with excessive exposure to the sun.
6.8- Vitamin E - Tocopherol
* Main Natural Sources
Wheat grain, green vegetables, salad, cabbage, spinach, oil seeds.
* Recommended Nutrient Intakes
Vitamin E requirements for infants are 5IU.
At present, data are not sufficient to formulate recommendations for vitamin E intake for
different age groups except for infancy.
No specific recommendations concerning the vitamin E requirements in pregnancy and
lactation have been made mainly because there is no evidence of vitamin E requirements
different from those of other adults and presumably also as the increased energy intake would
compensate for the increased needs for infant growth and milk synthesis.
* Units
1 IU corresponds to 1 mg of t/x tocopherol acetate
* Deficiency
Vitamin E deficiency can be observed in the new-born, especially premature infants,
presenting in the form of haemolytic anaemia. Deficiency is more frequent, since the vitamin
E reserves are practically non existent at this stage of life.
* Therapeutic Indications and Dosage
Vitamin E is prescribed in cases of insufficient spermatogenesis. Lower doses (100 to 200 mg
/ day) are proposed for the treatment of sterility, dysmenhorrea and functional menopausal
problems. Vitamin E has remarkable antioxidant properties.
* Overdose
The security margins for high doses are excellent.
6.9- Vitamin K
* Role
Essential for the coagulation of blood (avoids internal or external haemorrhage)

MODULE 1 – THE BASICS OF NUTRITION
© ACF – Technical and Research Department – 2007 36
* Main Natural Sources
Spinach, cabbage, cauliflower, broccoli, green salad, Soya grains, beef liver, green tea, egg
yolk and cheeses.
* Recommended Nutrient Intakes
Recommended nutrients intakes for vitamin K
Group Recommended Nutrient Intake
µg/day
Infants and children
0–6 months 5*
7–12 months 10
1–3 years 15
4–6 years 20
7–9 years 25
Adolescents, 10–18 years
Females 35-55
Males 35-55
Adults
Females 19-65 years 55
+ 65 years 55
Males 19-65 years 65
+ 65 years 65
Pregnancy 55
Lactation 55 *This intake cannot be met by infants who are exclusively breast-fed.
Source: Report of a joint FAO/WHO expert consultation on human vitamin and mineral requirements
* Deficiency
Vitamin K deficiency provokes haemorrhages. Dietary deficiencies of Vitamin K are rare.
This deficiency can appear in low birth weight new-born or in premature infants not
supplemented with Vitamin K at birth.
People at risk of this deficiency are therefore those where an injection of Vitamin K is not
obligatory at birth. This deficiency does not exist in Europe since the vitamin K injection is
given at birth.
* Stability
It is stable to heat and to reducing agents. Is sensitive to light, acids, bases and to oxidising
agents.
N.B.: All the information on the different vitamins were collated from “Human Vitamin and
Mineral Requirements” / Report of a joint FAO/WHO expert consultation Bangkok, Thailand
/ WORLD HEALTH ORGANIZATION FOOD SND AGRICULTURE ORGANIZATION
OF THE UNITED NATIONS Rome, 2002

MODULE 1 – THE BASICS OF NUTRITION
© ACF – Technical and Research Department – 2007 37
7- MINERALS AND TRACE ELEMENTS
7.1 Calcium
Role: Principally, in the mineralisation of bone, but also in the coagulation of blood and
muscle contractions.
Food Sources: (Source: Food and Human Nutrition. H.Dupin; JL. Cuq; MI. Malewiak;C.
Leynaud-Rouaud; A-M. Berthier.)
All milk products, dried fruits, fish, white bread. Meats are a poor source for calcium.
Calcium Deficiency: (Source: Treating Child Nutrition. C.Ricour; J. Ghisolfi; G.Putet; O.
Goulet.)
Severe calcium deficiency (less than 300gmg per day) induces a long series of difficulties in
the metabolism of phosphocalcium. This has been studied by Pettifor in South Africa. Once
calcium deficiency is present it induces secondary ‘hyperparathyroid’ and therefore
‘hyperphosphaturie’ and ‘hyperphosphatemie’.
This association encourages rickets and osteomalacia (reduced mineralisation of the bone).
The children have serious deformation of the lower limbs but neither muscular fatigue nor
pain in the bone exist at this time.
The simple solution is a diet of 1000mg of calcium per day and 800mg of phosphorus. This is
sufficient to correct the biological, radiological and clinical alterations. The effects of this
deficiency are significantly aggravated by diets containing high levels of protides or sodium.
Recommended Nutrients Intakes:
Recommended, calcium allowances based on Western European American and
Canadian data
Group Recommended Intake
mg/day
Infants and children
0–6 months
Human milk 300
Cow milk 400
7–12 months 400
1–3 years 500
4–6 years 600
7–9 years 700
Adolescents, 10–18 years 1300
Adults
Females
19 years to menopause 1000
Postmenopause 1300
Males 19-65 years 1000
+ 65 years 1300
Pregnancy (last trimester) 1200
Lactation 1000 Source: Report of a joint FAO/WHO expert consultation on human vitamin and mineral requirements

MODULE 1 – THE BASICS OF NUTRITION
© ACF – Technical and Research Department – 2007 38
7.2- Zinc
Role: Very important to the immunity, necessary for weight growth and development during
puberty; plays a role in pro-insulin storage; occurs in many enzyme reactions.
Food Sources: (Source: Treating Child Nutrition. C.Ricour; J. Ghisolfi; G.Putet; O. Goulet.)
Zinc is everywhere in human food where there is a connection with proteins.
Recommended Nutrients Intakes (European):
Recommended zinc intake
Group Recommended intake
mg/day
Infants and children
6–11 months 4
1–3 years 4
4–6 years 4
7–10 years 7
Adolescents,
Females 11-14 years 9
Females 15-17 years 7
Males 11-17 years 9
Adults 7
Pregnancy 7
Lactation 12
Deficiency: (Source: Treating Child Nutrition. C.Ricour; J. Ghisolfi; G.Putet; O. Goulet.)
The clinical table is remarkably constant, dominated by growth retardation, reversible by the
administration of zinc. Deficiency in zinc is normally associated with:
-Profound anorexia,
-Growth retardation,
-Skin and ‘occulaores’ lesions,
-Prolonged diarrhoea
-Increased susceptibility to infection: serious disruption to the immune system, particular that
section dependant on lymphocytes T.
7.3- Copper
Role : essential in enzymatic systems
Natural Sources: (Source: Treating Child Nutrition. C.Ricour; J. Ghisolfi; G.Putet; O.
Goulet.)
Oysters, walnut, cocoa, liver and kidney offal, margarine and maize oil, also dried fruits are
rich in copper.

MODULE 1 – THE BASICS OF NUTRITION
© ACF – Technical and Research Department – 2007 39
Recommended Nutrients Intakes:
Recommended copper intake
Group Recommended intake
mg/day
Infants and children
6–11 months 0.3
1–3 years 0.4
4–6 years 0.6
7–10 years 0.7
11-14 years 0.8
15-17 years 1.0
Adults 1.1
Pregnancy 1.1
Lactation 1.4
The needs of copper are largely covered by the diet. The only exception is for those children
being fed exclusively with powdered or artificial milk not fortified with copper. They can
become anaemic
7.4- Magnesium (Source: «Food and Human Nutrition» DUPIN/CUQ)
Role: There are numerous biological roles, such as assisting with the synthesis of nucleic acid,
absorption of lipids, presence in glucose. The adult human body contains about 25g of
magnesium. Within a normal diet, 30% to 40% of the magnesium present in the food is
actually absorbed. Vitamin D assists in this absorption.
It is advised to take no less than 350mg per adult. Intakes are often less than this figure,
especially for women.
Natural Sources: Foods rich in Magnesium include cocoa, dried fruits, non refined cereals.
Bread is a poor source of magnesium.

MODULE 1 – THE BASICS OF NUTRITION
© ACF – Technical and Research Department – 2007 40
Recommended Nutrients Intakes:
Recommended nutrient intakes for magnesium (Mg) in milligrams (mg)
Age group Assumed body weight RNI
Kg mg/day
Infants and children
0–6 months
Human-milk fed 6 26
Formula fed 6 36
7–12 months 9 54
1–3 years 12 60
4–6 years 19 76
7–9 years 25 100
Adolescents, 10–18 years
Females 49 220
Males 51 230
Adults 19-65 years
Females 55 220
Males 65 260
+ 65 years
Females 54 190
Males 64 224 Source: Report of a joint FAO/WHO expert consultation on human vitamin and mineral requirements
Deficiency: A deficiency in magnesium is sometimes observed in people suffering from
prolonged or severe diarrhoea. Malformations may occur in certain people being treated
diuretically over a long period of time.
7.5- Iodine
Role: used for the synthesis of the thyroid hormones, vital for growth and cell differentiation.
Natural Sources: Source: («Food and Human Nutrition» DUPIN/CUQ)
Above all this is seafood, which is naturally rich in Iodine.

MODULE 1 – THE BASICS OF NUTRITION
© ACF – Technical and Research Department – 2007 41
Recommended Nutrients Intakes:
Proposed revision for daily iodine intake recommendations of 1996 by the World Health
Organization, United Nations Children’s Fund, and
International Council for the Control of Iodine Deficiency Disorders
Total iodine intake Iodine
Population sub-groups µg/day µg/kg/day
Infants ( first 12 months) 90* 15.0
Children (1–6 years) 90 6.0
Schoolchildren ( 7–12 years) 120 4.0
Adults (12+ years) 150 2.0
Pregnant and lactating women 200 3.5 * Revised to 90 µg from the earlier recommendation of 50 µg.
Source: Report of a joint FAO/WHO expert consultation on human vitamin and mineral requirements
Iodine Deficiency: (Source: Treating Child Nutrition. C.Ricour; J. Ghisolfi; G.Putet; O.
Goulet.)
When the physiological needs of iodine are not covered in the majority of the population,
there develops a series of anomalies understood to change the function of the thyroid gland. In
severe cases of deficiency, endemic goitre and cretinism appears, as does the reduction in
birth rates and an increase in the infant and peri-natal mortality.
Prevention of this problem can be easily realised by iodine fortification of food products such
as table salt.
There remain large geographical regions in the world where iodine requirements are not
covered and are effected by the subsequent deficiencies. This is more likely to affect
mountainous areas of the world, such as the Himalayas and the Andes. Nevertheless, it is
equally possible to see cases of goitre from this deficiency within areas situated at sea level,
as for example, central Africa.
Problems relating to iodine deficiency:
- Foetus: Abortion, increase in peri-natal mortality, retardation of cerebral development,
endemic neurological and cretinism (myedemateux).
- New-born: Low birth weight, goitre and a under active thyroid gland.
- Infants and adolescents: Increase in infant mortality, goitre, congenital or developed under
active thyroid gland, physical and mental retardation.
- Adult: Goitre and its complications, underactive thyroid gland, mental retardation,
overactive thyroid gland.
7.6- Iron Source: («Food and Human Nutrition» DUPIN/CUQ)
Role: Important in the formation of haemoglobin (exchange of oxygen and carbonic gases
with the exterior) as well as myoglobulin in the muscle.
To understand the intakes of iron from food, we should refer at this time to the content of iron
in different foodstuffs as well as the percentage of absorption and levels of ‘availability’.
Natural Sources: (expressed in mg for 100 grams)
Fruits: 0.1 – 0.3 Dried Vegetables: 6 Calf Meat: 1.2 – 1.6

MODULE 1 – THE BASICS OF NUTRITION
© ACF – Technical and Research Department – 2007 42
Potatoes: 0.7 Lentils: 7 Pork Meat: 1
Green Veg: 0.7 – 2 Chocolate: 2 Poultry: 1
Beans: 4 Breast Milk: 0.07 Cow or calf Liver: 8
Rice: 0.4 Cow’s Milk: 0.03 Fish: 0.3 –1
White Bread: 0.4 – 0.8 Cow’s Meat: 2.5 Oysters: 6
Percentage of Absorption:
Haem Iron (in haemoglobin and myoglobin) present predominantly in foods of animal origin
is much better absorbed (bioavailability in the order of 25%) than non haem iron (transferrin,
stored forms: ferritine..) (bioavailability from 1-5%).
Available Iron:
It is possible to say that in western style foods, the bio-availability of iron is between 10% and
15%. Considering the under-developed countries where foods of animal origin are consumed
to a lesser degree, the availability of iron is closer to 5%.
Recommended Nutrients Intakes:
Iron intakes required for total absolute iron requirements 95th *
Age group (years) Median Pertcentil
mg/day mg/day
Children
0-5 0.72 0.93
1-3 0.46 0.58
4-6 0.50 0.63
7-10 0.71 0.89
Males
11-14 1.17 1.46
15-17 1.50 1.88
18+ 1.05 1.37
Females
11-14** 1.20 1.40
11-14 1.68 3.27
15-17 1.62 3.10
18+ 1.46 2.94
Post-menopausale 0.87 1.13 Lactating 1.15 1.50 * Total Absolute Requirements = Requirement for growth + basal losses + menstrual losses (females only)
** Non-menstruating.
Source: Report of a joint FAO/WHO expert consultation on human vitamin and mineral requirements
Iron Deficiency :( Source: Treating Child Nutrition. C.Ricour; J. Ghisolfi; G.Putet; O.
Goulet.)
The deficiency of iron results from firstly, insufficient individual intake of iron and secondly,
the needs created by the synthesis of different molecules containing the metal. The organism
responds by using the stored iron as well as increasing the intestinal absorption rate of the
metal. When the reserves are exhausted, the deficiency induces disturbances of the blood
production resulting in anaemia.

MODULE 1 – THE BASICS OF NUTRITION
© ACF – Technical and Research Department – 2007 43
Signs of deficiency are the following:
Reduced physical ability, reduced intellectual capacity, less resistance to infection as well as
disruption in the digestion process.
The Treatment of Iron Deficiency: (Source: Treating Child Nutrition. C.Ricour; J. Ghisolfi;
G.Putet; O. Goulet.)
Preventative Treatment:
The correct iron balance within a child is needed from the outset in order to have firm starting
point, this level of sufficient iron intake should be found while in the mother’s womb. It is
advisable to check the health condition of pregnant women in order to treat those who suffer
from deficiencies. This would then be a systematic supplement, especially if they have
already had children.
Curative Treatment:
A deficiency should be treated by an oral intake of ferrous salt. A dose of 3mg/kg/day is
sufficient, but should be administered in a prolonged manner (3 to 5 months). There exist
different preparations: Fumerate Ferrous=FUMAFER, the federate of
sodium=FERROSTRANNE, the heptogluconate ferrous=HELIOFER. Certain forms are
coupled to Ascorbic Acid=ASCOFER. A strong treatment results with black faeces and may
create digestive troubles, such as vomitting, constipation, and diarrhoea, which have a
tendancy to disipate as the dosage is reduced.
7.7- Potassium («Food and Human Nutrition» DUPIN/CUQ)
Potassium finds itself concentrated in the interior of the cells. All animal or vegetable tissues
are richer in potassium than in sodium. The needs in potassium are always practically
completely covered.
Daily Needs: The average intake within a normal ration is evaluated at around 2-4g per day.
Deficiency: Potassium deficiency can induce an increase in the digestive losses of those
suffering from severe and elongated diarrhoea, a reduction in the re-absorption of potassium
by the kidney as well as prolonging the work of certain diuretics.
In developing countries, potassium deficiencies are one the main causes of diarrhoea.
In case of insufficient intake originating from a diet composed primarily of cereals, which
have low levels of potassium, there exists a risk of severe hypokaliemie increasing the death
rate associated with diarrhoea.
Natural Sources : Foods rich in potassium: powdered coffee, freshly ground coffee, yeast,
soya flour, dry apricot, milk powder, raw white beans, dried bananas, potato chips.
7.8- Other Trace Elements
Fluorine, phosphorus, nickel, cobalt, selenium, manganese... although certain elements are
present only in very small quantities in the human body, they remain vital. Their principle
role is in the production and proper functioning of enzymes.

MODULE 1 – THE BASICS OF NUTRITION
© ACF – Technical and Research Department – 2007 44
Information about minerals and trace elements was found in «Food and Human Nutrition»
DUPIN/CUQ / MALEWIAK/LEYNAUD-ROUAUD/BERTHIER, in « Treating Child
Nutrition » C.Ricour; J. Ghisolfi; G.Putet; O. Goulet.) and in Report of a joint FAO/WHO expert
consultation Bangkok, Thailand / WORLD HEALTH ORGANIZATION FOOD SND
AGRICULTURE ORGANIZATION OF THE UNITED NATIONS Rome, 2002

MODULE 1 – THE BASICS OF NUTRITION
© ACF – Technical and Research Department – 2007 45
SUMMARY
The food intakes vary in quantity and quality. These figures vary, depending on age, health
status, type of activity, life conditions and climate but equally from one individual to another.
The following average intakes do not take into account all the individual variations.
The proportion of calorific intake should be approximately
10-15% Protein, 30-35% Fats, 50-55% Carbohydrates.
Essential Nutrients Proteins Amino Acids
(+ Histidine for infants) Lysine Leucine, isoleucine, valine Methionine, Phenylalanine, Tryptophane, Threonine
Lipids Fatty Acids
Acide linoleic Acide linolenic
Vitamins Retinol Calciferol Tocopherol Phylloquinone Thiamin Riboflavin Nocitinamide / Niacin Pyrodoxine Ac. Panthotenic Ac. Ascorbique Ac. Folic / folate Cobalamine Biotine Flavonoide Ac. Lipoique
Vit A Vit D Vit E Vit K Vit B1 Vit B2 Vit PP ou B3 Vit B6 VIT B5 Vit C Vit B9 Vit B12 Vit H
Minerals Calcium Chlorine Magnesium Sodium Potassium Iron Phosphorus
Ca Cl Mg Na K Fe P
TraceElements Chromium
Copper Fluorine Zinc Iodine Molybdene Selenium
Cr Cu F Zn I Mo Se

MODULE 1 – THE BASICS OF NUTRITION
© ACF – Technical and Research Department – 2007 46
II- FOODS
A- FOOD COMPOSITION
Foods are composed of a mixture of proteins, sugars, fats, water, vitamins and minerals.
1- PROTEINS
These are necessary for life and should represent between 10-15% of the daily calorific value.
They are composed from a mixture of amino acids some of which are considered ‘essential’.
Proteins produce 4 Kcal per gram (17 Kj)
1.1- Vegetables and Vegetable Seeds
Cheap and abundant, vegetable protein is deficient in most essential amino acids, in particular
methionine, although it is rich in Lysine. A mixture of cereal and vegetable allows the
deficiency in amino acids to be rectified and supplies the proper nutritional value of proteins,
as long as the basic calorific protein needs are covered (if not there will be a deterioration in
protein energy).
Seeds rich in oil and protein
Certain seeds are rich in proteins and/or rich in fats.
Peanuts contain 50% fat, 27% protein as well as niacin, which assists, even in small
quantities, to reduce the prevalence of pellegra in those individuals whose staple food is
maize. It is equally rich in folates. Nevertheless peanuts are poor sources of methionine, as
well as lysine, leucine and threonine. Conserving peanuts is necessary in order to protect
against humidity. They are attacked by Asperigillus flavus mushrooms which secrete an
aflotoxine, a factor which precipitates the development of liver cancer.
Soya contains 18% fats, and 35-40% of proteins. Despite a slight deficit in methionine, its
contents in lysine complements a diet dominated by cereals. Certain varieties of bitter soya
require soaking for dozens of hours to the breakdown of the outerwall. Boiling in water
eliminates the antitrypsic factor limiting digestion. Milling of soya grains produces soya milk.
Adding magnesium curdles the soya milk and produces tofu.
Other Vegetable Sources: Dried Vegetables:
These contain around 2-6% fats, 20-25% protein, B-Vitamins, and are rich in starch (a form
of carbohydrates). They are deficient in methionine and rich in lysine. Certain carbohydrates
are poorly digestible, as they contain alpha-galactoside proteins. Beans and peas are less
digestible than foods of animal origin, but this is improved after prolonged cooking.
1.2- Animal Products
Meats contain 15-20% of good quality proteins, 2-4mg/100g of iron, which is better absorbed
than iron of vegetable origin.

MODULE 1 – THE BASICS OF NUTRITION
© ACF – Technical and Research Department – 2007 47
Offal contains 16-20% of proteins and anti-anaemic nutrients, such as iron (10-12 mg/100g),
folates and the B12 vitamins. Animal blood is particularly rich in iron (52mg/100g), but is
consumed very rapidly.
Fish is an important source of protein, containing around 18-22%. It is rich in unsaturated
fatty acids, iodine and iron. Different fish vary in their percentage of fat content; 5% of fat in
fish considered as Low fat, 10% in Semi-fat fish (such as sardines), and more than 10% in
fish considered as Fatty (such as Tuna).
The bones of fish are rich in calcium and fluorine.
Mussels and Crustaceans, like fish, are rich in protein, iron, iodine, vitamin A and B. There is
a risk, however, of contamination by different bacillus or virus.
Eggs represent the best source of protein. Considered by FAO as having a combination of
proteins that is equal to the Biological Value of 100. An egg contains 12-14% of protein. The
dangers relating to the consumption of eggs are decreasing. As a result, poultry husbandry is
favoured, as is the selection of egg laying hens: ‘Animal husbandry does not require a lot of
space and is therefore effective in urban areas’. Easily digested by those after 6 months of
age, the white eggs should be cooked to insure absorption by the intestinal membrane.
In tropical climates, the eggs should be eaten within the first 5 days in order to avoid any
problems of chemical transformation or mould growth within the egg itself, as well as to
ensure there is no contamination from the shell (salmonella poisoning starts in the shell).
Holding the egg up to the sun, the dark yellow mass should be in the middle. If it is near the
side then the egg is not fresh.
Another procedure to extend the life of the egg involves keeping the egg in salted water (salt
should constitute 12%). For the first 2-3 days, the yolk should be centred within the liquid.
After the fourth day, the yoke moves towards the surface, and then after 15 days, the egg will
lay horizontally on the surface of the water.
Milk and it’s Derivatives
Milk constitutes the only food for infants. It is important to promote breastfeeding in
developing countries, due to the numerous advantages that are connected with breastfeeding
(see Annex 3 on Promotion of Breastfeeding).
It contains 87% water, 3.5% proteins of high biological value as well as a balanced
proportion of essential amino acids. The essential protein is casein, which has specific
properties that permit certain bio-chemical transformations.
Camel and goat milk are richer in protein (2%) than cow’s milk.
Carbohydrates are primarily in the form of lactose (approx.5%). Lactic bacillus transforms, by
fermentation, lactose into lactic acid, which is more commonly found in yoghurt than in milk,
and is more easily conserved in this new form. It can also be transformed into fermented milk,
but this type is alcoholic.
The portion of fats in cow’s milk depends upon the species and the diet of the cow, and thus
the fat content ranges between 3-5%. Animal milk is very rich in calcium, which is assisted
by lactose for its intestinal absorption.
Rich in retinol, riboflavin, and thiamin, the energetic value of milk depends on its fat content.
For example, a 4% fat content will give 700 kcal per litre of milk.

MODULE 1 – THE BASICS OF NUTRITION
© ACF – Technical and Research Department – 2007 48
The volume of milk produced is influenced by the food consumption of the animal. In Africa,
the normal level of production is considered to be between 1-2 litres, whereas in Europe, this
can be as much as 30 litres.
The quantity of milk production depends greatly on the food consumption of the lactating
woman. For a 'well fed' woman, the quoted volume of milk production is 800 ml for a period
of lactation, whereas for poorly nourished women, the volume can be as low as 300ml.
Conversely, the composition of breast milk hardly varies when the mother is suffering from
micro-nutrient deficiencies.
Milk hygiene is important, as milk bacteria can transmit Bovine tuberculosis and goat
brucellosis. Hygiene measures that can be taken include cleaning the hands and containers,
boiling the milk for 5 minutes, and consuming the milk in the following hours.
2- LIPIDS
This improves the energetic density of the food. They supply the essential fatty acids
(predominantly in vegetable oils) and facilitate the absorption of fat soluble vitamins (Vitamin
A, E). They improve the fluidity of a dish as well improve the taste.
Fats produce 9 Kcal per gram
2.1- Fats of vegetable and animal origin
Essential Fatty Acids (saturated / unsaturated): It is possible to regard animal fats as
‘saturated’ and those of vegetable origin as ‘unsaturated’. Unsaturated essential fatty acids
include linoleic, linolenic, and arachidonic acids.

MODULE 1 – THE BASICS OF NUTRITION
© ACF – Technical and Research Department – 2007 49
Average Composition of Body Fat
SATURATED UNSATURATED
Cream and Butter Other Fatty Materials
Water -Cream: variable according to
the creaming procedure.
-Butter: Maximum allowance
16%
-Oil: Vegetable, Lard:
Practically None.
-Margarine: 16%
Sugars -Cream: Approx 3%
-Butter: Traces of lactose in
the butter and impurities
present cause the proliferation
of bacterial formation,
resulting in rancidity.
-Oils and Fats: None
-Margarine: should obligatory
hold 2% starch which is
added to differentiate between
butter.( turns blue on contact
with iodised water).
Fats -Cream: 35% on average
-Butter: between 82% and
84%
-Fats in butter are, above all,
triglycerols. 1/3 oleic, this
explains the low level of
fusion in butter.
-Butter holds 4% butyrine:
when butter is rancid, it
transforms into butyric acid
through hydrolysis (a
somewhat disagreeable
odour)
-Butter also contains a small
level of lecithine and
cholesterol.
-Oils, lard, vegetable: 100%
-Margarine: 83%
-Body fats are a mixture of
many triacylglycerols.
-Oils contain a large
proportion of fats which are
unsaturated fatty acids, above
all oleic acid. The content of
polyunsaturated acids is
variable. This is why they are
liquid at normal temperatures.
Proteins -Cream: Approx. 2%
-Butter: Traces of casein
None
Minerals and Vitamins Practically None.
Rich in vitamin A (Butter is
the food the most rich after
liver).
Cream and butter are able to
contain a small amount of
Vitamin D.
Practically None..
No vitamins A. But carotene
in palm oil.
-Vitamin E in certain Oils.
-Essential fatty acids in
certain Oils.
Energy For 100 g:
-Cream: 337kcal = 1400kj
-Butter: 760kcal = 3177 kj
For 100 g:
-Oil, lard: 900 kcal = 3672 kj
-Margarine: 760 kcal = 3176
kj
Coconut Oil: Rich in saturated fatty acids.
Palm Oil: Extracted almond oil is contained in the stone of the fruit. Looks similar to coconut
oil.
Non-refined palm Oil: Solid oil containing a large proportion of saturated fatty acids. It is
extracted from the pulp of the fruit from palm oil. It is rich in Vitamin A. One dessert spoon
of palm oil before the age of one is sufficient.

MODULE 1 – THE BASICS OF NUTRITION
© ACF – Technical and Research Department – 2007 50
Refined Palm Oil: moving away from crude palm oil. The refining process eliminates some of
the more undesirable elements (necessary to remove before consumption), some of which are
responsible for the specific taste and smell of the cruder oils. The refining process is also used
to sustain and improve the organoleptic characters (freshness, flavour and colour) and the
stability of the fat.
Peanut oil: Rich in saturated fatty acids. Remains stable when heated.
Soya Oil: Rich in unsaturated essential fatty acids and linolenic acid. Fragile when heated.
Cod Liver Oil: very rich in Vitamin A and D.
Lard: (Pork Fat) as much saturated fatty acids as unsaturated.
Suet: Richest in saturated fatty acids.
2.2- Butters and Margarine’s
These are made from animal and vegetable products.
Butter: Rich in fat soluble Vitamin A and D.
Margarines: Fats in the form of an water emulsion in the oil.
2.3- Oil producing seeds and fruits
These have a dual role, containing both fats (between 30-65%) as well as proteins (12-35%).
Examples are oils from seeds of watermelon, sesame and sunflowers. They are rich in
Vitamin B, iron, calcium, and carotene.
3- CARBOHYDRATES
These foods constitute the main source of nutritional energy in the developing nations. The
source is above all through the consumption of cereals and tubers. These foods rich in energy
should normally be cooked in water, especially before giving to children. The water is
absorbed by the starch and considerably diminishes the energetic density of the cooked foods.
Sugars produce 4 Kcal per gram (17 Kj)
3.1- Cereals
Although the supply of energy is good from these particular foods, the composition of amino
acids from cereals results in a deficiency in at least one essential amino acid: lysine.
All the cereals are of comparable structure, the grain consists of:
- external casing without nutritional value: cellulose layer, pericarp, tegument. Many
indigestible elements exist, however, the intake of fibre is useful to increase the weight of
foods in the bowel and hence improve intestinal movement;
- Aleurone, rich in proteins, vitamins (niacin and riboflavin) as well as minerals;
- The germ or embryon, very rich in thiamin, riboflavin and niacin;
- Endosperm, the most important part of the grain where the majority of the starch is
contained.
Rice:
Rice, when still encased is called ‘paddy rice’. Without this casing, having been stripped by a
milling process (e.g. Pestle and mortar or grindstones), the rice is called wholegrain or
unrefined. Regarding the high consumers of white rice, that is white or semi-white: The

MODULE 1 – THE BASICS OF NUTRITION
© ACF – Technical and Research Department – 2007 51
milling may remove the germ and more of the outside layers from the wholegrain. If the
cereal is rice, this is called polished rice. Other cereals are usually milled into ‘white’ or
refined flour. As a result Beri-beri can occur from thiamin deficiency. Traditional preparation
of rice contains sufficient quantities of thiamin to cover the needs of the population.
An Indian process exists called steaming. From paddy rice this is soaked and then steamed for
10-20 minutes allowing the water to be absorbed by the grain and in this way the B Vitamins
remain in the endosperm. Drying and then milling allows the polishing and bleaching of the
rice without the loss of important vitamins (75% of the thiamin and 100% of the riboflavin).
The risk remains that while cooking the vitamins while pass into the boiling water.
The water from this process can be used in the treatment of frequent cases of diarrhoea.
Maize:
This contains 10% protein, is poor in lysine as well as tryptophane and niacin. The lack of
tryptophane (A.A.E) and of niacin (Vitamin PP) can cause pellagra. To correct these deficits,
a combination of foods, maize plus vegetables or maize boiled in water at around 80 degrees
C permits the release of digestible niacin. Young maize contains pro-vitamins. Industrial
processing of maize results in the loss of thiamin of up to 85%, 23% of riboflavin and 30% of
niacin. But certain countries have legislation that make provision for the fortification of flour.
Millet and Sorghum:
This is a staple food within dry regions, it contains two thirds carbohydrates, 7-17% proteins.
It is deficient in lysine, though they are a good source of thiamin (Vit.B1) and niacin (Vit.PP)
Poor in calcium, their content in iron is substantial.
Preparation: crushed by mortar, then crushed again, peeled by milling. Then cleaned and dried
in the sun for 20 minutes. Sifting allows the separation of the coarse and finer flour. The fine
flour is then the base for couscous. The coarse flour, made up of the central part of the grain,
less rich in vitamins and proteins, is used for millet gruel or porridge. The millet can be
completely ground down into a form of fine flour used to prepare dough: ‘To’ from Mali and
Burkino Faso.
Fonio is eaten in West Africa and is relatively poor in proteins: 6-7%, but it can secure the
difficult periods between harvests.
Teff or Ethiopian millet consumed in Ethiopia contains a substantial quantity of iron.
Eleusine from very small seeds, is similar to Fonio. Eaten in Asia and Africa (Ethiopia and
dry regions), adapted to poor soils or where other cereals would not grow.
Wheat:
Primarily grown in the developed countries, it has seen an increase in consumption in the
developing nations in the form of bread, especially in the urban areas. Like the other cereals
it’s nutritional value depends on the level of extraction. The greater the extraction level the
whiter the flour will be, as will be the reduction in the level of phytic acid. Example: 75%
extraction will result in the 25% of the weight of the grain being lost. This white flour will
have lost a large quantity of B Vitamins.
The entire content of the flour in terms of proteins is 11-13%, 75% of carbohydrates. If the
level of extraction is reduced from 85% to 70% then the protein content will be reduced to
6%.
Oats:
This is richer in proteins than rice, wheat and maize, but contains phytic acid which limits the
absorption of iron.

MODULE 1 – THE BASICS OF NUTRITION
© ACF – Technical and Research Department – 2007 52
Buckwheat:
This is poor in proteins as well as minerals.
Barley:
This is consumed in certain parts of Africa (Morocco) in the form of couscous. Its nutritional
value is similar to that of wheat.
Quinoa:
This is cultivated in South Africa and contains 12-16% protein.
Rye:
This is consumed in the CIS (Ex-Soviet Union) in the form of bread.
3.2- Roots and Tubers
These are poor in proteins, minerals and vitamins. Cultivation and conservation in the ground
is considered easy and explains the importance given to them by some cultures. In addition to
the consumption of the roots, the utilisation of the leaves of these plants also have some
important nutritional advantages, containing 7% protein, as well as some vitamins and
minerals.
Yam
This contains between 2-8% proteins. Eaten boiled or roasted, the wild varieties often contain
sharp and toxic elements that can be eliminated after boiling. It should be stocked in a dry
environment and not in the ground.
Taro and Macabo:
Their leaves are often compared to the ears of an elephant. They are poor in proteins (1.5% -
2%). They supply flourine. Eaten roasted, boiled, sliced, pureed or even fermented.
Sweet Potato:
This has a high content of carotene.
Manioc / Cassava:
This is conserved well in the soil, meaning it can be harvested on a day to day basis. But this
cultivation is too often repeated, slowly reducing the quality of the soil. The Proteins (1-1.5%)
are of weak biological value (deficient in methionin). Exclusive consumption can result in
certain nutritional problems. There are two varieties: The sweet variety, that can be consumed
after peeling and boiling and the bitter variety, whose tubers contain toxic substances which is
found mainly in the skin of the tuber itself.
For the bitter manioc, an initial step should be taken: the manioc should be placed in water for
a number of days, after having peeled the skin rich in toxins, this produces a fermentation
process that dissolves any remaining toxins.
Preparation: Manioc bread, boiled (foufou), tapioca.
Manioc or cassava, consumed in numerous countries, R.D.C (ex-Zaire), Cameroon, Benin..)
contains a factor leading to goitre (thiocyanate), which can explain the existence of goitre and
severe hyperthyroid problems in these regions.

MODULE 1 – THE BASICS OF NUTRITION
© ACF – Technical and Research Department – 2007 53
The Other Tubers:
The potato, fruit bread (oceania), peasant fruit, sagou, (pacific islands).
3.3- Sugar Products
Sugar:
This is 100% saccharine, a rapidly absorbed carbohydrate. On the other hand starch is
absorbed very slowly.
Honey:
This has a laxative effect.
4- VITAMINS AND MINERALS
Fruits and Vegetables.
In terms of energy supply, for fruits and vegetables, this is negligible (40kcal for 100g). Rapid
urbanisation within developing countries has resulted in those who used to live in the rural
areas where they were used to picking and cultivating vegetables are not willing to spend
money on these foods. This explains the deficiencies observed in these populations.
Fruits and vegetables contain an important quantity of water (80-95%).
4.1- Vegetables
Amongst the minerals contained in vegetables, we must mention calcium, the iron is
contained in the dark green leaves (leaves of manioc, amaranthe and green beans) and a
significant level of proteins (8%).
Fresh vegetables lose part of their vitamin content during transportation, also during the
cooking process, especially when boiled in water. When certain vegetables are dried the
ascorbic acid is destroyed.
4.2- Fruits
These contain practically no fats whatsoever and are also very low in energetic value (around
55kcal for 100g). The protein content is negligible but the supply of fibre as is the case with
vegetables is important. The essential component in fruit is Vitamin C and for orangy yellow
fruits this also includes pro-vitamin A.
The banana.
More uniquely, this contains starch and is also rich in carotene, vitamin C and potassium.
5- ANTI-NUTRITIONAL FACTORS, CONTAMINANTS
Certain foods contain certain contaminants that influence the incidence of various types of
cancers. The most common contaminants are produced from a mixture of plant synthesis
processes or supplied by contamination. They are found mainly in vegetables. Their
concentration is often weak and they are generally destroyed by heat treatment or extracted
into the water during boiling. It should not be forgotten however that vegetables constitute an
important source of energy, mineral and above all, protein.

MODULE 1 – THE BASICS OF NUTRITION
© ACF – Technical and Research Department – 2007 54
5.1- Contaminants
*Mycotoxins
Microscopic mushrooms grow in food producing toxins harmful to humans.
Aflotoxins (Aspergillus Flavus) is the best known and is found in particular in peanut seeds,
but also in cereals and vegetables. This can result in cancer of the kidney. Medical treatment
in many cases can destroy this type of cancer, however, attention should be paid to foods
prepared in a traditional manner for local consumption.
*Nitrogen Fertilisers
If overly used, the nitrosamines are carcinogenic.
*Certain Non Natural Hormonal Derivatives
Distilbene, well known for its therapeutic properties (1946-1976) in young women with the
threat of spontaneous abortion. The consequences of which were alterations in the vaginal
mucous membrane producing cancer of the vagina.
*Certain Food Additives
Such as nitrites, artificial sweetners, and certain colourants.
5.2- Anti-Nutritional Factors
*Protease Inhibitor: deficient in methionin.
*Hemoglutinines or Lectines
These cluster around the red blood cells and provoke growth retardation, colitis and anemia if
they are consumed regularly.
*Glucosinates
They can cause disturbances in the thyroxine synthesis and hence the metabolism of iodine.
*Phytic Acid
Inhibits the absorption of Zinc, Iron, Calcium and Magnesium.
*Antivitamins
It blocks the action of specific vitamins at their site of action (e.g. E within beans....).
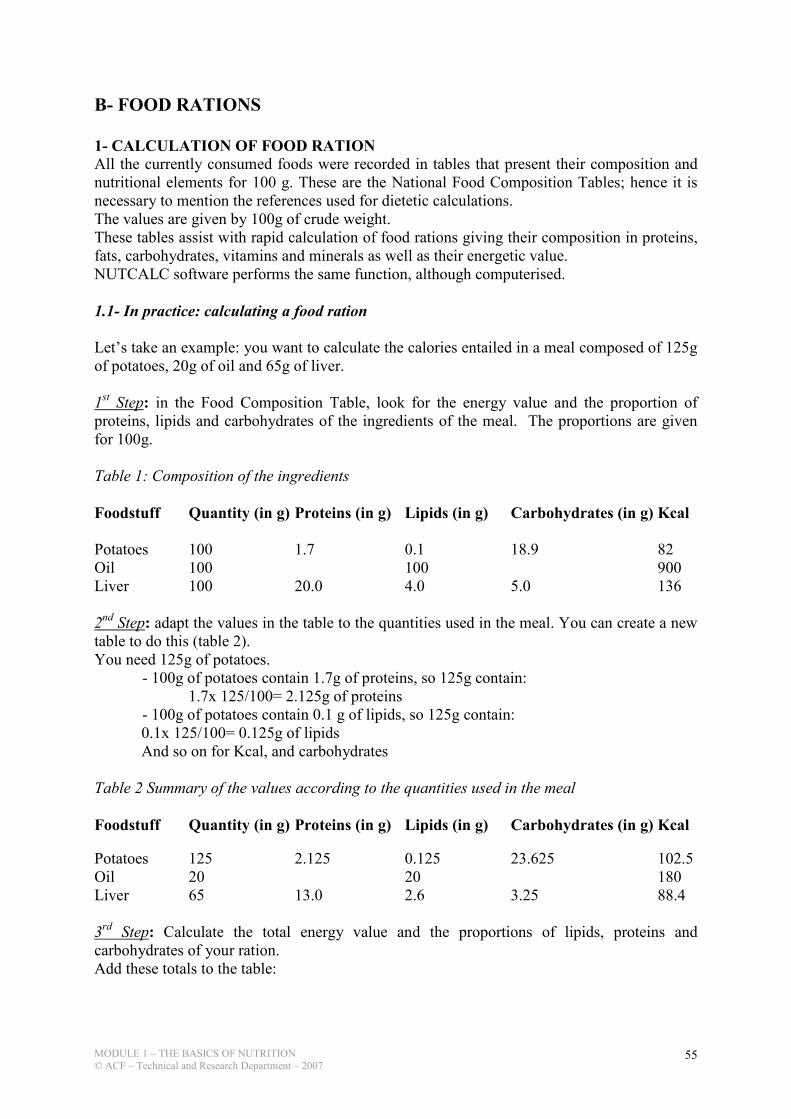
MODULE 1 – THE BASICS OF NUTRITION
© ACF – Technical and Research Department – 2007 55
B- FOOD RATIONS
1- CALCULATION OF FOOD RATION All the currently consumed foods were recorded in tables that present their composition and
nutritional elements for 100 g. These are the National Food Composition Tables; hence it is
necessary to mention the references used for dietetic calculations.
The values are given by 100g of crude weight.
These tables assist with rapid calculation of food rations giving their composition in proteins,
fats, carbohydrates, vitamins and minerals as well as their energetic value.
NUTCALC software performs the same function, although computerised.
1.1- In practice: calculating a food ration
Let’s take an example: you want to calculate the calories entailed in a meal composed of 125g
of potatoes, 20g of oil and 65g of liver.
1st Step: in the Food Composition Table, look for the energy value and the proportion of
proteins, lipids and carbohydrates of the ingredients of the meal. The proportions are given
for 100g.
Table 1: Composition of the ingredients
Foodstuff Quantity (in g) Proteins (in g) Lipids (in g) Carbohydrates (in g) Kcal
Potatoes 100 1.7 0.1 18.9 82
Oil 100 100 900
Liver 100 20.0 4.0 5.0 136
2nd Step: adapt the values in the table to the quantities used in the meal. You can create a new
table to do this (table 2).
You need 125g of potatoes.
- 100g of potatoes contain 1.7g of proteins, so 125g contain:
1.7x 125/100= 2.125g of proteins
- 100g of potatoes contain 0.1 g of lipids, so 125g contain:
0.1x 125/100= 0.125g of lipids
And so on for Kcal, and carbohydrates
Table 2 Summary of the values according to the quantities used in the meal
Foodstuff Quantity (in g) Proteins (in g) Lipids (in g) Carbohydrates (in g) Kcal
Potatoes 125 2.125 0.125 23.625 102.5
Oil 20 20 180
Liver 65 13.0 2.6 3.25 88.4
3rd Step: Calculate the total energy value and the proportions of lipids, proteins and
carbohydrates of your ration.
Add these totals to the table:

MODULE 1 – THE BASICS OF NUTRITION
© ACF – Technical and Research Department – 2007 56
Foodstuff Quantity (in g) Proteins (in g) Lipids (in g) Carbohydrates (in g) Kcal
Potatoes 125 2.125 0.125 23.625 102.5
Oil 20 20 180
Liver 65 13.0 2.6 3.25 88.4
TOTAL 210 15.1257 22.725 26.875
You will then need to convert the values of proteins, lipids and carbohydrates taking into
account the fact that 1g of proteins doesn’t have the same energy value than 1 g of lipids or
carbohydrates.
1g of proteins = 4 Kcal 1g of lipids = 9 Kcal 1g of carbohydrates = 4 Kcal
Add these values to your table:
Foodstuff Quantity (in g) Proteins (in g) Lipids (in g) Carbohydrates (in g) Kcal
Potatoes 125 2.125 0.125 23.625 102.5
Oil 20 20 180
Liver 65 13.0 2.6 3.25 88.4
TOTAL 210 15.125 22.725 26.875
in Kcal 15.1x4 = 60.4 22.7x9 = 204.3 26.9x4 = 107.6 372.3
You can now calculate the proportions of the total energy value contained in the proteins,
lipids and carbohydrates : the total energy value of the meal is 372.3 Kcal (=100% of the
energy value) ; this means that the 60.4 Kcal contained in the proteins represent 16.2% of the
total energy value, that is :
60.4x 100/372.3 = 16.2
The 204.3 Kcal contained in the lipids represent 54.9 % of the total energy value, that is :
204.3x 100/372.3 = 54.9
The 107.6 Kcal contained in the carbohydrates represent 28.9% of the total energy value, that
is:
107.6x 100/372.3 = 28.9
Foodstuff Quantity (in g) Proteins (in g) Lipids (in g) Carbohydrates (in g) Kcal
Potatoes 125 2.125 0.125 23.625 102.5
Oil 20 20 180
Liver 65 13.0 2.6 3.25 88.4
TOTAL 210 15.125 22.725 26.875
in Kcal 15.1x4 = 60.4 22.7x9 = 204.3 26.9x4 = 107.6 372.3
in % 16.2 54.9 28.9 100
4th Step: looking at the results obtained, you can now tell whether the food ration is well
balanced or not, compared to the recommendations.
This meal does not answer the requirements: the proportion of lipids is too high (54.9%) and
not enough carbohydrates (28.9%)
You now want a food ration that contains 500kcal of which 13% of proteins, 35% of lipids
and 52% of carbohydrates, and which is composed of CSB, Oil and sugar.
7 It is recommended to round the figures : 15.125 will become 15.1 and 26.875 will become 26.9.

MODULE 1 – THE BASICS OF NUTRITION
© ACF – Technical and Research Department – 2007 57
1st Step: you start with the Food Composition Table.
Table 1 Food Composition for 100g
Foodstuff Quantity (in g) Proteins (in g) Lipids (in g) Carbohydrates (in g) Kcal
CSB 100 18.0 6.0 60.0 366
Oil 100 100 900
Sugar 100 100 400
2nd Step: you calculate what proportion to the total 500 Kcal should come from the proteins
(in this case 13%, that is 65 Kcal), from the lipids (35%, that is 175 Kcal) and by the sugar
(52%, that is 260).
You will then need to convert these values into « grams » of proteins (in this case 65/4 =
16.25g), of lipids (in this case 175/9 = 19.4g) and carbohydrates (in this case 260/4 = 65g)
3rd Step: you look for the source of proteins in your foodstuffs. It is recommended to start
with the proteins: if needed, you can always add some sugar or some oil to balance the ration.
You then apply the Rule of three to find out what quantity of each food you need to get the
exact amount of proteins that you want.
You can now find out how much lipids and carbohydrates this foodstuff contains.
4th Step: add some oil and sugar to make up for the missing quantities of lipids and
carbohydrates and your ration is ready.
Foodstuff Quantity (in g) Proteins (in g) Lipids (in g) Carbohydrates (in g) Kcal
in % 13 35 52 100
in Kcal 65 175 260 500
TOTAL 16.25 19.4 65
CSB 90 16.2 5.4 54.0
Oil 14 14.0
Sugar 11 11.0
You will find a series of exercises in the appendix.
2- BALANCED FOOD RATIONS
Nutritional recommendations are expressed in recommended intakes in terms of energy and
the desirable levels of macronutrients (protein, carbohydrate and fats) as well as
micronutrients.
The way in which one is fed often depends less on nutritional ideas but on socio-economic,
cultural, psychological (habits and taboos), economics and seasonal factors.
Firstly, one of the principle components of a balanced diet is to adopt a varied diet, it is
suggested to diversify the core foods within the same group.
A balanced food ration is managed over numerous days (a week, even more). A separation of
the foods at hand during a single day is an additional factor that can be taken into account to
ensure a balanced diet.

MODULE 1 – THE BASICS OF NUTRITION
© ACF – Technical and Research Department – 2007 58
2.1- Energy.
The average energetic requirements of a group should be reached.
2.2- The Nutrients
The recommended quantities should cover the needs of practically all the individuals in a
popluation, the allocated quantities being greater than that of the average requirements.
The quantities indicated refer to the level of energy and nutrients after absorption from a usual
mix of foods consumed during a meal.
During a dietetic evaluation, no nutritional recommendations should be considered separately.
A need for a particular nutrient depends on the level of presence of other nutrients (e.g.
Vitamin A/ Fats)
Example: Proteins can not be used effectively without a sufficient quantity of energy within
the absorbed food.
Vitamin A can not be used until there is a sufficient quantity of proteins to facilitate its
transportation.
The tables of recommended intakes are guides or references to apply to groups, although they
should be adjusted when looking at the needs of individuals, such as a child or its mother.
NOTE
Food rations vary in quantity and quality. These figures vary depending on age, health status,
the type of activity, life conditions, climate, but equally from individual to individual. It
should be understood that the presented figures do not take into consideration all the plausible
variations seen in individuals.
Calories originating from various macronutrients should be approximately:
10-15% Protein, 30-35% Fat, 50-55% Carbohydrate.

MODULE 1 – THE BASICS OF NUTRITION
© ACF – Technical and Research Department – 2007 59
III- MALNUTRITION
Malnutrition
An abnormal physiological condition caused by deficiencies, excesses or imbalance of energy
and nutrients.
A- MICRONUTRIENTS
1- MICRONUTRIENTS CHARACTERISTICS
There are about 40 nutrients that are essential to health.
If any one is deficient then the person will not be healthy and resist disease.
Many are ignored by nutritionists and their deficiency is not recognised.
They are divided into two groups in terms of the response to a deficiency
Type 1 Type 2
Functional nutrients Growth nutrients
Has a body store has no body store
Reduces in concentration with deficiency stable tissue concentration
Specific signs of deficiency no specific signs of deficiency
Growth failure not a feature Growth failure the dominant
feature
Variable in breast milk stable in breast milk
2- TYPE 1 AND TYPE 2 MICRONUTRIENTS8
Type 1: Type 2
iron nitrogen (= azote)
iodine essential amino acids
copper potassium
calcium magnesium
selenium phosphorus
thiamin sulphur
riboflavin zinc
pyridoxine sodium
niacin chloride
folate
cobalamin
vitamin A, D, E, K Source: The response to nutrient deficiency. Type 1 and type 2 responses, 2003
8 Golden M.H.N (1991). The nature of nutritional deficiencies in relation to growth failure and poverty. Acta. Pediatr.
Scand. 374, 95-110

MODULE 1 – THE BASICS OF NUTRITION
© ACF – Technical and Research Department – 2007 60
B- THE DIFFERENT TYPES OF MALNUTRITION
1- TYPE I MALNUTRITION
Type I malnutrition is leading to a specific disease linked with a specific micronutrient
deficiency: micronutrients type I (Cf. list above)
Examples of deficiency:
• Scurvy due to a vitamin C deficiency
• Beriberi due to vitamin B1 deficiency
• Night blindness and xerophthalmia linked with vitamin A deficiency
• Severe anaemia due to iron deficiency
• Goitre due to iodine deficiency
• Pellagra due to niacin deficiency (vit PP)
• Rickets due to vit D deficiency
• …etc.
2- TYPE II MALNUTRITION
Deficiency of any one of type II micronutrients (Cf. list above) leads to the same response:
• Tissue repair and growth ceases
• No convalescence from illness
• Negative balance for all type II nutrients
• Anorexia (if diet is unbalanced in type II)
• Growth rate is the dominant determinant of requirement
Type II malnutrition is:
• Acute malnutrition
• Chronic malnutrition
• Underweight
2.1- Acute malnutrition / Wasting
Acute Malnutrition is classified according to the degree of wasting and the presence of
oedema.
Acute malnutrition is recent, due to a conflict, displacement, natural disaster, severe outbreak
disease (cholera, measles)…etc.
Acute malnutrition is measured with the weight for height index (WFH) or the Body Mass
Index (BMI) for adults.
Acute malnutrition is expressed also by a proxy indicator – Mid Upper Arm Circumference
(MUAC) – initially measuring the risk of mortality hence indirectly measuring acute
malnutrition.
2.1.1- Severe Acute Malnutrition (SAM)
It is severe acute malnutrition (SAM) 9 if the wasting is severe:
• WFH < 70% NCHS median or < -3 SD 9 The term “protein-energy malnutrition” is no longer used as it is not thought that protein or energy deficiency, per se,
are the usual causes of severe acute malnutrition.
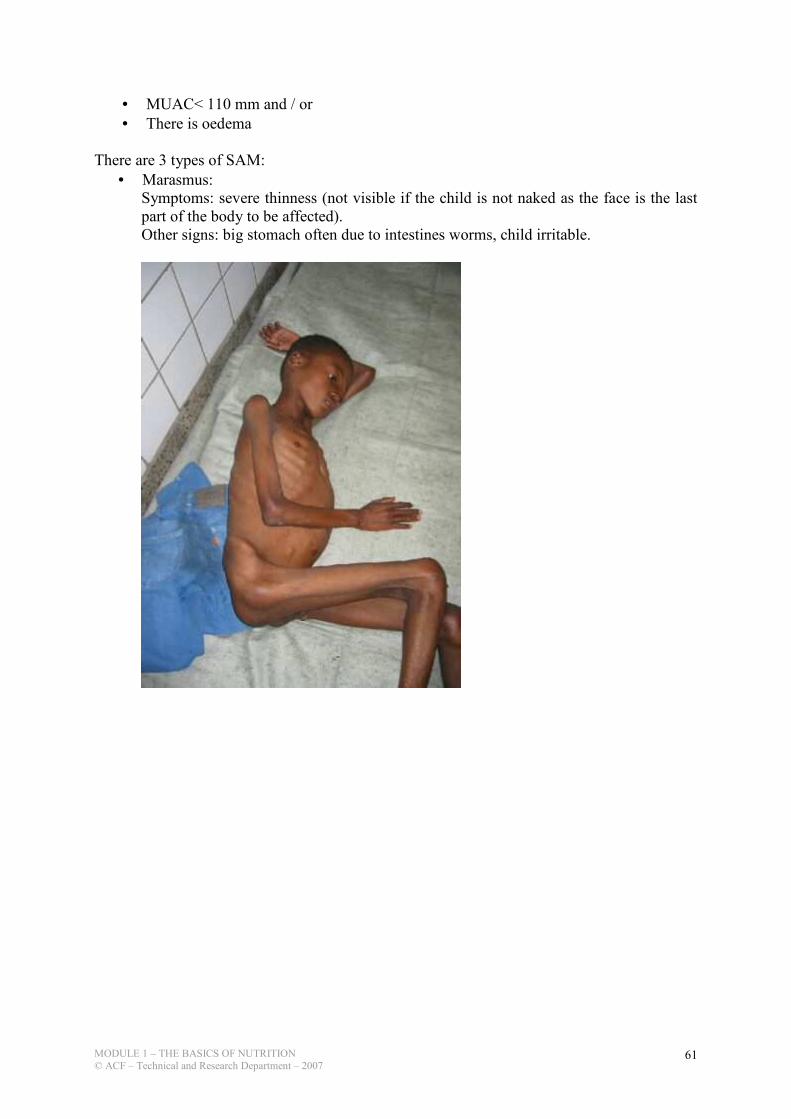
MODULE 1 – THE BASICS OF NUTRITION
© ACF – Technical and Research Department – 2007 61
• MUAC< 110 mm and / or
• There is oedema
There are 3 types of SAM:
• Marasmus:
Symptoms: severe thinness (not visible if the child is not naked as the face is the last
part of the body to be affected).
Other signs: big stomach often due to intestines worms, child irritable.

MODULE 1 – THE BASICS OF NUTRITION
© ACF – Technical and Research Department – 2007 62
• Kwashiorkor
Symptoms: presence of bilateral oedema (on both feet). These watery oedemas can
after reach the tibias, the hands and the face.
Other associated signs (not to consider alone): loss of hairs, hairs «bleached», big
stomach due to big liver and gas produced by overpopulation of bacteria in the
intestines due to immuno- depression. And overall, the child is apathetic.
• Marasmic-Kawshiorkor:
Child with the signs of both severe acute malnutrition: severe thinness and bilateral
oedema. It is then difficult to know which malnutrition started first but it is often a
severe case with high risk of mortality. Emergency.
2.1.2- Moderate Acute Malnutrition (MAM)
Malnutrition is defined as moderate acute malnutrition (MAM) if the wasting is less severe:
• WFH between 70% and 80% NCHS median or –3 ≤ WFH < -2 SD • 110 ≤ MUAC < 120 mm
Oedematous cases are always classified as severe.

MODULE 1 – THE BASICS OF NUTRITION
© ACF – Technical and Research Department – 2007 63
2.2- Chronic malnutrition / Stunting
• Old, due to child disease, micronutrient deficiencies of children and/or often mothers,
which delay growth…etc.
• Is characterised by a small height (for a given age).
• Is difficult to evaluate in cases where the child’s exact age is not known.
• Is measured with the height for age index (HFA)
• Is expressed in moderate (80 ≤ HFA <90% of the median or –3 ≤ HFA < -2 SD) and severe (<80% of the median or < -3 SD)
2.3- Underweight malnutrition or Undernutrition (measured by growth monitoring curve in
most health book)
• Mix of the previous two, does not mean a lot
• Low weight for a given age (due to small size (growth delay) or due to a recent weight
loss.
• Is measured with the Weight for Age index (WFA)
• Is expressed in different severity levels but usually in moderate (60 ≤ WFA <90% of the median or –3 ≤ WFA < -2 SD) and severe (<60 % of the median or < -3 SD)
3- MEASUREMENTS OF MALNUTRITION
The nutritional status can be evaluated through anthropometric measurements and the
presence of oedema.
The anthropometric measurements are:
Weight
Height
Mid-upper arm circumference (MUAC)
C- THE CAUSES OF MALNUTRITION:
1- A CONCEPTUAL FRAMEWORK OF THE CAUSES OF MALNUTRITION IN
EMERGENCIES
Adapted from UNICEF10
This conceptual framework on the causes of malnutrition was developed in 1990 as part of the
Unicef nutrition strategy. The framework shows that causes of malnutrition are multisectoral,
embracing food, health and caring practices. They are also classified as immediate,
underlying, and basic, whereby factors at one level influence other levels (Cf. schema)
10 this framework was initially conceived in Tanzania by UNICEF in 1990. It was then endorsed and adopted at the
International Conference on Nutrition in 1992 at which UN organisations, other agencies and the governments of 159
stated participated. The above version is an adaptation by ACF/AHH/ACH.

MODULE 1 – THE BASICS OF NUTRITION
© ACF – Technical and Research Department – 2007 64

MODULE 1 – THE BASICS OF NUTRITION
© ACF – Technical and Research Department – 2007 65
2- ANALYSING THE DETERMINING FACTORS OF NUTRITIONAL STATUS
The nutritional status of a population and its determining factors, can be analysed using a
causal analysis model (Cf. schema). This model makes a distinction between the causes
operating at different levels in the society: individual, household, community, geographic
division, country (Young, 1995).
The two immediate factors determining malnutrition are inadequate food intake and infectious
diseases. In turn, these are influenced by three underlying causes: food security at household
level, sanitary environment combined with access to health services, and social environment.
A third level of determining factors, the basic causes, is influenced by potential resources and
the economic, political and ideological structure.
For a proper understanding of the nutritional status in a given situation, it is necessary to
consider the importance of, and role played by, each of these factors.
Warning about this concept: this concept is theoretical. It allows one to consider the different
aspects of an individual’s well being. However, the direct causal link between the various
factors and malnutrition cannot be shown. This model should be used as a tool with which to
view the nutritional situation in context, but not one that attempts to create a direct link
between malnutrition and its underlying causes.
2.1- -The underlying causes:
2.1.1- Food security
The ability of a family to produce its food is influenced by many factors: the kind of
production (agriculture, horticulture or livestock husbandry), access to fertile land, access to
pasture, availability of labour, appropriate seeds and tools, climatic conditions, etc.
The purchase of food is regulated on the one hand by the money coming into the household,
and on the other by the availability and price of food in the markets. In emergency situations,
whatever the cause, access to food may be affected, forcing the population to modify its
normal habits. A family’s first reaction to food insecurity is to change its eating habits, either
by reducing intake or eating different, cheaper foods, often a lower nutritional value.
Population facing regular period of drought and famine tend to find ways of continuing to
produce food, but when the future of their food supply is no longer secure, they are often
obliged to resort to migration.
2.1.2- Public health – Basic health services and environmental health
Environmental health includes every aspect of the environment that has a bearing on the risk
of infectious diseases. The availability of health services and the population’s access to these
services affects the treatment of disease. Inadequate or delayed treatment exposes the
individual to increasing nutritional risks as the illness is prolonged. Access to adequate clean
drinking water and the availability of sanitary facilities are important elements in maintaining
a healthy environment.
2.1.3- Social environment
The social environment within the household and in the local community directly affects the
ability of the family, and its individual members, to look after themselves and to secure an
adequate diet. The values inherent in a society have a strong influence on the importance
given to the well being of each member of a family. Crisis situations cause serious social

MODULE 1 – THE BASICS OF NUTRITION
© ACF – Technical and Research Department – 2007 66
upheaval, in particular the destructuralisation of those social networks, in normal times,
would assist the family.
2.2- The basic Causes
The organisation of a society, which includes mechanisms for regulating such things as
power, ownership and division of labour, exerts considerable influence over food security,
social environment and public health. Social and political changes will affect the population’s
access to food and basic services.
Sources: ACTION CONTRE LA FAIM: Assessment and Treatment of Malnutrition in Emergency Situations.
Manual of Therapeutic Care anf Planning for a Nutritional Programme, 2001, page 58, 59 & 60. Claudine
Prudhon

MODULE 1 – THE BASICS OF NUTRITION
© ACF – Technical and Research Department – 2007 67
EXERCISES

MODULE 1 – THE BASICS OF NUTRITION
© ACF – Technical and Research Department – 2007 68
QCR (Choose the responses you believe are correct)
FOODS
Ques N°1 Ques N°2 Rice is: Maize is : A- A cereal, A- A cereal, B- A vegetable, B- A vegetable, C- A tuber, C- A tuber, D- Other D- Other Ques N°3 Ques N°4 Manioc (cassava) is: Soya is: A- A cereal, A- A cereal, B- A vegetable, B- A vegetable, C- A tuber, C- A tuber, D- Other D- Other Ques N°5 The raw tubers are important for their supply of: A- Energy, B- Proteins, C- Fats, D- Fat soluble Vitamins, E- Group B Vitamins. Ques N°6 Most fruits are important in their supply of: A- Energy, B- Protein, C- Fats D-Vitamin C, E- Group B Vitamins. Ques N°7 Vegetable oil is an important source of: A- Energy, B- Protein, C- Fats D-Vitamin C, E- Group B Vitamins. Ques N°8 Which foods are important sources of digestible fibre? A- Extracted cereals, B- Green leaves, C- Body Fats D- Meats, E- Partially extracted cereals.

MODULE 1 – THE BASICS OF NUTRITION
© ACF – Technical and Research Department – 2007 69
Ques N°9 Ques N°10 One gram of fat supplies: One gram of carbohydrate supplies: A-2 Kcal A-2 Kcal B-4 Kcal B-4 Kcal C-7 Kcal C-7 Kcal D-9 Kcal D-9 Kcal E- None of the Above. E- None of the above.
Ques N°11 A-1 Kcalory = 4,18 Kjoules B-1 Kjoule = 4,18 Kcalories C-1 Kcalory = 4,18 Joules D-1 Joule = 4,18 Kcalories Ques N°12 Regarding proteins in eggs: A- The quality of proteins in vegetables is sufficient B- The quality of proteins in soya is sufficient C- The quality of proteins in meat is sufficient D- The quality of proteins in fish is sufficient E- None of the Above.
REQUIREMENTS
Ques N°13 A sufficient level of protein supply according to the sex and category of age as defined by the
WHO satisfactory allowance: A- Protein needs of half the population B- Protein needs of almost all of the population C- The protein and energy needs of half the population D- The protein and energy needs of almost all the population E- None of the Above. Ques N°14 A child of 4years consumes a monotonous diet based on cereals and vegetables. From this he
consumes 17,5 grams of protein, the safe protein supply for his age. His protein intake is: A- Satisfactory B- Unsatisfactory C- There exists a good chance that the intake is unsatisfactory D- There is a small chance that the intake is unsatisfactory E- None of the Above.
Ques N°15 Recommended international levels: A- An increase in energy intake throughout the pregnancy. B- An increase in the energy intake during just the last two trimesters of pregnancy. C- An increase in the energy intake during only the last trimester of pregnancy. D- A reduction of energy intake during the last trimester of pregnancy. E- None of the Above.

MODULE 1 – THE BASICS OF NUTRITION
© ACF – Technical and Research Department – 2007 70
CALCULATION OF RATIONS
N° 1 You have interviewed the mother of a small boy of 19 months, admitted in a supplementary
feeding centre, with regard to the food that she gives the child at the household.
Here is the ration that was received at the household:
1 Bowl of rice flour (about 80 g),
2 spoons of spicy sauce including some cassava leaves and beans (about 20 g),
1 glass of camel milk (150 g),
1 fruit, depending on the season.
Question A :
Calculate the energetic value of the ration.
Composition of food for 100 g :
Foods Proteins Fats Sugars
Rice Flour 6.4 g 0.8 g 83.3 g
Beans (red, raw) 22.1 g 1.4 g 41.3 g
Camel Milk 5.1 g 4.1 g 4.7 g
(Present the results in the form of a table).
Question B :
Do you believe this ration is sufficient? (Explain why?).
Question C:
Do you believe this ration is balanced? (Explain why?)
N° 2 Question A :
Calcualte the daily energetic needs of a 45 year old worker, weighing 70 kg and having an
average level of physical activity.
(Explain why?).
Question B :
His daily ration is the following:
- 2 eggs of 60 g,
- 150 g of soft sweet potato,
- 200 g of whole peanuts,
- XXX g of raw brown rice.
Composition of food for 100g:
Foods Proteins Fats Carbohydrates
Eggs (whole, raw) 12.5 g 10.8 g
Sweet Potato 1.2 g 0.3 g 19.9 g
Brown rice, raw. 6.7 g 2.8 g 76.3 g
Whole Peanuts. 25.6 g 46.1 g 11.7 g

MODULE 1 – THE BASICS OF NUTRITION
© ACF – Technical and Research Department – 2007 71
What quantity of brown rice should be consumed to cover the daily energetic needs? To
explain your response, please give the the details of your calculations.
Question C :
Calories from sugars should normally represent 50 to 55% of the total ration?
In your opinion, does the ration answer to the requirements, in terms of proportion of
carbohydrates in the ration
(Present the results in the form of a table).
N° 3
Develop a ration of 1400 Kcal.
The available foods are:
(Composition for 100 g)
Foods Proteins Fats Carbohydrates
Maize (whole grain) 8.5 g 3.8 g 66.2 g
Beans (green, raw) 24.3 g 1.9 g 45.7 g
Oil 100 g
(Present the results in the form of a table).
N° 4
Develop a ration of 850 Kcal that will be distributed in a supplementary feeding centre.
The available foods are:
(Composition for 100 g)
Foods Proteins Fats Carbohydrates
Wheat Soya Blend ou WSB 19.0 g 7.0 g 65.3 g
Oil 100 g
Sugar 100 g
(Present the results in the form of a table).
N° 5
Develop a ration of 1600 Kcal that will be distributed in a supplementary feeding centre.
The available foods are:
(Composition for 100 g)
Foods Proteins Fats Carbohydrates
Corn Soya Blend ou CSB 16.6 g 8.0 g 57.2 g
Oil 100 g
Sugar 100 g
(Present the results in the form of a table).

MODULE 1 – THE BASICS OF NUTRITION
© ACF – Technical and Research Department – 2007 72
N° 6
Develop a ration of 63 Kcal that will be distributed in a supplementary feeding centre.
The available foods are:
(Composition for 100 g)
Foods Proteins Fats Carbohydrates
Mixplus 13.0 g 6.8 g 69.2 g
Biscuit or BP511 14.7 g 17.0 g 60.8 g
Oil 100 g
Sugar 100 g
(Present the results in the form of a table).
Results of the MCQ and Calculations of Rations
Foods:
1: A 5: A 9: D
2: A 6: D 10: B
3: C 7: A, C 11: A
4: B 8: E 12: C, D
Requirements
13: B 14: D 17: A
Results of the Ration Calculations
The results were calculated on NUTCALC, they take into consideration the following
recommendations.
Proteins: 11 - 15% of the total ration,
Fats: 35 - 40 % of the total ration,
Carbohydrates: 50 - 55 % of the total ration,
N° 1
Question A : Calculate the energetic value of the ration.
Foods Quantity Kcal Proteins Fats Carbohydrate
s
Rice Flour 80 g 292.4 5.1 g 0.6 g 66.6 g
Beans 20 g 53.5 4.4 g 0.3 g 8.3 g
Camel Milk 150 g 114.6 7.7 g 6.2 g 7.0 g
Total (g) 250 g 17.2 7.1 81.9
Total (Kcal) 460.5 68.8 63.9 327.6
% 100 14.9 13.9 71.1
Question B : Do you believe this ration is sufficient?
No:
A child of 19 months should normally receive a ration of:
1150 Kcal / day (see. Module 1 / 13).
11 BP5 = 55.5
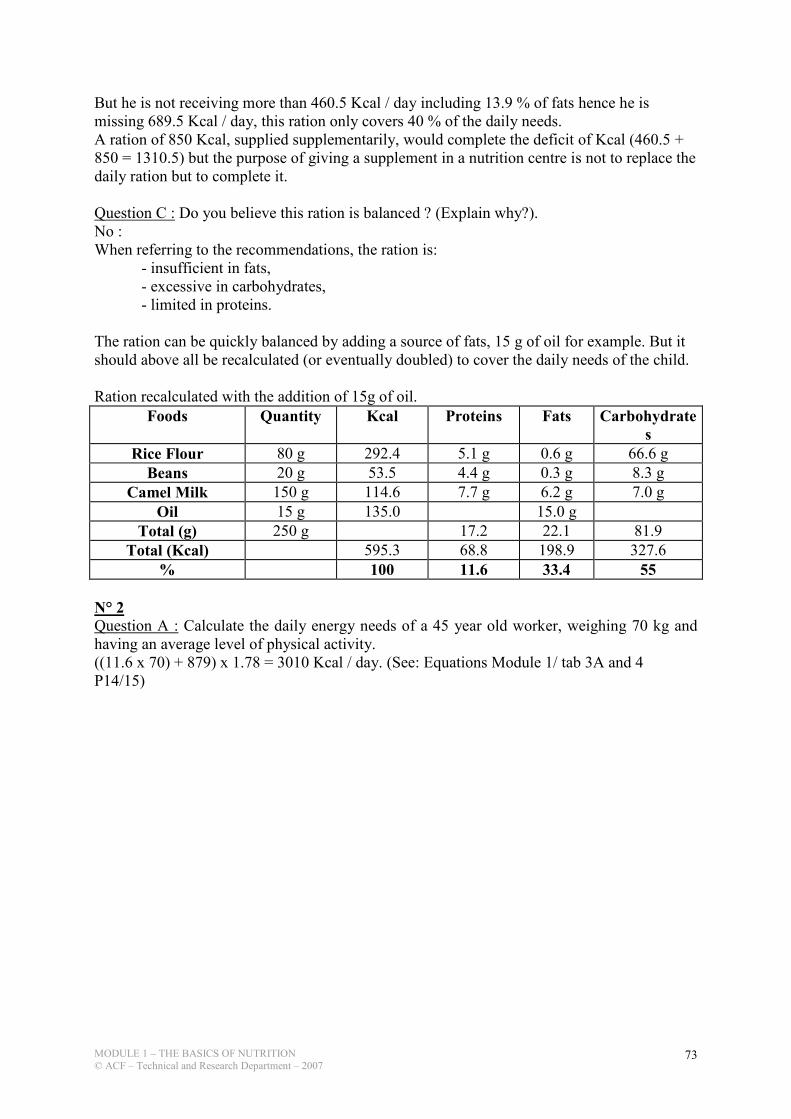
MODULE 1 – THE BASICS OF NUTRITION
© ACF – Technical and Research Department – 2007 73
But he is not receiving more than 460.5 Kcal / day including 13.9 % of fats hence he is
missing 689.5 Kcal / day, this ration only covers 40 % of the daily needs.
A ration of 850 Kcal, supplied supplementarily, would complete the deficit of Kcal (460.5 +
850 = 1310.5) but the purpose of giving a supplement in a nutrition centre is not to replace the
daily ration but to complete it.
Question C : Do you believe this ration is balanced ? (Explain why?).
No :
When referring to the recommendations, the ration is:
- insufficient in fats,
- excessive in carbohydrates,
- limited in proteins.
The ration can be quickly balanced by adding a source of fats, 15 g of oil for example. But it
should above all be recalculated (or eventually doubled) to cover the daily needs of the child.
Ration recalculated with the addition of 15g of oil.
Foods Quantity Kcal Proteins Fats Carbohydrate
s
Rice Flour 80 g 292.4 5.1 g 0.6 g 66.6 g
Beans 20 g 53.5 4.4 g 0.3 g 8.3 g
Camel Milk 150 g 114.6 7.7 g 6.2 g 7.0 g
Oil 15 g 135.0 15.0 g
Total (g) 250 g 17.2 22.1 81.9
Total (Kcal) 595.3 68.8 198.9 327.6
% 100 11.6 33.4 55
N° 2 Question A : Calculate the daily energy needs of a 45 year old worker, weighing 70 kg and
having an average level of physical activity.
((11.6 x 70) + 879) x 1.78 = 3010 Kcal / day. (See: Equations Module 1/ tab 3A and 4
P14/15)

MODULE 1 – THE BASICS OF NUTRITION
© ACF – Technical and Research Department – 2007 74
Question B : What quantity of brown rice should be consumed to cover the daily energy
needs?
Foods Quantit
y
Kcal Proteins Fats Carbohydrates
2 Eggs 120 g 177 15.0 g 13 g
Sweet Potatoes 150 g 131.3 1.8 g 0.5 g 29.9 g
Whole Peanuts 200 g 1128.2 51.2 g 92.2 g 23.4 g
Total 1 (g) 470 g 68.0 105.7 53.3
Total 1 (Kcal) 1436.5 272.0 951.3 213.2
Normally, it should be:
% 100 12.0 38.0 50.0
Total (Kcal) 3010 361.2 1143.8 1505
Total (g) 90.3 127.1 376.3
If taking 450g of brown rice
as an example.
Total - Total 1 (g) 22.3 21.4 323
Brown Rice 450 g 1607.8 30.2 12.6 343.4
What is required:
Total (g) 920 g 98.2 118.3 396.7
Total (Kcal) 3044.3 392.8 1064.7 1586.8
% 100 12.9 35.0 52.1
Question C : In your opinion, does the ration answer to the requirements, in terms of proportion of carbohydrates in the ration? Yes : 450 g de brown rice can provide almost exactly the desired ration? Balanced in proteins,
fats and carbohydrates.
N° 3 Develop a ration of de 1400 Kcal.
Foods Quantity Kcal Protein Fats Carbohydrate
s
Maize 200 g 666.0 17.0 g 7.6 g 132.4 g
Lentils 100 g 297.1 24.3 g 1.9 g 45.7 g
Oil 50 g 450 50.0 g
Total (g) 350 g 41.3 59.5 178.1
Total (Kcal) 1413.1 165.2 535.5 712.4
% 100 11.7 37.9 50.4

MODULE 1 – THE BASICS OF NUTRITION
© ACF – Technical and Research Department – 2007 75
N° 4 Develop a ration of 850 Kcal that will be distributed in a supplementary feeding centre.
Foods Quantity Kcal Protein Fats Carbohydrate
s
WSB 125 g 500.8 23.8 g 8.8 g 81.6 g
Oil 25 g 225 - 25.0 g -
Sugar 30 g 120 - - 30.0 g
Total (g) 180 g 23.8 33.8 111.6
Total (Kcal) 845.8 95.2 304.2 446.4
% 100 11.2 36.0 52.8
N° 5 Develop a ration of 1600 Kcal that will be distributed in a supplementary feeding centre.
Foods Quantity Kcal Protein Fats Carbohydrate
s
CSB 270 g 991.2 44.8 g 21.6 g 154.4 g
Oil 45 G 405 - 45.0 g -
Sugar 50 g 200 - - 50.0
Total (g) 365 g 44.8 66.6 204.4
Total (Kcal) 1596.2 179.2 599.4 817.6
% 100 11.2 37.6 51.2
N° 6 Develop a ration of 630 Kcal that will be distributed in a supplementary feeding centre.
Foods Quantity Kcal Protein Fats Carbohydrate
s
Mixplus 70 g 273.2 9.1 g 4.8 g 48.4 g
Oil 10 g 90 10.0 g
Sugar 5 g 20 5.0 g
BP5 (1 biscuit) 55 g 250.3 8.2 g 9.4 g 33.7 g
Total (g) 140 g 17.3 24.2 87.9
Total (Kcal) 635.4 69.2 217.8 348.4
% 100 10.9 34.3 54.8