Embed Size (px)
Citation preview

1 Proprietary and Confidential 1
Vermont Blueprint Evaluation A Four-Year Overview Based on Two-Year Cohorts with Matched Controls (VHCURES Population, Age 18-64)
Karl Finison, Director of Analytic Services January 18, 2012

Vermont Blueprint Evaluation Agenda • Summary
• Data Sources & Methods
• Trend Highlights – Expenditures
• Trend Highlights – Chronic Conditions Expenditures
• Trend Highlights – Utilization
Vermont Blueprint Evaluation (A Four-Year Overview Based on Two-Year Cohorts with Matched Controls) 2

• Onpoint attributed patients to Blueprint practices using E&M visit coding and a 24-month look-back
• A 2-year cohort methodology was used to compare Burlington and St. Johnsbury pilot participants to matched controls:
– 2007–2008 (Baseline)
– 2008–2009 (Start-up)
– 2009–2010 (Operations)
• Members, ages 18–64, covered by commercial payers (i.e., BCBS Vermont, CIGNA, MVP, The Vermont Health Plan) were used to report selected measures
Summary (1 of 3)
Vermont Blueprint Evaluation (A Four-Year Overview Based on Two-Year Cohorts with Matched Controls) 3

• Preliminary trends suggest that Blueprint is having a positive impact on overall expenditure growth when compared to controls
• Results suggest that the growth curve is slowing or “bending” for a number of important expenditure and utilization measures
• When Blueprint operations were most mature in the pilot communities (2009–2010), the degree of improvement among participants tended to be greater than among controls for most measures
Summary (2 of 3)
Vermont Blueprint Evaluation (A Four-Year Overview Based on Two-Year Cohorts with Matched Controls) 4

• Noted differences between participant and control populations were not likely to be statistically significant due to small sample size and variability
• Detection of impact of specific intervention in small population may be difficult when overarching statewide changes are influencing trends
• Since the commercial population typically is healthier than the Medicaid and Medicare populations, the ability to detect differences, if present, will be enhanced with the inclusion of Medicare and Medicaid data
Summary (3 of 3)
Vermont Blueprint Evaluation (A Four-Year Overview Based on Two-Year Cohorts with Matched Controls) 5

Vermont Blueprint Evaluation Data Sources & Methods Trend Highlights – Expenditures Trend Highlights – Chronic Conditions Expenditures Trend Highlights – Utilization

• Data source — VHCURES, commercial, ages 18–64
• Study design — Matched control based on geographic area, age, gender, health status, baseline expenditures, and occurrence of a chronic disease
• Statewide comparison population — Ages 18–64 covered by BCBS of Vermont, CIGNA, MVP, The Vermont Health Plan
• Selected Measures — Total expenditures, inpatient expenditures and utilization, outpatient expenditures, outpatient ED use, expenditures for members with at least one selected chronic condition
Data Sources & Methods Overview
Vermont Blueprint Evaluation (A Four-Year Overview Based on Two-Year Cohorts with Matched Controls) 7

Data Sources & Methods Study Population
HSA / PRACTICE START-UP DATE St. Johnsbury Corner Medical July 1, 2008 Danville Health Center July 1, 2008 St. Johnsbury Family Health Center July 1, 2008 Caledonia Internal Medicine July 1, 2008 Concord Health Center July 1, 2008 Burlington Aesculapius Medical Center October 1, 2008 Dr. Eugene Moore October 1, 2008
Vermont Blueprint Evaluation (A Four-Year Overview Based on Two-Year Cohorts with Matched Controls) 8

Data Sources & Methods Count of Members Attributed to Blueprint by 2-Year Cohort
POPULATION 2007–2008 (Baseline)
2008–2009 (Start-up)
2009–2010 (Operations)
Burlington Total 4,409 4,453 4,418 At least 1 chronic condition* 1,258 1,466 1,403 St. Johnsbury Total 3,033 3,226 3,653 At least 1 chronic condition* 1,141 1,346 1,513 Combined Total 7,442 7,679 8,071 At least 1 chronic condition* 2,399 2,812 2,916
* Includes Blueprint-targeted conditions: asthma, COPD, congestive heart failure, coronary heart disease, diabetes, depression, and hypertension
Vermont Blueprint Evaluation (A Four-Year Overview Based on Two-Year Cohorts with Matched Controls) 9

Data Sources & Methods 2-Year Cohort Control Matching Results at Baseline (2007)
POPULATION PARTICIPANTS POTENTIAL CONTROLS
MATCHED CONTROLS
Burlington — Total 4,409 32,076 4,409
Older adults (ages 50–64 years) 45% 37% 45%
Male 46% 46% 46%
At least 1 chronic condition 29% 26% 29%
Not healthy (CRGs) 50% 47% 50%
Expenditures >$10,000 10% 8% 10%
St. Johnsbury — Total 3,033 6,016 3,033
Older adults (ages 50–64 years) 48% 43% 49%
Male 42% 45% 42%
At least 1 chronic condition 38% 34% 38%
Not healthy (CRGs) 57% 48% 55%
Expenditures >$10,000 11% 10% 10%
Vermont Blueprint Evaluation (A Four-Year Overview Based on Two-Year Cohorts with Matched Controls) 10
Vermont Blueprint Evaluation Data Sources & Methods Trend Highlights – Expenditures Trend Highlights – Chronic Conditions Expenditures Trend Highlights – Utilization

Expenditure Trends Per Capita Overview (1 of 2)
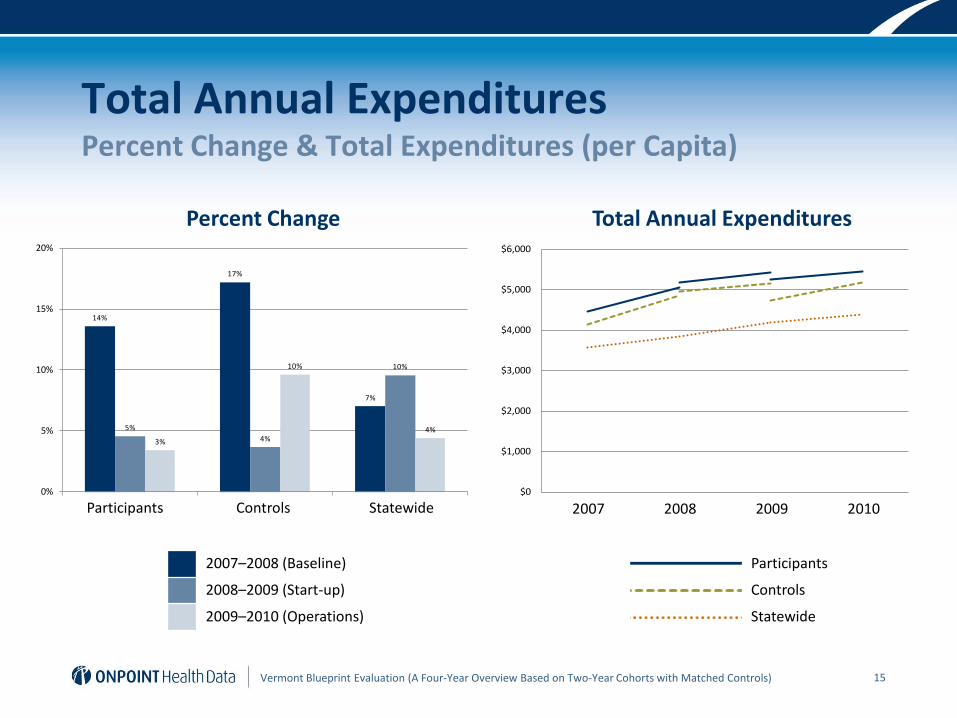
• Total annual expenditures
– Blueprint participants: ↑22% (from $4,458 to $5,444)
– Controls: ↑25% (from $4,136 to $5,186)
– Statewide average: ↑22% (from $3,582 to $4,387)
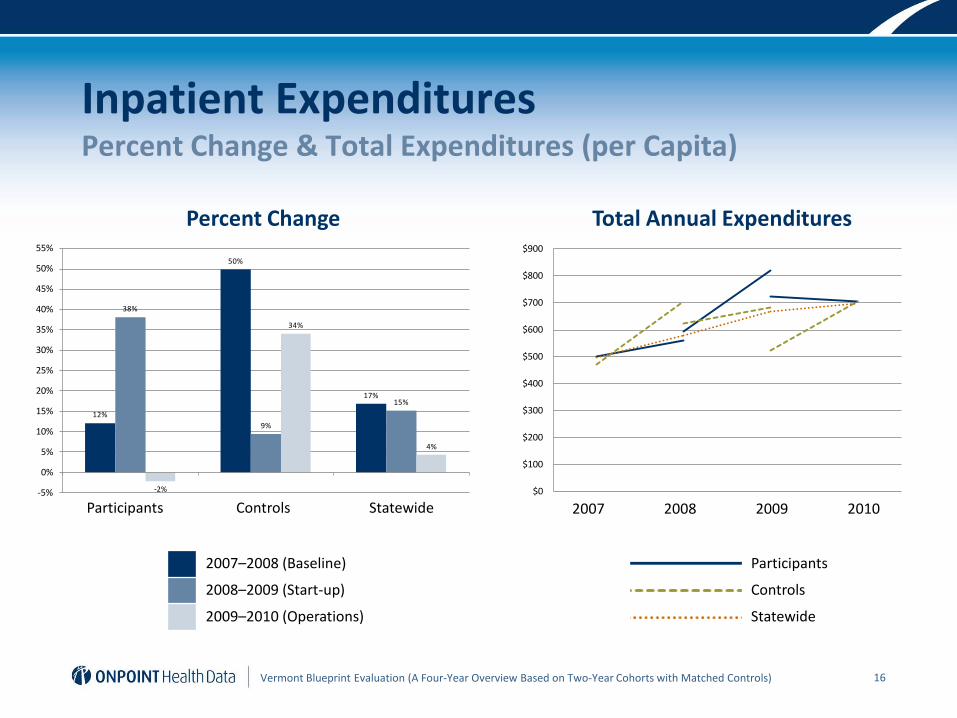
• Inpatient expenditures
– Blueprint participants: ↑41% (from $500 to $707)
– Controls: ↑50% (from $470 to $702)
– Statewide average: ↑40% (from $496 to $696)
Vermont Blueprint Evaluation (A Four-Year Overview Based on Two-Year Cohorts with Matched Controls) 12

Expenditure Trends Per Capita Overview (2 of 2)
• Outpatient hospital expenditures (largest component of cost for both participants and controls)
– Blueprint participants: ↑32% (from $1,524 to $2,016)
– Controls: ↑39% (from $1,395 to $1,944)
– Statewide average: ↑32% (from $1,245 to $1,641)
• Outpatient ED expenditures
– Blueprint participants: ↑50% (from $115 to $172)
– Controls: ↑56% (from $119 to $185)
– Statewide average: ↑41% (from $129 to $181)
Vermont Blueprint Evaluation (A Four-Year Overview Based on Two-Year Cohorts with Matched Controls) 13

POPULATION 2007–2008 (Baseline) 2008–2009 (Start-up) 2009–2010 (Operations)
Total Annual Expenditures
Participants 14% 5% 3%
Controls 17% 4% 10%
Statewide 7% 10% 4%
Inpatient Expenditures
Participants 12% 38% -2%
Controls 50% 9% 34%
Statewide 17% 15% 4%
Outpatient Hospital Expenditures
Participants 21% 3% 3%
Controls 24% -1% 10%
Statewide 11% 11% 7%
Outpatient ED Expenditures
Participants 32% 0% 3%
Controls 30% 6% 3%
Statewide 21% 8% 7%
Vermont Blueprint Evaluation (A Four-Year Overview Based on Two-Year Cohorts with Matched Controls) 14
Expenditure Trends Year-to-Year Change (Percent Change per Capita)
14%
17%
7%
5%4%
10%
3%
10%
4%
0%
5%
10%
15%
20%
Participants Controls Statewide
$0
$1,000
$2,000
$3,000
$4,000
$5,000
$6,000
2007 2008 2009 2010
Total Annual Expenditures Percent Change & Total Expenditures (per Capita)
Percent Change Total Annual Expenditures
Participants Controls Statewide 2007 2008 2009 2010
2007–2008 (Baseline)
2008–2009 (Start-up)
2009–2010 (Operations)
Participants
Controls
Statewide
Vermont Blueprint Evaluation (A Four-Year Overview Based on Two-Year Cohorts with Matched Controls) 15
$0
$100
$200
$300
$400
$500
$600
$700
$800
$900
2007 2008 2009 2010
12%
50%
17%
38%
9%
15%
-2%
34%
4%
-5%
0%
5%
10%
15%
20%
25%
30%
35%
40%
45%
50%
55%
Participants Controls Statewide
Inpatient Expenditures Percent Change & Total Expenditures (per Capita)
Percent Change Total Annual Expenditures
2007 2008 2009 2010
2007–2008 (Baseline)
2008–2009 (Start-up)
2009–2010 (Operations)
Participants
Controls
Statewide
Vermont Blueprint Evaluation (A Four-Year Overview Based on Two-Year Cohorts with Matched Controls) 16
Participants Controls Statewide

$0
$500
$1,000
$1,500
$2,000
$2,500
2007 2008 2009 2010
21%
24%
11%
3%
-1%
11%
3%
10%
7%
-5%
0%
5%
10%
15%
20%
25%
30%
Participants Controls Statewide
Outpatient Hospital Expenditures Percent Change & Total Expenditures (per Capita)
Percent Change Total Annual Expenditures
2007 2008 2009 2010
2007–2008 (Baseline)
2008–2009 (Start-up)
2009–2010 (Operations)
Participants
Controls
Statewide
Vermont Blueprint Evaluation (A Four-Year Overview Based on Two-Year Cohorts with Matched Controls) 17
Participants Controls Statewide

$0
$20
$40
$60
$80
$100
$120
$140
$160
$180
$200
2007 2008 2009 2010
32%
30%
21%
0%
6%
8%
3% 3%
7%
0%
5%
10%
15%
20%
25%
30%
35%
Participants Controls Statewide
Outpatient ED Expenditures Percent Change & Total Expenditures (per Capita)
Percent Change Total Annual Expenditures
2007 2008 2009 2010
2007–2008 (Baseline)
2008–2009 (Start-up)
2009–2010 (Operations)
Participants
Controls
Statewide
Vermont Blueprint Evaluation (A Four-Year Overview Based on Two-Year Cohorts with Matched Controls) 18
Participants Controls Statewide

Vermont Blueprint Evaluation Data Sources & Methods Trend Highlights – Expenditures Trend Highlights – Chronic Conditions Expenditures Trend Highlights – Utilization

Chronic Conditions Expenditure Trends Overview (1 of 2)
Vermont Blueprint Evaluation (A Four-Year Overview Based on Two-Year Cohorts with Matched Controls) 20
CHARACTERISTIC 2007
PARTICIPANTS 2007 PER CAPITA
EXPENDITURE RATE 2007 EXPENDITURE
RATE COMPARISON*
0 Blueprint-selected conditions 5,043 $3,046 1.0
≥1 selected chronic conditions 2,399 $7,315 2.4
2+ selected chronic conditions 671 $10,875 3.6
Individual chronic condition Asthma 338 $8,561 2.8
COPD 76 $9,915 3.3
Congestive heart failure 35 $19,559 6.4
Coronary heart disease 212 $13,419 4.4
Depression 800 $8,240 2.7
Diabetes 419 $9,278 3.0
Hypertension 1,350 $7,396 2.4
* Compared to 2007 per Capita Expenditure Rate for members with no Blueprint-selected chronic condition (i.e., $3,046) (e.g., $7,315 ÷ $3,046 = 2.4)

Chronic Conditions Expenditure Trends Overview (2 of 2)
• Expenditures
– Blueprint participants: ↑21% (from $7,315 to $8,851)
– Controls: ↑29% (from $6,735 to $8,706)
– Statewide average: ↑26% (from $7,294 to $9,198)
Vermont Blueprint Evaluation (A Four-Year Overview Based on Two-Year Cohorts with Matched Controls) 21

Vermont Blueprint Evaluation Data Sources & Methods Trend Highlights – Expenditures Trend Highlights – Chronic Conditions Expenditures Trend Highlights – Utilization

Utilization Trends Overview (per 1,000 Members)
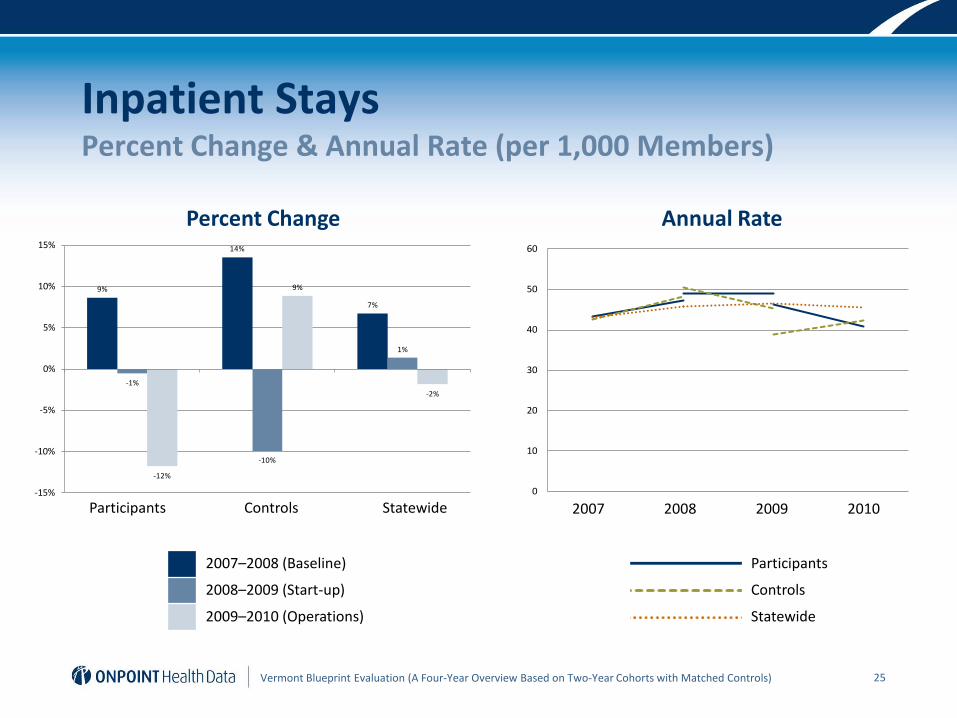
• Inpatient stays
– Blueprint participants: ↓6% (from 43.4 visits to 40.8)
– Controls: ↓<1% (from 42.5 visits to 42.3)
– Statewide average: ↑6% (from 42.9 visits to 45.6)
• Outpatient ED visits
– Blueprint participants: ↓<1% (from 161.8 visits to 160.7)
– Controls: ↑10% (from 154.9 visits to 170.9)
– Statewide average: ↑2% (from 175.6 visits to 178.8)
Vermont Blueprint Evaluation (A Four-Year Overview Based on Two-Year Cohorts with Matched Controls) 23

POPULATION 2007–2008 (Baseline) 2008–2009 (Start-up) 2009–2010 (Operations)
Inpatient Stays
Participants 9% -1% -12%
Controls 14% -10% 9%
Statewide 7% 1% -2%
Outpatient ED Visits
Participants 15% -11% -9%
Controls 9% -5% -5%
Statewide 5% -2% -1%
Vermont Blueprint Evaluation (A Four-Year Overview Based on Two-Year Cohorts with Matched Controls) 24
Utilization Trends Year-to-Year Change (Percent Change per 1,000 Members)
0
10
20
30
40
50
60
2007 2008 2009 2010
9%
14%
7%
-1%
-10%
1%
-12%
9%
-2%
-15%
-10%
-5%
0%
5%
10%
15%
Participants Controls Statewide
Inpatient Stays Percent Change & Annual Rate (per 1,000 Members)
Percent Change Annual Rate
2007 2008 2009 2010
2007–2008 (Baseline)
2008–2009 (Start-up)
2009–2010 (Operations)
Participants
Controls
Statewide
Participants Controls Statewide
Vermont Blueprint Evaluation (A Four-Year Overview Based on Two-Year Cohorts with Matched Controls) 25

0
50
100
150
200
250
2007 2008 2009 2010
15%
9%
5%
-11%
-5%
-2%
-9%
-5%
-1%
-15%
-10%
-5%
0%
5%
10%
15%
20%
Participants Controls Statewide
Outpatient ED Visits Percent Change & Annual Rate (per 1,000 Members)
Percent Change Annual Rate
Participants Controls Statewide 2007 2008 2009 2010
2007–2008 (Baseline)
2008–2009 (Start-up)
2009–2010 (Operations)
Participants
Controls
Statewide
Vermont Blueprint Evaluation (A Four-Year Overview Based on Two-Year Cohorts with Matched Controls) 26

Presentation Title Proprietary and Confidential 27


![State of Vermont blueprintforhealth.vermont · Vermont Blueprint for Health [Phone] 802-241-0231 NOB 1 South, 280 State Dr. [Fax] 802-241-0269 Waterbury VT 05671-1010 blueprintforhealth.vermont.gov](https://img.dokumen.tips/doc/110x75/5ec654ec0568cd01557f6753/state-of-vermont-vermont-blueprint-for-health-phone-802-241-0231-nob-1-south.jpg)


![Combined Meeting of The Blueprint Executive Committee and Blueprint … BPEC... · 18-01-2017 · Vermont Blueprint for Health [Phone] 802-241-0231 NOB 1 South, 280 State Drive [Fax]](https://img.dokumen.tips/doc/110x75/5f10a05d7e708231d44a0866/combined-meeting-of-the-blueprint-executive-committee-and-blueprint-bpec-18-01-2017.jpg)
![Combined Meeting of The Blueprint Executive Committee and ......Vermont Blueprint for Health [Phone] 802-879-5988 312 Hurricane Lane, Suite 201 [Fax] 802-879-5651 Williston VT 05495-2807](https://img.dokumen.tips/doc/110x75/600e0d56ef0e787d9e3c311b/combined-meeting-of-the-blueprint-executive-committee-and-vermont-blueprint.jpg)