Embed Size (px)
DESCRIPTION
Verifications of Transient Grounding Impedance Measurements of a Wind Turbine Generator System Using the FDTD method
Citation preview

Verifications of Transient Grounding Impedance Measurements of a Wind Turbine Generator System
Using the FDTD method
K. Yamamoto Dept. of Electrical Engineering
Kobe City College of Technology Kobe Hyogo, Japan
S. Yanagawa Shoden Co.
Chiba Chiba, Japan [email protected]
T. Ueda Chubu Electric Power Co.
Nagoya Aichi, Japan [email protected]
Abstract— Most of the breakdowns and malfunctions of the electrical and control systems inside or in the vicinity of a wind turbine due to lightning are caused by a rise in ground potential. To solve those problems, the field tests have been carried out, and the transient characteristics of an actual wind turbine grounding system have been obvious. This paper describes the verifications of field tests of wind turbine grounding characteristics by using the Finite Difference Time Domain method.
Keywords-component; lightning; potential rises; grounding; wind turbine generator system; FDTD method.
I. INTRODUCTION
In recent years, accidents associated with the use of a large number of wind turbine generator systems have increased in number. Those accidents are caused by natural phenomena such as lightning and typhoons. Lightning especially causes extensive and serious damages.
In order to exploit high wind conditions, wind turbine generator systems are often constructed on hilly terrains or along the seashore, where few tall structures exist in their vicinity; therefore, these structures are often struck by lightning. In order to promote wind power generation, lightning protection methodologies for wind turbine generator systems should be established [1]-[3].
Damage caused to wind turbine generator systems due to lightning affects the safety and reliability of these systems [4], [5]. Most of the breakdowns and malfunctions of the electrical and control systems inside and in the vicinity of a wind turbine are caused by ground potential rise due to lightning [6], [7]. Impulse tests have been conducted at the coastal wind farm, and the rise in ground potential around the foundations was measured [8], [9].
Fields tests have been carried out on an actual wind turbine generator system at a coastal area. The ground potential rise of the system itself and around its foundations has been measured to understand its characteristic [9]. This paper describes the verifications of field tests of the wind turbine grounding
characteristics by using the FDTD (Finite Difference Time Domain) method [10].
II. GROUNDING SYSTEM
Fig. 1 shows the grounding system of the wind turbine generator system; it consists of the foundation of the wind turbine, grounding meshes, foundation feet and the grounding system of a neighbor substation. A quadrangle and octagon usually exist as shapes of the top surface of the wind turbine foundation; it used in this measurement is an octagonal-type foundation. The wind turbine was under construction in the
4 m
3.2 m
16.5 m
grounding mesh
0 m
1 m 3 m 5 m 7 m 9 m
2 m 4 m 6 m 8 m 10 m
12 m
7 m
foundation foot:10 m
substation facility
substation facility
2.8 m
grounding mesh
Top view
Side view
Bottom view
Figure 1. Grounding system of the wind turbine generator system.
2011 International Symposium on Lightning Protection (XI SIPDA), Fortaleza, Brazil, October 3-7, 2011.
308

field tests, the upper parts of the wind turbine such as a tower and blades did not exist. The underground parts of the grounding system including the foundation had been built.
For some wind turbines, the lightning current is actively led to the grounding mesh covering the foundation from the tower, not to the foundation itself. However, the foundation is not explicitly isolated from the tower; these are connected through the anchor. When the grounding characteristics of a wind turbine generator system are researched, a grounding system including the foundation, the grounding meshes, the foundation feet and the substation grounding system should be considered. Incidentally, the grounding system was not connected to any surrounding wind turbines.
As shown in Fig. 1, the foundation is octagonal type with the width of 16.5 m. The foundation was constructed with reinforced concrete; the intervals between reinforcing were about 30 cm. The tower bottom was connected to the foundation and the anchor at ground level. The depth of the anchor and the foundation was 2.8 m and 3.2 m respectively. The length, diameter and number of the foundation feet were 10 m, 1 m and 17 respectively to enhance the bearing capacity of soil. The foundation feet were made of steel. The cross section of the wires for the grounding meshes was 60 mm2; it is connected to the anchor and the foundation feet. The details of the grounding mesh covering the foundation are shown in Fig. 1.
The stratiform ground resistivity at the site of the wind turbine generator system is shown in Fig. 2. The test place is a low resistivity site, and is a few hundred meter away from the coast. The Wenner method was utilized to measure the resistivity. The steady-state grounding resistance of the grounding system of the wind turbine generator system was 0.21 Ω.
III. EXPERIMENTAL CONDITIONS
Fig. 3 shows the experimental setup. The current was led to the foundation from the impulse generator with insulated copper wire (length: 90 m; cross section: 5.5 mm2) as the current lead wire. The height of the current lead wire was about
Figure 2. Stratiform ground resistivity at the site of field tests.
1 m. The fast front current generated by the impulse generator was injected into the foundation through a resistance of 500 Ω from a current lead wire. The peak value of the current was 60 A, and the wavefront was about 0.2 μs. Such current is expressive of the lightning current with the conceivable steep wavefront. When the frequency characteristics of the grounding impedance are calculated, such potential responses of the current including wide-frequency components become important [8].
The comparatively large resistance of 500 Ω was connected in series with the impulse generator; the power source could therefore be considered as a current source. The resistance also worked as a matching impedance to reduce the current reflections on the current lead wire. The impulse generator was grounded by several grounding rods (length: 1.5 m; diameter: 20 mm); the steady-state grounding resistance was 8.5 Ω.
The injected current was measured at the end of the current lead wire near the foundation with a current probe, as shown in Fig. 3. The potential rise of the foundation was measured as the voltage difference between the top of the foundation and the voltage measurement wire (length: 68 m; cross-section: 2 mm2). The ground terminal of the passive probe was connected to the top of the foundation so that the case of the oscilloscope can be same potential at the measuring point. The height of the voltage measurement wire was 1 m, and it was grounded at the remote end through a matching impedance of 300 Ω. The surge impedance of the voltage measuring wire was about 400 Ω; therefore, the 300 Ω resistance was connected between the remote end of the voltage measuring wire and a grounding rod (length: 0.5 m, diameter: 20 mm, grounding resistance: 81 Ω). This was how the noise induced on the voltage measuring wire was discharged to the ground readily. The potential rises around the wind turbine generator system were measured as the voltage between the voltage measurement wire and the conductive rods at intervals of 1 m around the foundation, and 2 – 4 m (over 10 m from the edge of the foundation, as shown in Fig. 1) for further distance. The potential rises were measured at 21 locations. The bottom of the conductive rod (length: 0.3 m; diameter: 10 mm) was buried about a 0.1 m depth at each measured point to measure the potential rises, the
substation facility
VI
current lead wire90 m
18 m voltage measuring wire
V I
IV cable
anchor
500
50 m I.G.
300
Figure 3. Experimental setup.
309
ground terminal of the passive probe was connected to conductive rod so that the case of the oscilloscope can be same potential at the measuring point. As shown in Fig. 3, the current lead wire and voltage measurement wire were not orthogonalized around the wind turbine. Mutual electromagnetic induction between the current lead and voltage measuring wires may have existed.
The details of the measuring instruments are shown in Ref. [9]. Those instruments are enough to measure the potential responses of the injected current with a rise time of several hundred nanoseconds.
IV. ANALYTICAL CONDITIONS
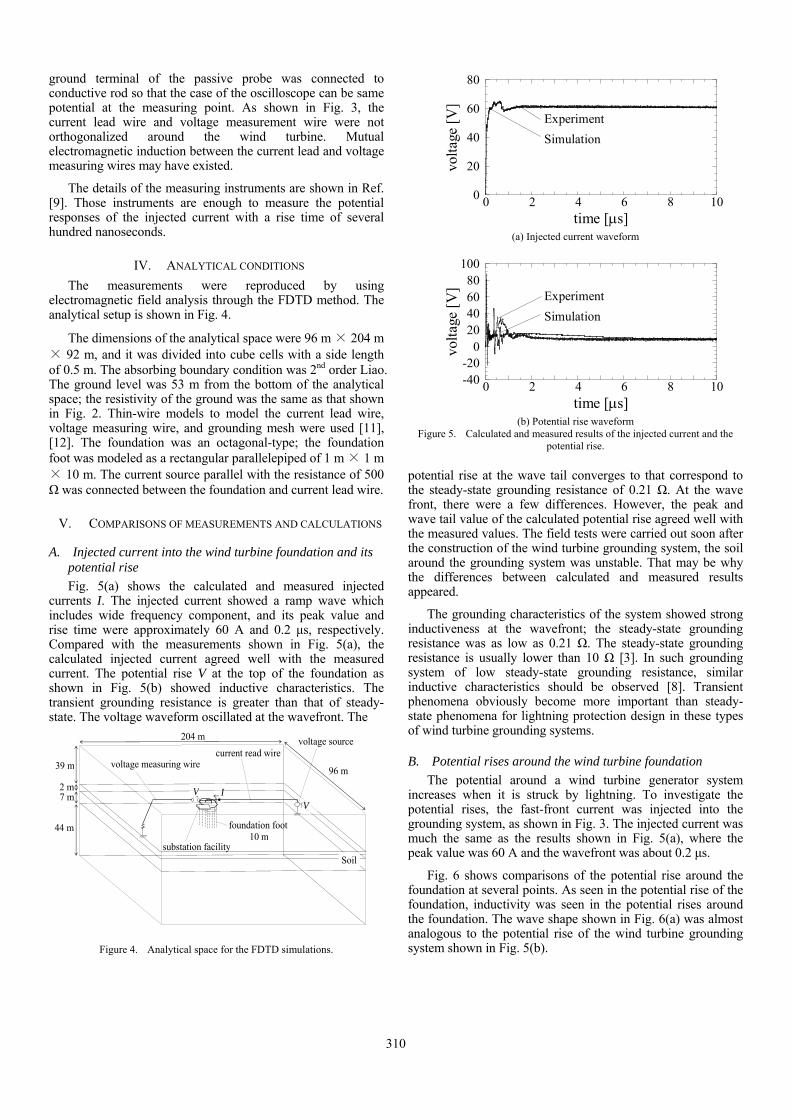
The measurements were reproduced by using electromagnetic field analysis through the FDTD method. The analytical setup is shown in Fig. 4.
The dimensions of the analytical space were 96 m × 204 m × 92 m, and it was divided into cube cells with a side length of 0.5 m. The absorbing boundary condition was 2nd order Liao. The ground level was 53 m from the bottom of the analytical space; the resistivity of the ground was the same as that shown in Fig. 2. Thin-wire models to model the current lead wire, voltage measuring wire, and grounding mesh were used [11], [12]. The foundation was an octagonal-type; the foundation foot was modeled as a rectangular parallelepiped of 1 m × 1 m × 10 m. The current source parallel with the resistance of 500 Ω was connected between the foundation and current lead wire.
V. COMPARISONS OF MEASUREMENTS AND CALCULATIONS
A. Injected current into the wind turbine foundation and its potential rise
Fig. 5(a) shows the calculated and measured injected currents I. The injected current showed a ramp wave which includes wide frequency component, and its peak value and rise time were approximately 60 A and 0.2 μs, respectively. Compared with the measurements shown in Fig. 5(a), the calculated injected current agreed well with the measured current. The potential rise V at the top of the foundation as shown in Fig. 5(b) showed inductive characteristics. The transient grounding resistance is greater than that of steady-state. The voltage waveform oscillated at the wavefront. The
39 m
204 m
voltage measuring wire 96 m
I
current read wire
foundation foot 10 m
44 m
7 m 2 m
substation facility Soil
V V
voltage source
Figure 4. Analytical space for the FDTD simulations.
0
20
40
60
80
0 2 4 6 8 10
volt
age
[V]
time [s]
Experiment
Simulation
(a) Injected current waveform
-40-20
020406080
100
0 2 4 6 8 10
volt
age
[V]
time [s]
Experiment
Simulation
(b) Potential rise waveform
Figure 5. Calculated and measured results of the injected current and the potential rise.
potential rise at the wave tail converges to that correspond to the steady-state grounding resistance of 0.21 Ω. At the wave front, there were a few differences. However, the peak and wave tail value of the calculated potential rise agreed well with the measured values. The field tests were carried out soon after the construction of the wind turbine grounding system, the soil around the grounding system was unstable. That may be why the differences between calculated and measured results appeared.
The grounding characteristics of the system showed strong inductiveness at the wavefront; the steady-state grounding resistance was as low as 0.21 Ω. The steady-state grounding resistance is usually lower than 10 Ω [3]. In such grounding system of low steady-state grounding resistance, similar inductive characteristics should be observed [8]. Transient phenomena obviously become more important than steady-state phenomena for lightning protection design in these types of wind turbine grounding systems.
B. Potential rises around the wind turbine foundation
The potential around a wind turbine generator system increases when it is struck by lightning. To investigate the potential rises, the fast-front current was injected into the grounding system, as shown in Fig. 3. The injected current was much the same as the results shown in Fig. 5(a), where the peak value was 60 A and the wavefront was about 0.2 μs.
Fig. 6 shows comparisons of the potential rise around the foundation at several points. As seen in the potential rise of the foundation, inductivity was seen in the potential rises around the foundation. The wave shape shown in Fig. 6(a) was almost analogous to the potential rise of the wind turbine grounding system shown in Fig. 5(b).
310

-40-20
020406080
100
0 2 4 6 8 10
volt
age
[V]
time [s]
Experiment
Simulation
(a) Result at the edge of the foundation
(The distance from the foundation is 0 m)
-40-20
020406080
100
0 2 4 6 8 10
volt
age
[V]
time [s]
Experiment
Simulation
(b) Result at 2 m from the foundation
-40-20
020406080
100
0 2 4 6 8 10
volt
age
[V]
time [s]
Experiment
Simulation
(c) Result at 4 m from the foundation
-40-20
020406080
100
0 2 4 6 8 10
volta
ge [
V]
time [s]
Experiment
Simulation
(d) Result at 6 m from the foundation
-40-20
020406080
100
0 2 4 6 8 10
volta
ge [
V]
time [s]
Experiment
Simulation
(e) Result at 8 m from the foundation
-40-20
020406080
100
0 2 4 6 8 10
volt
age
[V]
time [s]
Experiment
Simulation
(f) Result at 10 m from the foundation
-40-20
020406080
100
0 2 4 6 8 10
volta
ge [
V]
time [s]
Experiment
Simulation
(g) Result at 20 m from the foundation
-40-20
020406080
100
0 2 4 6 8 10
volt
age
[V]
time [s]
Experiment
Simulation
(h) Result at 30 m from the foundation
Figure 6. Potential rises around the foundation.
Fig. 7 shows the comparisons of the calculated and measured values of the grounding potential rise around the foundation. The calculated results agreed well with the measured results, as shown in Fig. 7. However, the values at several points had small differences. The straiform ground resistivity measured by Wenner method as shown in Fig. 2 may not agree with the actual stratiform ground resistivity completely. It is an approximate result, and might influence the above mentioned differences.
If the skin effect of the ground is not considered, the shape of the grounding system is assumed to be a semi-sphere and the grounding impedance is assumed to be a pure resistance, the potential rises around the foundation shown in Fig. 7 are found to be inversely proportional to the distance from the foundations. Big differences existed in comparison with the inversely proportional waveform in Fig. 7(a) because the measured and calculated results in Fig. 7(a) shows transient behavior.
On another front, the value of the steady-state grounding potential rises around the foundation in Fig. 7(b) is almost
311

0
10
20
30
40
50
60
70
80
0 5 10 15 20 25 30 35 40
ExperimentSimulation
volta
ge [
V]
distance [m] (a) Relation between the peak values of transient potential rises and the
distance from the foundation
0
2
4
6
8
10
0 5 10 15 20 25 30 35 40
ExperimentSimulation
volt
age
[V]
distance [m] (b) Relation between the steady-state values of potential rises and the distance
from the foundation Figure 7. Potential rises around the foundation.
inversely proportional to the distance from the foundation except for the vicinity of the foundation. The potential rises in the vicinity of the foundation are affected by that of the substation facility.
VI. POTENTIAL RISE ON THE COMPLETE WIND TURBINE
In this chapter, the potential rise on the complete wind turbine was simulated using the FDTD method. The analytical setup is shown in Fig. 8.
The dimensions of the analytical space were 96 m × 204 m × 204 m. The length of each blade modeled as a thin wire was 40 m. The nacelle is modeled as a rectangular parallelepiped conductor with the dimensions of 10 m × 5 m × 5 m. A lightning-channel is also modeled as a thin wire.
The current source parallel with the resistance of 500 Ω was connected between the top of the blade and the lightning-channel model. The surge impedance of the thin wire model for
I
151 m
204 m
voltage measuring wire
96 m current read wire
foundation foot 10 m
44 m
7 m2 m
substation facility Soil
V
current source
80 m
40 m
500 Ω
Figure 8. Analytical space for the FDTD simulations.
0
0.2
0.4
0.6
0.8
1
1.2
0 5 10 15 20
curr
ent [
A]
time [s] (a) Injected current waveform
0
0.5
1
1.5
0 5 10 15 20
volt
age
[V]
time [s] (b) Potential rise waveform
Figure 9. Calculated results in case of the complete wind turbine generator system.
lightning-channel is about 500 Ω; therefore, the 500 Ω resistance was connected in parallel with the current source. The total impedance is almost equal to 1 k which is the surge impedance of the lightning-channel [13].
The injected current is shown in Fig. 9(a). The wave front is about 5.5 s [14]. The potential rise of the foundation is shown in Fig. 9(b). In this way, the potential rise responses for all kinds of lightning currents can be simulated using the FDTD method, once the measurements are verified using the FDTD method.
312

VII. CONCLUSIONS
This paper has presented the results of experimental and
analytical studies investigating the grounding characteristics of an actual wind turbine generator system and the potential rises around it.
The calculated injected current agreed well with the measured current.
There were a few differences on the potential rise of the wind turbine grounding system. However, the peak and wave tail value of the calculated potential rise agreed well with the measured values.
The grounding characteristics of the system showed strong inductiveness at the wavefront; the steady-state grounding resistance was as low as 0.21 Ω. The steady-state grounding resistance is usually lower than 10 Ω. In such low resistivity sites, similar inductive characteristics should be observed.
As seen in the potential rise of the foundation, inductivity was seen in the potential rises around the foundation. The wave shape of the potential rises around the foundation was almost analogous to that of the wind turbine grounding system.
The calculated results of the potential rises around foundation agreed well with the measured results. However, the values at several points had small differences. The straiform ground resistivity measured by Wenner method may not agree with the actual stratiform ground resistivity completely.
The peak values of transient potential rises were not in inverse proportion to the distance from the foundation because the results showed surge behavior.
The value of the steady-state grounding potential rises was almost in inverse proportion to the distance from the foundation except for the vicinity of the foundation. The potential rises in the vicinity of the foundation are affected by that of the substation facility.
The potential rise calculation with the complete wind turbine model had been done for the lightning current with a typical rise time of 5.5 s. In this way, after verifying the measurements using the FDTD method, potential responses for all kinds of lightning currents can be calculated.
To solve the mechanism of generation of the potential rise in the multifarious ground system, impulse tests and FDTD simulations at many kinds of wind turbine sites should continue in cooperation with owners of wind turbines.
REFERENCES [1] I. Cotton, B. Mcniff, T. Soerenson, W. Zischank, P. Christiansen, M.
Hoppe-Kilpper, S. Ramakers, P. Pettersson and E. Muljadi, “Lightning Protection for Wind Turbines,” in Proc. 25th International Conference on Lightning Protection, pp. 848–853, Rhodes, Greece (2000)
[2] T. S. Sorensen, et al., "The Update of IEC 61400-24 Lightning Protection of Wind Turbines," in Proc. 29th International Conference on Lightning Protection, No. 10-13, Uppsala, Sweden (2008)
[3] IEC 61400-24, Wind Turbine Generator Systems-Part 24: Lightning protection (2010)
[4] NEDO, “Wind Turbine Failures and Troubles Investigating Committee Annual Report,” (2006) (in Japanese)
[5] NEDO, “Wind Turbine Failures and Troubles Investigating Committee Annual Report,” (2007) (in Japanese)
[6] K. Yamamoto, T. Noda, S. Yokoyama and A. Ametani, “An experimental study of lightning overvoltages in wind turbine generation systems using a reduced-size model,” Electrical Engineering in Japan, Volume 158, Issue 4, pp. 22-30 (2007)
[7] K. Yamamoto, T. Noda, S. Yokoyama and A. Ametani, “Experimental and Analytical Studies of Lightning Overvoltages in Wind Turbine Generation Systems,” International Conference on Power System Transients (IPST), Lyon, France (2007)
[8] K. Yamamoto, S. Yanagawa, K. Yamabuki, S. Sekioka and S. Yokoyama, " Analytical Surveys of Transient and Frequency Dependent Grounding Characteristics of a Wind Turbine Generator System on the Basis of Field Tests," IEEE Trans. Power Delivery, vol. 25, pp. 3035-3043 (2010)
[9] K. Yamamoto, S. Yanagawa and T. Ueda, "Field Tests of Grounding at an Actual Wind Turbine Generator System," in Proc. 30th International Conference on Lightning Protection, Cagliari, Italy (2010)
[10] K. S. Yee, J. S. Chen, and A. H. Chang, “Conformal finite-difference time-domain (FDTD) with overlapping grids,” IEEE Trans. Antennas Propag., vol. 40, pp. 1068-1075 (1992)
[11] M. Tsumura, Y. Baba, N. Nagaoka and A. Ametani, “FDTD simulation of a horizontal grounding electrode and modeling of its equivalent circuit,” IEEE Trans. Electromagnetic Compatibility, vol. 48, no. 4, pp. 817–825 (2006)
[12] T. Noda and S. Yokoyama, “Thin wire representation in finite difference time domain surge simulation,” IEEE Trans. Power Delivery, vol. 17, pp. 840–847 (2002)
[13] “Lightning Parameters for Insulation and Protection Designs of Power System,” IEEJ Technical Report. no. 1033 (2005) (in Japanese)
[14] H. D. Betz and U. Schumann, “Lightning: Principles, Instruments and Applications,” Springer (2009)
313