Embed Size (px)
Citation preview


VERIFICATION TEST PLAN FOR
INDUCTION MIXERS MANUFACTURED BY THE U.S. FILTER/STRANCO
FOR IDGH RATE DISINFECTION OF WET WEATHER FLOWS
Submitted to
NSF INTERNATIONAL
789 Dixboro Road
Ann Arbor, MI 48105
United States Environmental Protection Agency
Environmental Technology Verification Program
Wet Weather Flow Technologies Pilot
October 2000
ALDEN RESEARCH LABORATORY, INC.
30 Shrewsbury Street
Holden, MA 01520
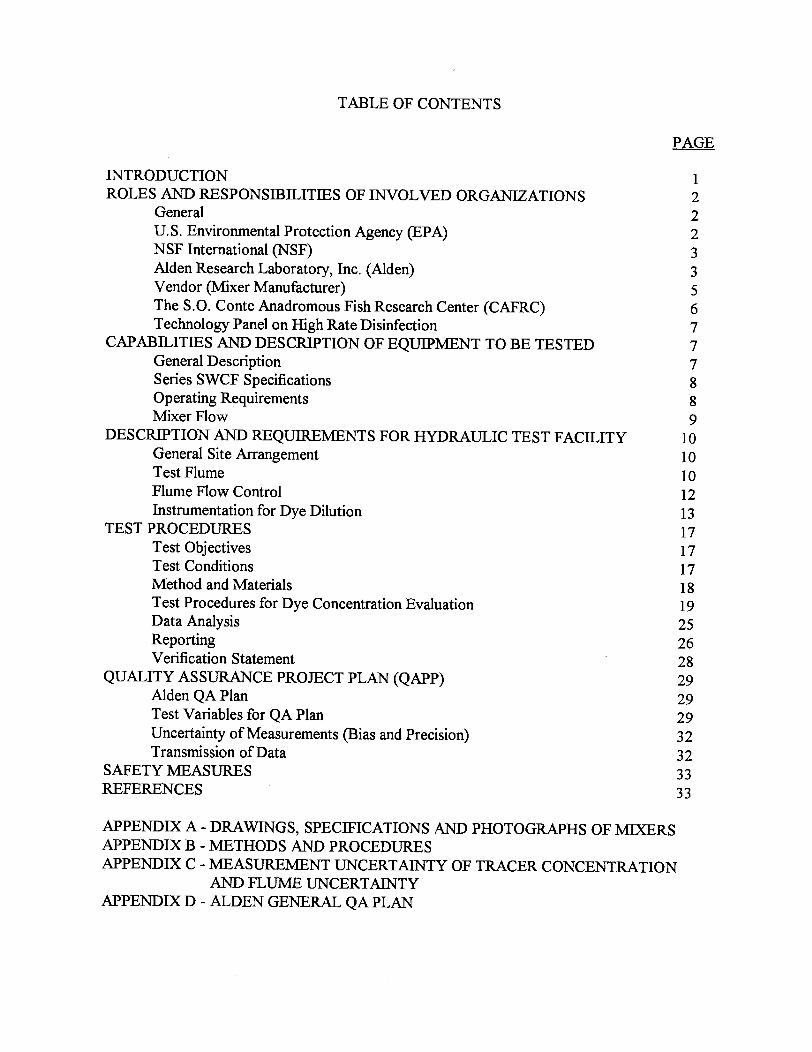
TABLE OF CONTENTS
PAGE
INTRODUCTION 1 ROLES AND RESPONSIDILITIES OF INVOLVED ORGANIZATIONS 2
General 2 U.S. Environmental Protection Agency (EPA) 2 NSF International (NSF) 3 Alden Research Laboratory, Inc. (Alden) 3 Vendor (Mixer Manufacturer) 5 The S.O. Conte Anadromous Fish Research Center (CAFRC) 6 Technology Panel on High Rate Disinfection 7
CAP ABILITIES AND DESCRIPTION OF EQUIPMENT TO BE TESTED 7 General Description 7 Series SWCF Specifications 8 Operating Requirements 8 MixerFlow 9
DESCRIPTION AND REQUIREMENTS FOR HYDRAULIC TEST FACILITY 10 General Site Arrangement 10 Test Flume 10 Flume Flow Control 12 Instrumentation for Dye Dilution 13
TEST PROCEDURES 17 Test Objectives 17 Test Conditions 17 Method and Materials 18 Test Procedures for Dye Concentration Evaluation 19 Data Analysis 25 Reporting 26 Verification Statement 28
QUALITY ASSURANCE PROJECT PLAN (QAPP) 29 Alden QA Plan 29 Test Variables for QAPlan 29 Uncertainty of Measurements (Bias and Precision) 32 Transmission ofData 32
SAFETY MEASURES 33 REFERENCES 33
APPENDIX A- ORA WINGS, SPECIFICATIONS AND PHOTOGRAPHS OF MIXERS APPENDIX B -METHODS AND PROCEDURES APPENDIX C- MEASUREMENT UNCERTAINTY OF TRACER CONCENTRATION
AND FLUME UNCERTAINTY APPENDIX D- ALDEN GENERAL QA PLAN

VERIFICATION TEST PLAN FOR
INDUCTION MIXERS MANUFACTURED BY U.S. FILTERJSTRANCO
FOR HIGH RATE DISINFECTION OF WET WEATHER FLOWS
1. INTRODUCTION
The Environmental Technology Verification {ETV) program of the United States Environmental
Protection Agency (EPA) was established to promote the marketplace acceptance of commercial
ready environmental technologies. The purpose is to provide credible third-party performance
assessments of environmental technologies so that users, developers, regulators, and consultants can
make informed decisions about such technologies. The ETV is not an approval process, but rather
provides a quantitative assessment of technology performance as determined in accordance with this
verification test plan.
The Wet Weather Technologies Pilot was established to verify commercially available technologies
used in the control and abatement of urban storm water runoff, combined sewer overflows (CSO) and
sanitary sewer overflows (SSO). Experience has shown that the long disinfection contact time
required for conventional wastewater treatment is not appropriate for the disinfection of CSO due
to the infrequent peak flow rates that would require large tankage. However, disinfection of CSO
can be achieved with less contact time be providing an increased disinfection dosage and intense
mixing.
This Verification Test Plan (VTP) applies to the U.S. Filter/Stranco Series SWCF chemical induction
mixer, manufactured by U.S. Filter/Stranco, which are suitable for submerged service in wet weather
flows such as CSOs and SSOs. This VTP was developed in accordance with Draft 3.4 of the
"Generic Verification Protocol for Induction Mixers Used for High Rate Disinfection of Wet
Weather Flows," as prepared by the Wet Weather Flow Technologies Pilot of the U.S. EPA's ETV
Program. This VTP describes, in detail, the procedures to be followed by the Field Testing
Organization, Alden Research Laboratory, Inc. (Alden), in conducting the verification testing at the
S.O. Conte Anadromous Fish Research Center.

2. ROLES AND RESPONSffiiLITIES OF INVOLVED ORGANIZATIONS
2.1 General
The Wet Weather Flow Technologies ETV Pilot is administered through a cooperative agreement
between EPA, the National Risk Management Research Lab, and NSF International (NSF).
A Stakeholder Advisory Group (SAG) was formed to assist NSF and EPA in establishing priorities
for the verification of wet weather technologies. The SAG consists of technology vendors, state and
federal regulatory and permitting officials, technology users (POTW sand other municipal government
staff), and technology enablers (e.g., consulting firms and universities) with an interest in the
assessment and abatement of the impacts of wet weather flows.
A Technology Panel on High Rate Disinfection was established to guide the development of
protocols for the verification of high rate disinfection technologies, including induction mixers. The
ETV Technology Panel will serve as a technical and professional resource during all phases of the
verification of a mixer, including the review of Test Plans and Verification Reports, as requested by
NSF and EPA.
Upon completion of Draft 3.4 of the Generic Verification Protocol for Induction Mixers used for
High Rate Disinfection ofWet Weather Flows, NSF selected Alden as the Field Testing Organization
to conduct the testing of induction mixers. U.S. Filter/Stranco is one of two mixer manufacturers to
apply for verification.
2.2 U.S. Environmental Protection Agency (EPA)
The U.S. EPA's National Risk Management Research Laboratory provides administrative, technical
and quality assurance guidance and oversight on all WWF pilot activities. EPA personnel are
responsible for the following:
-2-

• review and approval of this Verification Test Plan
• review and approval of the Verification Report
• review and approval ofthe Verification Statement, and
• posting of the Verification Report and Statement on the EPA website.
2.3 NSF International (NSF)
NSF is the U.S. EPA's verification partner on the Wet Weather Flow Technologies Pilot. In the
context of this Verification Test Plan, NSF has selected a qualified Testing Organization, the Alden
Research Laboratory, Inc. (Alden) to develop and implement the Verification Test Plan. In addition,
NSF has the following responsibilities:
• review and approval of the Verification Test Plan
• oversight of Quality Assurance, including the performance of technical system and data
quality audits, as described in the Quality Management Plan for the Wet Weather Flow
Technologies ETV Pilot
• coordination of Verification Report peer reviews, including review by the Stakeholder
Advisory Group and Technology Panel, as deemed necessary
• approval of Verification Report, and
• preparation and dissemination of Verification Statement
2.4 Alden Research Laboratory, Inc. (Alden)
The Field Testing Organization (FTO) is the Alden Research Laboratory, Inc. (Alden). Alden has
prior experience in testing high-rate induction mixers and also has extensive experience with pilot
testing and experimental design. Alden was founded in 1894 as part of Worcester Polytechnic
Institute (WPI) and became a separate organization in 1986. Alden is nationally known for solving
flow related engineering and environmental problems through a combination of laboratory testing
(including flow meter calibrations and verification of equipment performance), computational fluid
-3-

dynamics (CFD) and field testing. In addition to private corporations, Alden's clients have included
major governmental agencies such as the U.S. Nuclear Regulatory Agency, the U.S. Department of
Energy and the U.S. Fish and Wildlife Service.
Alden is located in Holden, Massachusetts on about 25 acres ofland used for experimental research
and testing, and has a staff of about 40 people. The full address is:
Alden Research Laboratory, Inc.
30 Shrewsbury Street
Holden, MA 01520
Phone: (508) 829-6000
Facsimile: (508) 829-5939
e-mail: [email protected]
The Project Investigator in charge of conducting the tests will be PhilipS. Stacy, Hydraulic Engineer.
The overall guidance for the test program will be provided by Dr. Mahadevan Padmanabhan
("Padu"), Vice-President. Both Padu and Phil will act as contact persons at Alden.
PhilipS. Stacy
Phone Extension: 425; e-mail: [email protected]
Dr. M. Padmanabhan ("Padu")
Phone Extension: 442; e-mail: [email protected]
Primary responsibilities of Alden will include:
• preparation of this site-specific Verification Test Plan, including revisions in response to
comments made during the review period
• coordination with the manufacturer (vendor) of the mixer to be tested
-4-

• contracting with the hydraulic laboratory for implementation of the approved Verification Test Plan
• providing logistical support for the hydraulic laboratory, establishing a communication network, and scheduling and coordinating the activities for the verification testing
• overseeing and conducting the verification testing with the help of the hydraulic laboratory, in accordance with this Verification Test Plan
• managing, evaluating, interpreting and reporting on data generated during the verification testing, and
• preparation and review of a draft Verification Report
2. 5 Vendor (mixer manufacturer)
The mixers to be tested are manufactured by:
The U.S. Filter/Stranco Company
595 Industrial Drive
Bradley, IL 60915
Phone: (800) 882-6466 or (815) 932-8154
Facsimile: (815) 939-9845
e-mail: [email protected]
All communication should be addressed to:
Mr. James Marcukaitis, Director of Engineering
The U.S. Filter/Stranco will supply three submersible chemical mixers to be tested that are of differing horse power and typical of their product line. All associated mounting hardware, chemical feed lines and other ancillary equipment needed for operation will be supplied. A list of any special requirements, limitations and instructions shall also be provided, as should descriptive details about
-5-

the capabilities and intended function of the mixers. Close communication with Alden is to be
maintained to insure on time delivery of all equipment, consistent with the schedule in the Verification
Test Plan. That document will be reviewed and approved by the U.S. Filter/Stranco (after any
necessary changes have been made) prior to the start of testing.
One person will be supplied by the U.S. Filter/Stranco Company to provide technical support and to
oversee mounting and operation of their mixers during testing. That person will certifY that the
mixers have been mounted and operated properly.
The U.S. Filter/Stranco will also review and comment on the Draft Verification Report and
Verification Statement.
2.6 The S.O. Conte Anadromous Fish Research Center (CAFRC)
Verification will take place at the S.O. Conte AnadromousFishResearch Center (CAFRC). CAFRC
is a United States Geological Survey (USGS) Facility where research and equipment testing is
conducted on a regular basis. CAFRC has previously participated in the testing ofhigh rate induction
mixers and has large indoor flumes and flow capacity which are uniquely suited for this purpose.
Actual facilities to be used are described in Section 4 below.
The contact person at CAFRC will be:
Mr. John Noreika
S.O. Conte Anadromous Fish Research Center
One Migratory Way
Post Office Box 796
Turners Falls, MA 01376
Phone: (413) 863-3839
Facsimile: (413) 863-9810
-6-

e-mail: john_ [email protected]
Under the direction ofMr. John Noreika, CAFRC personnel will have the following responsibilities.
• modify the test flume to provide the required dimensions and features • provide steady flow to achieve the required velocities • measure, evaluate a11d report on velocities and flows established during testing • provide the needed electrical power for the mixers and sampling equipment • assist with installation and repositioning of the sampling rig • provide any needed QA/QC documentation for the flow and velocities
2. 7 Technology Panel on High Rate Disinfection
The ETV Technology Panel on High Rate Disinfection will serve as a technical and professional resource during all phases of the verification of a mixer, including the review of Test Plans and Verification Reports, as requested by NSF and EPA.
3. CAP ABILITIES AND DESCRIPTION OF EQUIPMENT TO BE TESTED
3 .1 General Description
U.S. Filter Stranco will provide three Submersible Water Champ F Series (SWCF) induction mixers nominally rated at 5, 10 and 20 horsepower. The mixers will be typical ofthe product line, and no special provisions or changes will be made to the mixers. All mixers will be powered electrically at 460 V AC, 3 phase using the standard power cable. The manufacturer will provide a line for the induction flow, and an orifice plate flow meter assembly will be added by Alden as part of the test equipment. Drawings, photographs, and specifications provided by U.S. Filter are included as Appendix A.
-7-

The principle of operation is that rotation of the uniquely shaped propeller causes a reduction in pressure in the chamber surrounding the impeller shaft. Connecting a flow line to the port in the chamber causes flow to be induced. This flow is propelled outward by the rotating propeller and mixed vigorously with the surrounding water (flow).
3.2 Series SWCF Specifications
Each mixer to be tested will have a unique identification number, such as a serial number, which will be part of the test log record. That unique number is to be inscribed or attached onto the mixer in a manner that does not allow for removal or alteration. The 20 hp mixer has the Model designation of SWC20F and has a maximum liquid induction flow of 60 gpm, the 10 hp is designated as SWC 1 OF and has a maximum liquid induction flow of 40 gpm, and the 5 hp is designated as SWC5F and has a maximum liquid induction flow of25 gpm. The rpm of all units is 3,450.
The "F" Series submersible offers high quality design and construction, the motor being hermetically sealed 316 stainless steel and most wetted materials being constructed from Grade 2 Titanium (unalloyed). An innovative mounting is configured for open channel applications and can be easily retrofitted to basins and tanks. Both a horizontal and vertical orientation ofthe mixer is possible. For this test, a horizontal orientation will be used, with the propeller pointed upstream into the flowing water.
3. 3 Operating Requirements
The mixer must stay submerged by at least 18 inches at all times. The mixer should not run out of water. All power supplies should be locked out when performing any maintenance to the system.
-8-

3 .4 Mixer Flow
The mixer flow specifications for each mixer size (hp) vary between manufacturers. For this comparative investigation of mixer performance, the test flows for each size mixer have been established by Moffa & Associates per their facsimile dated October 13, 2000, and the details are given below.
The disinfectant feed rate to an induction mixer is a function of the:
• wastewater flow (Qr),
• the disinfectant concentration (Cc), and
• required disinfectant dose (Cc).
Additionally, the mixer horsepower is related to the wastewater flow; a typical mixer sizing criteria for CSO applications is 0.14 hp/MGD (Moffa & Associates, 1999). Therefore, the proposed mixer sizes for the verification testing and their associated wastewater design flows are:
• 5 hp for 3 5 MGD
• 10 hp for 70 MGD
• 20 hp for 140 MGD
A mass balance equation is used to estimate the disinfectant feed rates based on the mixer hp and design wastewater flows listed above:
(1)
Assuming a 7.5% sodium hypochlorite injected concentration and a final mixed dose of20 mg/1 in the wastewater flow, solving for Qc (the required disinfectant flow) yields the following mixer flows:
-9-

Mixer Size (hp) Mixer Flow (gpm)
5 7
10 13
20 26
4. DESCRIPTION AND REQUIREMENTS FOR HYDRAULIC TEST FACILITY
4.1 General Site Arrangement
The S. 0. Conte Anadromous Fish Research Center (CAFRC) is situated in the town ofTumers Falls,
MA, on the right Qooking downstream) bank of the canal to the Cabot Hydroelectric Power Station.
Water enters the building with the test flume from an inlet structure on the bank of the power canal.
The inlet to a below ground conduit will be used for intake flow. Flow from the buried conduit is
controlled by a sluice gate in the building. This flow is distributed to a forebay upstream of the test
flume by an inlet chamber and floor diffuser.
Only one of the three flumes in the building will be used. That flume is longer, wider and deeper than
needed, and therefore, false walls will be constructed to generated the desired test flume dimensions.
4.2 Test Flume
A rectangular channel section 7 :ft wide with a water depth of7 :ft will be established for testing. To
provide for a relatively uniform velocity distribution at the mixer, the length of the flume upstream
of the mixer will be 20 :ft, and the test channel entrance will be rounded to avoid flow separation, as
shown in Figure 1. Upstream of the test channel entrance, the flow will be guided by a straight flume
10 :ft wide and 32ft long, with an upstream flow distributor, see Figure 1. The test channel has a
once-through flow system drawing water from the power plant canal and discharging the outflow to
the canal with no possibility of discharged water re-entering the channel.
-10-

INFl..O
""" """
~
II
L
0:::
~ 3:::> om ii~ w
(/)
Ci
I 32'
Fl.. OW DISTRIBUTOR
Fl.. OW
I 32'
\
l. + Fl.. OW MIXER _j -
r
I 20' I 28' I 24'
PLAN
TRAVERSE LOCATION (TO BE CONFIRMED IN TEST PROTOCOL)
? ?' )0' j5' . c-.
-t- MIXER F.:!::QW
J 20' 28' 24' ELEVATION
SCALE 1" •1'5'
FIGURE 1 PLAN AND ELEVATION OF PROPOSED TEST SETUP
-' I
3:0~ og:< ii~<:>
(,)
I
~ Fl
G1
.ow TROL TE
( CON
.J
J
ALDEN

The 7 ft wide test flume will extend 28 ft downstream of the mixer before expanding to the wider 10ft flume width. Provisions will be made to accommodate installation of the mixer at the designated location in the test flume, in accordance with instructions and mounting hardware from the vendor with the assistance of a representative from the vendor.
A 25 point water (dye) sampling rig will be located along sections 5, 10, and 15 ft downstream from the mixer. Only one location will be sampled at one time, and provisions ·will be made for locating and moving the sampiing rig.
Adequate electrical power will be supplied to operated mixers ofup to 20 hp and to supply power to the instrumentation used in the tests. Power is supplied by the Cabot Power Station. No backup power is available for the flume.
4.3 Flume Flow Control
Flow and water level in the flume will be controlled by a hinged steel weir. The weir will be calibrated prior to initiation of tests to obtain the head-flow relationship of the weir at three positions and the desired water level of7 ft. The weir will be located 24ft downstream of the end of the test flume so that there will be no effects on the flow distribution in the test flume caused by the weir.
To obtain the required maximum velocity of3 ftlsec, the test flume will be supplied with a maximum flow of 150 cfs. Lower velocities will be set by reducing the inflow with the upstream sluice gate and raising the weir to maintain the water level. The flow required for a given test will be set by presetting the weir and adjusting the flume inflow until the required 7ft depth is achieved. As a part of the weir calibration, the velocity distribution at a 7ft x 7ft cross-section just upstream of the mixer location will be measured for each flow using a Sontek ADV velocimeter available at CAFRC. All instrumentation are listed in Table 1 in Section 6.0 and a description of the weir calibration is provided in Appendix B.
-12-

4.4 Instrumentation For Dye Dilution
4.4.1 Dye Injection
Rhodamine WT will be used as the tracer dye. Rhodamine WT has low adsorption characteristics and is supplied at nominal 20% concentration by weight. Stock injection solutions will be prepared at Alden to a concentration of 2 x 10⁷ ppb by serial dilution of the supplied solution \Vith distilled water. The rate of injected dye will be set according to the plume velocity to produce a theoretical (perfect mixing) concentration at the sampling locations of approximately 12 ppb, using the following mass balance equation.
(2)
where
ci = injected tracer concentration
Qi = injected tracer flow
c. = mixed concentration
Qt = mixed flow
Based on experience with mixers of this type, it is expected that the actual flume concentrations may be up to five times greater than the theoretical average. It is, therefore, necessary to choose an injection rate so that the potential highest sample concentration is below a value that would be in the non-linear response range of the fluorometer~ above approximately 80 ppb. As a result, the anticipated tracer injection rates will be 0.4 m1/s, 1.0 m11s, and 2.5 m1/s, for the three flume velocities of0.5 fils, 1.25 fils, and 3.0 filsec.
Fluorescence is a function of water temperature and temperature variations from the water temperature during calibration are accounted by
-13-
c C ek (Tr-Tc) r (3)
where
c = concentration (ppb)
cr = apparent concentration at Temperature Tr (ppb)
Tc = calibration temperature CF)
k = temperature connection coefficient (IfOF)
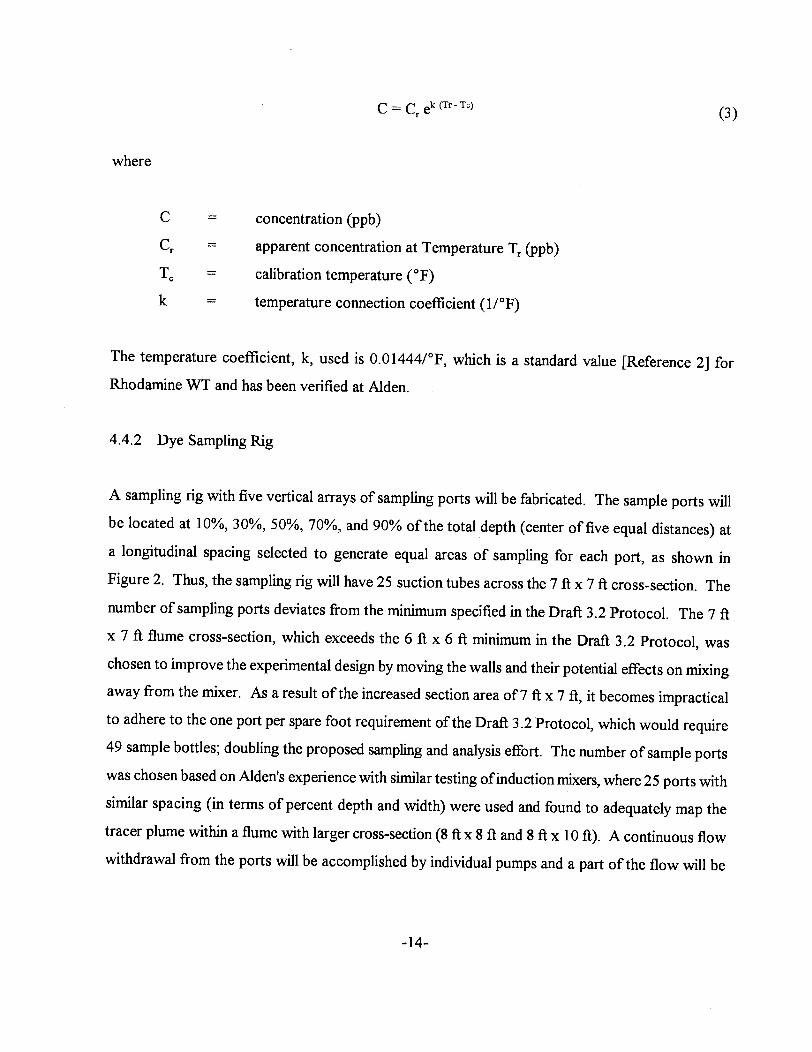
The temperature coefficient, k, used is 0.01444fOF, which is a standard value [Reference 2] for Rhodamine WT and has been verified at Alden.
4.4.2 Dye Sampling Rig
A sampling rig with five vertical arrays of sampling ports will be fabricated. The sample ports will be located at 10%, 30%, 50%, 70%, and 90% ofthe total depth (center offive equal distances) at a longitudinal spacing selected to generate equal areas of sampling for each port, as shown in Figure 2. Thus, the sampling rig will have 25 suction tubes across the 7 ft x 7 ft cross-section. The number of sampling ports deviates from the minimum specified in the Draft 3.2 Protocol. The 7 ft x 7ft flume cross-section, which exceeds the 6ft x 6ft minimum in the Draft 3.2 Protocol, was chosen to improve the experimental design by moving the walls and their potential effects on mixing away from the mixer. As a result of the increased section area of7 ft x 7ft, it becomes impractical to adhere to the one port per spare foot requirement of the Draft 3.2 Protocol, which would require 49 sample bottles; doubling the proposed sampling and analysis effort. The number of sample ports was chosen based on Alden's experience with similar testing of induction mixers, where 25 ports with similar spacing (in terms of percent depth and width) were used and found to adequately map the tracer plume within a flume with larger cross-section (8ft x 8ft and 8ft x 10ft). A continuous flow withdrawal from the ports will be accomplished by individual pumps and a part of the flow will be
-14-

0 0 0 0 I
Bl Cl Dl El 1..4 - 1- -
0 0 0 0 0 A2 B2 C2 D2 E2 I -----I
7 0 0 0 0 B3 C3 D3 E3 I
I I --I
0 0 0 c 0 A4 I B4 C4 D4 E4 1.'4 ---_I_- _I_ -----
0 0 I I ' :r=~~ .. 7 t 1.4 · - L4 7
DIMENSIONS IN Ff
FIGURE 2 LOCATION OF SAMPLING TUBES
ALDEN

directed by valving arrangement to sample collection bottles, while the remainder will be returned to
the flume. The 25 sample flows will be established by adjusting each flow through its own rotameter.
4.4 .3 Fluorometer
A Turner Designs Model 10 fluorometer will be used to measure tracer concentration. The
fluorometer is capable of detecting concentrations as low as 0.01 ppb. Rhodamine tracer used in
concentrations below 20 ppb provides sufficient measurement accuracy while being low enough to
be undetectable by eye. Concentration oftracer in the samples is determined by fluorescence intensity
which is proportioned to the voltage output of the fluorometer.
The Turner Designs Model 10 fluorometer has multiple settings to increase the range of measurable
concentrations. Two settings are available, XI and XIOO, having a 100 to I effect on output. Within
each range, the sensitivity may be changed from XI to X31.6 in four equal steps, having about a 30-
fold effect on output. The instrument span and zero offset are also adjustable to match the output
to the measured concentration. The fluorometer will be set up to read in the upper one third output
of the XI sensitivity scale to ensure good resolution for a wide concentration range.
Fluorometer voltage output and two RTD thermometers, measunng water and instrument
temperatures, will be recorded by a portable computer with a 12 bit analog to digital converter. Full
scale on the computer is two volts with a resolution of0.0005 volt. Transmission characteristics of
the primary light filter in the fluorometer change slightly with temperature, affecting instrument
sensitivity. Therefore, a platinum resistance temperature sensor is mounted on the filter to monitor
the temperature and assure instrument drift is within acceptable limits. A similar temperature sensor,
mounted in a 1/8" diameter rod, measures the water sample temperature, which is used to correct
measured fluorometer voltage output to calibration water temperature with Equation (3). The
thermometer used to determine the water temperatures at the fluorometer and the dye injection
temperature have been calibrated versus an NIST traceable thermometer standard, and were found
to be accurate within 2 °F. Resolution of the digital temperature readout is 0.1 °F.
-16-

5. TEST PROCEDURES
5.1 Test Objectives
Manufacturers of an induction type mixer make claims about the mixing capabilities oftheir product and provide values for parameters indicative of mixing intensity. However, there is not a standard way for calculating such parameters since the volume of water involved in the mixing is unknown. This Verification Test Plan establishes a method for determining the volume of process water affected by the induction mixer.
The objective of this testing is to characterize the performance of high rate induction mixers with respect to their ability to rapidly transfer a non-reactive tracer (instead of a chemical disinfectant) into a flowing body of clean water. Mixer performance will be characterized by the degree of tracer uniformity achieved over measured portions of the flow cross-section (the mixing zone) at various distances downstream from the mixer. This characterization will be for a range of flow velocities representative of those in wet weather flow collection and treatment facilities.
5.2 Test Conditions
Each verification test series will evaluate a single induction mixer under three velocities, namely 0.5, 1.25, and 3.0 ftlsec. The prescribed velocity of2 ftlsec in the Draft 3.4 ofthe protocol is replaced with 1.25 ftlsec to allow a better distribution of data in the 0.5 to 3 ftlsec range. Each test series will consist of one test run at each of the velocities, as shown in the test matrix in Section 6.0, Table 2. No repeat testing is included in the present test matrix. If the results of these tests show inconsistencies that warrant further investigation, additional repeat tests may be conducted at a later date. For each test run, the flow velocity is to be held steady, the water depth will be maintained at 7 ft, and the cross-sectional mixing will be evaluated by concentration measurements. The sampling rig used to measure the extent of cross-sectional mixing will be located at 5, 10, and 15 ft downstream of the mixer, but only one sampling rig will be installed in the channel during each test.
-17-

Each verification test series will be for an induction mixer of a given power. Verification tests will be conducted for three mixers of the Series SWCF mixers (horsepowers of 5, 10 and 20).
5. 3 Method and Materials
After a mixer has been installed and the desired flow conditions have been set and stabilized, the mixer will be operated with measured induction flow and measured injection of concentrated Rhodamine WT dye stock solution. Details of the test procedure and measurements are included in Appendix B. An orifice meter, calibrated at Alden's gravimetric facility, will be used to measure the induction flow and a periodic volumetric check will be made ofthe dye metering pump flow. The metering pump will draw from the stock solution of dye and discharge into the hose that conveys water to the mixer. Amperage and voltage readings of the electrical power to the mixer will be recorded using a Fluke power meter. Sample data sheets are included in Appendix B. Sufficient dye will be injected to insure that the mixed dye concentration is considerably above the 0.01 ppb detection limit of the fluorometer. The entire system will be operated for a minimum of5 minutes to insure steady state conditions before sampling will begin. Mixer power will be calculated by using:
Power = Amps x Volts
A single sampling rig (as described in Section 4.4.2) will be used. This rig and the associated sampling tubes and instrumentation will be moved to the next sampling location by rolling the entire system along rails installed on top of the test flume walls. The desired position of the sampling rig at distances of 5, 10 and 15 ft downstream of the mixer impeller will be pre-marked on the flume wall.
A commercial Turner Model 10 fluorometer will be used to determine the concentration of dye in each water sample collected. Samples will be analyzed while at CAFRC to insure that any inconsistencies can be detected and rectified earlier.
-18-
Prior to mixer testing, a velocity meter (Sontek ADV) will be used to measure the flow distribution just upstream of the mixer location to verity that the velocity is relatively uniformly distributed over the 7 ft x 7 ft section and that the desired velocity has been obtained. These measurements will be made once for each of the three flume velocities to be tested, while documenting the position of the downstream weir/gate. Thereafter, each test flow condition will be reestablished by setting the weir to a noted position. Water level will be set to a 7ft depth by adjusting inflow gates upstream of the flume flow straightener.
5.4 Test Procedures for Dye Concentration Evaluation
5.4.1 Dye Injection
Stock dye solution will be injected into the mixer flow by a constant displacement pump, whose variable stroke controls the dye injection rate. Figure 3 schematically shows the injection system. The injection pump and a 100 ml pipette with reduced area measuring stations will be supplied from a 20 liter Mariotte vessel (a vessel which maintains a constant inlet pressure on the injection pump regardless ofliquid level in the vessel). Dye injection flow will be constant for each test and will be measured by the volumetric method; the supply line from the Mariotte vessel is shut off via a valve, dye is supplied to the pump solely from the pipette, which is to be a Class A vessel having a volume uncertainty of0.1%. A digital timer with 0.001 second resolution will be started and stopped, as the meniscus of the dye passes the measuring locations on the pipette. The dye injection rate will be recorded one to two times per test (sample data sheets are included in Appendix B). The dye injection flow will be low, from 0.4 ml/sec to 2.5 ml/sec, so that a secondary transport flow will be needed.
The transport flow will be flume water, withdrawn upstream of the mixer using a sump pump, will be used as transport flow. The transport flow can be any flow between 2 gpm to 10 gpm and is introduced via a tee in the inlet pipe of the pump providing flow to the mixer.
-19-

VESSEL··
VENT
SHUTOFF VALVE
TOMIXER I PUMP INTAKE !
FIGURE3
CLASS A MEASURING ~--- - ·~-
VOLUME
DIGITALRTD --- * - -- --.-
THERMOMETER
VARIABLE SPEED CONSTANT DISPLACEMENT PUMP
FLOW CONTROL VALVE
TRANSPORT FLOW
FLUME WATER FROM J UPSTREAM OF MIXER
SCHEMA TIC OF DYE INJECTION SYSTEM
ALDEN

The mixer flow will be provided by a pump of approximately 2 hp, that will withdraw flow from the flume approximately 4ft to 6ft upstream of the mixer. The tracer dye will be injected into the intake pipe of the pump, ensuring that it will be fully mixed with the flow delivered to the mixers. The mixer flow will be adjusted using a valve downstream of the orifice meter.
The flow to the mixers will be pumped and measured using ail ASME design orifice plate meter section calibrated at Alden's gravimetric calibration facility, which will produce a flow measurement accuracy within ±2%. Without pumping, use of the orifice meter could artificially reduce the induced flow. The orifice meter produces a pressure differential proportional to the square of the flow passing through it. This differential will be measured manually on a manometer board, and recorded before and after each test (see Appendix B for a sample test data sheet).
5.4.2 Dye Sampling
A continuous flow will be withdrawn from each sample port using individual pumps having control valves and the majority of the flow will be discharged back to the test channel (downstream ofthe sampling ports). The balance of the sample flow will be piped through a rotameter and control valve to exit as a free jet. Twenty-five 1liter bottles will be installed on a tray, which will be slid under the discharge jets of the sample lines to obtain simultaneous samples of all 25 points. The sample flows will be approximately equalized using the rotameters, and a sample of 10 to 12 minutes will be obtained at each location, adequate to produce a time average, or typical, concentration reading. The 1 liter bottle size, though smaller than prescribed in the Draft 3.4 Protocol, was chosen because the one liter bottle provides ample liquid volume for fluorometer analysis, and the 10 minute sample period is adequate, given that the flow will be well conditioned by the upstream flow straightener and long approach section. The sample bottles will be amber glass to protect light sensitive contents, with threaded green melamine caps with a chemical resistant Teflon seal. Information identifying each sample, with respect to mixer make and size, sample location, and test, will be written on the bottle caps at the time of sampling (see Appendix B for a test procedure check list and test data sheet).
-21-

5.4.3 Fluorometer Calibration
A 2,500 ppb preliminary calibration solution will be prepared from the stock injection solution at Alden with distilled water to expedite fluorometer calibration during testing. This will be accomplished by serial dilution of the commercial 20% concentrated Rodamine WT using the following dilution ratios.
From Initial Stock 20% Resulting Concentration, Serial Dilution Ratio Concentration (ppb)
Tracer: Distilled Water
1:19 1E7
1:19 5E5
1:19 2.5E4
1:19 2.5E3
At CAFRC, the 2,500 ppb concentration will be further diluted using flume water to prepare the calibration samples. By this method, flume water becomes the primary constituent of the calibration samples, and therefore, any effects related to the water quality are common to the calibration and test samples. Calibration samples will be prepared by sequential dilution using the following dilution ratios.
-22-

From Initial 2,500 ppb Solution Serial Dilution Ratio Resulting Calibration
Tracer: Flume Water Concentrations (ppb)
1:9 250 (not used to calibrate, only
for dilution)
1:4 50
1:1 25
1:1 12.5
0:1 0
The first 1: 10 dilution with flume water will not be used for calibration. It is mixed in the field so that the major constituent in each subsequent calibration sample is the flume(> 98%) water. This ensures that both the calibration samples and the test samples are subjected equally to any effects due to flume water quality.
The 2,500 ppb solutions will be used to prepare four calibration solutions ofO, 12.5, 25, and 50 ppb for fluorometer calibration (all concentrations are relative to the injected stock solution of 2 x 10⁷ ppb ). The fluorometer will be calibrated with the above samples and recorded on individual calibration data sheets (provided in Appendix B). A linear equation is calculated to convert fluorometer volts (V0 ) to tracer concentration:
where
m =
b =
Concentration= m · Vo + b
slope of the linear equation
intercept of the linear equation
(4)
Equation 4 will be used to evaluate the sample concentration from the fluorometer average output.
-23-

Based on experience, the calibrations of the type, using field water, should produce a linear response in fluorometer output that is within ±2% full scale, or about 2 to 3 ppb. Deviation above this limit will be suspect, and a second set of calibration samples will be prepared using the prepared stock (2,500 ppb) and flume water (enough flume water will be withdrawn to prepare multiple calibration samples).
The fluorometer will be calibrated in this way for each mixer at each flume velocity, for a total of 18 calibrations. It is planned that the three sample location data (per mixer/velocity) will be collected within two hours, thus, allowing a single calibration to be used for the entire sample set at each velocity. If collecting samples for the three locations per velocity requires more than three to four hours, additional calibration samples may be required.
5.4.4 Dye Concentration
Fluorometer voltage output and the output from the two RTD thermometers, measuring the sample water and instrument (light source filter) temperatures, will be recorded by a portable computer with a 12 bit analog to digital converter. A platinum resistance temperature sensor, mounted in an 1/8 inch diameter rod, will be used to measure each water sample temperature, so as to correct measured fluorometer voltage output to calibration water temperature (Equation 3). Fluorometer output, water temperature, and filter temperature will be read at eight hertz and, after 80 readings (about 10 seconds), the averages and standard deviations will be calculated, stored, and printed. During data acquisition, individual temperature and fluorometer readings will be displayed on the PC monitor for manual recording on data sheets. Variation of the corrected output from the previous test point will be displayed as a percent to show trends on a magnified scale. After the fluorometer output reaches a steady value for each sample (approximately 20 seconds), three 10 second readings will be averaged and recorded on a test data sheet (see Appendix B).
The concentration of all mixer samples will be measured once at CAFRC and approximately 10% of the mixer samples will be chosen at random and re-analyzed either while at CAFRC, iftime permits,
-24-

or at Alden. The results of the repeat analyses will be plotted; concentration (original) versus concentration (repeat), as shown below. Based on Alden's experience with repeating the fluorometer analyses, these data should produce a straight line, as shown below.
14
m 12 c.. c.. -1- 10 z w :E • w 8 0::: :J • C/)
~ 6 :E ...J ·I-<( 4 z (3 ·I- • • ~ 2 0
,. ... .~ . •
0 I'
0 2 4 6 8 10 12 14 REPEAT MEASUREMENT (PPB)
The standard deviation of the data around a straight line curve fit will be used to quantify the repeatability of the repeat analysis. The results of the repeat analyses will be included in the verification report.
5. 5 Data Analysis
The dye concentration data will be normalized to facilitate interpretation. The average dye concentration for each sampling port, as described in Section 5.4.3, will be normalized by dividing by the uniform concentration Cu, which is defined as,
-25-

Cu = tracer stock concentration x tracer feed flow rate I flume water flow rate
A normalized concentration of 1 will represent perfect mixing. The normalized concentrations at the 25 sampling ports for each of the three cross-sections will be used to generate an isopleth diagram, as shown in Figure 4.
In addition, the standard deviation of the normalized concentrations for each cross-section will be computed and a plot of standard deviation with distance from the mixer will be obtained to indicate the mixer effectiveness.
A percent mix factor will be calculated once the uniform theoretical dye concentration isopleth diagrams are established.
channel area with tracer concentration > uniform concentration Percent mix factor = x 100 total channel cross-section area
The percent mix factor indicates the area of the channel that has experienced complete mixing.
5. 6 Reporting
The final report will incorporate all data collected for each test, which include the flume test flow (from head over weir), mixer flow (orifice meter), dye stock injection flow (positive displacement pump), dye stock concentration (fluorometer measurement), and the individual concentration data for each of the twenty five points for each of the three cross sections (fluorometer measurements on each collected sample). The data will be presented in the Verification Report (final report) as tables (listing the average measured concentrations at each measured location for each test run), isopleth diagrams, percent mix factors for each mixer at each tested flow, and plots of standard deviation of measured concentration versus distance from the mixer. Raw data in a tabular form (spread sheet format) will be included as an appendix in the report.
-26-

8
7
6
2
+
0~---~--.--.--~---.---.--~--~
0 2 3 4 5
CHANNEL WIDTH
FEET
6 7 8
- DATA NORMALIZED BY DIVIDING POINT VALUES
BY THEORETICAL UNIFORM CONCENTRATION
FIGURE 4 TYPICAL TRACER CONCENTRATION
ISOPLETH DIAGRAM
ALDEN

The report will identify the tested mixer and its major characteristics, and describe the procedures and methods of testing, results, conclusions and recommendations, and will include photographs of the test facility and mixer setup. The report will also include instrument calibration data as an Appendix.
The verification report will first be issued as a draft and will undergo a complete review by NSF and the EPA, as well as a peer review, as recommended by the Technology Panel on High Rate Disinfection. The mixer vendor will also review the report and be provided the opportunity for input on its content. After receiving all comments, the report will be revised, as needed, and the required number of copies will be submitted to NSF.
The report outline will be as follows.
• Introduction
• Executive Summary
• Description and Identification ofProduct Tested
• Procedures and Methods Used in Testing
• Results and Discussion
• Conclusions and Recommendations
• References
• Appendices to include mixer information and test data
5. 7 Verification Statement
NSF and EPA will prepare a Verification Statement that briefly summarizes the Verification Report for issuance to the mixer vendor. The Verification Statement shall provide a brief description of the testing conducted and a synopsis of the performance results. The Statement is intended to provide verified vendors a tool by which to promote the strengths and benefits of their product.
-28-

6.0 QUALITY ASSURANCE PROJECT PLAN (QAPP)
6.1 Alden QA Plan
The general Alden QA plan applicable for the study, is included as Appendix D of this report. Appendix C includes the project management and organization for QA, data and correspondence, file system, documentation with data log book and computer disks, and review procedure including procedure for documentation of revisions.
6.2 Test Variables for QAPlan
Test items subject to QA and uncertainty analysis are listed below:
-29-

TABLE 1 - TEST VARIABLES AND/OR PARAMETERS SUBJECT TO QA
Variable/Parameter Instrument Number and Description
Flume Width 1 Stanley® 25ft retracting tape measure (or equivalent) Water Depth 2 UNIDATA ™ model6541/c water level instrument with internal
data logger
Weir Position 3 RITimeyer Angle Transmitter resistive/optical model MGAx Water Velocity 4 Sontek® ADV three axis velocity probe.
Water (Flume) 5 Platinum RTD and Omega® digital readout Temperature Alden SIN: 0500
Mixer Location 1 Stanley® 25ft retracting tape measure (or equivalent) reference to flume floor and walls
Mixer Power 6 Fluke® 41B Power Meter
Mixer Flow 7 Orifice Meter Section SIN: 1064
Orifice Meter Manometer 8 Lufkin® 066D 6ft Red End Engineer's Folding Wood Rule Tracer Injection 9 Serial Dilution of 20% Stock using Class A pipettes and flasks Concentration
Tracer Injection Rate 10 Timed 100 mL Class A pipette (Integral with tracer injection system)
Tracer Injection Timer 11 Newport® Model6130A Digital Timer (Integral with tracer injection system)
Tracer Injection 12 Omega® Model199B platinum RTD (Integral with tracer injection Temperature system)
Sample Port Location 1 Stanley® 25 ft retracting tape measure or equivalent Reference to mixer impeller
Sample Concentration 13 Fluorometer Turner Designs Model 10
Sample Water 14 Newport® RTD (Integral with fluorometer system) Temperature
Fluorometer Filter (light) 15 Omega® Model 199 Platinum RTD (Integral with fluorometer Temperature system)
Fluorometer Calibration 16 Serial Dilution of 2500ppb Stock using Class A pipettes and flasks
-30-

TABLE 2- TEST MATRIX
Mixer Flume Velocity Sampling Location Size (hp) (ft/sec) (ft from mixer impeller)
5
0.5 10
15
5 5
1.25 10
15
5
3.0 10
15
5
0.5 10
15
5 10
1.25 10
15
5
3.0 10
15
5
0.5 10
15
5
20 1.25 10
15
5
3.0 10
15
-31-

6.3 Uncertainty ofMeasurements (Bias and Precision)
Measurement uncertainties result from a combination of precision and bias uncertainties. Estimates ofuncertainties of flow measurement in the flume will include uncertainties associated with the weir calibration (weir setting versus flow involves uncertainties due to velocity traversing, i.e., measurement of velocities and water depth) and uncertainties associated with weir setting during tests. These uncertainties will be evaluated with input from CAFRC. Estimates of precision uncertainty for injection flow and concentrations will be made from the standard deviations of repeat measurements multiplied by the Student t factor to correct the standard deviation from the limited number of measurements to an estimate ofthe standard deviation with an infinite number of points. Bias uncertainty will be determined from comparative tests and Alden experience. The overall uncertainty will be reported as the sum of the precision and bias uncertainties at the 95% confidence level.
Tracer injection flow measurement will have precision uncertainties from time and temperature measurements and bias uncertainties from time measurements and temperature effects on volume and density. The concentration measurement uncertainties need to include both fluorometer calibration uncertainty (from preparation of solutions, temperature effects and instrument errors, for example, due to electronic noise) and the data acquisition and reduction uncertainty.
6.4 Transmission ofData
The final report will include (as an Appendix) calibration data for the flume flow and instruments for injection flow and concentration measurement, raw data of flows and concentrations, revisions resulting from reviews, calculations, and a list of references. Any relevant data that are collected, reduced and/or calculated using a computer data acquisition system will be provided in the electronic form (spread sheets) in addition to hard copies.
-32-
7. SAFETY MEASURES
As the test flume at CAFRC is routinely used for testing with similar flows, conformance to electrical codes and confined space work procedures are followed. Precautions will be taken to avoid storing dye near the flume. Only the small quantity of dye stock for testing will be kept near the flume. Preparation of the stock will be restricted to confined areas with no consequences from inadvertent spilling. Dye bottles carrying samples will be stored in containers and will be handled carefully to avoid spilling.
The safety of test personnel and visitors will be given utmost importance. Harnesses and life jackets will be available at the site. CAFRC has a safety officer on its staff, whose services will be available, as needed.
8. REFERENCES
[ 1] "Generic Verification Protocol for Induction Mixers Used for High Rate Disinfection of Wet Weather Flows," Draft 3 .4, ETV for NSF International, by Moffa & Associates, June 2000.
[2] "An Evaluation of Some Fluorescent Dyes for Water Tracing," Smart, P.L. and Laidlaw, I.M.S., Water Resources, February 1977, pp. 15-33.
-33-

APPENDIX A
DRAWINGS, SPECIFICATIONS
AND PHOTOGRAPHS OF MIXERS


INNOVATIVE TECHNOLOGY
INNOVATIVE FEATURES AND BENEFITS
• Quality Diffusion/Mixing
• Maximum Chemical Concentration
• No Chemical Off-Gassing
• Elimination of Carrier/Make-Up Water
• Efficient Energy Transfer
• Vacuum Gas Feed to 10,000 PPD
• Vacuum Liquid Feed to 150 GPM
CHEMICAL FEED TRIAD
Chemical Metering
Monitoring and Control
Diffusion/Mixing
ENHANCED CHEMICAL FEED
The Water Champ"' vacuum chemical induction system has revolutionized the
concept of chemical feed systems with irs innovative design and unlimited chemical feed
applications in potable water and wastewater treatment. The Water Champ's superior
mixing characteristics represent a major step forward in chemical feed and disinfection
applications. Virtually any process feed application can benefit from Water Champ's
direct vacuum chemical induction capability. Water Champ eliminates the necessity of
costly carrier/make-up water and conventional rapid mix systems. A unique feature of the
Water Champ is its ability to provide the mixing intensity required to maximize chemi
cal reaction while using less energy. USFilter and its ChemFeed and Disinfection Group -
stand committed to the design and production of quality systems that will provide
efficient and dependable service.
The introduction of the Water Champ chemical induction system represents an
important advancement over conventional vacuum chemical feed and disinfection
systems. That technology, introduced in the 1920s by Wallace & Tiernan Co., was based
upon the use of an injector system for the gas and liquid withdrawal process. The
innovative Water Champ vacuum chemical induction concept eliminates the need for an
injector. Additionally, the Water Champ induction system can be retrofitted to any exist
ing chemical feed/disinfection system. The Water Champ system consists of a motor
driven open propeller which creates a vacuum in the chamber directly above the propeller.
This vacuum is transmitted to the chemical metering/control system by a vacuum line
similar to current remote injector systems.
Water Champ is the dynamic component of the triad that forms any modern chemi
cal feed system. The other elements of the triad are chemical metering, monitoring and
control equipment, i.e. US Filter's Wallace & Tiernan and Stranco Products.

STREAMLINED PROCESS
WATER CHAMP VERSUS THE TYPICAL
INJECTOR SYSTEM
Fig I With the 'Water Champ imtallation, there is no need for a water supply, pump, strainer, injector, mixer or diffuser.
COST EFFECTIVE
How cost-effective is the Water Champ
system? With a Water Champ installation,
you eliminate the need for a \Vater
supply, pump, strainer, injector, mixer or
diffuser. Figure 1 illustrates Water Champ's
efficiency in capital equipment savings and
water savings when compared to conven
tional injector systems. In systems where
potable water is used for make-up solu-
INSTALLATION & MAINTENANCE
The Water Champ is easy to install due
to its light weight, simplicity of construc
tion and non-corrosive moving parts.
Maintenance is kept to a minimum due to:
POTABLE WATER TREATMENT CHEMICALS
In addition to chlorine and ammonia,
Fig 2 many other chemicals used in potable
In systems where potable water is used for water treatment depend upon proper make-up solution, the 'Water Champ eliminates the need for an injector, mixer or diffuser. mixing. This is particularly evident during
Fig3 'Water Champ can be easily retrofitted to any current system.
the coagulation process, where chemicals
(alum being the most predominant) are
added for charge neutralization and floc
culation.
The chemical reactions that precede
charge neutralization with alum occur
within microseconds and within
one second if hydrolyzed aluminum
tion, the Water Champ eliminates 1 OOo/o
of these components (Figure 2). This
translates into substantial savings. In either
system, all you need is the existing chemi
cal metering equipment and the Water
Champ unit. The Water Champ can be
easily retrofitted to any current system
(Figure 3).
• Heavy Duty Bearing Design
• Mechanically/Hermetically Sealed
Motor
• Titanium Construction in Chemically
Wetted Areas
• 316 Stainless Steel Corrosion
Resistant Motor Housing
(III) polymers are present. Due to the
competitive nature of these reactions, it is
imperative that the coagulant be dispersed
in the raw water stream as rapidly as possi
ble. This will allow the polymer products
that develop instantaneously to efficiently
destabilize the colloidal suspension.
Incorporating the Water Champ into this
initial miXIng phase maximizes
liquid/solid separation.

SWCF SUBMERSIBlE
llWC IN-liNE
CONTROl PANEl
AVAILABLE MODELS
The Submersible Water Champ F
Series (SWCF) offers the highest quality
design and construction of any
submersible chemical induction unit.
The hermetically sealed motor is
constructed of 316 stainless steel for the
highest level of durability and perfor-
The In-line Water Champ Series
(ILWC) is designed to offer the same high
level of quality and performance as the
submersible unit. The ILWC Series is
installed through a packing gland/knife
gate valve arrangement.
This arrangement allows the ILWC
Series to be installed into closed
conduits to maximize the chemical
induction/mixing. This configuration
eliminates downtime during construction
and scheduled maintenance, saving time
and money.
The Water Champ Control Panel
offers the ultimate protection for your
Submersible Water Champ F Series
chemical induction system. The
Control Panel features the Subtrol-Plus
submersible motor protection system.
mance. All chemically wetted compo
nents are Grade 2 Titanium (unalloyed)
and are compatible with most treatment
chemicals. The innovative mounting
system is configured for open-channel
applications and can be easily retrofitted
to existing basins.
The unit is fitted with a chemical-duty
motor for the highest level of atmospheric
resistance and maximum durability.
The ILWC features Grade 2 Titanium
(unalloyed) induction body, stainless steel
packing gland, and stainless steel mount
ing system. The unit can also be config
ured with an optional insertion/retraction
device that simplifies routine mainte
nance.
This microprocessor-based system
provides underload and overload motor
protection, and incorporates an auto
restart feature in addition to an alarm
contact for external fault indication.

ZONE OF INFLUENCE
Fig4
f'SS GUIDE RAil SYSTEM
Fig5
Fig6
SUPERIOR MIXING EFFICIENCY
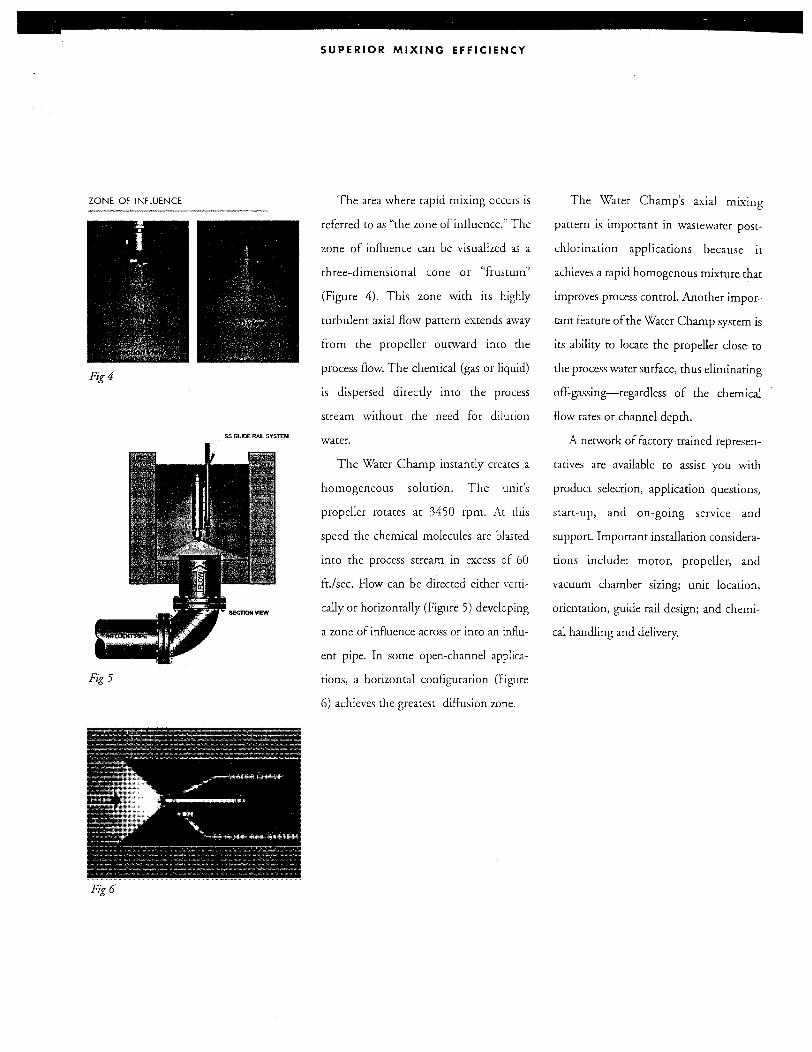
The area where rapid mixing occurs is
referred to as "the'wne of influence." The
wne of influence can be visualized as a
three-dimensional cone or "frustum"
(Figure 4). This wne with its highly
turbulent axial flow pattern extends away
from the propeller outward into the
process flow. The chemical (gas or liquid)
is dispersed directly into the process
stream without the need for dilution
water.
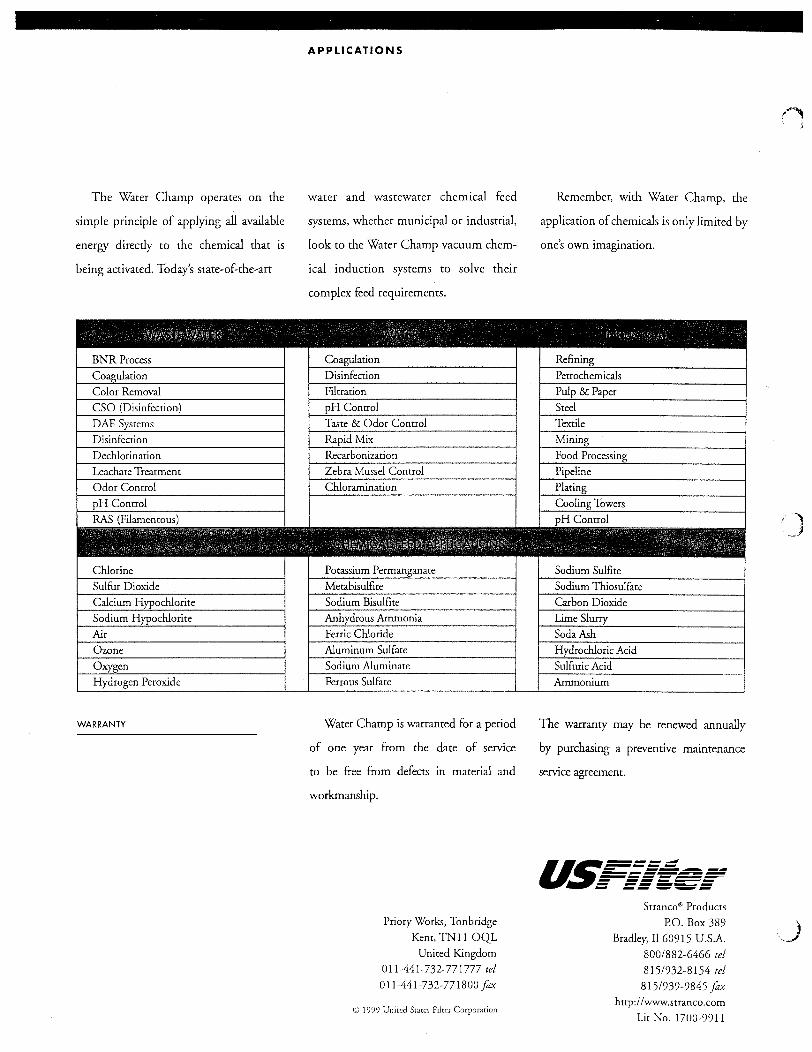
The Water Champ instantly creates a
homogeneous solution. The unit's
propeller rotates at 3450 rpm. At this
speed the chemical molecules are blasted
into the process stream in excess of 60
ft./sec. Flow can be directed either verti
cally or horizontally (Figure 5) developing
a zone of influence across or into an influ
ent pipe. In some open-channel applica
tions, a horizontal configuration (Figure
6) achieves the greatest diffusion zone.
The Water Champ's axial mixing
pattern is important in wastewater post
chlorination applications because it
achieves a rapid homogenous mixture that
improves process control. Another impor
tant feature of the Water Champ system is
its ability to locate the propeller dose to
the process water surface, thus eliminating
off-gassing-regardless of the chemical
flow rates or channel depth.
A network of factory trained represen
tatives are available to assist you with
product selection, application questions,
start-up, and on-going service and
support. Important installation considera
tions include: motor, propeller, and
vacuum chamber sizing; unit location,
orientation, guide rail design; and chemi
cal handling and delivery.
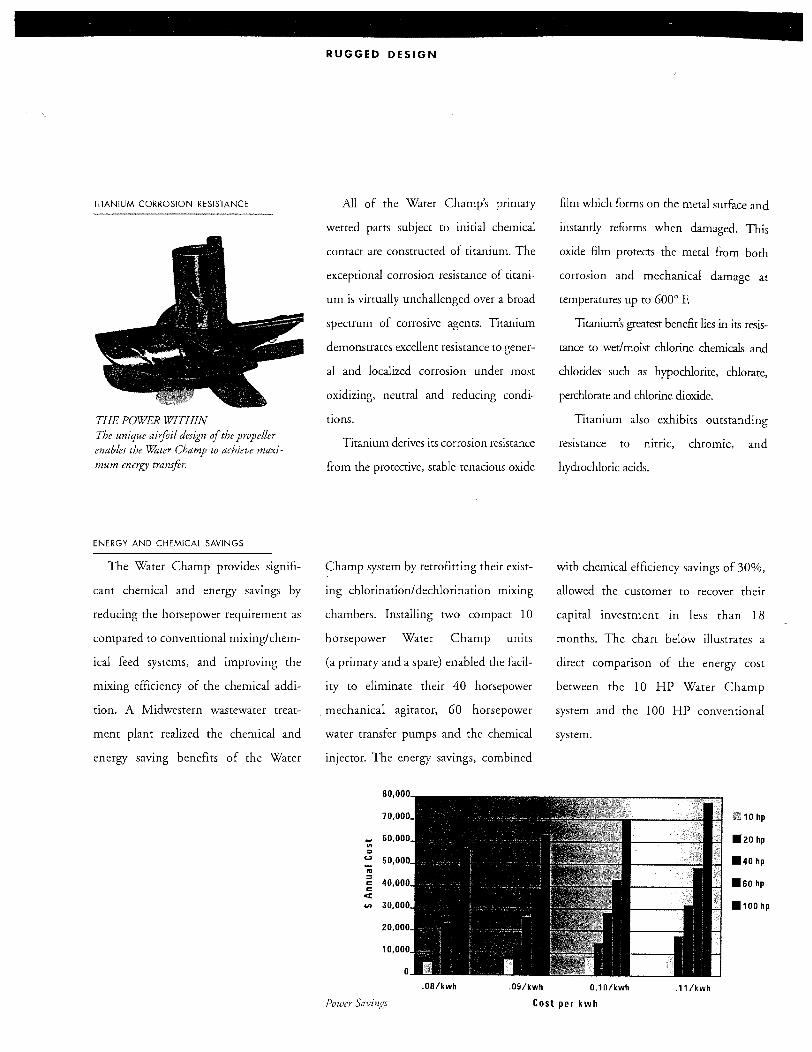
TITANIUM CORROSION RESISTANCE
THE POWER WITHIN The unique airfoil design of the propeller enables the Wtiter Champ to achieve maximum energy transftr.
ENERGY AND CHEMICAl SAVINGS
The Water Champ provides signifi
cant chemical and energy savings by
reducing the horsepower requirement as
compared to conventional mixing/chem
ical feed systems, and improving the
mixing efficiency of the chemical addi
tion. A Midwestern wastewater treat-
ment plant realized the chemical and
energy saving benefits of the Water
RUGGED DESIGN
All of the Water Champ's pnmary
wetted parts subject to initial chemical
contact are constructed of titanium. The
exceptional corrosion resista..'1ce of tirani-
urn is virtually unchallenged over a broad
spectrum of corrosive agents. Titanium
demonstrates excellent resistance to gener
al and localized corrosion under most
oxidizing, neutral and reducing condi-
tions.
Titanium derives its corrosion resistance
from the protective, stable tenacious oxide
Champ system by retrofitting their exist
ing chlorination/dechlorination mixing
chambers. Installing two compact 10
horsepower Water Champ units
(a primary and a spare) enabled the facil
ity to eliminate their 40 horsepower
mechanical agitator, 60 horsepower
water transfer pumps and the chemical
injector. The energy savings, combined
... "' 0 ... iii = = = cc <.4
film which forms on the metal surface and
instantly reforms when damaged. This
oxide film protects the metal from both
corrosion and mechanical damage at
temperatures up to 600° F.
Titanium's greatest benefit lies in its resis
tance to wet/moist chlorine chemicals and
chlorides such as hypochlorite, chlorate,
perchlorate and chlorine dioxide.
Titanium also exhibits outstanding
resistance to nitric, chromic, and
hydrochloric acids.
with chemical efficiency savings of 30%,
allowed the customer to recover their
capital investment in less than 18
months. The chart below illustrates a
direct comparison of the energy cost
between the 10 HP Water Champ
system and the 100 HP conventional
system.
~10hp
.20hp
.40hp
.60hp
.100 hp
.08/kwh .09/kwh 0.10/kwh .11/kwh
Power Cost per kwh
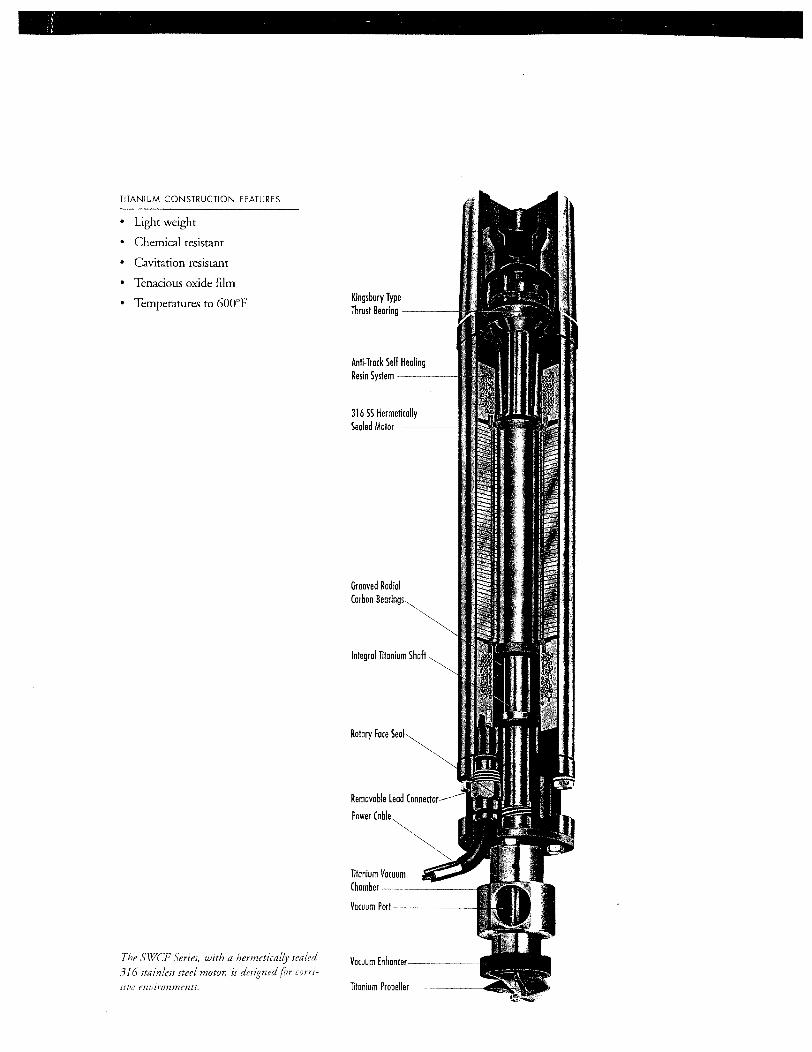
TITANIUM CONSTRUCTION FEATURES
• Light weight
• Chemical resistant
• Cavitation resistant
• Tenacious oxide film
• Temperatures to 600°F
The SWCF Series, with a hermetically sealed
316 stainless steel motor, is designed for corri
siuc enuironments.
Kingsbury Type Thrust Bearing -----
Anti-Track Self Healing Resin System-----
316 SS Hermetically Sealed Motor -·----I' ill'•
Grooved Radial Carbon
Integral Titanium Shah
Rotary Face Seal
Removable lead Lom~en,nr -
Power
Titanium Vacuum Chamber--------
Vacuum Port-------
ZONE OF INFLUENCE
Fig4
SS GUIOE R.AJL SYSTEM
Fig5
Fig6
SUPERIOR MIXING EFFICIENCY
The area where rapid mixing occurs is
referred to as "the zone of influence." The
zone of influence can be visualized as a
three-dimensional cone or "frustum"
(Figure 4). This zone with its highly
turbulent axial flow pattern extends away
from the propeller outward into the
process flow. The chemical (gas or liquid)
is dispersed directly into the process
stream without the need for dilurion
water.
The Water Champ instantly creares a
homogeneous solution. The unit's
propeller rotates at 3450 rpm. Ar rhis
speed the chemical molecules are blasted
into the process stream in excess of 60
ft./sec. Flow can be directed either \·erri
cally or horizontally (Figure 5) developing
a zone of influence across or into an influ
ent pipe. In some open-channel applica
tions, a horizontal configuration (Figure
6) achieves the greatest diffusion zone.
The Water Champ's axial mixing
pattern is important in wastewater post
chlorination applications because it
achieves a rapid homogenous mixture that
improves process control. Another impor
tant feature of the Water Champ system is
its ability to locate the propeller close to
the process water surface, thus eliminating
off-gassing-regardless of the chemical
flow rates or channel depth.
A network of factory trained represen
tatives are available to assist you with
product selection, application questions,
start-up, and on-going service and
support. Important installation considera
tions include: motor, propeller, and
vacuum chamber sizing; unit location,
orientation, guide rail design; and chemi
cal handling and delivery.
The Water Champ operates on the
simple principle of applying all available
energy direcdy to the chemical rhat is
being activated. Today's state-of-the-art
WARRANTY
APPLICATIONS
water and wastewater chemical feed
systems, whether municipal or industrial,
look to rhe Water Champ vacuum chem
ical induction systems to solve their
complex feed requirements.
Water Champ is warranted for a period
of one year from the date of service
to be free from defects in material and
workmanship.
Priory Works, Tonbridge
Kent, TN11 OQL
United Kingdom
011-441-732-771777 tel
011-441-732-771800 fax
© 1999 United Stares Filter Corporation
Remember, wirh Water Champ, the
application of chemicals is only limited by
one's own imagination.
The warranty may be renewed annually
by purchasing a preventive maintenance
service agreement.
u.~----------- --......-...--------..--..---------- -------- ------ ---- ....... ~-Stranco"' Products
P.O. Box 389
Bradley, Il60915 U.S.A.
800/882-6466 tel
815/932-8154 tel
815/939-9845 fax http:/ /www.stranco.com
Lit No. 1700-9911

I
tl I
II I
~ I
i! I q I lj
~I ~~ ~. ,,
WORKING TO BETTER TREAT POTABLE WATER & WASTEWATER
PRODUCT DATA SHEET
WATER CHAMP
CONTROL PANEL
General Description
The Water Champ® Control Panel is specifically designed to offer ultimate protection for your submersible Water Champ "F'' Series Chemical Induction System. The Control Panel includes the SUBTROL-PLUS submersible motor protection system.
Computer technology is applied to provide a unique system of detecting overloads, underloads and rapid cycling. The SUBTROL-PLUS will turn off the "F'' Series unit should any of these faults occur and provide a visual display of the fault condition. It offers automatic restart when the problem is temporary, or can signal an alarm or back-up system if it is constant.
The \Vater Champ NEMA 4X comrol panel with the SUBTROL-PLUS protection system includes the following features:
Features
• NEMA 4X corrosion resistant enclosure. (FRP-standard; stainless steel-optional)
• Viewing window for all operator usable functions and diagnostics.
• Control start/stop ofWater Champ (locally and remotely).
• Overload and underload trip settings (field adjustable).
• Fault display and auto-restart.
• One minute forced wait between starts.
• Non-resetable hour meter. • Three phase disconnect with lock
out capability. • Remote "alarm" contacts. • Remote "running" and "stopped"
contacts. • Surge arrestor which exceeds
ANSI/IEEE standard C62.11. • Terminal strip for external connec
tions.
a~=::::;:::! - -----. ----------------- ------- ---~-- -----
WORKING TO BETTER TREAT POTABLE WATER & WASTEWATER
PRODUCT DATA SHEET
WATER CHAMP F SERIES 6" SUBMERSIBLE
CHEMICAL INDUCTION SYSTEM
(MODEL NO. SWC20F)
Features
General Description
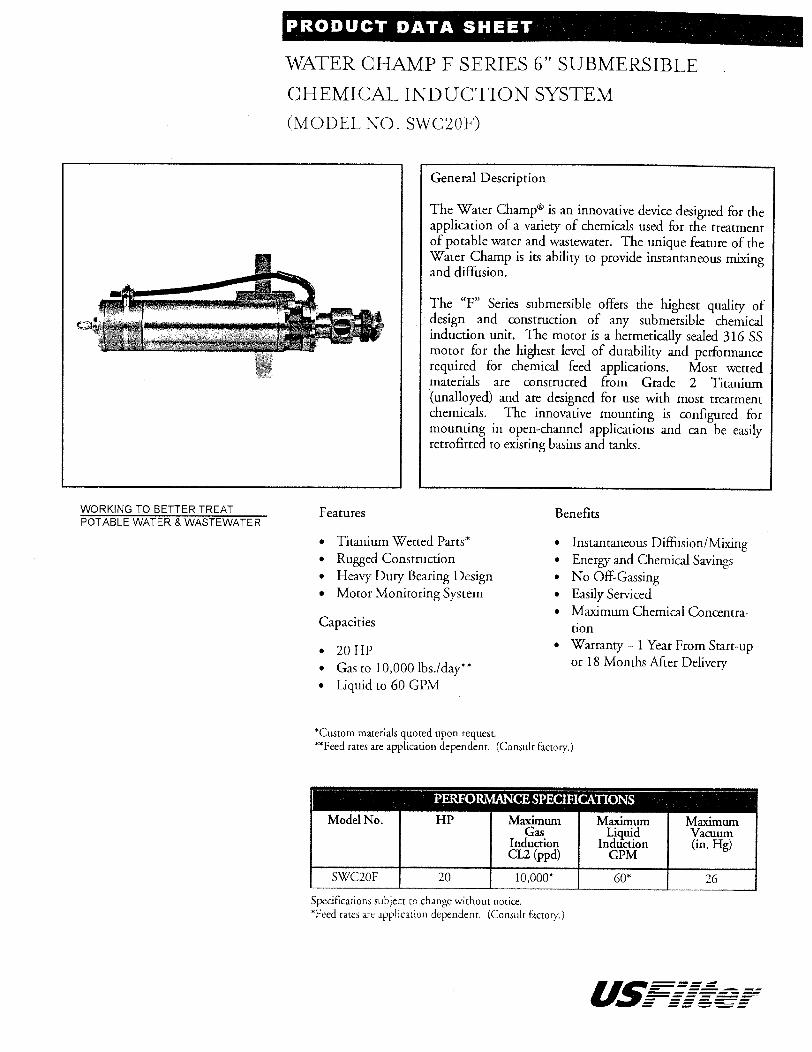
The Water Champ® is an innovative device designed for the application of a variety of chemicals used for the treatment of potable water and wastewater. The unique feature of the Water Champ is its ability to provide instantaneous mixing and cliflUsion.
The "F" Series submersible offers the highest quality of design and construction of any submersible chemical induction unit. The motor is a hermetically sealed 316 SS motor for the highest level of durability and performance required for chemical feed applications. Most wetted materials are constructed from Grade 2 Titanium (unalloyed) and are designed for use with most treatment chemicals. The innovative mounting is configured for mounting in open-channel applications and can be easily retrofitted to existing basins and tanks.
Benefits
• Titanium Wetted Parts* • Instantaneous Diffusion/Mixing • Rugged Construction • Heavy Duty Bearing Design • Motor Monitoring System
Capacities
• 20 HP • Gas to 10,000 lbs./day~~ • Liquid to 60 GPM
*Custom materials quoted upon request.
• Energy and Chemical Savings • No Off-Gassing • Easily Serviced • Maximum Chemical Concentra
tion • Warranty 1 Year From Start-up
or 18 Months Aii:er Delivery
**Feed rates are application dependent. (Consult factory.)
Model No. HP
SWC20F 20
Maximum Gas
Induction CU(ppd)
10,000*
Specifications subject to change without notice. *Feed rates are application dependent. (Consult factory.)
Maximum Liquid
Induction GPM
Maximum Vacuum (in. Hg)
60* 26
U~---------- ---------~------~ - -----= ===--~=
WORKING TO BETTER TREAT POTABLE WATER & WASTEWATER
PRODUCT DATA SHEET c
WATER CHAMP F SERIES 6" SUBMERSIBLE CHEMICAL INDUCTION SYSTEM
(MODEL NO. SWCIOF)
Features
General Description
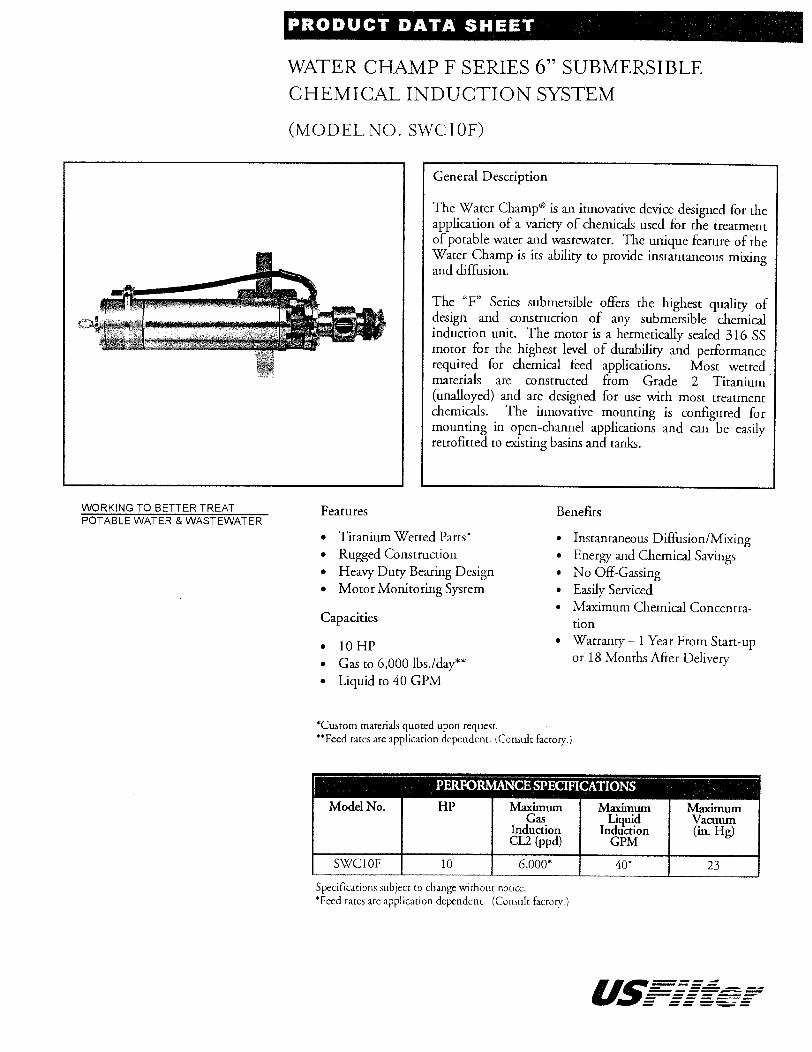
The Water Champ® is an innovative device designed for the application of a variety of chemicals used for the treatment of potable water and wastewater. The unique feature of the Water Champ is its ability to provide instantaneous mixing and diffusion.
The "F" Series submersible offers the highest quality of design and construction of any submersible chemical induction unit. The motor is a hermetically sealed 316 SS motor for the highest levd of durability and performance required for chemical feed applications. Most wetted materials ate constructed from Grade 2 Titanium· (unalloyed) and are designed for use with most treatment chemicals. The innovative mounting is configured for mounting in open-channel applications and can be easily retrofitted to existing basins and tanks.
Benefits
• Titanium Wetted Parts" • Instantaneous Diffusion/Mixing • Rugged Construction • Heavy Duty Bearing Design • Motor Monitoring System
Capacities
• 10 HP • Gas to 6,000 lbs./day** • Liquid to 40 GPM
*Custom materials quoted upon request.
• Energy and Chemical Savings • No Off-Gassing • Easily Serviced • Maximum Chemical Concentra
tion • Warranty- 1 Year From Start-up
or 18 Months After Delivery
**Feed rates are application dependent. (Consult factory.)
Model No.
SWCIOF 10
Maximum Gas
Induction CL2 (ppd)
6,000*
Specifications subject to change without notice. *Feed rates are application dependent. (Consult factorv.)
Maximum Liquid
Induction GPM
Maximum Varnum (in. Hg)
40* 23
U~===;;::: - ----_____ _.__
--------- ---~--- ---~-- -----

WORKING TO BETTER TREAT POTABLE WATER & WASTEWATER
PRODUCT DATA SHEET -
WATER CHAMP F SERIES 6" SUBMERSIBLE CHEMICAL INDUCTION SYSTEM (MODEL NO. SWC5F)
Features
General Description
The Water Champ® is an innovative device designed for the application of a variety of chemicals used for the treatment of potable water and wastewater. The unique feature of the
. Water. Champ is its'ability to provide .insJant:llleous mixingt!· and diffusion. ;+ •J:.f ··'' .s ' •. ,.
~'~- <~-,>, ~}!.~~;_:;c,, , , y_,_-!:_-- - -c;,,---"-''>- -- - -<-, ~
The "F" Series subhtersible~C>ffirl • , ;gh~t •q_~hJity of; design . and construction of • Y. subxm!rsible< chemical ' induction unit. The:;motoras . ',. ' . ~d.~£316 ss?~
.motor for the higheSt level~9 ·ifJrinance;; required for chenlibil feed~ ost~werted} materials are constructed ''from·· Graue... Titanium:" (unalloyed) and are designed for use with Ill.ost treatment chemicals. The innovative mounting is configured for mounting in open-channel applications and can be easily retrofitted to existing basins and tanks.
Benefits
• Titanium Wetted Parts* • Instantaneous Diffusion/Mixing • Rugged Construction • Heavy Duty Bearing Design • Motor Monitoring System
Capacities
• 5 HP • Gas to 3,000 lbs./day** • Liquid to 25 GPM
*Custom materials quoted upon request.
• Energy and Chemical Savings • No Off-Gassing • Easily Serviced • Maximum Chemical Concentra
tion • Warranty- 1 Year From Start-up
or 18 Months After Delivery
**Feed rates are application dependent. (Consult factory.)
SWC5F 5 25*
Specifications subject ro change wid10ur norice. *Feed rates are application dependent. (Consult factory.)
a~-----=----=-=----.. --------------- ------ ------ -----
APPENDIXB
METHODS AND PROCEDURES

GENERAL TESTING PROCEDURE
STEP DESCRIPTION
Seton for Testin~: and Recordin&
1 Mixer manufacturer's representative inspect and "sign off'' on mixer installation.
2 Establish flume flow by setting weir and water level.
3 Tum on mixer.
4 Set mixer flow using manometer board deflection.
5 Establish sampling pump flows using rotameters.
6 Establish tracer injection flow using timed pipette.
7 Allow entire system to stabilize 5 minutes.
8 Collect 3 liters "background sample" transport flow (upstream of tracer injection box). Background sample will be used to create calibration samples for each mixer/velocity combination.
9 Fill in pretest section on "Mixer Test Data Sheet".
10 Collect 25 simultaneous flume samples (1liter, approximately 10 minutes).
11 Fill in post test section on "Mixer Test Data Sheet".
12 Cap, label, and box the flume samples, move samples to analysis.
13 Move sampling rig to next longitudinal location.
14 Repeat steps 7 through 12 until3 sampling locations complete.
15 Tum off tracer injection flow while setting new flume velocity.
16 Repeat steps 2 through 14 for each flume velocity/mixer combination.
Fluorometer Seton
1 Tum on fluorometer and allow to warm up for 1/2 hour.
2 Set up cuvette water bath using building tap water.
3 Prepare calibration samples using background flow collected from 8 above, using serial dilution technique described below.
4 Cap, label, and store the calibration samples in 1 liter amber bottles.

Fluorometer Calibration
5 Fill 4 cuvette to within 1 inch of top with calibration dilutions and place on cuvette rack labeled; 1, 12.5, 25, 50.
6 If the cuvettes are not dry, fill and discard each calibration cuvette with the corresponding calibration dilution to rinse the cuvette for the calibration sample (the 1liter bottle provides enough volume for several analysis).
7 Place cuvette rack in water bath and fill with calibration solution to stabilize temperature (10 minutes).
8 The fluorometer acquisition program is started and a unique filename is recorded for each calibration.
9 Individually, the calibration samples are removed from the temperature bath, the outside is dried, and placed into the fluorometer chamber.
11 Three 10 second periods are recorded and averaged. The average is recorded on the "calibration data sheet" along with the sample and fluorometer filter light temperature. A computer file is generated for each calibration.
12 The cuvette is removed and its contents discarded. The next calibration cuvette is placed in the fluorometer and steps 8 through 11 are repeated.
13 The 4 calibration data of concentrations and fluorometer voltages are imported into a quattro spreadsheet and a first order curve fit equation is calculated. The curve fit coefficients (slope and intercept) are used to convert fluorometer readings of the test samples to units of concentration.
Samnle Analysis
1 Fill 25 cuvettes with the test samples following steps 5 through 7 above. The25 samples are to be placed in a rack labeled, as shown in the "Sample Analysis Data Sheet".
2 Individual cuvettes are analyzed following steps 8 through 13 above with the sample averages recorded on the "Sample Analysis Data Sheet" (Step 11).

Serial Dilution
1 Rhodamine WT tracer is purchased in a 20% concentrated form (2E8 ppb ). This concentration will be diluted to 2,500 ppb using the following set of serial dilutions with distilled water at Alden. Dilutions will be performed using "Class A" pipettes and graduated Flasks (0.1% measurement vessels).
Dilution Ratio 2E + 08 Distilled
ppb Tracer
1 1 1 1
19 19 19 9
Concentration rum
10,000,000 500,000 25,000 2,500
2 The 2,500 ppb concentration will be brought to the test site and further diluted (following the serial dilution given below) using flume water to produce fluorometer calibration samples at the following concentrations. Dilutions will be performed using "Class A" pipettes and graduated flasks (0.1% measurement vessels).
Dilution Ratio 2.500 Flume
ppb Tracer Water
1
1 1 1 0
9
4 1 1 1
Concentration rum 250
(not for calibration) 50.0 25.0 12.5 0.0

RECORD
NO.
PRETEST1
1
2
3
4
5
I
RECORDED BY DATE
TESTID
MIXER MANUFACTURER
MIXER HP SAMPLING LOCATION
FLUME VELOCITY
FLUME
WEIR WATER ELEVATION LEVEL
I
{circle) USF MAS
5 10 5 10
0.5 1.25
TEMP
F
(""""~
MIXER TESTING DATA SHEET
20 15 3.0
MIXER TRACER
FLOW kW AMP VOLTS CONC. TIMING TEMP. (FT METER) (ppb) mllsec F
I I I
11 R '"';"'ll
1
12 R '"';"9' l (2 R '"' '"'l' l
I -l-POSTTEST
1
~------~,-------~---------r---------,--------,---------.---------.-------·--.-------~r--------,
2
3
4
5
1. MANUAL RECORDING: UNLESS OTHERWISE NOTED, 5 READINGS RECORDED PER ITEM WITH 5 SECONDS BETWEEN READINGS.

SAMPLE ANALYSIS DATA SHEET
RECORDED BY ---------------DATE -----------------(circle)
MIXER MANUFACTURER USF MAS MIXER HP 5 10 20
SAMPLING LOCATION 5 10 15 FLUME VELOCITY 0.5 1.25 3.0
FLOUR. PROGRAM DATA FILENAME .OAT & .AVE ----------~~~~
Port Location Key (Viewed looking downstream)
A1 82 C3 D4 ES A2 82 C3 D4 DS A3 83 C3 D3 E3 A4 84 C4 D4 E4 AS BS CS DS ES
FLOUROMETER VOLTAGE (AVG. 3-10sec readings) A1 TIME A2 A3 _____ _
A4 _____ _ AS ---------81 82 _____ _
83 84 ______ _
BS ______ _
C1 _____ _ C2 C3 _____ _
C4 CS ______ _
D1 _____ _ D2 D3 ______ _
D4 DS ______ _
E1 -------E2 E3 _____ _
E4 ______ _ ES TIME
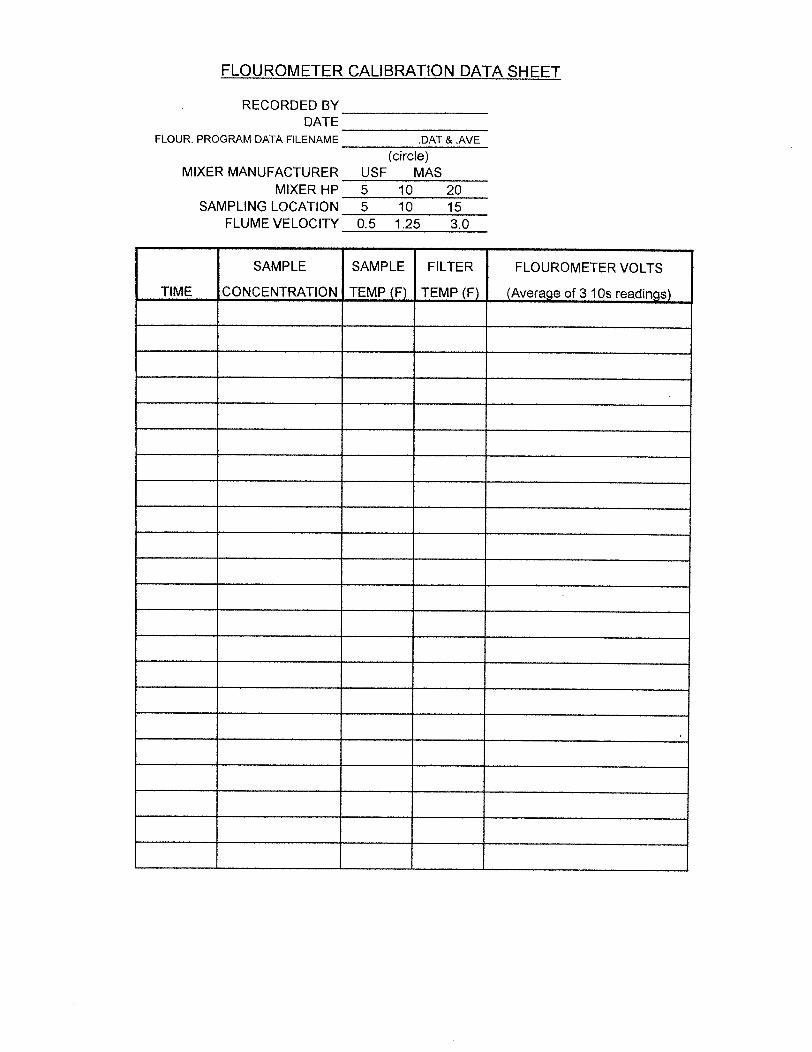
FLOUROMETER CALIBRATION DATA SHEET
RECORDED BY ___________ __ DATE ___________ __
FLOUR. PROGRAM DATA FILENAME ____ ___:.:.D::.:.A..:..:..T-=:&..::...A..:..:..VE=-
(circle) MIXER MANUFACTURER __ ..::..US.::...:F __ _..:..:..M:;...;A;.;;..S __
MIXER HP __ 5;:__ __ 1:...::0_--=2..::..0_ SAMPLING LOCATION _5;:__--.....:1:...::0_.--:.1-=-5-
FLUME VELOCITY 0.5 1.25 3.0
SAMPLE SAMPLE FILTER
TIME CONCENTRATION TEMP (F) TEMP (F)
FLOUROMETER VOLTS
(Averaqe of 3 10s readings)

APPENDIXC
MEASUREMENT UNCERTAINTY
OF TRACER CONCENTRATION AND FLUME VELOCITY

APPENDIXC
MEASUREMENT UNCERTAINTY
OF TRACER CONCENTRATION AND FLUME VELOCITY
1. TRACER CONCENTRATION MEASUREMENT UNCERTAINTY
Estimates of precision indices were made from measurement standard deviations, while bias
uncertainties are estimated from comparative tests and experience. Bias and precision components
are propagated separately from the individual measurements to the final result. Elementary error
source uncertainties for each component are combined by the root sum square (RSS) method.
Precision uncertainty is estimated as the precision index (estimated by the standard deviation of the
test data) multiplied by the Student t factor. The Student t factor corrects the standard deviation
calculated using the limited number of measurements in the sample to estimate the standard deviation
of a population having an infinite number of points. The overall uncertainty of the result is reported
as the sum ofthe bias and precision uncertainties at 95 percent confidence level.
Water Quality
A potential source of uncertainty in the sample concentration measurements is the effect of variable
water quality including suspended solids on fluorescence. The effect is minimized by preparing
calibration samples with site water at the same time as the flow measurement is conducted. This
procedure takes into account the actual water quality and possible degradation of the tracer with time.
However, the calibration samples are not integrated over the entire time period of the sample
measurement so that water quality changes may occur which are not compensated by the calibration
solutions. A bias uncertainty of2 percent is estimated for changes in water quality during a test from
the water quality used in calibration sample construction.

Injection Flow Uncertainty
Injection mass flow was determined by the volumetric method, that is, measurement of the time
required to inject a given volume times the density of the dye.
Mi= V. P· I I
Bias elementary error sources in the injection flow measurement include temperature effects on the
volume determination, temperature effects on the density determination, and time measurement.
Precision uncertainties also occur in the time and temperature measurements. Using the average
standard deviation of the dye injection flow measurements, the time precision index was estimated
at 0.14 percent. The time measurement bias uncertainty was estimated from manufacturer's
specifications and calibrations at 0. 01 percent. The maximum range of the dye temperatures, 5o F,
was used to determine a density precision index of 0.03 percent (density from Reference 1).
Experiments at Alden on the measuring flasks determined the flask volume rate of change with the
temperature to be 0.002 percent per degree. Calculations using the thermal expansion rate of the
glass used in the flasks confirmed the experimental results. The minimum ambient temperature of
about 40 o F resulted in a 20 o F variation from standard temperature ( 60 o F) which causes a volume
bias uncertainty of 0. 04 percent. A 2 o F temperature measurement bias results in a 0. 01 percent
density bias uncertainty. Table C1 summarizes and combines the uncertainty estimates for the
elementary error sources.
TABLECl
INJECTION FLOW UNCERTAINTIES(%)
Elementary Error Source Bias Precision
Volume; Manufacturer Specification 0.10 NA
Temperature (20° F Variation from 60° F) 0.04 NA
Density 0.01 0.03
Time 0.01 014
Root Sum Square (RSS) 0.019 0.143
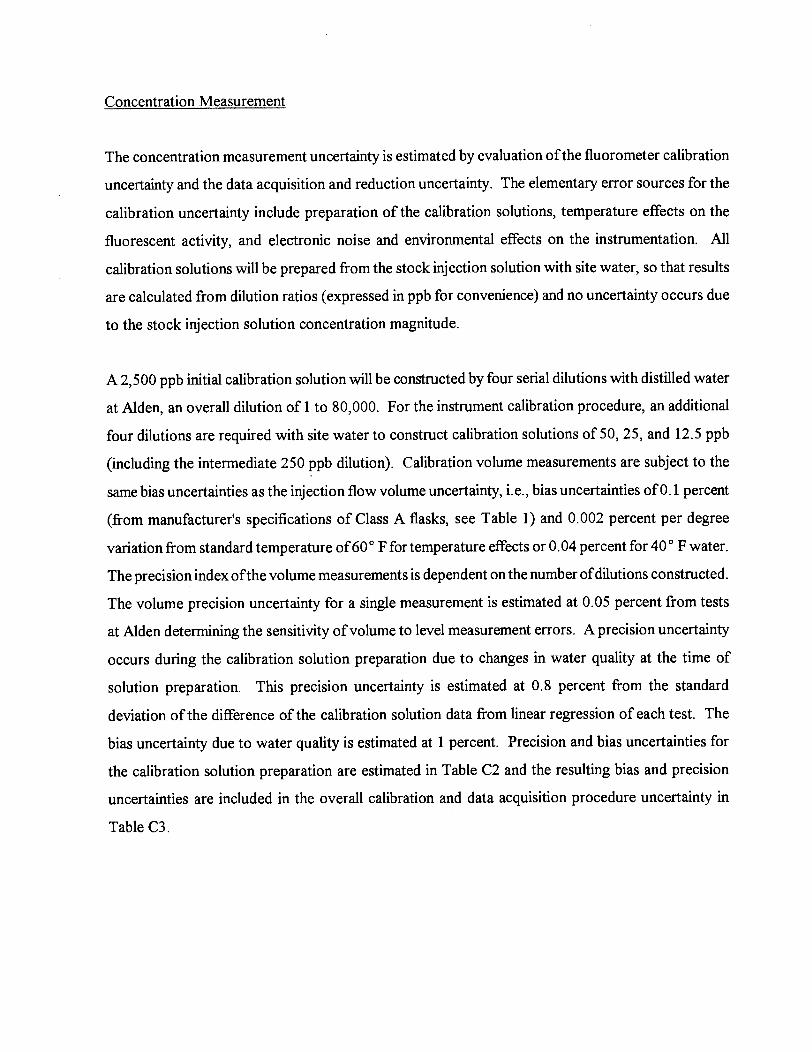
Concentration Measurement
The concentration measurement uncertainty is estimated by evaluation of the fluorometer calibration
uncertainty and the data acquisition and reduction uncertainty. The elementary error sources for the
calibration uncertainty include preparation of the calibration solutions, temperature effects on the
fluorescent activity, and electronic noise and environmental effects on the instrumentation. All
calibration solutions will be prepared from the stock injection solution with site water, so that results
are calculated from dilution ratios (expressed in ppb for convenience) and no uncertainty occurs due
to the stock injection solution concentration magnitude.
A 2,500 ppb initial calibration solution will be constructed by four serial dilutions with distilled water
at Alden, an overall dilution of 1 to 80,000. For the instrument calibration procedure, an additional
four dilutions are required with site water to construct calibration solutions of 50, 25, and 12.5 ppb
(including the intermediate 250 ppb dilution). Calibration volume measurements are subject to the
same bias uncertainties as the injection flow volume uncertainty, i.e., bias uncertainties of0.1 percent
(from manufacturer's specifications of Class A flasks, see Table 1) and 0.002 percent per degree
variation from standard temperature of60° F for temperature effects or 0.04 percent for 40° F water.
The precision index of the volume measurements is dependent on the number of dilutions constructed.
The volume precision uncertainty for a single measurement is estimated at 0.05 percent from tests
at Alden determining the sensitivity of volume to level measurement errors. A precision uncertainty
occurs during the calibration solution preparation due to changes in water quality at the time of
solution preparation. This precision uncertainty is estimated at 0. 8 percent from the standard
deviation of the difference of the calibration solution data from linear regression of each test. The
bias uncertainty due to water quality is estimated at 1 percent. Precision and bias uncertainties for
the calibration solution preparation are estimated in Table C2 and the resulting bias and precision
uncertainties are included in the overall calibration and data acquisition procedure uncertainty in
Table C3.

TABLEC2
CALffiRA TION SOLUTION PREPARATION UNCERTAINTY(%)
Elementary Error Source Bias Precision
Calibration Solution
Initial Volumes ( 4) Measurements 0.10 0.09
Temperature (20° F Variation from 60° F) 0.04 NA
Solution Volumes ( 4) Measurements 0.10 0.07
Temperature (20° F Variation from 60° F) 0.04 NA
Water Quality 1.0 0.8
Root Sum Square (RSS) 1.01 0.81
The calibration and sample analysis procedure elementary error sources and their estimated certainties
are listed in Table C3. Fluorescence intensity is dependent on temperature and, a temperature
correction is used in concentration measurement has the form given by Equation (3 ), Section 4. 4 .1.
Therefore, the sensitivity of the concentration measurement to temperature measurement is
1. 44 percent times the deviation in temperature in degrees F. The temperature measurement bias
uncertainty due to environmental effects on the thermometer is estimated at 0.1 o F from the
manufacturer's specifications, which results in a fluorescence bias uncertainty of 0.14 percent. The
temperature measurement precision index is taken to equal the resolution ofthe thermometer, 0.1 oF,
resulting in a fluorescence precision index of 0.14 percent for fluorescence.
The fluorometer has inherent electronic noise, which has been evaluated by determining the precision
index of the output voltage of the calibration samples and the test samples at a cop.stant temperature.
The voltage precision index was minimized by averaging the output for about one half minute. The
average precision index used for all the samples will be 0.3 percent.
Environmental effects on the fluorometer output are caused by temperature changing the transmission
coefficient of a critical filter. The transmission coefficient has been estimated to change by
0.10 percent per degree from measurements at Alden. The filter temperature will be monitored

during calibration and analysis, and assuming that the maximum difference during any test is 1. 5o F,
resulting in a bias uncertainty on concentration measurement of 0.13 percent. If this is found, no
corrections will be made to calibration results for filter temperature variations.
The bias and precision uncertainties due to the measurement of temperature, for the correction of
temperature effect on fluorescence, are estimated from a temperature measurement precision index
of o.r F, which results in a concentration precision index of 0.14 percent and temperature
measurement bias uncertainty of 0.05° F. This results in a concentration bias uncertainty of
0.07 percent. The temperature correction coefficient, k in Equation (2), is an average value.
Experiments at Alden have shown that the value is less than 5 percent in error, so that if the maximum
temperature corrections used is about 3.5° F, the bias uncertainty in concentration due to the
coefficient is estimated at 0.25 percent (5 percent ofthe correction for 3.5° F, which is 5 percent).
TABLEC3
CONCENTRATION MEASUREMENT UNCERTAINTY(%)
Elementary Error Source Bias Precision
Calibration Solution (from Table C2) 1.01 0.81
Fluorescence Temperature (3.5° F) 0.25 0.1
Filter Temperature Effects (1.4 o F) 0.13 NA
Averaging Precision NA 0.3
Root Sum Square (RSS) 1.05 0.87
Total Concentration Uncertainty
Table C4 summarizes the RSS bias and precision uncertainties for the four components of the sample
concentration measurement, data acquisition, and reduction. Bias and precision uncertainties are
combined by assigning a Student t factor to the precision indices to attain the 95 percent confidence
level. A Student t of 2 may be assigned to achieve the 95 percent confidence level, if either the
number of measurements for the precision index was greater than 20 or half the range was used.

TABLEC4
SUMMARY OF UNCERTAINTIES - CONCENTRATION MEASUREMENT(%)
Elementary Error Source Bias Precision
Injection Flow 0.11 0.14
Water Quality 2 NA
Data Acquisition and Reduction 1.05 0.87
Root Sum Square (RSS) 2.24 0.88
The estimated overall flow measurement uncertainty is 2.85 percent at the 95 percent confidence
level i.e., [2.242 + (2 x (0.88?]112•
2. FLUME VELOCITY MEASUREMENT UNCERTAINTY
The flume velocity is a function of the flume flow divided by the flume cross-sectional area. The
three test flume velocities will be established by setting the weir elevation to a calibrated position, and
adjusting the inflow until the desired water level is attained. For calibration, the elevation of the weir
will be adjusted until the (measured) average velocity (0.5, 1.25, 3.0 ftlsec) and required depth (7ft)
is attained. Thereafter, the test velocities will be set by positioning the weir and adjusting the inflow
to bring the water level to 7 ft.
The uncertainty of flume velocity, therefore, is a function of:
1. The calibration of weir position with the velocity traverses
2. Weir position measurement
3. Water level measurement

Velocity Traverse Uncertainty
Velocity Instrument
The velocity traverse will be conducted using a SonTek Acoustic Doppler Velocity (ADV) meter.
From the manufacturers specifications, the instrument resolution is 0.1mm/s, which results in a
precision index of0.07 and the meter has a velocity bias of0.5 percent.
Point Velocities
The uncertainty in the measured velocity is the sum of several elementary sources. While the average
flow in the measured section may be assumed to be constant over the (weir calibration) test period,
the velocity at any point in the flow will have a fluctuating component. A measurement averaging
period of 120 seconds was chosen to approximate the true average velocity according to Reference 1.
The average flume velocity will be determined by averaging 49 measured point velocities taken at a
cross-section upstream of the mixer location. Two minute samples will be recorded at a sampling
frequency of 10 hz for a 1,200 data set at each point. The point velocity precision index will be
estimated using the average standard deviation of each of the 49 point velocity measurements. From
the 0.5 ftlsec flume velocity traverse (available from CAFRC), the point velocity precision index is
estimated to be 0.23 percent. Bias uncertainty for the individual points is the same as the instrument
uncertainty above.
Data Reduction
The flume velocity will be calculated by averaging the forty nine point velocities. The precision
uncertainty in this average is due to the size of the data set and the standard deviation of each point
with respect to the overall average. From the 0.5 ftlsec flume velocity traverse (available from
CAFRC), the traverse velocity precision index is estimated to be 0.36 percent.

TABLE CS
VELOCITY TRAVERSE UNCERTAINTY(%)
Elementary Error Source Bias Precision
Instrument 0.5 0.07
Point Velocities NA 0.23
Averaging Precision NA 0.36
Root Sum Square (RSS) 0.5 0.43
Table C5 summarizes the RSS bias and precision uncertainties for the three components of the flume
velocity measurement.
Weir Position Uncertainty
The weir location will be measured using an angle transmitter located on the face of the weir. The
angle transmitter signal will be correlated to the weir crest elevation which will be measured using
an optical level and staff referenced to the floor of the flume. Sources of error in setting the weir
include; calibration to weir elevation, transmitter resolution and repeatability, and stability of the weir
when loaded (with water).
Using the manufacturers specifications, and the results of the calibration, the estimated precision
index of angular position is 0.29 percent and bias is negligible. The transmitter signal was acquired
using a PC. The precision index of the 8 point calibration (curve fit) of transmitter signal to weir
elevation, based on the average standard deviation of the predicted (curve fit) elevation to the
measured values is 0.20 percent. The calibration bias is negligible. The same PC and acquisition
software used to calibrate the transmitter will be used during testing. Monitoring the angle
transmitter for several hours while the velocity traverse measurements were being collected, CAFRC
personnel reported (recorded) virtually no change in indicated weir elevation, meaning that
structurally the weir was stable under load.
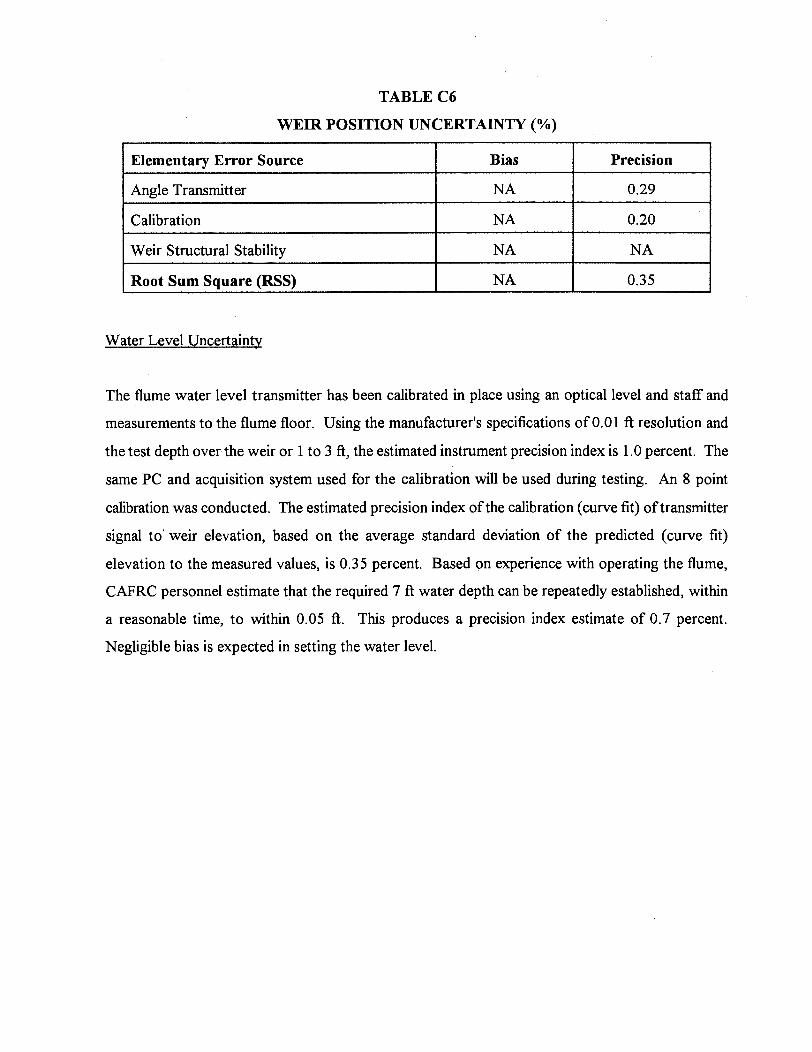
TABLEC6
WEIR POSITION UNCERTAINTY(%)
Elementary Error Source Bias Precision
Angle Transmitter NA 0.29
Calibration NA 0.20
Weir Structural Stability NA NA
Root Sum Square (RSS) NA 0.35
Water Level Uncertainty
The flume water level transmitter has been calibrated in place using an optical level and staff and
measurements to the flume floor. Using the manufacturer's specifications of0.01 ft resolution and
the test depth over the weir or 1 to 3 ft, the estimated instrument precision index is 1. 0 percent. The
same PC and acquisition system used for the calibration will be used during testing. An 8 point
calibration was conducted. The estimated precision index of the calibration (curve fit) of transmitter
signal to' weir elevation, based on the average standard deviation of the predicted (curve fit)
elevation to the measured values, is 0.35 percent. Based on experience with operating the flume,
CAFRC personnel estimate that the required 7 ft water depth can be repeatedly established, within
a reasonable time, to within 0.05 ft. This produces a precision index estimate of 0.7 percent.
Negligible bias is expected in setting the water level.

TABLEC7
WATER LEVEL UNCERTAINTY (%)
Elementary Error Source Bias Precision
Float NA 1.00
Calibration NA 0.35
Repeatability NA 0.7
. ·' 1 Root Sum Square (RSS J NA 1 'l ~ .... 0
Total Velocity Uncertainty
Table C8 summarizes the RSS bias and precision uncertainties for the three primary components
involved in setting the flume velocity; velocity traverse used to locate the weir elevation, weir
position, and water level. Bias and precision uncertainties are combined by assigning a Student t
factor to the precision indices to attain the 95 percent confidence level. Because the number of
measurements used in the calibrations, a student t of 2.3 was assigned to achieve the 95 percent
confidence level.
Elementary Error Source
Velocity Traverse
Weir Position
Water Level
Root Sum Square (RSS)
TABLEC8
FLUME VELOCITY (%)
Bias
0.5
NA
NA
0.5
Precision
0.43
0.35
1.30
1.41
The estimated overall velocity measurement uncertainty is 3.33 percent at the 95 percent confidence
level, i.e., (0.52 + (2.3 * 1.432Y12.

REFERENCE
[1] "Jet Injections of Optimum Mixing in Pipe Flow," Fitzgerald, S.D. and Holley, E.R.,
University oflllinois at Urbana-Champaign, Research Report No. 144, December, 1979.
APPENDIXD
ALDEN GENERAL QA PLAN

ALDEN RESEARCH LABORATORY, INC. QUALITY ASSURANCE PROGRAM
1. 0 Organization and Personnel
1.1 Alden General Organization
The Alden President has ultimate responsibility for the technical, fiscal, and contractual aspects of all studies conducted at Alden. Responsibility for technical aspects of a study is delegated to a Vice President or a senior level engineer, who will serve as the Principal Investigator of the study.
The various support services report to a combination of the President and various Vice Presidents.
1.2 Project Organization and Personnel Responsibilities
The Principal Investigator is directly responsible to the Purchaser for conducting the study. The Principal Investigator is responsible for activities such as planning, designing, testing, and reporting for the project. Other engineers and technical assistants, if assigned to the study, report directly to the Principal Investigator.
The Quality Assurance Program will be implemented by the Principal Investigator through the supervisory chain. The Principal Investigator shall have the responsibility of issuing a written stop work order whenever any work in progress is not in accordance with the project specification or the Alden Quality Assurance Program.
The Principal Investigator shall have the responsibility of training all personnel assigned to the project with respect to implementation ofthe Alden Quality Assurance Program.
Services required for proper and timely execution of the study, such as instrumentation, crafts, and graphic arts, are requested directly by the Principal Investigator from the desired services unit. The Vice President supervising that service becomes involved if conflicts in priorities arise.

2. 0 Records and Documents
2.1 Routing and Recording Incoming and Outgoing Correspondence
All incoming correspondence for the study will be received by or routed to the Alden Main Office. At the Main Office, the original will be stamped "file copy," copied, and the original filed in the Central File. The Principal Investigator and President will be provided copies. At the discretion of the Principal Investigator, additional copies will be provided to other key personnel. Action items will be marked as such and the action assigned.
All outgoing correspondence will be mailed by the Alden Main Office. Copies will be maintained in the Central File and copies provided to the originator, Principal Investigator, and President.
Telephone conversations related to the project will be documented with notes.
2.2 File System
A Central File will be maintained in the Alden Main Office under client name and job code. All originals of incoming correspondence and copies of all outgoing correspondence will be kept in this file, with the possible exception of drawings, see Section 2.3. Copies of appropriate project drawings, calculations, computer disks and data will be entered in the Central File upon completion of the study.
The Main Office head secretary will have responsibility for maintenance of the Central File system.
2.2.1 Distribution
Copies of the Quality Assurance Manual will be maintained at the following locations:
1. One copy in the Central File,
2. One copy in the Principal Investigator's office,
3. One copy at the Alden job site,
4. One copy is sent to the Purchaser (additional copies may be issued to the Purchaser upon request).
All copies will receive any revisions made to the QA Manual.

2.3 Drawings
Drawings received by Alden from the Purchaser will be transmitted to the Principal Investigator. If two copies of drawings are received, one copy will be maintained in the Central File.
A copy of relevant internally generated drawings will be filed in the Project Notebook or in the Central File, all such drawings eventually being retained in the Alden storage area.
Project drawings will be numbered, and a log of project drawing numbers will be maintained by the Principal Investigator or his authorized agent. Revisions will be recorded on the log of project drawings.
2.4 Study Documents
2.4.1 Log Book
The Project Log Book will be kept at the experimental facility while conducting experimental studies. The Project Log Book will contain a daily record of all activities during the test program. Data recorded on data sheets, computer printouts, etc., shall be assigned a sequential test number and a document number, which will be referenced in the daily log. It is not necessary that all data and pertinent drawings be bound in the Project Log Book, but they must be referenced in the log and maintained as part of the project documentation.
2.4.2 Computer Disks
Removable computer disks that are used to store study results will be identified by project name, the Alden project code, the test number, and a document number. An entry identifYing the disk will be made in the test log. Such disks will be stored as part of the project file in the Central File at the end ofthe study.
2.5 File Retention
Upon completion of the project, all pertinent data and drawings generated by the project, including hard copies of computer data and portable disks, will be placed in a common storage box(es). The storage box will be placed in a designated Alden storage area for retention. The Central File maintained in the Main Office will be retained at that location for a period of one year after project completion. Subsequently, the Central File will also be placed in the common storage box for the study.
2.6 Revisions
If a design calculation or drawing requires revision, a new document will be originated under the requirements of Section 3.0. In addition, the new document shall include the phrase "revision of document" and the superseded document number. The original document shall have the phrase "revised" and the superseding document number added with the initials of the Principal Investigator and the date.
Revisions of a test procedure or calibration procedures will include a revision number. The Principal Investigator will have the responsibility to transmit the requisite procedures to the test operator. \Vhen a procedure revision is implemented, the revision number and implementation date will be recorded in the test log.

3.0 Design
3.1 Applicable Standards, Criteria, Specifications
Any design memorandum issued by the Principal Investigator will list applicable published and generally available standards, codes, criteria, and specifications. The design memorandum will indicate where copies of such applicable criteria are filed, which sections are to be applied to the design, and which criteria apply to specific design phases and facility components.
If any changes or deviations from applicable standards are made during the facility design, these shall be documented by a memo of change, to be approved by the Principal Investigator.
3.2 Design Process
Standard Alden calculation sheets will be used to perform manual calculations. Sources of input data, factors, equations, etc., will be identified and referenced to provide traceability. Assumptions will be identified. The object of the calculations will be stated, and the conclusions highlighted or set aside. All design drawings, calculations, graphs, and other design documents will be identified by appropriate project and subject titles, and be dated, initialed, and numbered by the originator.
3.3 Review Requirements
At the completion of the design of each component of the project, the Principal Investigator or his authorized agent will review and initial critical drawings and calculations for the component reviewed.
An authorized reviewer will be in the position of Engineer or higher. In no case will review by the originator be considered acceptable. (This does not preclude review by the originator prior to second party review.) If the reviewer notes any error, these will be discussed with the preparer, and if changes or corrections are agreed to by both parties, those changes or corrections will be made in another color by the reviewer. Completion of the review will be indicated on each reviewed document by the initials ofthe reviewer and the date reviewed.
4.0 Construction
4.1 Review ofTest Equipment and Components
Components will be inspected and checked for accuracy after completion. The test facility will be inspected immediately upon completion to ensure conformance to design. The reviewer will be the Principal Investigator or his authorized agent.
4.2 Review Requirements
The component and test facility reviews will verifY conformance to design. The value of measured dimensions will be recorded on a copy of the appropriate design drawing by the reviewer. The drawing copy will be dated and initialed by the reviewer. In the case of discrepancies beyond mutually agreed upon tolerances, the appropriate changes will be made, and the drawing copy will be marked to reflect as-built conditions.
4. 3 Review Report
The reviewer will make an entry in the project log book to reflect review findings. The work order will be initialed and dated by the reviewer to indicate that the component or installation is complete and in accordance with the design.
The reviewed and initialed design drawing copies marked with as-built dimensions (if different than those shown) will be retained in the Project Notebook.

5. 0 Instrumentation/Equipment
5.1 Calibration Procedure Requirements
• Each instrument in the calibration program will bear a unique number, date of last calibration, and initials of person performing calibration.
• All resulting calibration sheets and plots will be dated and numbered. Each data calculation involving an instrument calibration shall reference the appropriate numbered calibration form.
5.2 Equipment/Material Purchases
If Alden purchases any equipment or non-expendable materials from outside sources (vendors) for use in the model study, the vendor QA Program will be revised to involve appropriate QA requirements on their suppliers. No QA program will be necessary for expendable materials.
5.3 Computer Software
If any software programs other than commercially available programs (e.g., Quattro Pro, Lotus) are used in conjunction with the model study, Alden's QA program will be revised to add provisions for verification and validation of the software. Use of computer software, other than spreadsheets, is generally not anticipated.

6.0 Operation and Testing (including computer analysis)
6.1 Test Plan Report
Prior to commencement of the test program, a Test Plan Report will be written, which will, as a minimum, include:
• A statement of the test purpose
• A description of all variables which are to be controlled
• A description of the physical parameters to be measured
• A description of the necessary instrumentation
• A description of the operational sequence of events required
• A description of the procedures for data retrieval
Model parameters relevant to a specific test, such as water level, flow rates, and special model geometry, will be defined by the Principal Investigator or his authorized agent and transmitted to the model operator. A unique test number will be assigned, and the test order will become a permanent part of the test log.
The Test Plan Report will be reviewed and approved by the client. Copies of the Test Plan Report will be available at the experimental facility.
6.2 Data Retrieval Procedures
Standard Alden sheets and log books will be used to record data. All data will be recorded in a clear, legible manner and properly formatted, as appropriate. The data set for each test will be identified by, as a minimum, the following general information:
• Job name and number
• Sponsor
• Test number
• Title of test
• List of instruments used (serial numbers)
• Special test procedures

• Data recorder initials
• Data reviewer initials
• Date
6.3 Data Reduction and Analysis
Standard Alden calculation sheets will be used to perform data analysis. Sources of input data, calibration factors, equations, etc., will be identified and referenced to provide traceability. Assumptions will be identified. The preparer will initial, number, and date all pages, and identify each document by appropriate project and subject titles. If computer analysis is used, then a copy of the printout will be attached to the calculation sheet. This copy will be clearly marked to identify the program and filename used.
In cases where a number of minor calculations are required, several may be done on one sheet provided they are clearly identifiable.
6.4 Reporting ofData
Normal Alden procedures will be used in preparing reports. Tables, figures, and graphs will be checked for accuracy by the Principal Investigator or his authorized agent.
All reports will be reviewed by the Principal Investigator in draft form prior to being submitted to the Purchaser for review. Review completion will be noted by initials of the reviewer and date on the draft copy filed in the Central File. Comments will be evaluated and incorporate.d when appropriate. Final reviews will be conducted prior to and after printing.
6.5 Test Review Procedures
Audits, accomplished by the Principal Investigator, will verify the test parameter setup, and these audits will be recorded, including signature and date. Nonconformance and required remedial action will be noted.
As soon as possible after a data sheet has been completed, it will be reviewed. The review, conducted to check accuracy and completeness, will be indicated by the signature of the reviewer and the review date.
Data analysis calculations will be reviewed in a similar manner. The review will take place as soon as possible after calculation completion and before any use is made of the calculation conclusions for further study or reporting.