Embed Size (px)
Citation preview

Verification of high energy photon
therapy based on PET/CT imaging of
photonuclear reactions
Sara Janek Strååt


© Sara Janek Strååt, Stockholm 2012
ISBN 978-91-7447-461-9
Printed in Sweden by Universitetsservice US-AB, Stockholm
2012
Distributor: Department of Physics, Stockholm University


Till Jacob


Life is too short to wake up with regrets.
Love the people who treat you right.
Forget about the ones who don’t.
Believe everything happens for a reason.
If you get a second chance, grab it with both hands.
If it changes your life, let it.
Nobody said life would be easy.
They just promised it would be worth it.
Author Unknown

i
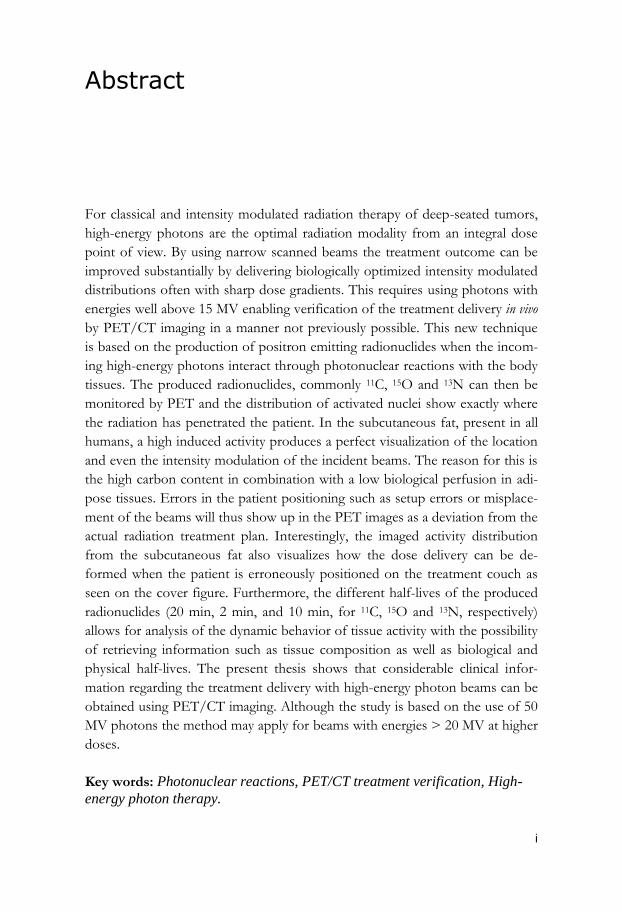
Abstract
For classical and intensity modulated radiation therapy of deep-seated tumors,
high-energy photons are the optimal radiation modality from an integral dose
point of view. By using narrow scanned beams the treatment outcome can be
improved substantially by delivering biologically optimized intensity modulated
distributions often with sharp dose gradients. This requires using photons with
energies well above 15 MV enabling verification of the treatment delivery in vivo
by PET/CT imaging in a manner not previously possible. This new technique
is based on the production of positron emitting radionuclides when the incom-
ing high-energy photons interact through photonuclear reactions with the body
tissues. The produced radionuclides, commonly 11C, 15O and 13N can then be
monitored by PET and the distribution of activated nuclei show exactly where
the radiation has penetrated the patient. In the subcutaneous fat, present in all
humans, a high induced activity produces a perfect visualization of the location
and even the intensity modulation of the incident beams. The reason for this is
the high carbon content in combination with a low biological perfusion in adi-
pose tissues. Errors in the patient positioning such as setup errors or misplace-
ment of the beams will thus show up in the PET images as a deviation from the
actual radiation treatment plan. Interestingly, the imaged activity distribution
from the subcutaneous fat also visualizes how the dose delivery can be de-
formed when the patient is erroneously positioned on the treatment couch as
seen on the cover figure. Furthermore, the different half-lives of the produced
radionuclides (20 min, 2 min, and 10 min, for 11C, 15O and 13N, respectively)
allows for analysis of the dynamic behavior of tissue activity with the possibility
of retrieving information such as tissue composition as well as biological and
physical half-lives. The present thesis shows that considerable clinical infor-
mation regarding the treatment delivery with high-energy photon beams can be
obtained using PET/CT imaging. Although the study is based on the use of 50
MV photons the method may apply for beams with energies > 20 MV at higher
doses.
Key words: Photonuclear reactions, PET/CT treatment verification, High-
energy photon therapy.

ii
iii
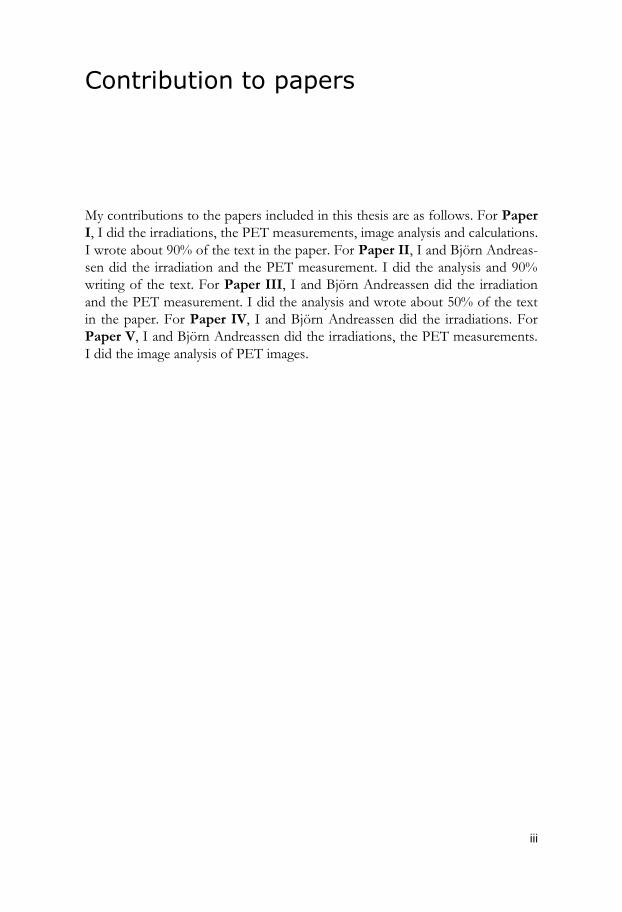
Contribution to papers
My contributions to the papers included in this thesis are as follows. For Paper
I, I did the irradiations, the PET measurements, image analysis and calculations.
I wrote about 90% of the text in the paper. For Paper II, I and Björn Andreas-
sen did the irradiation and the PET measurement. I did the analysis and 90%
writing of the text. For Paper III, I and Björn Andreassen did the irradiation
and the PET measurement. I did the analysis and wrote about 50% of the text
in the paper. For Paper IV, I and Björn Andreassen did the irradiations. For
Paper V, I and Björn Andreassen did the irradiations, the PET measurements.
I did the image analysis of PET images.

iv
v
List of papers
This thesis is based on the following papers, which are referred to in the text by
their Roman numerals.
I. Janek S, Svensson R, Jonsson C and Brahme A 2006 Development of
dose delivery verification by PET imaging of photonuclear reactions
following high energy photon therapy Phys. Med. Biol. 51 5769-5783
II. Janek Strååt S, Andreassen B, Jonsson C, Noz M E, Näfstadius P,
Näslund I, Schoenahl F and Brahme A 2011 Clinical application of in
vivo treatment delivery verification based on PET/CT imaging of
positron activity induced at high energy photon therapy Submitted to
Phys. Med. Biol.
III. Janek Strååt S, Jacobsson H, Andreassen B, Näslund I and Jonsson C
2012 Dynamic PET/CT measurements of induced positron activity
in a prostate cancer patient after 50 MV photon radiation therapy.
Submitted to J. Nucl. Med.
IV. Andreassen B, Janek Strååt S, Holmberg R, Näfstadius P and Brahme
A 2011 Fast IMRT with narrow high energy scanned photon beams
Med. Phys. 38 4774-4784
V. Andreassen B, Holmberg R, Brahme A and Janek Strååt S 2012
PET/CT measurements and GEANT4 simulations of the induced
positron activity by high energy scanned photon beams To be submitted
Reprints with permission from the publishers.

vi
vii
Contents
1 Introduction ............................................................................................ 1
2 Photonuclear activation in high energy photon therapy ............ 7 2.1 Photonuclear reaction cross sections in tissue .......................................... 7 2.2 The photon energy fluence spectrum of the accelerator ......................... 9 2.3 Produced positron emitter activity in tissue ............................................ 11 2.4 Activation measurements with PET ........................................................... 12 2.5 Early tissue activation studies .................................................................... 12 2.6 Production of positron emitters in pharmaceuticals ............................... 13
3 PET and PET/CT imaging in oncology .......................................... 14 3.1 Hybrid PET imaging ...................................................................................... 14 3.2 Tumor imaging .............................................................................................. 15 3.3 The use of PET/CT for tumor delineation and target volume definition
16 3.4 Treatment verification in vivo for high energy photon therapy ........... 17 3.5 BIOART: The use of PET/CT imaging to biologically optimize the
treatment .................................................................................................................. 20
4 Clinical applications: In vitro and in vivo studies ...................... 21 4.1 In vitro study ................................................................................................. 21
4.1.1 PMMA phantom ..................................................................................... 21 4.1.2 Frozen hind leg of a pig ......................................................................... 22
4.2 In vivo study: Patients 1&2 ........................................................................ 22 4.2.1 Patient1 ................................................................................................. 23 4.2.2 Patient 2 ................................................................................................ 24 4.2.3 Summary ............................................................................................... 25
4.3 In vivo study: Patient 3&4 .......................................................................... 26 4.3.1 Patient 3 ................................................................................................ 26 4.3.2 Patient 4 ................................................................................................ 27
5 Validation using Monte Carlo simulations ................................... 30 5.1 Experimental measurements ...................................................................... 30 5.2 Geant4 simulations ....................................................................................... 31
6 Conclusions and outlook ................................................................. 33
7 Summary in Swedish ....................................................................... 36

viii
Acknowledgements ................................................................................... 38
References .................................................................................................. 40
ix
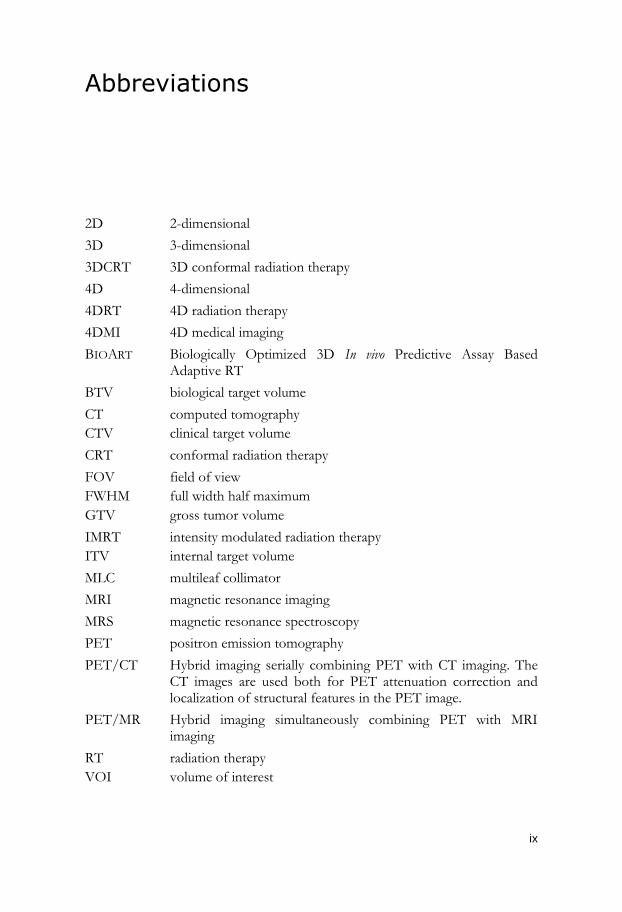
Abbreviations
2D 2-dimensional
3D 3-dimensional
3DCRT 3D conformal radiation therapy
4D 4-dimensional
4DRT 4D radiation therapy
4DMI 4D medical imaging
BIOART Biologically Optimized 3D In vivo Predictive Assay Based Adaptive RT
BTV biological target volume
CT
CTV
computed tomography
clinical target volume
CRT conformal radiation therapy
FOV
FWHM
GTV
field of view
full width half maximum
gross tumor volume
IMRT
ITV
intensity modulated radiation therapy
internal target volume
MLC multileaf collimator
MRI magnetic resonance imaging
MRS magnetic resonance spectroscopy
PET positron emission tomography
PET/CT Hybrid imaging serially combining PET with CT imaging. The CT images are used both for PET attenuation correction and localization of structural features in the PET image.
PET/MR Hybrid imaging simultaneously combining PET with MRI imaging
RT
VOI
radiation therapy
volume of interest

x
1
1 Introduction
Cancer is a very common disease. During their lifetime, about one out of three
individuals is eventually diagnosed with cancer. Today in the western world
roughly half of these will die from their disease. According to the World Health
Organization (Jemal et al. 2011) cancer is the leading cause of death in the eco-
nomically developed countries and the second leading cause of death in devel-
oping countries. Furthermore, as the global burden of cancer continues to in-
crease due to the growth and aging of the world population and due to other
factors such as smoking, there is a continuously increasing need for better diag-
nostic tools and improved treatment techniques. Radiation therapy (RT) is a
treatment technique that generally more than half of all cancer patients receive.
The aim of RT is to achieve tumor eradication while keeping the dose to critical
tissues low enough to minimize the risk of severe complications. While RT
improves the quality of life of cancer patients through the delivery of geometri-
cally accurate conformal deposition of energy from ionizing radiation, much
can still be done to achieve even better patient outcome. As in any complex
process, the quality of the treatment is affected by numerous factors, one of
which is the uncertainty associated with the delivery of the dose with high accu-
racy to the intended target, seen in Figure 1, during the course of RT. This the-
sis will focus on new methods of verification that the prescribed dose is actually
delivered to the target volume.
The goal of radiation therapy is to deliver as high a conformal dose of radia-
tion as possible to a clinical target while keeping the dose to other regions and
organs as low as possible. For this purpose, new technologies for treatment
verification are constantly emerging and being implemented in the clinic. A
change in practice came about 20 years ago when 2-dimensional (2D) radiation
therapy (2DRT) was abandoned in favor of the 3-dimensional (3D) treatment
planning/conformal therapy (3DCRT) approach. Standardized beam arrange-
ments (i.e., 4 field box technique) were replaced by an increased number of
radiation beams in order to conform the dose to the target volume and to avoid
(or minimize) irradiation of normal tissue. A major change in our ability to cure
patients was introduced by inverse therapy planning either through physically
and not least biologically optimized intensity modulated radiation therapy
(IMRT). By optimally modulating the photon fluence in the beam, using either
2
a multileaf collimator (MLC) or scanned pencil beams, an even greater dose
conformity could be achieved (Brahme 1982). However, due to the strong in-
tensity modulation, IMRT treatments are more sensitive to beam placement,
patient positioning, tumor localization, and motion uncertainties than 2DRT
and 3DCRT approaches. Furthermore, advanced irradiation techniques using
narrow scanned photon beams or light and heavy ion therapy allow even higher
dose conformity to the target and a sharp dose gradient at the edge of the tar-
get. However, it also necessitates the verification of the accuracy in depositing
the dose within the identified volumes as well as monitoring the changes to the
tumor and organs during the treatment. Therefore, new techniques to account
for and to compensate for changes occurring either during the delivery of a
fraction1 of radiation (intra-fractional) or between successive fractions (inter—
fractional) have been developed.
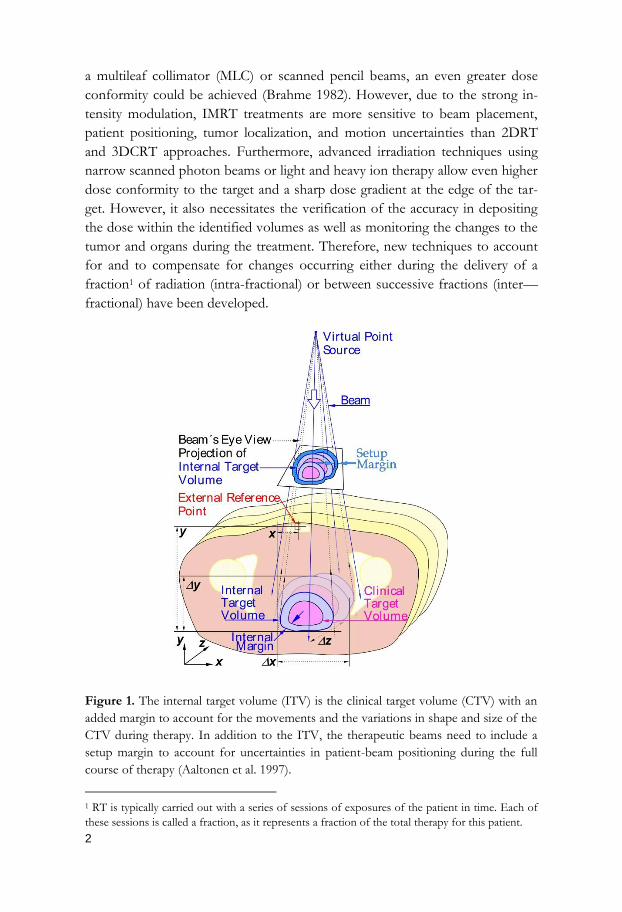
Figure 1. The internal target volume (ITV) is the clinical target volume (CTV) with an
added margin to account for the movements and the variations in shape and size of the
CTV during therapy. In addition to the ITV, the therapeutic beams need to include a
setup margin to account for uncertainties in patient-beam positioning during the full
course of therapy (Aaltonen et al. 1997).
1 RT is typically carried out with a series of sessions of exposures of the patient in time. Each of
these sessions is called a fraction, as it represents a fraction of the total therapy for this patient.
3
A technology developed for overcoming the challenges regarding the in-
tra-fraction motion due to respiratory and gastrointestinal motion is
4-dimensional (4D) RT (4DRT), as this approach explicitly include time infor-
mation (Shirato et al. 2000; Shimizu et al. 2000). Current 4DRT focuses on
respiratory motion and utilizes deformable registration in order to reduce (both
systematic and random) geometrical errors, either by tracking the target volume
or gating the beam on the basis of image-guidance technology (Murphy 1997;
Verellen et al. 2006). Apart from techniques to image and describe motion,
different methods have been developed for motion management during treat-
ment. These include shallow breathing, breath hold, and synchronized breath-
ing techniques such as respiratory gating and real-time tracking (Lax et al. 1994;
Wong et al. 1999; Mah et al. 2000; Ohara et al. 1989; Shirato et al. 2000; Keall et
al. 2001).
Several techniques are available for monitoring the inter-fractional changes,
such as megavoltage radiography with film or Electronic Portal Imaging Device
(EPID), kV x-ray imaging, computed tomography (CT) in treatment room, 3D
Cone Beam CT (CBCT) integrated into the linear accelerator, or optical imag-
ing systems (e.g. laser cameras).
The introduction of positron emission tomography (PET) and hybrid
PET/CT imaging has brought a third revolution (after the earlier introductions
of CT and MR) to diagnostic imaging of cancer, since these functional imaging
techniques allow the detection of the tumor within a background of a detailed
representation of the anatomy. The main advantage of the new generation
PET/CT is that the patient is positioned on the same couch for both imaging
modalities, directly providing image fusion and thus facilitating the identifica-
tion of the tumor or disease (via PET) on the background of normal anatomy
(provided by CT). In addition, CT data can be used for attenuation correction
during the PET image reconstruction. However, a problem occurs when the
patient moves during or between the two imaging events. Typically this move-
ment occurs during the longer PET acquisition.
Unfortunately, accurate identification of the tumor and delineation of the
target does not eliminate the need for monitoring the absorbed dose delivered
to the tumor and normal tissues in order to confirm that the target volume has
been accurately irradiated. Therefore, a method for monitoring the delivered
beams using the in vivo activation of the tissue including subsequent imaging
using a PET/CT camera has been proposed and developed by several groups.
The first attempt to perform positron emission imaging to measure the end-of-
range of β+ radioactive 19Ne beams was done at Lawrence Berkeley Laboratory
(Tobias et al. 1977; Chatterjee et al. 1981; Llacer, Chatterjee, et al. 1984; Llacer,
Tobias, et al. 1984; Bennett et al. 1978). At the Heavy Ion Medical Accelerator

4
in Chiba (HIMAC) a commercial PET scanner was built to monitor off-line the
auto activation of the stable therapeutic 12C beam after the treatment (Iseki et
al. 2004). Range information was deduced from imaging the pronounced activi-
ty peak formed by the 11C projectile fragments stopping shortly before the end
point of the primary 12C beam. In 1996/1997 the first in-beam positron camera
that allowed monitoring of the ion range and the lateral dose deposition was
installed at Gesellschaft für Schwerionenforschung Darmstadt (GSI) (Pawelke
et al. 1996; Enghardt et al. 1999). Today, clinical PET systems for both off-line
and on-beam positron emitter imaging of range control and therapy monitoring
verification after proton and carbon ion therapy are established at Hyogo Ion
Beam Medical Center of Hyogo, Japan (Hishikawa et al. 2002), the Francis H.
Burr Proton Therapy Center of Boston, USA (Parodi et al. 2007), the National
Cancer Center of Kashiwa, Japan (Nishio et al. 2008), GSI Helmholtzzentrum
für Schwerionenforschung in Darmstadt, Germany (Enghardt et al. 1999), at
the Heavy Ion Medical Accelerator at Chiba, Japan (Iseki et al. 2004), and the
National Cancer Center of Kashiwa, Japan (Nishio et al. 2006). The offline and
on-beam positron emitter imaging strategies offer different advantages, alt-
hough the in-beam PET systems are more efficient in detecting short-lived
isotopes and allow registration of biological activity before it is being washed
out (Parodi et al. 2008). Another approach for in vivo monitoring the dose deliv-
ery with PET is to use ion beams that already themselves are positron emitting,
such as 11C beams. Investigations have shown that a 40-fold higher peak activi-
ty level is reached when using particles of 11C compared to 12C (Lazzeroni &
Brahme 2011). However, all these systems require access to proton and ion
irradiation facilities. Considerably much less work has been performed on the
possible application of PET imaging during photon therapy (Janek et al. 2006;
Paper II-III; Müller & Enghardt 2006; Möckel et al. 2007; Kluge et al. 2007). It
is predicted that the activity density induced by 50 MV photons is about two
times higher than the value measured by 12C beams (Fiedler et al 2006).
Another study in the field of in vivo dose delivery verification has been done
by a group in Denmark (Hansen et al. 2008). They have demonstrated the po-
tential for in vivo dosimetry by activation of silver implants during radiation
therapy with 15 MV and 18 MV photons. Doses in the range of 6-45 Gy were
delivered. As metallic markers, possibly made from silver, often are used in the
radiotherapy clinic it might be feasible that these could also be used for in vivo
dosimetric control. However, the main disadvantage with this method is that a
normal fractionated therapy dose of 2 Gy would be insufficient to get a meas-
urable activity signal.

5
Figure 2. BIOART integrates the entire process of planning, dose delivery, and
treatment verification with PET/CT as the principle imaging modality. By following the
change in tumor uptake it is possible to estimate the radiation responsiveness of the
tumor and then combine it with dose delivery and treatment position data to adaptively
update the dose delivery by biologically optimization for the remainder of the treatment
series.
It is therefore the aim of this thesis to present a method for in vivo assess-
ment of geometric errors in the delivery of radiation therapy with high energy
photons based on PET imaging of the irradiated tissue that, during therapy, has
been activated due to induced photonuclear reactions. The method allows mon-
itoring the differences between what was planned and what was actually deliv-
ered. Thus deviations in setup such as patient position errors, beams non-
uniformity, or MLC setup errors could be detected and corrected. Furthermore,
the method could be integrated into the advanced treatment method BIOART
(Biologically Optimized 3D in vivo predictive Assay-based Radiation Therapy),
proposed and developed at Karolinska (Brahme 2003). The process, shown in
Figure 2, implies more than just the correction for the potentially misplaced
dose delivery, but an integral correction if part of the tumor, which is more
radiation resistant, has been missed during the early treatments. Thus, the BIO-
ART approach integrates the entire process of planning, dose delivery, as well as
treatment responsiveness imaging, verification and biologically optimized adap-

6
tive therapy with the potential to remove practically all uncertainties in the
complete treatment planning and dose delivery process.
The present thesis is based upon five papers. The first paper describes the fea-
sibility of the in vivo verification method while paper II and III illustrates how it
performs in a clinical situation. In Paper IV and V, the investigation of narrow
scanned photon beams, which can be used for treatment verification, is per-
formed with measurements and Geant4 simulations.
7
2 Photonuclear activation in high
energy photon therapy
2.1 Photonuclear reaction cross sections in
tissue
Photons that are used during external beam radiation therapy interact with the
tissues in the body of the patient through several processes. For photons with
energies between 0.1-1 MeV and 20 MeV Compton scattering is the dominant
process in tissue equivalent materials. Below 0.1-1 MeV and above 20 MeV the
photoelectric effect and pair production are the respective dominate processes.
In all these processes the subsequent effect is the production of free electrons
capable of damaging the DNA. However, at higher energies in the region
5-60 MeV, photons can not only interact with the electrons in the atoms but
also with the nucleus. In these processes, called photonuclear reactions, the
photon can be absorbed by the atomic nucleus while particles such as neutrons,
protons, alphas, and 3He are ejected depending on the photon energy and irra-
diated tissue composition. The emission process is generally governed by the
vibrational state of the protons and neutrons induced by the photon excitation.
For lighter elements, such as those in living tissue, the giant resonance is the
dominant process of the photon absorption in the energy range 5-30 MeV, with
the maximum cross section for light nuclei located around 20 MeV. This reso-
nance results primarily from electric dipole absorption and is the product of the
detailed nuclear structure depending on the properties of the individual energy
levels of the nuclei. Photonuclear cross sections have an irregular dependence,
both in shape and magnitude on both A, Z and photon energy. The photoneu-
tron and photoproton production, denoted as (,n) and (,p), are the dominant
photonuclear processes with cross section threshold energies for therapeutic
photon energies above 15 MV. The photoneutron process involves the emis-
sion of a neutron from the nucleus which is often left as a positron emitting
radionuclide (Hayward 1970; Fuller & Hayward 1976; Dietrich & Berman
1988).
8
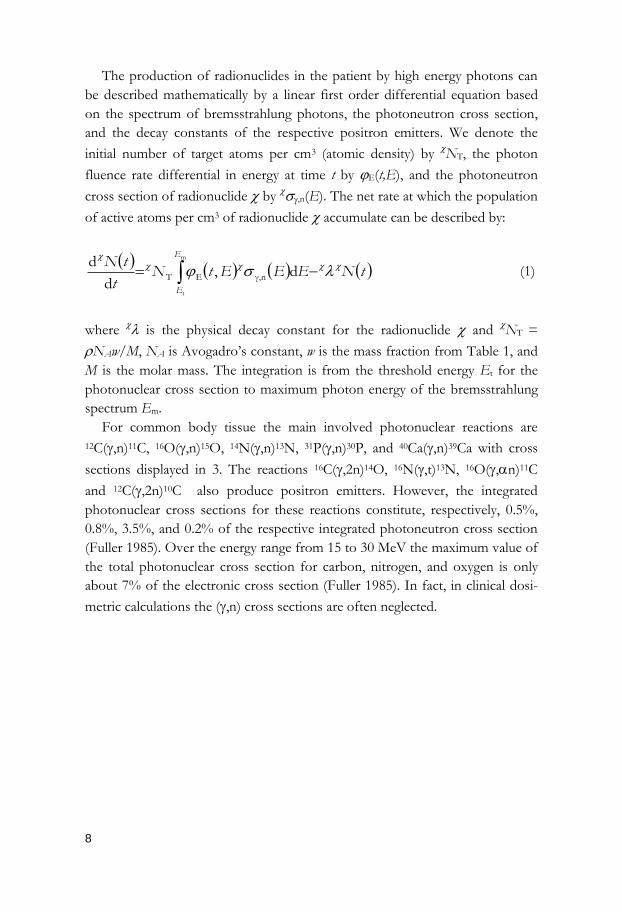
The production of radionuclides in the patient by high energy photons can
be described mathematically by a linear first order differential equation based
on the spectrum of bremsstrahlung photons, the photoneutron cross section,
and the decay constants of the respective positron emitters. We denote the
initial number of target atoms per cm3 (atomic density) by NT, the photon
fluence rate differential in energy at time t by E(t,E), and the photoneutron
cross section of radionuclide by ,n(E). The net rate at which the population
of active atoms per cm3 of radionuclide accumulate can be described by:
tNEEEtN
t
tNE
E
m
t
d,d
dnγ,ET
(1)
where is the physical decay constant for the radionuclide and NT =
NAw/M, NA is Avogadro’s constant, w is the mass fraction from Table 1, and
M is the molar mass. The integration is from the threshold energy Et for the
photonuclear cross section to maximum photon energy of the bremsstrahlung
spectrum Em.
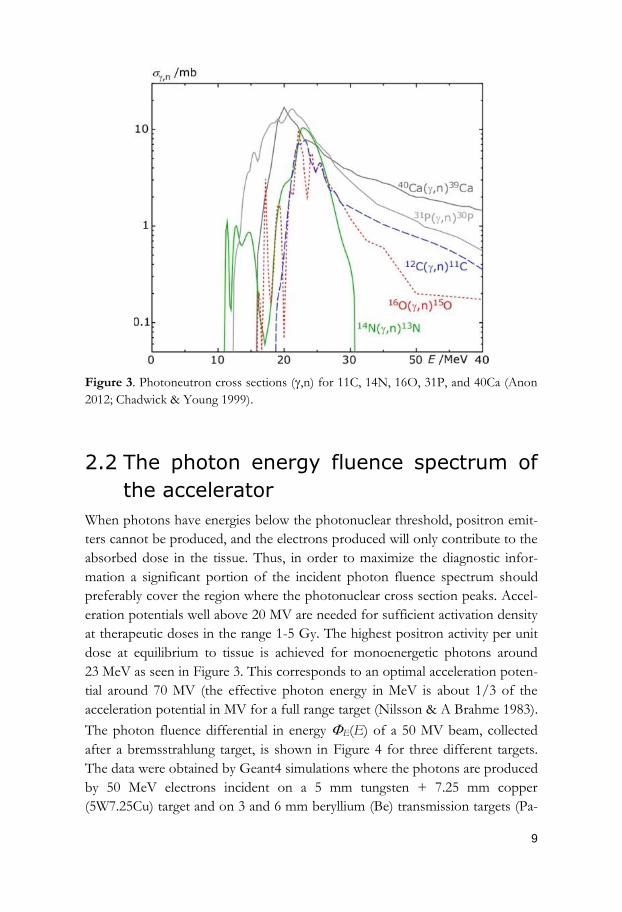
For common body tissue the main involved photonuclear reactions are
12C(,n)11C, 16O(,n)15O, 14N(,n)13N, 31P(,n)30P, and 40Ca(,n)39Ca with cross
sections displayed in 3. The reactions 16C(,2n)14O, 16N(,t)13N, 16O(,n)11C
and 12C(,2n)10C also produce positron emitters. However, the integrated
photonuclear cross sections for these reactions constitute, respectively, 0.5%,
0.8%, 3.5%, and 0.2% of the respective integrated photoneutron cross section
(Fuller 1985). Over the energy range from 15 to 30 MeV the maximum value of
the total photonuclear cross section for carbon, nitrogen, and oxygen is only
about 7% of the electronic cross section (Fuller 1985). In fact, in clinical dosi-
metric calculations the (,n) cross sections are often neglected.
9
Figure 3. Photoneutron cross sections (,n) for 11C, 14N, 16O, 31P, and 40Ca (Anon
2012; Chadwick & Young 1999).
2.2 The photon energy fluence spectrum of
the accelerator
When photons have energies below the photonuclear threshold, positron emit-
ters cannot be produced, and the electrons produced will only contribute to the
absorbed dose in the tissue. Thus, in order to maximize the diagnostic infor-
mation a significant portion of the incident photon fluence spectrum should
preferably cover the region where the photonuclear cross section peaks. Accel-
eration potentials well above 20 MV are needed for sufficient activation density
at therapeutic doses in the range 1-5 Gy. The highest positron activity per unit
dose at equilibrium to tissue is achieved for monoenergetic photons around
23 MeV as seen in Figure 3. This corresponds to an optimal acceleration poten-
tial around 70 MV (the effective photon energy in MeV is about 1/3 of the
acceleration potential in MV for a full range target (Nilsson & A Brahme 1983).
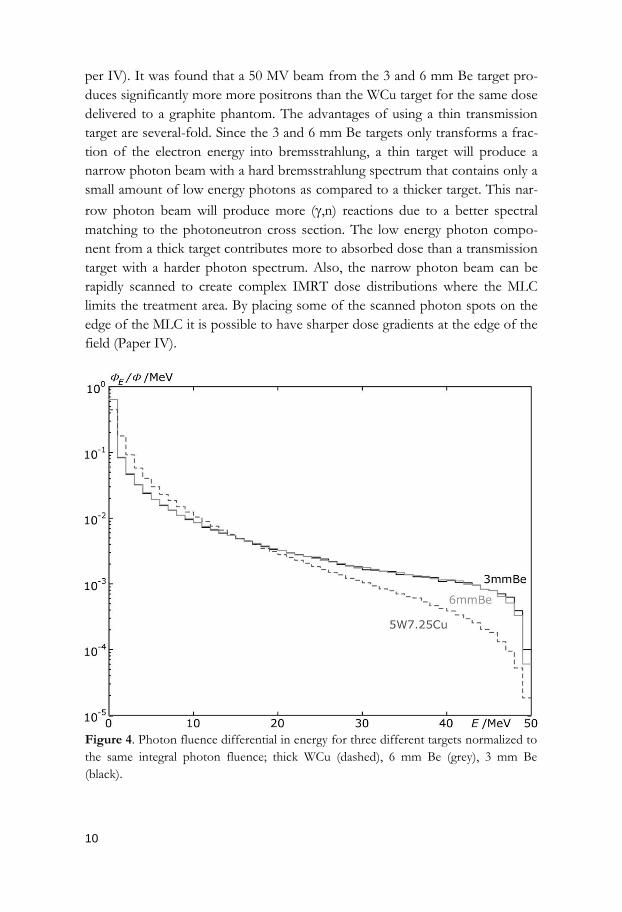
The photon fluence differential in energy E(E) of a 50 MV beam, collected
after a bremsstrahlung target, is shown in Figure 4 for three different targets.
The data were obtained by Geant4 simulations where the photons are produced
by 50 MeV electrons incident on a 5 mm tungsten + 7.25 mm copper
(5W7.25Cu) target and on 3 and 6 mm beryllium (Be) transmission targets (Pa-
10
per IV). It was found that a 50 MV beam from the 3 and 6 mm Be target pro-
duces significantly more more positrons than the WCu target for the same dose
delivered to a graphite phantom. The advantages of using a thin transmission
target are several-fold. Since the 3 and 6 mm Be targets only transforms a frac-
tion of the electron energy into bremsstrahlung, a thin target will produce a
narrow photon beam with a hard bremsstrahlung spectrum that contains only a
small amount of low energy photons as compared to a thicker target. This nar-
row photon beam will produce more (,n) reactions due to a better spectral
matching to the photoneutron cross section. The low energy photon compo-
nent from a thick target contributes more to absorbed dose than a transmission
target with a harder photon spectrum. Also, the narrow photon beam can be
rapidly scanned to create complex IMRT dose distributions where the MLC
limits the treatment area. By placing some of the scanned photon spots on the
edge of the MLC it is possible to have sharper dose gradients at the edge of the
field (Paper IV).
Figure 4. Photon fluence differential in energy for three different targets normalized to
the same integral photon fluence; thick WCu (dashed), 6 mm Be (grey), 3 mm Be
(black).
11
2.3 Produced positron emitter activity in
tissue
The type of positron emitting radionuclide produced during irradiation depends
on the irradiated tissue and the photon energy. In Table 1 the elemental com-
position of common body tissues based upon ICRU Report 46 (International
Commission on Radiation Units and Measurements 1992) is shown. As can be
seen, the human body has a heterogeneous composition with adipose structures
having the highest carbon content and soft tissue rich in blood having the high-
est oxygen content. An average human body consist of about 60% oxygen, 30%
carbon, 8% nitrogen, and 2% other elements. However, in the skeletal tissues,
the calcium and phosphorous content are as high as 22% and 10% respectively.
The physical density often varies between tissues and will affect the amount of
positron emitters produced per unit volume. For example, high density tissues
such as bone will reach a higher activation density than lung tissue.
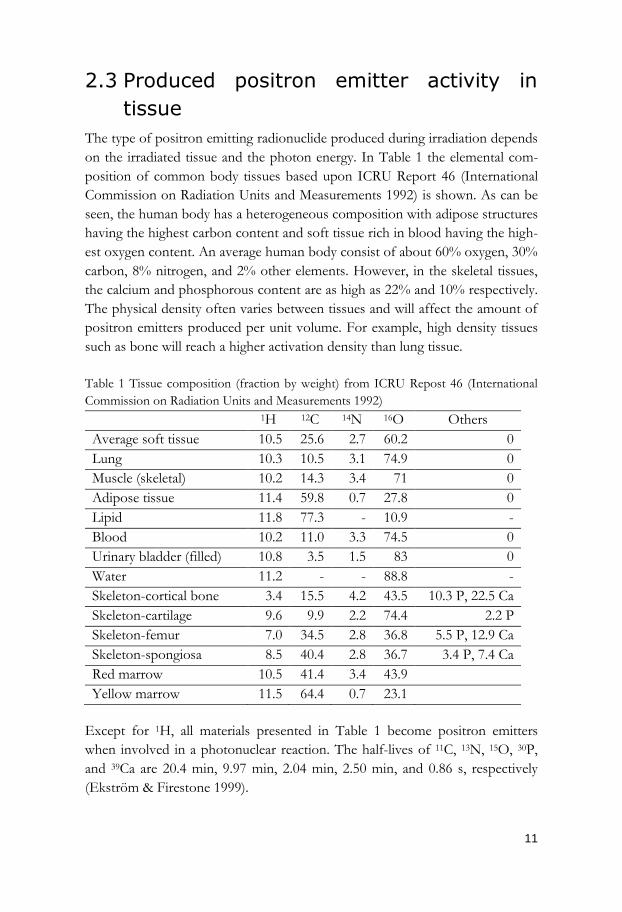
Table 1 Tissue composition (fraction by weight) from ICRU Repost 46 (International
Commission on Radiation Units and Measurements 1992)
1H 12C 14N 16O Others
Average soft tissue 10.5 25.6 2.7 60.2 0
Lung 10.3 10.5 3.1 74.9 0
Muscle (skeletal) 10.2 14.3 3.4 71 0
Adipose tissue 11.4 59.8 0.7 27.8 0
Lipid 11.8 77.3 - 10.9 -
Blood 10.2 11.0 3.3 74.5 0
Urinary bladder (filled) 10.8 3.5 1.5 83 0
Water 11.2 - - 88.8 -
Skeleton-cortical bone 3.4 15.5 4.2 43.5 10.3 P, 22.5 Ca
Skeleton-cartilage 9.6 9.9 2.2 74.4 2.2 P
Skeleton-femur 7.0 34.5 2.8 36.8 5.5 P, 12.9 Ca
Skeleton-spongiosa 8.5 40.4 2.8 36.7 3.4 P, 7.4 Ca
Red marrow 10.5 41.4 3.4 43.9
Yellow marrow 11.5 64.4 0.7 23.1
Except for 1H, all materials presented in Table 1 become positron emitters
when involved in a photonuclear reaction. The half-lives of 11C, 13N, 15O, 30P,
and 39Ca are 20.4 min, 9.97 min, 2.04 min, 2.50 min, and 0.86 s, respectively
(Ekström & Firestone 1999).
12
If we further assume (for simplicity) that the pulse length and the scan pat-
tern repetition rate of the Racetrack Microtron of 2 Hz or 0.5 s per scan is
much smaller than the mean life -1 of the radionuclides of interest, then the
mean photon fluence rate in equation (1) will be constant and equal to E(E).
Through integration of equation (1), assuming the initial activity to be zero (A
= N = 0 at t = 0), the activity A(t) of radionuclide in Bq per cm3 before
and after the end of irradiation tirr will be given by:
irrirrET
irrET
expexp1d
exp1d
ttttEEEN
tttEEEN
tA
E
E
(2)
where and tirr is the irradiation time.
2.4 Activation measurements with PET
Knowing the true activity A(t,r') for radionuclide at a point r', the observed
specific count rate (s-1 cm-3) S(t,r) using a PET camera with the total point
spread function P(r,r') will be given by:
V
rPtAtS 3d,,, r'rr'rr (3)
Here (r) is the counting efficiency which corrects for attenuation of the radia-
tion in escaping the object, geometrical factors, and other effects; while P(r,r')
determines the spatial resolution loss due to several physical properties of the
camera and the imaged object (as discussed in Paper I). The errors associated
with these effects are important to consider when utilizing the acquired PET
images.
2.5 Early tissue activation studies
Photon activation of tissue was pioneered by (Hughes et al. 1979). In this work
the rates of cerebral perfusion were obtained from measurements of the disap-
pearance of 15O after in situ activation with 45 MV betatron x-rays. An expan-
13
sion and further quantification of this technique was to measure the tumor
blood flow in situ and in vivo in transplanted animal tumors by 15O, 11C, and 13N
decay after single dose irradiation and 30 MV x-ray beam (Emami et al. 1981;
Ten Haken et al. 1981; Nussbaum et al. 1983). Detection was performed with
two opposed NaI(T1) crystals, optically coupled to photomultiplier tubes. Re-
sults showed that the measured decay data could be clearly resolved and fitted
by two exponentials, representing the contributions from 15O and 11C respec-
tively; whereas the contribution from 13N was insignificant. Furthermore, by
analysis of the coincidence spectrum from the in vivo study the authors were
able to determine the rate of tumor wash-out of mobile H215O as well as the
fraction of well-perfused and non-perfused volume in the tumor. These studies
were motivated by the relationship between the level of perfusion in tumor
volumes and the degree of tumor hypoxia.
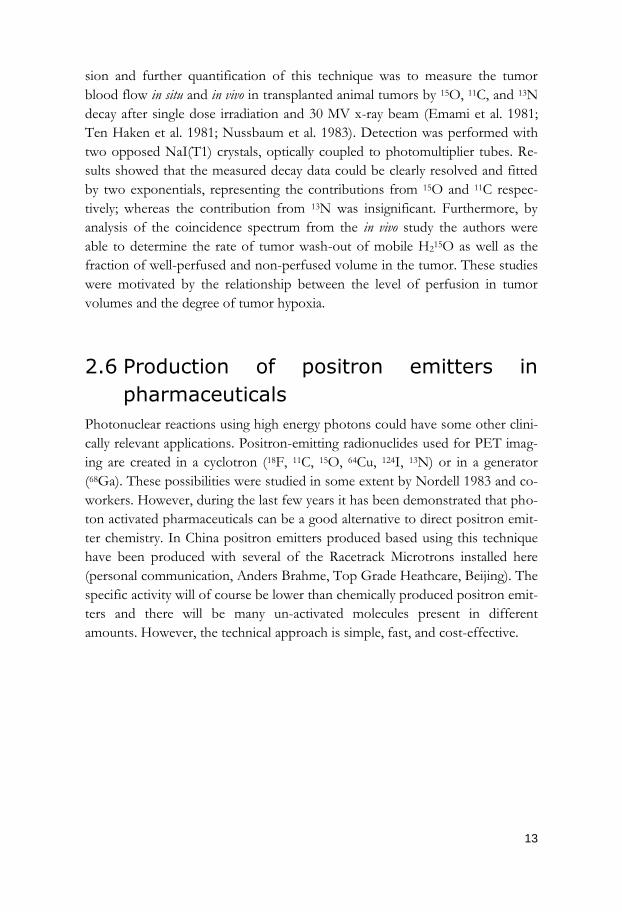
2.6 Production of positron emitters in
pharmaceuticals
Photonuclear reactions using high energy photons could have some other clini-
cally relevant applications. Positron-emitting radionuclides used for PET imag-
ing are created in a cyclotron (18F, 11C, 15O, 64Cu, 124I, 13N) or in a generator
(68Ga). These possibilities were studied in some extent by Nordell 1983 and co-
workers. However, during the last few years it has been demonstrated that pho-
ton activated pharmaceuticals can be a good alternative to direct positron emit-
ter chemistry. In China positron emitters produced based using this technique
have been produced with several of the Racetrack Microtrons installed here
(personal communication, Anders Brahme, Top Grade Heathcare, Beijing). The
specific activity will of course be lower than chemically produced positron emit-
ters and there will be many un-activated molecules present in different
amounts. However, the technical approach is simple, fast, and cost-effective.
14
3 PET and PET/CT imaging in
oncology
3.1 Hybrid PET imaging
The development of new imaging systems has exploded in the last decade has
impacted the way medicine is performed. Several techniques are now available
to image relevant molecular and biological features of the tumors potentially
enabling an improved outcome of radiation treatment. Among these, positron
emission tomography (PET) has the advantage of being non-invasive, quite
versatile (as several tracers are already available for investigating various pro-
cesses), and highly sensitive as very low concentrations of tracers can be im-
aged. Furthermore, studies have shown strong correlations between the param-
eters of the PET images and the clinical outcome (Apisarnthanarax & Chao
2005). PET/CT in particular offers a unique tool, capable of giving not only
high-quality anatomical information, but also information of the in vivo molecu-
lar and functional processes. PET/CT has several major advantages: the CT
image can be used for attenuation correction in PET without the need for an
extra scan and it has been shown that PET/CT improves both diagnostic accu-
racy and target delineation when compared to CT and PET alone. The most
beneficial effect of the combination of CT and PET in a single device is the
increase in the specificity due to the localization of the PET information as a
result of the structural information from the CT data. Findings in several stud-
ies also support the improved accuracy of staging and restaging with PET/CT,
compared with either CT or PET acquired separately (Townsend 2008).
Further progress in the field of hybrid imaging systems also lead to the de-
velopment of PET/MR cameras. With the newly developed hybrid PET/MR
systems even a third dimension to molecular imaging is introduced where MR
imaging has the advantage of providing excellent soft-tissue contrast and multi-
dimensional functional, structural, and morphological information (Zaidi & Del
Guerra 2011; Delso et al. 2011). It is considered by many experts as a major
breakthrough that will potentially lead to a revolutionary paradigm shift in
healthcare (Pichler et al. 2010; Zaidi & El Naqa 2010). Also, as the radiation
dose for PET/MR is lower than that for PET/CT, this modality will be of great
15
importance in repeated pediatric imaging studies where doses from ionizing
radiation should be kept as low as possible.
However, patient motion is still a major obstacle for achieving high precision
tumor imaging and radiation therapy. Most 3D imaging technologies produce
artifacts and uncertainties in target or lesion identification, localization, and
delineation. In recent years significant progress in the field of 4D medical imag-
ing (4DMI) has been made, where time is introduced as the fourth dimension.
Additional promising advances are expected (Lu et al. 2006; Ford et al. 2003).
The new technologies include patient immobilization, breath holding, active
breathing control, breath coaching, respiratory gating, and respiratory motion
tracking. Many of these methods are based on the use of external or internal
fiducial markers for monitoring patient motion or direct optical tracking for
respiratory motions (Kawakami et al. 2005). In 4D PET(SPECT)/CT, a set of
4D images is used for motion-free image creation, intrinsic registration, and
attenuation correction. As PET and CT have two very different imaging speeds,
respiratory motion has different effects. For CT, which is a fast imaging tech-
nique, the motion causes image deformation artifacts; while for PET, where
data usually is acquired over a period of 5-10 minutes, the motion causes image
blurring. The benefits from 4D PET/CT are thus several: motion free PET
imaging for accurate diagnosis, motion-free intrinsic PET/CT image registra-
tion for accurate tumor localization, and motion-free PET attenuation correc-
tion for accurate metabolic activity assessment and tumor volume delineation
(Nehmeh et al. 2004a, 2004b). However, the real strength of the PET imaging
method lies beyond the qualitative correlations between images and clinical
outcome. More specifically it depends on accurate quantification of the PET
images and the use of the derived information for advanced treatment planning
and treatment adaptation.
3.2 Tumor imaging
The most widely used radiopharmaceutical in clinical oncology for detection of
primary tumors, metastases, and early tumor recurrence has been 18F-
fluorodeoxyglucose (18F-FDG) with a long half-life of 110 min. 18F-FDG is a
tracer for measuring glucose metabolism, it consists of two components; FDG
(an analog of glucose) and a fluorine-18 label that allows the tracer to be detect-
ed by PET. 18F-FDG enters the cell in the same way as glucose, but is metabo-
lized creating a new compound (a metabolite) that is trapped in the cell. Thus,
the concentration of the metabolite grows with time in proportion to the glu-
cose metabolic rate of the cell. However, FDG is not tumor specific, hence
16
some other lesions or regions could show an elevated uptake. There are several
newly developed PET tracers to identify specific tumor characteristics. This
development of “tumor cell signal-specific” PET radiopharmaceuticals might
lead to developing patient-specific individualized cancer therapy (Gambhir
2008). Some of the more recent developed non-FDG PET tracers include 18F-
fluorothymidine (FLT) (synthesis of DNA/tumor cell proliferation) - used for
early assessment of response/monitoring tumor response to therapy (Pio et al.
2006; Kenny et al. 2007), 18F-fluorocholine and 11C-choline (synthesis of mem-
brane lipids) - used for prostate cancer imaging (Kwee et al. 2007; Fuccio et al.
2011), 18F-deoxyphenylalanine (FDOPA) (protein transport and synthesis) –
used in detecting tumor recurrence and diagnostic information in low-grade
gliomas (Jager et al. 2008), 68Ga-DOTA in imaging for gastroenteropancreatic
neuroendocrine tumors (NET) (Ambrosini et al. 2008), 18F-fluoroestradiol
(FES) – used for estrogen receptors/receptor binding/binds to the oestrogen
receptors to predict responses to breast cancer treatment (Mankoff 2008), and 18F-FDHT – used to detect metastatic and recurrent prostate cancer lesions
(Fox et al. 2011). For in vivo imaging of tumor hypoxia, 18F-fluoroimidazole
(FMISO) is the most used tracer, dating back to 1992. Other PET tracers de-
veloped for this purpose are 18F-(FAZA), Cu(II)-ATSM, and 18F-EF5 amongst
others. Promising human studies with 18F-galacto-RDG are reported for imag-
ing tumor angiogenesis (Rodriguez-Porcel et al. 2008) and annexin V labeled
with PET tracers such as 124I, 18F, and 64Cu are being evaluated for in vivo de-
tection of apoptosis (Blankenberg 2008).
3.3 The use of PET/CT for tumor delineation
and target volume definition
Reducing the uncertainty of the clinical target volume is a major goal of onco-
logic imaging, trying to reduce the internal as well as the setup margins. The
conventional approach is to define the gross tumor volume (GTV) as the visual
extent and location of the malignant growth. A 1-2 cm expansion is often add-
ed to the GTV as a compensation for the microscopic tumor spread to get the
clinical target volume (CTV). These are the oncological given information. The
information concerning the treatment itself is given by the internal target vol-
ume (ITV) and the setup margin as seen in Figure 1. In radiation therapy plan-
ning, CT and MR have had by far the most dominate role during the last dec-
ades for delineation of the tumor and surrounding tissue. However, with the
introduction of functional imaging, radiation oncologists have begun to consid-
17
er the concept of biological target volumes (BTV), where the old model of
uniform dose delivery to the target volume is abandoned in favor of the con-
cept of biologically relevant dose optimization (Figure 2, Brahme 2003; Toma-
Dasu et al. 2012). Based on PET/CT, factors such as tumor hypoxia, prolifera-
tion, angiogenesis, and apoptosis are taken into account and could, if integrated
into the treatment planning procedure, lead to a technique of applying non-
uniform dose prescriptions. As solid tumors often show a great complexity
within both microscopic and macroscopic subvolumes of hypoxic and nectrotic
cells distributed within the tumor, the delineation of the target in terms of bio-
logical target volumes and the delivery of heterogeneous dose distributions with
high conformity to the BTV is the new approach to performing radiation
treatment planning today (Devic et al. 2010).
However, outlining targets using PET has its limitations, such as the relative-
ly poor spatial resolution of PET images (about 4 mm full width half maximum
(FWHM) in modern PET cameras), the poor tumor vasculature implying lim-
ited tracer uptake, and a further uncertainty in the definition of the clinical and
internal target volumes or the use of the standardized uptake value (SUV) for
defining the target.
Several solutions have been proposed over the years for creating a dose dis-
tribution based on a PET image taking the functional or molecular aspect of
the tumor into account. These solutions range from empirical dose escalations
to the regions presenting enhanced uptake of the tracer, to dose distributions
based on the quantification of the tracer activity and mapping the tumor in
terms of radiosensitivity and radioresistance (Brahme 2003; 2011; Toma-Dasu
et al. 2012). All of these methods lead to a rather heterogeneous dose delivery
which would require a high degree of control of dose delivery.
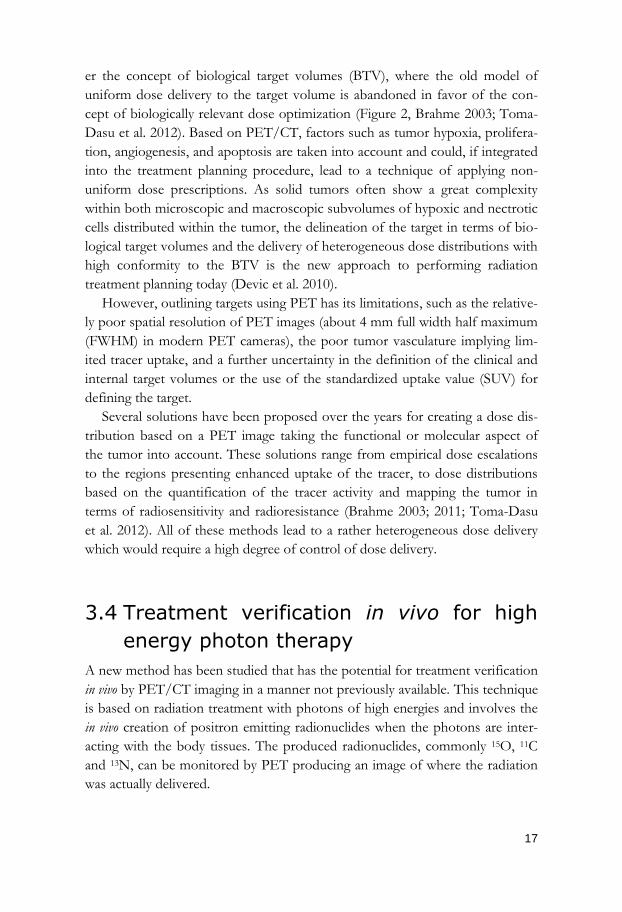
3.4 Treatment verification in vivo for high
energy photon therapy
A new method has been studied that has the potential for treatment verification
in vivo by PET/CT imaging in a manner not previously available. This technique
is based on radiation treatment with photons of high energies and involves the
in vivo creation of positron emitting radionuclides when the photons are inter-
acting with the body tissues. The produced radionuclides, commonly 15O, 11C
and 13N, can be monitored by PET producing an image of where the radiation
was actually delivered.

18
Although this method could be a very promising tool for true in vivo treat-
ment delivery verification, the picture is complicated by the fact that there will
be components of biological transport inside the radiation treated volume. For
radionuclides incorporated in blood rich organs there will be a steady washout
of oxygen, but also to some extent a washout of carbon in the irradiated area.
Activity is also lost from the body as a result of biological transport processes,
including capillary blood flow containing mobile 15O and mobile 11C in the
activated tissue volume, hence there will be a second reduction term in equation
(1), G(t), when the activation process involves living tissue. This modified equa-
tion is:
tGtNEEEtN
t
tNE
E
m
t
d,d
dnγ,ET (4)
Additionally, a fraction of atoms that have been activated in other regions of
the irradiated tissue volume may flow to the volume of interest. As a result the
decay of the activity in living tissue will in general be influenced by both physi-
cal and biological transport processes. Thus, the activity distribution obtained
from living tissue will differ from that obtained in frozen tissue. In paper I,
where the study focused on frozen material the biological rate constants are
zero. However, this is not the case in paper II and III, where the studies in-
volved living tissue.
How this biological transport process will affect the final image is non-trivial
and will depend on the irradiated organ and its surrounding vasculature. For
certain blood rich organs such as the lung or the liver, the radioactivity induced
by high energy photon irradiation washes out within 1 minute (Nilsson 2007).
Volumes with a large biological transport would perhaps not be the most suita-
ble for in vivo delivery verification. In contrast, tissues having a low blood flow,
such as fat and bone, would be more suitable for treatment verification due to a
low washout but also since these tissues often are rigid and non-moving. The
subcutaneous fat surrounding the patient, common to all people, offers an ex-
cellent validation of the beam profiles as shown in Paper II. This subcutaneous
fat becomes highly activated due to its relatively high density, high carbon con-
tent and the low biological washout rate. In addition, the relatively long physical
half-life of 11C allows for subsequent PET imaging with a sufficient signal. As
the entrances of all beams are in the subcutaneous fat, these provide perfect
beam-portal-images that may be used with high energy photon therapy.
Besides the biological transport, the most critical issue regarding the method
for in vivo treatment verification is the time frame between the end of the radia-
19
tion treatment delivery and the PET/CT imaging, as concluded from Papers I-
III. For the study of the 15O component this is especially critical, since 15O has
a very short half-life. If the PET/CT is not in close proximity to the radiation
therapy room, a time interval of 10 min is not unusual for patient transporta-
tion and setup in the PET/CT. This would result in a 50% activity loss for
carbon, but almost a complete loss of the oxygen. Hence, the ideal situation
would be to have a dedicated PET/CT outside the radiation therapy room or
perhaps integrated into the accelerator if possible.
Apart from biological washout, tissue density and anatomical variations
within the irradiated volume contribute a great deal to the non-uniform posi-
tron activity observed in the PET images. Oxygen for example, which consti-
tutes about 2/3 of the total elemental composition in soft tissue, will dominate
the PET signal in measurements taken immediately after the photon irradiation.
However, the heterogeneity of body tissue allow for separation of induced ra-
dionuclides as shown in Paper I and III. In modern PET/CT systems, a stand-
ard way of collecting dynamic data is by “list mode” acquisition. List mode is an
event-by-event data acquisition mode superior when aiming at high flexibility of
data manipulation, for instance allowing for optional temporal resolution of the
image data. When acquiring data in list-mode, the extraction of different half-
lives or separation of the imaged positron emitters is possible. It is even inter-
esting to consider the possibilities of detecting and measuring tumor hypoxia
after tissue activation if PET/CT were in close proximity to the radiotherapy
room.
Sometimes the term “dose verification” is used as a description the studied
method. However, even though this nomenclature could be used (and is used
for example in paper I) a more appropriate description of the methods studied
in this thesis would be “treatment verification”. The most obvious reason for
this is simply that the in vivo activation of tissue by photons is strictly propor-
tional to the primary photon fluence, whereas the dose is delivered by the sec-
ondary electrons set in motion by these photons. Hence, the absorbed dose
distribution is partly a build-up phenomenon determined by the incident pho-
ton energy fluence differential in energy, whereas the induced positron activity
represents the tissue activation induced by the photons with energies above the
(,n) threshold energy. However, the depth activity and depth dose distributions
will be proportional beyond the absorbed dose maximum seen in Paper V, as
well as lateral and longitudinal distributions.
20
3.5 BIOART: The use of PET/CT imaging to
biologically optimize the treatment
After approximate 10 days of fractionated radiation therapy there is less than a
few percent of the original tumor cells remaining and the tumor can be consid-
ered almost gone from a PET imaging point of view. By imaging the tumor
before this time limit, using 18F-FDG PET/CT imaging or preferably more
tumor specific tracers as mentioned above, it is possible to measure the early
response of the tumor to the radiation therapy and thereby estimate the respon-
siveness of the well oxygenated tumor compartment. Correction for the esti-
mated degree of hypoxia could then be done based on historical Eppendorf
data (Lind & Brahme 2007) and a calculation of the required dose delivery for
tumor cure can be done using inverse treatment planning or biological treat-
ment optimization (Brahme 2003; 2011). By repeating this procedure two times
during the first 10 days of the course of therapy practically all major uncertain-
ties that are likely to influence the tumor response and the dose delivery can be
taken into account. This is called in vivo predictive assay based adaptive radiation
therapy (BIOART) (Brahme 2003; 2011). In reality, BIOART could lead to fur-
ther individualization of therapy with the possibility of refining the dose per
fraction, changing the fraction schedule, or adding a higher dose to certain hy-
poxic subvolumes of the tumor. Also, biologically optimized treatment can be
based both on the observed tumor response and the observed mean dose deliv-
ery using PET/CT imaging and historical data for normal tissue responses. This
gives a very interesting method to get hold of the best known property of the
tumor: namely its responsiveness to radiation therapy and therefore also a pos-
sibility to biologically optimize the treatment adaptively, as seen in Figure 2,
after the first 10 days of treatment.
21
4 Clinical applications: In vitro and
in vivo studies
This chapter describes the experimental studies of how the proposed new
method for treatment verification could be applied clinically. Section 4.1 de-
scribes a pilot study conducted with PMMA and a piece of frozen animal tissue,
while Sections 4.2 and 4.3 describe studies on patients. The list mode PET data
in Section 4.3 were performed using a Siemens Biograph 64-slice True V
PET/CT, while the studies in Section 4.1 and 4.2 were performed using two
different dedicated Siemens PET scanners; ECAT EXACT 921 and ECAT
EXACT HR.
4.1 In vitro study
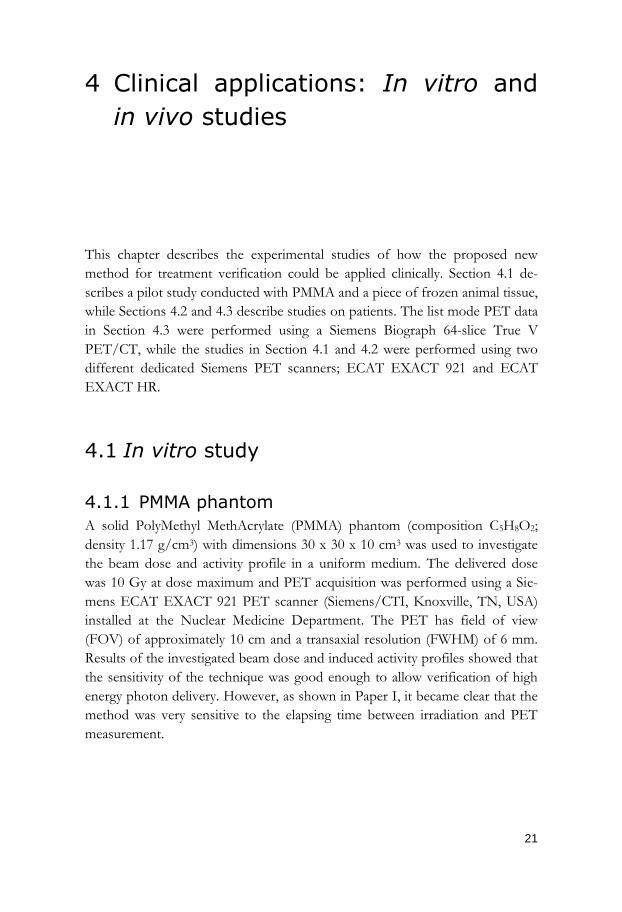
4.1.1 PMMA phantom
A solid PolyMethyl MethAcrylate (PMMA) phantom (composition C5H8O2;
density 1.17 g/cm3) with dimensions 30 x 30 x 10 cm3 was used to investigate
the beam dose and activity profile in a uniform medium. The delivered dose
was 10 Gy at dose maximum and PET acquisition was performed using a Sie-
mens ECAT EXACT 921 PET scanner (Siemens/CTI, Knoxville, TN, USA)
installed at the Nuclear Medicine Department. The PET has field of view
(FOV) of approximately 10 cm and a transaxial resolution (FWHM) of 6 mm.
Results of the investigated beam dose and induced activity profiles showed that
the sensitivity of the technique was good enough to allow verification of high
energy photon delivery. However, as shown in Paper I, it became clear that the
method was very sensitive to the elapsing time between irradiation and PET
measurement.
22
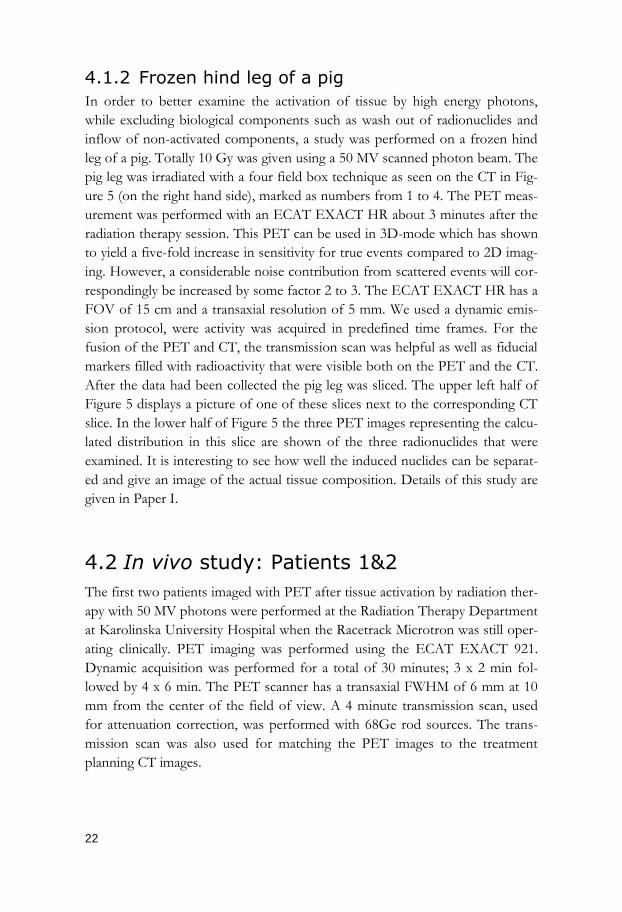
4.1.2 Frozen hind leg of a pig
In order to better examine the activation of tissue by high energy photons,
while excluding biological components such as wash out of radionuclides and
inflow of non-activated components, a study was performed on a frozen hind
leg of a pig. Totally 10 Gy was given using a 50 MV scanned photon beam. The
pig leg was irradiated with a four field box technique as seen on the CT in Fig-
ure 5 (on the right hand side), marked as numbers from 1 to 4. The PET meas-
urement was performed with an ECAT EXACT HR about 3 minutes after the
radiation therapy session. This PET can be used in 3D-mode which has shown
to yield a five-fold increase in sensitivity for true events compared to 2D imag-
ing. However, a considerable noise contribution from scattered events will cor-
respondingly be increased by some factor 2 to 3. The ECAT EXACT HR has a
FOV of 15 cm and a transaxial resolution of 5 mm. We used a dynamic emis-
sion protocol, were activity was acquired in predefined time frames. For the
fusion of the PET and CT, the transmission scan was helpful as well as fiducial
markers filled with radioactivity that were visible both on the PET and the CT.
After the data had been collected the pig leg was sliced. The upper left half of
Figure 5 displays a picture of one of these slices next to the corresponding CT
slice. In the lower half of Figure 5 the three PET images representing the calcu-
lated distribution in this slice are shown of the three radionuclides that were
examined. It is interesting to see how well the induced nuclides can be separat-
ed and give an image of the actual tissue composition. Details of this study are
given in Paper I.
4.2 In vivo study: Patients 1&2
The first two patients imaged with PET after tissue activation by radiation ther-
apy with 50 MV photons were performed at the Radiation Therapy Department
at Karolinska University Hospital when the Racetrack Microtron was still oper-
ating clinically. PET imaging was performed using the ECAT EXACT 921.
Dynamic acquisition was performed for a total of 30 minutes; 3 x 2 min fol-
lowed by 4 x 6 min. The PET scanner has a transaxial FWHM of 6 mm at 10
mm from the center of the field of view. A 4 minute transmission scan, used
for attenuation correction, was performed with 68Ge rod sources. The trans-
mission scan was also used for matching the PET images to the treatment
planning CT images.

23
4.2.1 Patient1
A male preoperative rectal cancer patient received a dose of 5 Gy using 50 MV
photons. This 50 MV radiation treatment plan is shown in Figure 6. The deliv-
ery of four fields was performed during a total irradiation time of 3.5 minutes,
including time for gantry rotation. The patient was positioned according to
routine procedures, i.e. using laser alignment. The PET acquisition started 11
min after the irradiation was finished. PET data were reconstructed by an itera-
tive reconstruction algorithm using 2 iterations and 4 subsets after which a 6
mm Gaussian filter was applied.
Figure 1. The 50 MV radiation treatment plan showing a four field box technique.
Isodose curves are displayed in the ranges 35, 65, 85 and 95% of the target dose of 5
Gy.
The measured induced activity was analyzed for three different radionuclides; 15O, 11C, and 13N, but no separation could be accomplished of their relative
activity levels or distribution. Probably this was due to insufficient level of ac-
tivity (low count rate), for instance almost no 15O is left after 11 min (the time
required to transport the patient to the PET facility). In Figure 7 this can be
seen in the 0-2 min PET images which are relatively noisy.
24
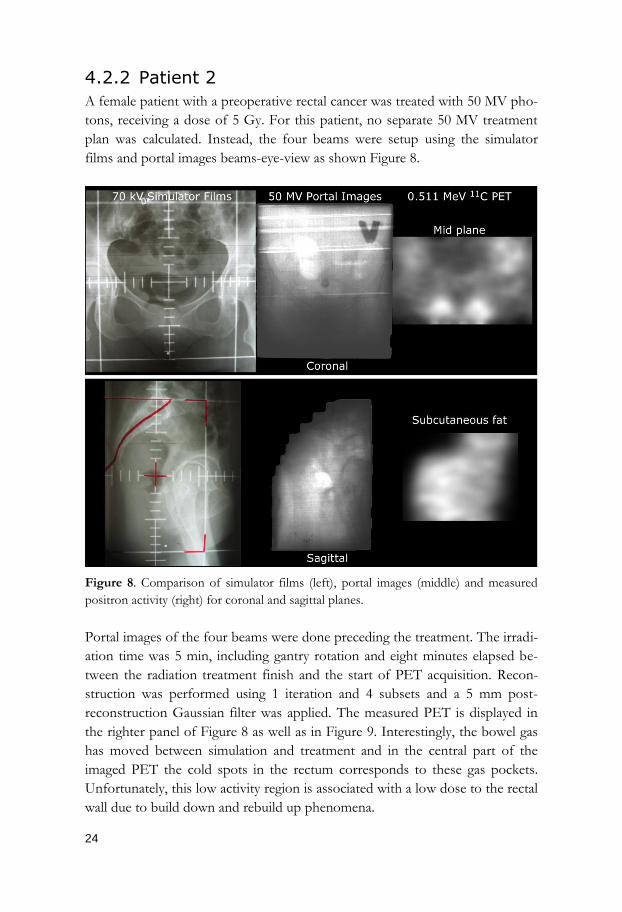
4.2.2 Patient 2
A female patient with a preoperative rectal cancer was treated with 50 MV pho-
tons, receiving a dose of 5 Gy. For this patient, no separate 50 MV treatment
plan was calculated. Instead, the four beams were setup using the simulator
films and portal images beams-eye-view as shown Figure 8.
Figure 8. Comparison of simulator films (left), portal images (middle) and measured
positron activity (right) for coronal and sagittal planes.
Portal images of the four beams were done preceding the treatment. The irradi-
ation time was 5 min, including gantry rotation and eight minutes elapsed be-
tween the radiation treatment finish and the start of PET acquisition. Recon-
struction was performed using 1 iteration and 4 subsets and a 5 mm post-
reconstruction Gaussian filter was applied. The measured PET is displayed in
the righter panel of Figure 8 as well as in Figure 9. Interestingly, the bowel gas
has moved between simulation and treatment and in the central part of the
imaged PET the cold spots in the rectum corresponds to these gas pockets.
Unfortunately, this low activity region is associated with a low dose to the rectal
wall due to build down and rebuild up phenomena.
25
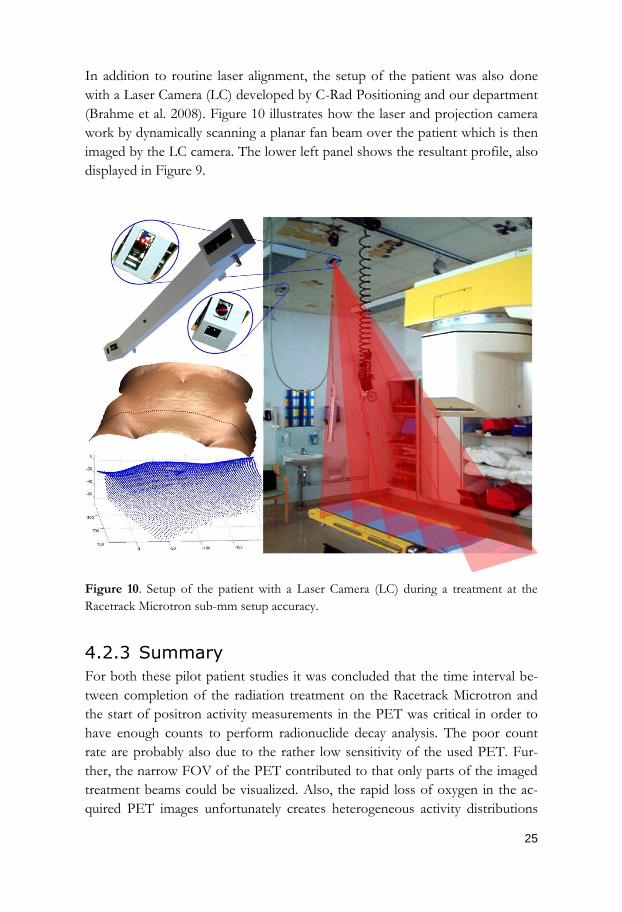
In addition to routine laser alignment, the setup of the patient was also done
with a Laser Camera (LC) developed by C-Rad Positioning and our department
(Brahme et al. 2008). Figure 10 illustrates how the laser and projection camera
work by dynamically scanning a planar fan beam over the patient which is then
imaged by the LC camera. The lower left panel shows the resultant profile, also
displayed in Figure 9.
Figure 10. Setup of the patient with a Laser Camera (LC) during a treatment at the
Racetrack Microtron sub-mm setup accuracy.
4.2.3 Summary
For both these pilot patient studies it was concluded that the time interval be-
tween completion of the radiation treatment on the Racetrack Microtron and
the start of positron activity measurements in the PET was critical in order to
have enough counts to perform radionuclide decay analysis. The poor count
rate are probably also due to the rather low sensitivity of the used PET. Fur-
ther, the narrow FOV of the PET contributed to that only parts of the imaged
treatment beams could be visualized. Also, the rapid loss of oxygen in the ac-
quired PET images unfortunately creates heterogeneous activity distributions
26
which make it difficult to draw any major conclusions from these two studies.
How to reduce the time between irradiation and the PET imaging remains a
problem to be addressed in future work.
4.3 In vivo study: Patient 3&4
These two studies were performed using a Siemens Biograph 64-slice True V
PET/CT scanner. For both patients, acquisition was performed in list-mode.
The PET FOV of 21.6 cm was also sufficient to cover the entire width of the
radiation beams in both patients studied. The PET studies were performed on
clinical indication. After a retrospective application, the Regional Ethical Com-
mittee declared no objections to the studies.
4.3.1 Patient 3
A female patient with a preoperative rectal cancer was treated with 50 MV pho-
tons, receiving a dose of 5 Gy. The details of the study are presented in Paper
II. It was demonstrated that lateral and longitudinal setup errors are accurately
picked up by PET/CT imaging of photonuclear activated tissue in vivo. Analysis
showed that a 21 mm misalignment was observed between the treatment plan
and induced activity distribution, probably due to mispositioning of the patient
on the treatment couch. It was also estimated from measurements that the
count rates from a patient, after receiving a total dose of 5 Gy, was about 5% of
that of a patient undergoing a clinical 18F-FDG study. This was probably one of
the reasons that PET reconstruction with ordinary OSEM(2D) algorithms did
not succeed in achieving reliable results. We also suspected that the background
activity, originating from the low intrinsic activity in the LSO crystals of the
PET, contributed to this problem.
One of the main challenges in this study was to accurately align the meas-
ured activity image with the radiation treatment plan. As none of these imaging
modalities include anatomical landmarks, fusion had to be performed by anoth-
er approach. Since both PET and treatment plan are combined with a matching
CT (attenuation correction CT and planning CT, respectively), the fusion of
these would automatically align the PET image to the treatment plan. For this
purpose, a validated tool (Noz et al. 2001) was used where the user simultane-
ously picks anatomical points on both CT sets. Fusion of the corresponding
PET and treatment plan is performed with a second order transformation after
the anatomical landmarks have been applied. Further details and results of the
fusion process are presented in Paper II.
27
In Figure 11 the fused PET (blue), CT (grey) and Dose delivery (yellow) in
displayed. A window in the high dose region is showing the high activity in
adipose tissue surrounding the intestine appearing in dark violet due to a low
activity on a grey CT background.
4.3.2 Patient 4
In Paper III the study from a male prostate cancer patient receiving a palliative
dose of 8 Gy using 50 MV photons is presented. The PET image on the cover
of this thesis illustrates a new elastic deformation mode of patient setup that is
not normally considered during radiation therapy. It shows how the rotation of
the soft tissues around bony structures together with the dose delivery can be
substantially deformed between treatment fractions. The dose delivery took
place about 7 min earlier under perfect 4 field box conditions with parallel op-
posed horizontal and vertical beam pairs. However, the patient set up in the
PET/CT scanner was very fast, trying to register as high activity as possible.
This caused the soft tissue on the right side of the patient bulging out far too
much, making the previous dose delivery severely tilted. The perfect 180°, 270°,
0° and 90° beam portals during treatment look more like 192°, 276°, 12° and
96° when imaged with PET. Of course, but too a much smaller degree, this
happens every day during radiation therapy and may add substantially to the
effective penumbra of the incident beams.
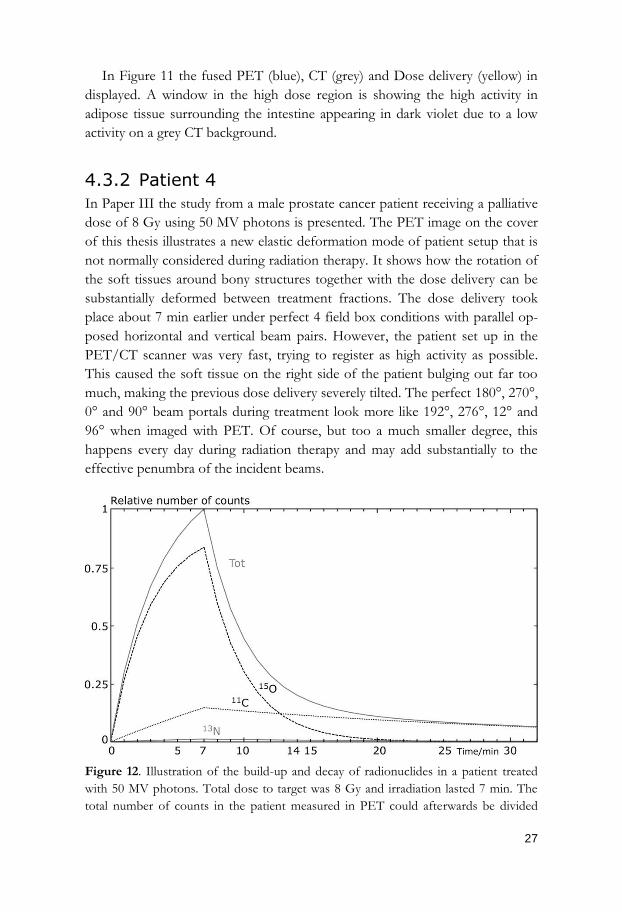
Figure 12. Illustration of the build-up and decay of radionuclides in a patient treated
with 50 MV photons. Total dose to target was 8 Gy and irradiation lasted 7 min. The
total number of counts in the patient measured in PET could afterwards be divided

28
into counts originating from 15O (t½= 2 min), 11C (t½= 20 min) and 13N (t½= 10 min).
In some water rich tissues the count rate from 15O is almost 10 times higher than of 11C.
After PET acquisition, time analysis of the decay curve allowed separation of
registered counts, described in detail in Paper III. As seen in Figure 12, the
counts originating from 15O were less than 30% of the total number of counts
at the beginning of PET measurement (time 14 min). Calculating backwards
however, the 15O count-rate was almost 80% of the total count-rate at the end
of irradiation. This is of course due to the short half-life of 15O and indicates
that much higher activities would be expected if the PET/CT was located at
the Radiation Therapy Department, preferably in close connection to the accel-
erator. A gain in activity signal of about 4-8 times would be received if the
transport time was reduced from 7 min to 1 min. This equals a count rate of
approximately 30-40% of a standard 18F-FDG investigation.
Figure 13. Transaxial sections of the total PET (upper left), 11C separated PET (upper
right), 15O separated PET (lower left) and attenuation correction CT.
Although a rather low activity level was measured by PET, an attempt to sepa-
rate the included radionuclides based on their different half-lives was per-
formed. The result is presented in Figure 13. It is obvious that a large part of
the 15O image consists of noise due to poor counting statistics. However, the
lack of 11C in the urinary bladder is clear as well as a certain 15O activity in the

29
region of the last beam entrance (patient left side). In Paper III is also shown
how well the decay constants of the radionuclides can be determined as well as
estimations of the composition of selected volumes of interests (VOIs) can be
done. We have assumed that biological perfusion processes can be neglected
after a time period of 7 min which means that all measured activity originates
from stationary tissue.
30
5 Validation using Monte Carlo simulations
In order to validate positron activity distributions of delivered 50 MV photon
beam profiles of various spectra- and energy distributions, measurements and
Geant4 simulations were performed using a homogeneous graphite phantom
(Paper V). Since graphite consists of only carbon (12C), there will be no other
photoneutron reactions than 12C(,n)11C, which makes positron activity meas-
urements simpler in that decay correction does not have to be accounted for
due to the long half-life of 11C. Also, the distribution of the activated carbon in
the phantom will be homogeneously distributed; therefore the activation from
the beam will be easier to interpret. The graphite phantom had a cylindrical
shape with a diameter of 19.5 cm, height 11.4 cm and a density of 1.787 g/cm3.
Furthermore, measurements of narrow scanned photon beams were per-
formed using thin 3 mm and 6 mm Be transmission targets. The original pur-
pose was to construct an electron collector for the transmitted high energy
electrons. The high energy electrons that are transmitted through the target
must be magnetically removed in order to produce a pure photon beam. How-
ever, when deflecting the transmitted electrons onto one of the collimator
blocks it was found that the photon beam was contaminated and a “tail” was
created as seen in Paper IV. To examine the origin of this tail we performed
Geant4 simulations where all particles were tracked through the treatment head
and compared to measurements in a water phantom.
5.1 Experimental measurements
Measurements with 50 MV photons were performed at the Racetrack Micro-
tron using a 3 mm- and a 6 mm Be transmission target and are presented in
detail in Paper IV and V. Beam profiles of both bremsstrahlung kernels and
10x10 cm2 fields were investigated. Diode and ionization chamber measure-
ments of the energy deposition were performed in water and compared to sim-
ulations (Figure 2 and 3, Paper IV). The measurements in a graphite phantom
31
were followed by PET acquisition of induced activity using the Siemens Bio-
graph-64 PET/CT.
5.2 Geant4 simulations
The Monte Carlo simulations in Paper IV and V were performed with Geant4
version 9.4.3. The strongly inhomogeneous magnetic field produced by the
purging magnet, placed after the bremsstrahlung target, was calculated with
Opera 3D/Tosca (a finite element based simulation program). This magnetic
field was then incorporated in the simulations to accurately track the deflection
of the transmitted electrons.
In Figure 1, Paper IV a schematic view of experimental and simulation setup
is shown. The simplified simulation geometry consists of a bremsstrahlung
target, a lead block collimator, a wolfram collimator, and a graphite phantom.
The 50 MeV primary electrons are impinging on a target of 6 mm Be where
most are transmitted through and then deflected by the magnetic field onto the
block collimator. Of the incident electrons, only a few deposit all their energy in
the form of bremsstrahlung in the transmission targets, which then hit the
graphite phantom. Here the deposited dose, photon fluence differetial in ener-
gy, and photon energy fluence differental in energy are scored in 2x2x2 mm3
voxels. A large number (0.5 to 1x10⁹) histories were simulated for each target
and primary electron energy.
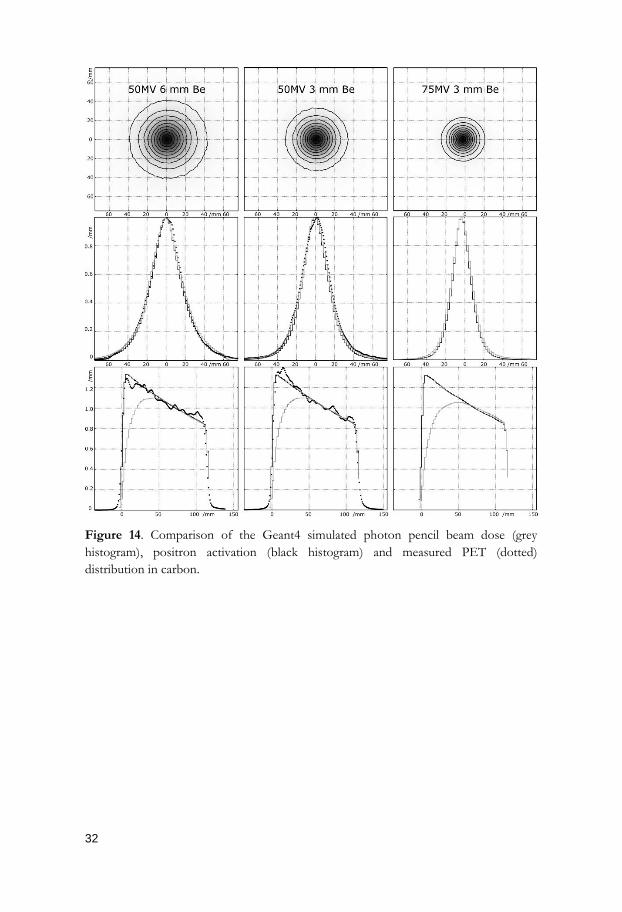
In Figure 14 the results from simulations and measurements of lateral and
depth- beam kernel profiles are compared for 50 MV photons from a 6 mm Be
target and a 3 mm Be target as well as 75 MV photons from a 3 mm Be target.
In the two upper panels it is seen that a thinner target and a higher energy re-
sults in a sharper lateral pencil beam profile. Interestingly, the measured PET is
slightly wider than the simulated dose distribution. This is partly due to the
resolution of the PET (≈ 4 mm), but also due to that the secondary electrons
have a higher energy than the positrons and hence will be more forward di-
rected. Moreover, the depth profiles of the kernels, shown in the lowest panel,
display how the induced activity is proportional to the deposited dose only
beyond dose maximum. In the build-up region the dose is strictly proportional
to the photons set in motion by the secondary electrons, while the activity is
proportional to the primary photon fluence.
32
Figure 14. Comparison of the Geant4 simulated photon pencil beam dose (grey
histogram), positron activation (black histogram) and measured PET (dotted)
distribution in carbon.
33
6 Conclusions and outlook
A new method for in vivo treatment verification in a manner not previously
possible has been developed for high energy photons by the use of clinical
PET/CT imaging. The technique studied is based on 50 MV scanned photon
beams and involves the in vivo creation of positron emitting radionuclides when
photons interact through photonuclear reactions with the body tissues. The
main observations made from this thesis are the following:
The method is sensitive enough to detect deviations in the delivered
treatment from that in the treatment plan. Verification of the beam
portals by imaging the highly activated subcutaneous fat can be per-
formed with mm precision since minor biological transport processes
occur in this tissue region.
The PET/CT scanner should preferably be placed as close to the
treatment unit as possible to maximize the signal when imaging espe-
cially the fast decaying radionuclide 15O. About 70-80% of the induced
overall activity originates from 15O as it constitutes a major part of
body tissues.
Radiation therapy with narrow scanned photon beams does not only
have the capabilities to create sharp dose gradients but is also the op-
timal choice for treatment verification of induced tissue activity be-
cause of their harder photon spectrum. Although high energy photon
therapy systems are rather expensive in comparison with traditional
low MV IMRT photon techniques, they could offer the unique ad-
vantages of in vivo treatment verification as well as reduced integral
dose for deep seated tumors.
The low count rate (about 5% of a standard 18F-FDG treatment) re-
sulting from the activation of tissues make the method very sensitive to
the choice of reconstruction algorithm.
34
The registration of the photon interactions in the irradiated tissues is in
a way similar to the standard tumor PET/CT imaging technique used
in the clinic and allows the tracing of irradiated tissues even after
changes of the patient posture. Biological washout of activity such as
perfusion due to vascular circulation is generally a very fast process in
well vascularized organs (in the order of seconds-minutes). Slower pro-
cesses, including diffusion, happen over a longer time-interval. It is in-
teresting to consider the possibilities of detecting and measuring tumor
hypoxia after tissue activation if PET/CT was in close proximity to the
radiotherapy room.
The approach is also of general applicability in other types of radiation
therapy where positron emitters are produced such as light ions (H,
He, Li, Be, B, C) and protons.
It is interesting to see how many important aspects of high energy photon radi-
ation therapy can be verified by PET/CT imaging. The method studied in this
thesis could be clinically implemented with a PET/CT located close to the
accelerator to allow the following key factors of the treatment to be checked
(with expected uncertainties indicated in parenthesis) as accurate as possible:
Estimation of mean dose to the tumor volume ( %5D )
Validation of beam entrance profiles in subcutaneous fat (±4 mm in
location and ±10% in dose)
Beam shifts in all three dimensions (x, y, z ±2 mm)
Determination of second order deformation modes of the patient
Estimation of mean dose to organs at risk ( %10oar D )
The major sources of uncertainties in the beam setup measurements are due to
a large number of factors, mainly:
Positron range, depending on the tissue type and incoming photon en-
ergy
Biological transport processes
Physical properties of the detector system such as detector size, non-
collinearity of annihilation photons and varying depth of interaction of
photons in the detector
Reconstruction algorithm
35
Elastic deformation of body tissues
Different shapes the diagnostic and therapeutic couches
Respiratory-motion
Manual image fusion
Uncertainties in microscopic tumor spread
In the future it would be desirable to correct for at least some of these factors.
For example, it would be important to develop (or adjust already existing) suit-
able reconstruction algorithms with optimal parameter settings for low count
density PET imaging. De-convolution of the positron range is probably possi-
ble in a near future. Furthermore, would it also be interesting to more thor-
oughly study the biological transport processes in order to investigate what
information that can be extracted regarding tumor oxygenation and vasculariza-
tion for example. Hence, the present thesis shows that PET/CT imaging of
photonuclear reaction, like classical PET/CT imaging with radiopharmaceuti-
cals, is the optimal methods to trace radiation effects to the target tissues. The
combination of these two approaches is therefore the ultimate form of treat-
ment verification and should be possible with high accuracy primarily using
high energy photons or light ion-therapy.
36
7 Summary in Swedish
Noggranna och effektiva behandlingar är av central betydelse inom
strålbehandling. Både dosimetrisk och geometrisk verifikation under en
behandling är fundamentala delar för att uppnå hög kvalitet i strålterapi.
Patientdosmätningar tillsammans med avbildande system (CT) är effektiva
kontroller för att säkerställa att planerad behandling och dosvärden stämmer
överens med verkliga uppmätta värden. Vanligen sker dessa mätningar före, i
mitten av eller efter en strålbehandling och hjälper till att upptäcka förändringar
i patientens anatomi samt fel i dos- eller strålfördelningen. Det optimala skulle
vara att kombinera dosimetri och avbildning i en och samma process. D v s att
på ett bra sätt kunna mäta geometri- och dosfördelningen under tiden för
strålbehandlingen och på så sätt kunna planera inför nästa fraktion genom
adaptiv strålbehandling.
PET (Positron Emission Tomography) är en avbildningsteknik där
sönderfallet av positronemitterande radioaktiva markörer studeras genom
detektion av två motriktade annihilationsfotoner, med vardera energin 0.511
MeV. Detta möjliggör avbildning av processer i kroppen som visar på dess
funktion och inte bara ger en anatomisk information. Inom onkologin används
PET för att studera cellmetabolismen i tumörer genom att märka radionukliden 18F till en glukosmolekyl, FDG. Eftersom tumörer ofta har en högre
ämnesomsättning än omkringliggande celler tas en större mängd 18F-FDG upp
hos dessa och det blir möjligt att upptäcka både primära och sekundära
(metastaser) tumörer som annars är svåra eller omöjliga att upptäcka med CT
eller MR.
Syftet med denna studie har varit att undersöka om man kan använda PET
för att avbilda en strålbehandling som har levererats med 50 MV fotoner. När
man använder fotoner med hög energi (> 15 MeV) sker fotonukleära reaktioner
med atomernas kärnor i den bestrålade vävnaden. I processen slås en neutron
ut och kvar lämnas en positronemitterande radionuklid som sedan kan mätas
med PET. Eftersom människokroppen till allra största del består av 1H (11%), 12C (26%), 16O (60%) och 14N (3%) är det de radioaktiva nukliderna 11C, 15O
och 13N som framförallt bildas under strålbehandligen. Om dessa detekeras
med PET blir det möjligt att få en bild av hur strålfälten har levererats till
patienten och om de överensstämmer med den behandling som var planerad.
37
Diskrepenser kan tyda på mispositionering av patienten, strålfälten,
deformationer i patienten eller andra anatomiska förändringar som har skett
under behandlingens gång.
I denna studie har strålbehandling skett med 50 MV fotoner som genererats
med en 50 MeV elektronaccelerator (Racetrack Microtron), tidigare installerad
på Strålterapiavdelningen på Karolinska Universitetssjukhuset. Efterföljande
aktivitetsmätningar har utförts på Nuklearmedicinska avdelningen och på
Neuroradiologiska avdelningen där tillgång till PET och PET/CT funnits.
Mätningar har gjorts på fantom (grafit och PMMA), fryst djurvävnad (fläsklägg)
samt på sammanlagt fyra patienter. Simulering av smala fotonstrålar har gjorts i
Monte Carlo programmet Geant4 där även den fotonukleära
aktiveringsprocessen har studerats. Simuleringarna har jämförts med uppmätta
resultat.
Eftersom halveringstiderna för de aktiverade nukliderna i vävnaden är
mycket korta; t½(11C)=20 min, t½(15O)=2 min och t½(13N)= 10 min är
mätresultatet mycket beroende av tiden mellan bestrålning och PET mätning.
För att få ut så mycket information som möjligt ur en mätning är det viktigt att
denna transport är så kort som möjligt. Helst borde den vara mindre än ett par
minuter för att inte den viktiga signalen från 15O ska gå förlorad. Detta kan
åstadkommas genom att ha tillgång till PET/CT i anslutning till
behandlingsrummet så att patienten kan förlyttas inom loppet av en minut
Resultatet av de mätningar som har gjorts har visat att det finns goda
möjligheter att avbilda strålfälten ur den aktiverade vävnaden och att
information kan användas för att avgöra om strålbehandlingen har levererats
korrekt till patienten.

38
Acknowledgements
I would like to express my sincere gratitude to
Anders Brahme, my co-author and supervisor. You are a true visionary and
your encouragement is contagious. Thank you for believing in me.
Cathrine Jonsson, my co-author and supervisor, for your help and support even
at latest hours. Thank you for being such a great rolemodel.
Iuliana Dasu, my supervisor, for your guidance and helping me in the last mi-
nute.
Roger Svensson, for supervising me during my first years.
Marilyn E Noz, my co-author, for pushing me and for always helping me out.
Although not my supervisor on paper, you sure took care of me as if you were.
Peder Näfstadius, my co-author, for all your help. Det MÅSTE ha varit en
strömpuls!
Björn Andreassen. Those hours, days, weeks, months, (years) at the Racetrack ..
A she-devil she was! Always remember it with joy.
Irena Gudowska, my co-author, for sharing some of your excellence in the field
of nuclear physics with me.
Hans Jacobsson, my co-author, for your encouragement and your excellent
advices, both scientific and non-scientific.
My co-authors Ingemar Näslund and Rickard Holmberg.
Chip, for proof reading in the last minute.
Bosse Nilsson for the excellent education in the field of radiation physics.

39
Lil Engström. Tack för alla gånger du fanns där när jag var på väg att ge upp.
Marianne. Ann-Charlotte. Du är saknad, det blev väldigt tomt på MSF utan dig.
Johan Uhrdin for all our (un)successful experiments. It was fun though!
The entire staff at the Section of Radiotherapy Physics and Engineering for you
time and support in everything from dose-planning to films measurements,
especially Ricardo Palanco-Zamora, Mauricio Alvarez-Fonseca, Bruno Sorcini,
Vladimir Kecic, Eija Flygare, Anette Rönnquist, Elisabeth Agner, Boel Hedlund
Svedmyr, Anders Carlson and Mathias Westermark.
The entire staff at the Nuclear Medicine Department for making me feel wel-
come and always giving me a helping hand when needed, particularly PO
Schnell, Lars Johansson, Richard Odh, Robert Hatherly, Fredrik Brolin and
Ove Johansson.
Martin Ingvar, Julio Gabriel and Nils Sjöholm at the Department of Clinical
Neuroscience for your help with the p
The staff at Scanditronix AB, for all the assistance with the racetrack.
The entire staff at the Department of Medical Radiation Physics. All the kind
people I have met through the years and all the friends I have made. Thank you
for all the fun, I will miss you!
My former MSF fellow worker Robert Rosengren. All my computer knowledge
is thanks to you. But mostly, thank you for being such a great friend.
My beautiful friends. Thank you for all the crazy things we do.
Min familj. För er kärlek och ert stöd.
Christian and Jacob. För att ni finns i mitt liv. CeS.
This work has been supported by grants from The Cancer Research Funds of
Radiumhemmet, The EU Project BIOCARE and MAMMI, VINNOVA Center
of Excellence.
40
References
Aaltonen, P. et al., 1997. Specification of dose delivery in radiation therapy.
Recommendation by the Nordic Association of Clinical Physics
(NACP). Acta Oncologica (Stockholm, Sweden), 36 Suppl 10, pp.1-32.
Ambrosini, V. et al., 2008. 68Ga-DOTA-peptides versus 18F-DOPA PET for
the assessment of NET patients. Nuclear Medicine Communications, 29(5),
pp.415-417.
Anon, 2012. Experimental Nuclear Reaction Data (EXFOR/CSISRS), Vienna,
Austria: International Atomic Energy Agency—Nuclear Data Section.
Available at: http://www.nndc.bnl.gov/exfor [Accessed January 31,
2012].
Apisarnthanarax, S. & Chao, K.S.C., 2005. Current imaging paradigms in radia-
tion oncology. Radiation Research, 163(1), pp.1-25.
Bennett, G.W. et al., 1978. Visualization and Transport of Positron Emission
from Proton Activation in vivo. Science (New York, N.Y.), 200(4346),
pp.1151-1153.
Blankenberg, F.G., 2008. In vivo imaging of apoptosis. Cancer Biology & Therapy,
7(10), pp.1525-1532.
Brahme, A, 1982. Physical and biologic aspects on the optimum choice of radi-
ation modality. Acta Radiologica. Oncology, 21(6), pp.469-479.
Brahme, A, 2011. Accurate description of the cell survival and biological effect
at low and high doses and LET’s. Journal of Radiation Research, 52(4),
pp.389-407.
Brahme, A, 2003. Biologically optimized 3-dimensional in vivo predictive assay-
based radiation therapy using positron emission tomography-
computerized tomography imaging. Acta Oncologica (Stockholm, Sweden),
42(2), pp.123-136.
41
Brahme, A, Nyman, P. & Skatt, B., 2008. 4D laser camera for accurate patient
positioning, collision avoidance, image fusion and adaptive approaches
during diagnostic and therapeutic procedures. Medical Physics, 35(5),
pp.1670-1681.
Chadwick, M.B. & Young, P.G., 1999. LANL Photonuclear LA150.G File (Pro-
duced with FKK/GNASH/GSCAN code), Los Alamos, NM: Los Alamos
National Laboratory.
Chatterjee, A. et al., 1981. High energy beams of radioactive nuclei and their
biomedical applications. International Journal of Radiation Oncology, Biology,
Physics, 7(4), pp.503-507.
Delso, G. et al., 2011. Performance measurements of the Siemens mMR inte-
grated whole-body PET/MR scanner. Journal of Nuclear Medicine: Official
Publication, Society of Nuclear Medicine, 52(12), pp.1914-1922.
Devic, S. et al., 2010. Defining radiotherapy target volumes using 18F-fluoro-
deoxy-glucose positron emission tomography/computed tomography:
still a Pandora’s box? International Journal of Radiation Oncology, Biology,
Physics, 78(5), pp.1555-1562.
Dietrich, S. & Berman, B., 1988. Atlas of photoneutron cross sections obtained
with monoenergetic photons. Atomic Data and Nuclear Data Tables,
38(2), pp.199-338.
Ekström, L.P. & Firestone, R.B., 1999. Table of Radioactive Isotopes database
version 2/28/99. Available at: http://ie.lbl.gov/toi [Accessed January
31, 2012].
Emami, B. et al., 1981. Effects of single-dose irradiation in tumor blood flow
studied by 15O decay after proton activation in situ. Radiology, 141(1),
pp.207-209.
Enghardt, W. et al., 1999. The application of PET to quality assurance of
heavy-ion tumor therapy. Strahlentherapie Und Onkologie: Organ Der
Deutschen Röntgengesellschaft ... [et Al], 175 Suppl 2, pp.33-36.
Fiedler F, Crespo P, Sellesk M, Parodi K and Enghardt W 2006 The feasibility
of in-beam PET for therapeutic beams of 3He IEEE Trans. Nucl. Sci.
53 pp. 2252-9.

42
Ford, E.C. et al., 2003. Respiration-correlated spiral CT: a method of measuring
respiratory-induced anatomic motion for radiation treatment planning.
Medical Physics, 30(1), pp.88-97.
Fox, J.J. et al., 2011. Practical approach for comparative analysis of multilesion
molecular imaging using a semiautomated program for PET/CT. Jour-
nal of Nuclear Medicine: Official Publication, Society of Nuclear Medicine,
52(11), pp.1727-1732.
Fuccio, C. et al., 2011. When should F-18 FDG PET/CT be used instead of
68Ga-DOTA-peptides to investigate metastatic neuroendocrine tu-
mors? Clinical Nuclear Medicine, 36(12), pp.1109-1111.
Fuller, E.G., 1985. Photonuclear reaction cross sections for 12C, 14N and 16O.
Physics Reports, 127(3), pp.185-231.
Fuller, E.G. & Hayward, E., 1976. Photonuclear Reactions, Stroudsburg, Pennsyl-
vania: Dowden, Hutchinson & Ross.
Gambhir, S.S., 2008. Molecualr imaging of cancer: from molecules to humans.
Introduction. Journal of Nuclear Medicine: Official Publication, Society of Nu-
clear Medicine, 49 Suppl 2, p.1S-4S.
Hansen, A.T., Hansen, S.B. & Petersen, J.B., 2008. The potential application of
silver and positron emission tomography for in vivo dosimetry during
radiotherapy. Physics in Medicine and Biology, 53(2), pp.353-360.
Hayward, E., 1970. Photonuclear Reactions, National Bureau of Standards.
Hishikawa, Y. et al., 2002. Usefulness of positron-emission tomographic images
after proton therapy. International Journal of Radiation Oncology, Biology,
Physics, 53(5), pp.1388-1391.
Hughes, W.L. et al., 1979. Tissue perfusion rate determined from the decay of
oxygen-15 activity after photon activation in situ. Science (New York,
N.Y.), 204(4398), pp.1215-1217.
International Commission on Radiation Units and Measurements, 1992. ICRU
report 46, International Commission on Radiation Units and Measure-
ments.
43
Iseki, Y. et al., 2004. Range verification system using positron emitting beams
for heavy-ion radiotherapy. Physics in Medicine and Biology, 49(14),
pp.3179-3195.
Jager, P.L. et al., 2008. 6-L-18F-fluorodihydroxyphenylalanine PET in neuroen-
docrine tumors: basic aspects and emerging clinical applications. Journal
of Nuclear Medicine: Official Publication, Society of Nuclear Medicine, 49(4),
pp.573-586.
Janek, S. et al., 2006. Development of dose delivery verification by PET imag-
ing of photonuclear reactions following high energy photon therapy.
Physics in Medicine and Biology, 51(22), pp.5769-5783.
Jemal, A. et al., 2011. Global cancer statistics. CA: A Cancer Journal for Clinicians,
61(2), pp.69-90.
Kawakami, Y. et al., 2005. Initial application of respiratory-gated 201Tl SPECT
in pulmonary malignant tumours. Nuclear Medicine Communications, 26(4),
pp.303-313.
Keall, P.J. et al., 2001. Motion adaptive x-ray therapy: a feasibility study. Physics
in Medicine and Biology, 46(1), pp.1-10.
Kenny, L.M., Goergen, S.K. & Mandel, C.J., 2007. Towards the appropriate use
of diagnostic imaging. The Medical Journal of Australia, 187(8), p.473; au-
thor reply 474.
Kluge, T. et al., 2007. First in-beam PET measurement of beta+ radioactivity
induced by hard photon beams. Physics in Medicine and Biology, 52(20),
pp.N467-473.
Kwee, S.A. et al., 2007. Cancer imaging with fluorine-18-labeled choline deriva-
tives. Seminars in Nuclear Medicine, 37(6), pp.420-428.
Lax, I. et al., 1994. Stereotactic radiotherapy of malignancies in the abdomen.
Methodological aspects. Acta Oncologica (Stockholm, Sweden), 33(6),
pp.677-683.
Lazzeroni, M. & Brahme, A, 2011. Production of clinically useful positron emit-
ter beams during carbon ion deceleration. Physics in Medicine and Biology,
56(6), pp.1585-1600.
44
Lind, B.K. & Brahme, Anders, 2007. The radiation response of heterogeneous
tumors. Physica Medica: PM: An International Journal Devoted to the Applica-
tions of Physics to Medicine and Biology: Official Journal of the Italian Association
of Biomedical Physics (AIFB), 23(3-4), pp.91-99.
Llacer, J., Chatterjee, A., et al., 1984. Imaging by injection of accelerated radio-
active particle beams. IEEE Transactions on Medical Imaging, 3(2), pp.80-
90.
Llacer, J., Tobias, C.A., et al., 1984. On-line characterization of heavy-ion
beams with semiconductor detectors. Medical Physics, 11(3), pp.266-278.
Lu, W. et al., 2006. Real-time respiration monitoring using the radiotherapy
treatment beam and four-dimensional computed tomography (4DCT)-
-a conceptual study. Physics in Medicine and Biology, 51(18), pp.4469-4495.
Mah, D. et al., 2000. Technical aspects of the deep inspiration breath-hold
technique in the treatment of thoracic cancer. International Journal of Ra-
diation Oncology, Biology, Physics, 48(4), pp.1175-1185.
Mankoff, D.A., 2008. Molecular imaging as a tool for translating breast cancer
science. Breast Cancer Research: BCR, 10 Suppl 1, p.S3.
Murphy, M.J., 1997. An automatic six-degree-of-freedom image registration
algorithm for image-guided frameless stereotaxic radiosurgery. Medical
Physics, 24(6), pp.857-866.
Müller, H. & Enghardt, W., 2006. In-beam PET at high-energy photon beams:
a feasibility study. Physics in Medicine and Biology, 51(7), pp.1779-1789.
Möckel, D. et al., 2007. Quantification of beta+ activity generated by hard pho-
tons by means of PET. Physics in Medicine and Biology, 52(9), pp.2515-
2530.
Nehmeh, S.A., Erdi, Y.E., Pan, T., Pevsner, A., et al., 2004. Four-dimensional
(4D) PET/CT imaging of the thorax. Medical Physics, 31(12), pp.3179-
3186.
Nehmeh, S.A., Erdi, Y.E., Pan, T., Yorke, E., et al., 2004. Quantitation of res-
piratory motion during 4D-PET/CT acquisition. Medical Physics, 31(6),
pp.1333-1338.
45
Nilsson, B. & Brahme, A, 1983. Relation between kerma and absorbed dose in
photon beams. Acta Radiologica. Oncology, 22(1), pp.77-85.
Nilsson C 2007 Quantification of the influence of blood flow on in vivo dose
determination in radiation therapy using PET-CT imaging MSc Thesis
Dept. Med. Rad. Phys., Karolinska Institutet and Uppsala University
Nishio, T. et al., 2006. Dose-volume delivery guided proton therapy using beam
on-line PET system. Medical Physics, 33(11), pp.4190-4197.
Nishio, T. et al., 2008. Experimental verification of proton beam monitoring in
a human body by use of activity image of positron-emitting nuclei gen-
erated by nuclear fragmentation reaction. Radiological Physics and Technol-
ogy, 1(1), pp.44-54.
Nussbaum, G.H. et al., 1983. Use of the Clinac-35 for tissue activation in non-
invasive measurement of capillary blood flow. Medical Physics, 10(4),
pp.487-490.
Ohara, K. et al., 1989. Irradiation synchronized with respiration gate. Internation-
al Journal of Radiation Oncology, Biology, Physics, 17(4), pp.853-857.
Parodi, K. et al., 2007. Patient study of in vivo verification of beam delivery and
range, using positron emission tomography and computed tomography
imaging after proton therapy. International Journal of Radiation Oncology,
Biology, Physics, 68(3), pp.920-934.
Parodi, K., Bortfeld, T. & Haberer, T., 2008. Comparison between in-beam and
offline positron emission tomography imaging of proton and carbon
ion therapeutic irradiation at synchrotron- and cyclotron-based facili-
ties. International Journal of Radiation Oncology, Biology, Physics, 71(3),
pp.945-956.
Pawelke, J. et al., 1996. The investigation of different cameras for in-beam PET
imaging. Physics in Medicine and Biology, 41(2), pp.279-296.
Pichler, B.J. et al., 2010. PET/MRI: paving the way for the next generation of
clinical multimodality imaging applications. Journal of Nuclear Medicine:
Official Publication, Society of Nuclear Medicine, 51(3), pp.333-336.
46
Pio, B.S. et al., 2006. Usefulness of 3’-[F-18]fluoro-3’-deoxythymidine with
positron emission tomography in predicting breast cancer response to
therapy. Molecular Imaging and Biology: MIB: The Official Publication of the
Academy of Molecular Imaging, 8(1), pp.36-42.
Rodriguez-Porcel, M. et al., 2008. Reporter gene imaging following percutane-
ous delivery in swine moving toward clinical applications. Journal of the
American College of Cardiology, 51(5), pp.595-597.
Shimizu, S. et al., 2000. Use of an implanted marker and real-time tracking of
the marker for the positioning of prostate and bladder cancers. Interna-
tional Journal of Radiation Oncology, Biology, Physics, 48(5), pp.1591-1597.
Shirato, H. et al., 2000. Physical aspects of a real-time tumor-tracking system
for gated radiotherapy. International Journal of Radiation Oncology, Biology,
Physics, 48(4), pp.1187-1195.
Ten Haken, R.K. et al., 1981. Photon activation-15O decay studies of tumor
blood flow. Medical Physics, 8(3), pp.324-336.
Tobias, C.A. et al., 1977. Particle radiography and autoactivation. International
Journal of Radiation Oncology, Biology, Physics, 3, pp.35-44.
Toma-Dasu, I. et al., 2012. Dose prescription and treatment planning based on
FMISO-PET hypoxia. Acta Oncologica (Stockholm, Sweden), 51(2), pp.222-
230.
Townsend, D.W., 2008. Dual-modality imaging: combining anatomy and func-
tion. Journal of Nuclear Medicine: Official Publication, Society of Nuclear Medi-
cine, 49(6), pp.938-955.
Verellen, D. et al., 2006. Optimal control of set-up margins and internal mar-
gins for intra- and extracranial radiotherapy using stereoscopic kilo-
voltage imaging. Cancer Radiothérapie: Journal De La Société Française De
Radiothérapie Oncologique, 10(5), pp.235-244.
Wong, J.W. et al., 1999. The use of active breathing control (ABC) to reduce
margin for breathing motion. International Journal of Radiation Oncology,
Biology, Physics, 44(4), pp.911-919.

47
Zaidi, H. & El Naqa, I., 2010. PET-guided delineation of radiation therapy
treatment volumes: a survey of image segmentation techniques. Europe-
an Journal of Nuclear Medicine and Molecular Imaging, 37(11), pp.2165-2187.
Zaidi, H. & Del Guerra, A., 2011. An outlook on future design of hybrid
PET/MRI systems. Medical Physics, 38(10), pp.5667-5689.
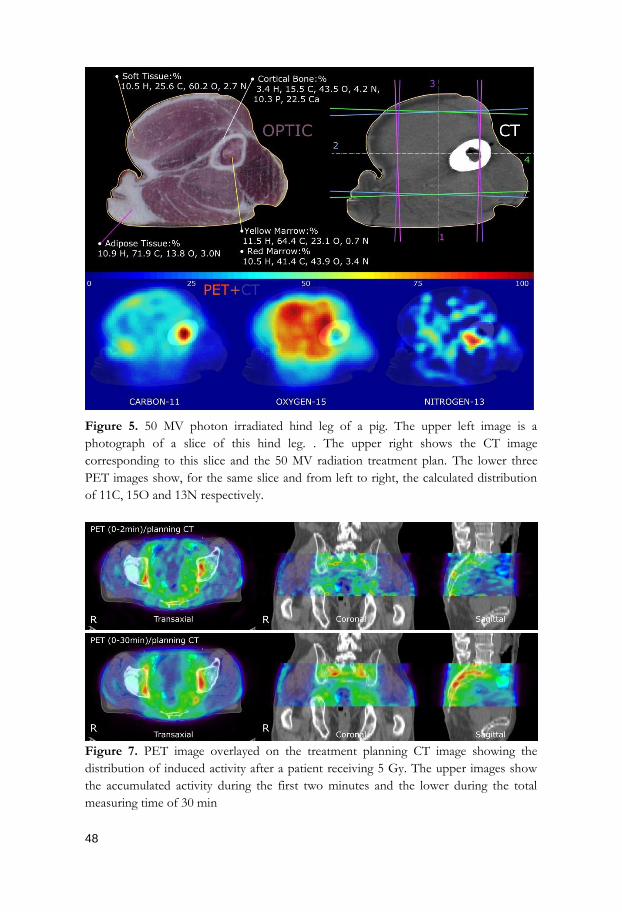
48
Figure 5. 50 MV photon irradiated hind leg of a pig. The upper left image is a
photograph of a slice of this hind leg. . The upper right shows the CT image
corresponding to this slice and the 50 MV radiation treatment plan. The lower three
PET images show, for the same slice and from left to right, the calculated distribution
of 11C, 15O and 13N respectively.
Figure 7. PET image overlayed on the treatment planning CT image showing the
distribution of induced activity after a patient receiving 5 Gy. The upper images show
the accumulated activity during the first two minutes and the lower during the total
measuring time of 30 min
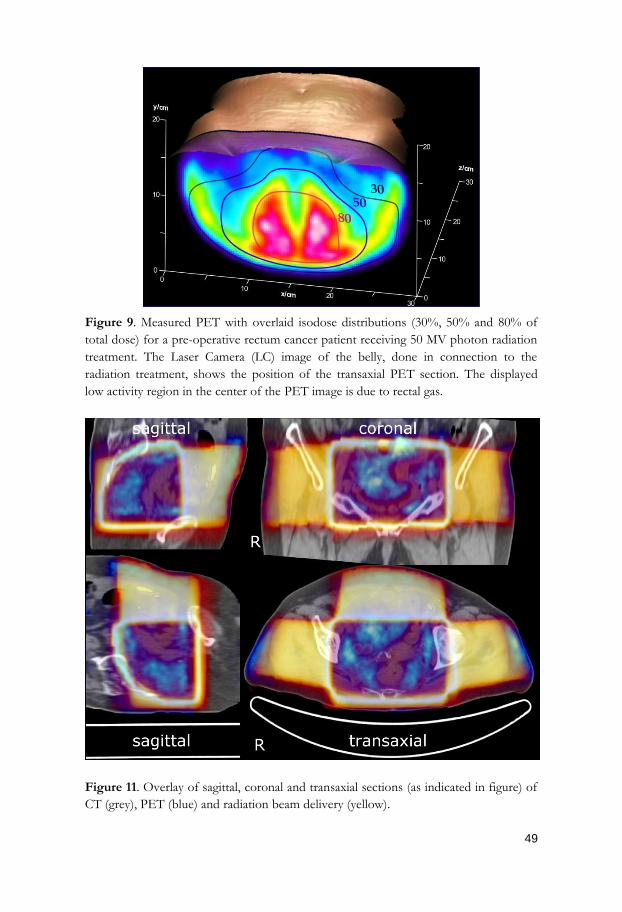
49
Figure 9. Measured PET with overlaid isodose distributions (30%, 50% and 80% of
total dose) for a pre-operative rectum cancer patient receiving 50 MV photon radiation
treatment. The Laser Camera (LC) image of the belly, done in connection to the
radiation treatment, shows the position of the transaxial PET section. The displayed
low activity region in the center of the PET image is due to rectal gas.
Figure 11. Overlay of sagittal, coronal and transaxial sections (as indicated in figure) of
CT (grey), PET (blue) and radiation beam delivery (yellow).