Embed Size (px)
Citation preview

ACTAUNIVERSITATIS
UPSALIENSISUPPSALA
2016
Digital Comprehensive Summaries of Uppsala Dissertationsfrom the Faculty of Medicine 1269
Ventilation/Perfusion Matchingand its Effect on VolatilePharmacokinetics
MORITZ ANDREAS KRETZSCHMAR
ISSN 1651-6206ISBN 978-91-554-9732-3urn:nbn:se:uu:diva-304298

Dissertation presented at Uppsala University to be publicly examined in Enghoffsalen,Akademiska sjukhuset, Uppsala, Thursday, 8 December 2016 at 09:15 for the degree ofDoctor of Philosophy (Faculty of Medicine). The examination will be conducted in English.Faculty examiner: Professor Jan Jakobsson (Danderyds sjukhus; National RespiratoryCenter).
AbstractKretzschmar, M. A. 2016. Ventilation/Perfusion Matching and its Effect on VolatilePharmacokinetics. Digital Comprehensive Summaries of Uppsala Dissertationsfrom the Faculty of Medicine 1269. 53 pp. Uppsala: Acta Universitatis Upsaliensis.ISBN 978-91-554-9732-3.
The mismatching of alveolar ventilation and perfusion (VA/Q) is the major determinant ofimpaired gas exchange. The gold standard for analyzing VA/Q distribution is the multipleinert gas elimination technique (MIGET), conventionally based on gas chromatography (GC),and, although simple in principle, a technically demanding procedure limiting its use. A newtechnique based on micropore membrane inlet mass spectrometry (MMIMS) combined MIGETwith mass spectrometry, simplifying the sample handling process, and potentially providing VA/Q distributions for a general clinical approach.
The kinetics of volatile anesthetics are well known in patients with healthy lungs. Theuptake and distribution of inhaled anesthetics have usually been modeled by physiologicmodels. However, these models have limitations, and they do not consider ventilation/perfusionmatching. Respiratory diseases account for a large part of morbidity and mortality and areassociated with pulmonary VA/Q mismatch that may affect uptake and elimination of volatileanesthetics.
The objectives of the studies were firstly to investigate assessment of VA/Q mismatch byMMIMS and secondly to investigate the effects of asthma-like VA/Q mismatch on the kineticsof volatile anesthetics in an experimental porcine model.
Anesthetized and mechanically ventilated piglets were studied.In study I, a direct comparison of MIGET by MMIMS with the conventional MIGET by GC
in three animal models that covered a wide range of VA/Q distributions was preformed. The twomethods agreed well, and parameters derived from both methods showed good agreement withexternally measured references.
In studies II–IV, a stable method of inducing and maintaining asthma-like VA/Q mismatchwith methacholine (MCh) administration was established, and the effect of VA/Q mismatchon the pharmacokinetics of desflurane and isoflurane was investigated. The present model ofbronchoconstriction demonstrates a delay in volatile anesthetic uptake and elimination, relatedto the heterogeneity of MCh-inhalation induced ventilation. The difference in solubility ofvolatile anesthetics has a significant influence on their uptake and elimination under VA/Qmismatch. The higher blood soluble isoflurane is affected to a lesser degree than the fairlyinsoluble desflurane.
Keywords: Anesthesia, Animal models in research, Mass spectrometry, Gas chromatography,MIGET, Ventilation-perfusion, Desflurane, Isoflurane, Bronchoconstriction
Moritz Andreas Kretzschmar, Department of Surgical Sciences, Hedenstierna laboratory,Akademiska sjukhuset ing 40 2 tr, Uppsala University, SE-751 85 Uppsala, Sweden.
© Moritz Andreas Kretzschmar 2016
ISSN 1651-6206ISBN 978-91-554-9732-3urn:nbn:se:uu:diva-304298 (http://urn.kb.se/resolve?urn=urn:nbn:se:uu:diva-304298)

For my wife and my children

List of Papers
This thesis is based on the following papers, which are referred to in the text by their Roman numerals.
I Kretzschmar M, Schilling T, Vogt A, Rothen HU, Borges JB,
Hachenberg T, Larsson A, Baumgardner JE, and Hedenstierna G. (2013) Multiple inert gas elimination technique by micropore membrane inlet mass spectrometry - a comparison with reference gas chromatography. J Appl Physiol.; 115(8):1107–18.
II Kozian A, Kretzschmar M, Baumgardner JE, Schreiber J, Hedenstierna G, Larsson A, Hachenberg T, and Schilling T. (2015) Effects of methacholine infusion on desflurane pharmacokinetics in piglets. Data Brief. Dec; 5:939–47.
III Kretzschmar M, Kozian A, Baumgardner JE, Schreiber J, Hedenstierna G, Larsson A, Hachenberg T, and Schilling T. (2016) Bronchoconstriction induced by inhaled methacholine delays desflurane uptake and elimination in a piglet model. Respir Physiol Neurobiol.; 220:88–94.
IV Kretzschmar M, Kozian A, Baumgardner JE, Borges JB, Hedenstierna G, Larsson A, Hachenberg T, and Schilling T. (2016) The Effect of Bronchoconstriction-induced Ventilation/Perfusion-Mismatch on Uptake and Elimination of Isoflurane and Desflurane.; (Manuscript, Anesthesiology, first revision)
Reprints were made with permission from the respective publishers.

Contents
Introduction ................................................................................................... 11Ventilation and perfusion ......................................................................... 11Pharmacokinetics of volatile anesthetics .................................................. 12
Aims of the studies ........................................................................................ 14
Methods ......................................................................................................... 15Subjects ..................................................................................................... 15Anesthesia ................................................................................................. 15Ventilation ................................................................................................ 16Instrumentation ......................................................................................... 16Measurements ........................................................................................... 16Blood Gas Analysis .................................................................................. 17Multiple Inert Gas Elimination Technique (MIGET) ............................... 17Micropore Membrane Mass Spectrometry (MMIMS) ............................. 17Study Protocols ......................................................................................... 18
Protocol study I .................................................................................... 18Protocol studies II–IV .......................................................................... 19
Data Analysis and Statistics ..................................................................... 20
Results ........................................................................................................... 23Study I ....................................................................................................... 23Studies II–IV ............................................................................................. 32
Ventilation ............................................................................................ 32MIGET ................................................................................................. 37
Pharmacokinetics of volatile anesthetics .................................................. 37Calculated uptake and elimination ....................................................... 39
Discussion ..................................................................................................... 41Study I ....................................................................................................... 41Studies II–IV ............................................................................................. 42
Methacholine administration ............................................................... 42Volatile Agents .................................................................................... 43
Limitations ................................................................................................ 44Conclusions .............................................................................................. 45
Acknowledgements ....................................................................................... 47
References ..................................................................................................... 49


Abbreviations
CO cardiac output COPD chronic obstructive pulmonary disease EDTA ethylenediaminetetraacetic acid etCO2 end tidal carbon dioxide partial pressure GC gas chromatography FIO2 inspired fraction of oxygen HPV hypoxic pulmonary vasoconstriction i.v. intravenous IPPV intermittent positive pressure ventilation logSDQ square root of the 2nd moment of perfusion
distribution (in MIGET) logSDV square root of the 2nd moment of ventilation
distribution (in MIGET) MAC minimal alveolar concentration MAP mean arterial pressure MCh methacholine meanVQQ mean VA/Q for the perfusion distribution meanVQV mean VA/Q for the ventilation distribution MIGET Multiple Inert Gas Elimination Technique MMIMS Micropore Membrane Inlet Mass Spectrometry MPAP mean pulmonary artery pressure PAC pulmonary artery catheter paCO2 arterial partial pressure of carbon dioxide paO2 arterial partial pressure of oxygen PAW peak airway pressure PEEP positive end-expiratory pressure PIP peak airway pressure pvCO2 mixed venous partial pressure of carbon dioxide pvO2 mixed venous partial pressure of oxygen PVR pulmonary vascular resistance Q perfusion Qmean mean perfusion (in MIGET) RE retention-excretion Rtot total respiratory resistance SF6 Sulfur hexafluoride SNR signal-to-noise ratio

SVR systemic vascular resistance V ventilation VA/Q alveolar Ventilation/Perfusion relationship Vmean mean ventilation (in MIGET)

11
Introduction
Ventilation and perfusion The mismatching of alveolar ventilation and perfusion (VA/Q) is the major determinant of impaired gas exchange. Other causes of impaired gas exchange are alveolar hypoventilation, diffusion impairment, and right-to-left shunt. The collapse of alveoli or atelectasis formation and alveolar flooding that occurs in acute respiratory distress syndrome and the alveolar consolidation in pneumonia result in shunt, meaning no ventilation but persisting perfusion (VA/Q 0) [1-3], whereas reduced regional ventilation in chronic obstructive pulmonary disease impedes ventilation and produces lung regions with low VA/Q (VA/Q 0.1) and minimal shunt [4]. Although these mechanisms of arterial hypoxemia have different therapeutic implications, a simple blood gas analysis will not allow a distinction between them. Compensatory mechanisms or accompanying abnormalities may mask the effect of the underlying disturbance.
The “gold standard” for analyzing VA/Q distribution is the multiple inert gas elimination technique (MIGET) [5]. Conventional MIGET is based on gas chromatography (GC), which requires tonometry of blood samples with a gas that can then be injected into a chromatograph [5]. Although simple in principle, it is a technically demanding procedure and requires meticulous care, therefore limiting its use to a few research laboratories around the world [3, 6].
During the last two decades, however, a technique based on micropore membrane inlet mass spectrometry (MMIMS) combined MIGET with mass spectrometry without tonometry of the blood [7, 8]. In MMIMS, a polymer membrane confined to a small micropore separates a blood sample from the mass spectrometer and high-vacuum system, and gases diffuse through this membrane into the mass spectrometer for analysis. With the appropriate amplification of the signal, gas concentrations down to a few parts per million can be detected. Direct and automated measurement of inert gas tensions in small blood samples has the potential to make MIGET easier to use by non-specialist laboratories, and to provide VA/Q distributions for a general clinical approach.

12
Pharmacokinetics of volatile anesthetics Anesthesiologists know that “turning the vapor up or down” has markedly different effects in respect to how long the induction or cessation of anesthesia takes in patients with obstructive lung diseases.
The kinetics of volatile anesthetics are very well known in patients with healthy lungs and have been studied thoroughly in earlier landmark studies [9, 10]. These studies have established deep insights into the pharmacokinetics of inhalational anesthetics. The basic information has been validated. The factors determining the alveolar and subsequent blood concentrations of volatile anesthetics comprise alveolar ventilation and cardiac output, the relative solubility of the agent, pressure gradients between alveoli and pulmonary blood, uptake/diffusion of the volatile into pulmonary capillary blood, and redistribution of volatiles from peripheral tissues. The uptake and distribution of inhaled anesthetics have usually been modeled by physiologic models such as Eger’s “four compartment (4C) model” [11]. However, these models often tend to overestimate initial uptake and underestimate uptake after 30–45 min of application [12-14], and they do not consider ventilation/perfusion matching.
With regard to typical comorbidities, obesity is the condition often referred to. The superiority of volatile agents with low blood/gas solubility has been demonstrated in the context of bariatric anesthesia [15-17].
Yet respiratory diseases account for a large part of morbidity and mortality and are projected to increase in the coming years [18, 19]. This is of major importance for clinical anesthesia, since these diseases are associated with pulmonary ventilation/perfusion (VA/Q) mismatch that may affect uptake and elimination of volatile anesthetics [20].
Modern inhalational anesthetics like desflurane have a very low blood solubility, resulting in fast induction of and emergence from anesthesia; nevertheless, anesthetics with higher blood solubility like isoflurane, enflurane, or halothane are still in use.
The end-tidal volatile concentration in the presence of VA/Q mismatch is not necessarily a reliable measure for the arterial blood concentration, as demonstrated by Eger et al. for halothane [21] and by Frei et al. for isoflurane [22]. The molecular weight of the volatile anesthetic could also influence the end-tidal to arterial gradient, as suggested by Landon et al. [23].
The kinetics of volatile anesthetics in pathological conditions of the lung, such as obstructive or restrictive diseases, is mainly derived from pharmacological models, either on the basis of mechanical or mathematical assumptions.
The measurement of the volatile anesthetic’s partial pressure in blood samples is very difficult for methodological reasons. The process typically requires a gas chromatograph and a comprehensive and time-consuming

13
preparation of the samples. Here also, MMIMS offers the possibility to quickly, repetitively and directly measure the amount of volatiles in blood samples. Because MMIMS allows for an almost immediate analysis of the samples and takes only minutes, it is possible to acquire blood profiles of the uptake of volatile anesthetics.

14
Aims of the studies
The objectives of the studies comprising this thesis were firstly to investigate assessment of VA/Q mismatch by MMIMS and secondly to investigate the effects of asthma-like VA/Q mismatch on the kinetics of volatile anesthetics in an experimental porcine model.
The knowledge obtained by these studies could facilitate the understanding on how volatile anesthetics behave in patients with lung disease and should therefore contribute to improved patient care.
The specific objectives of the four present studies were:
I To investigate in a side-by-side comparison the MIGET by MMIMS method with classic gas chromatography and to examine whether MIGET by MMIMS is comparable to MIGET by gas chromatography in different states of VA/Q mismatch.
II To establish a stable method of inducing and maintaining asthma-like VA/Q mismatch with methacholine administration.
III To investigate the effect of VA/Q mismatch on the pharmacokinetics of
the low soluble desflurane. IV To investigate the effect of VA/Q mismatch on the pharmacokinetics of
isoflurane with higher blood solubility.

15
Methods
The present studies were conducted as prospective animal experiments. The Animal Ethics Committee of Uppsala University (Sweden) approved the different experimental protocols. The care and handling of animals were in accordance with the National Institutes of Health guidelines for ethical animal treatment [24].
Subjects Ten piglets of mixed Hampshire, Yorkshire, and Swedish country breeds obtained from a local breeder were included in study I.
A total of 18 healthy, 2.5 month old piglets of mixed Yorkshire/Norwegian country breeds were included in studies II–IV.
The animals fasted overnight with free access to water. The piglets in studies II–IV underwent the same preparatory algorithm (induction and maintenance of anesthesia, monitoring). Parts of the data from six of the animals in the desflurane group of study IV were reported in study III.
Anesthesia Study I: The pigs were anesthetized by an IM injection of xylazine (2.2 mg·kg-1, Rompun; Bayer, Leverkusen, Germany) and tiletamine/zolazepam (6 mg·kg-1, Zoletil; Virbac, Carros, France) (studies I–IV), and additionally atropine (0.04 mg·kg-1; NM Pharma, Stockholm, Sweden) (study I). The trachea was intubated with a 7.0-mm (ID) cuffed endotracheal tube. In all piglets, anesthesia was maintained by continuous infusions of fentanyl (0.04 mg·kg-1·h-1, Leptanal; Janssen-Cilag, Sweden), and midazolam (0.12 mg·kg-
1·hr-1; Actavis Group, Hafnersfjordur, Iceland) (studies I–IV), and ketamine (3.2 mg·kg-1·hr-1, Ketaminol; Intervet, Boxmeer, The Netherlands) (study I) or propofol (Diprivan®; Astra, Södertälje, Sweden; 6 mg·kg-1·h-1 studies II–IV) via an 18-gauge catheter placed in an ear vein. The absence of consciousness was verified by testing the corneal reflex and the hind limb reflex response, and muscle relaxation was induced with a bolus of 2 mg/kg rocuronium (Esmeron; N.V. Organon, Oss, the Netherlands), followed by a continuous infusion of 2.5 mg·kg-1·hr-1 rocuronium. In study I, a median

16
tracheotomy was performed, and the orotracheal tube was replaced by an 8.5-mm ID cuffed tracheal tube.
Ventilation Studies I–IV: After intubation, animals were mechanically ventilated with intermittent positive pressure ventilation (IPPV) with an FIO2 of 0.4 and positive end-expiratory pressure (PEEP) of 5 cmH2O provided by a Servo I ventilator (study I) unless otherwise noted, or by a KION® anesthesia ventilator (Maquet Critical Care, Solna, Sweden studies II–IV) respectively. The tidal volume (VT) was set to 10 ml·kg-1, and respiratory frequencies were adjusted to achieve a normal arterial paCO2 of 40 mmHg. Exhaled end-tidal CO2 (etCO2), gas flow, and airway pressures were measured at the proximal end of the tracheal tube with a NICO capnograph (Respironics, Wallingford, CT).
Instrumentation Studies I–IV: A 14G catheter was placed in one of the front limbs for MIGET infusion. A flow-directed pulmonary artery catheter (PAC, 7.0 French, Swan-Ganz thermo-dilution catheter, Baxter, Irvine, CA, USA) and a single lumen central venous catheter (4.0 French, Becton-Dickinson Critical Care Systems, Singapore) were inserted via the right internal jugular vein. The PAC was used for cardiac output measurements and mixed venous blood sampling. Temperature was also measured by the PAC and maintained by use of heating mats. An arterial catheter was inserted into the right carotid artery for continuous arterial pressure measurements, and a hind limb arterial line was used for blood sampling.
At the end of the experiment, the animals were killed with an i.v. injection of potassium chloride (150meq) while under general anesthesia.
Measurements Vascular pressures were measured with pressure transducers and cardiac output was measured by thermo-dilution. A suprapubic urinary catheter was placed for monitoring urine output.

17
Blood Gas Analysis Blood gas analysis was performed immediately after bubble-free blood sampling with standard blood gas electrodes specifically set up to analyze porcine blood (ABL 500 and OSM3; Radiometer, Copenhagen, Denmark). The blood gas machine was calibrated (one point every hour and two points every 4 h) by internal routines, and always before the day’s measurements.
Multiple Inert Gas Elimination Technique (MIGET) The MIGET procedure is based on the retention and elimination of, in practice, six gases, which have a linear relationship between partial pressure and concentration in the blood (therefore obeying Henry’s law). The differences in the way the lung retains or excretes these gases of different solubility are analyzed to determine a compatible distribution of VA/Q ratios over 50 compartments [6].
Six inert gases are dissolved in saline and infused into a peripheral vein at a constant rate. In conventional MIGET done by gas chromatography (GC), the gases that are usually used, in order from low to high solubility, are sulfur hexafluoride (SF6), ethane, cyclopropane, enflurane (or a substitution of halothane), diethyl ether, and acetone.
To obtain a VA/Q distribution, simultaneous samples of mixed venous blood (input of gases to the lung), systemic arterial blood (gases retained in the lung in blood phase), and mixed expired gas (gases excreted from the lung in gas phase) are analyzed for their inert gas partial pressures by a GC (electron capture for SF6, flame ionization for the other five gases) [5, 25] The measured partial pressures are entered into the MIGET software by Wagner et al. [26]. This software consists of two sequentially run programs. The first program takes all of the input data, computes the retention and excretion values for the sample, and creates an input data file for the second program, which reads those data and performs the least-squares analysis for the VA/Q distributions. It also computes the arterial pO2 and pCO2 expected to result from the VA/Q inequality estimated from the inert gases.
Micropore Membrane Mass Spectrometry (MMIMS) Micropore membrane inlet mass spectrometry (MMIMS) provides a unique combination of rapid response speed and minimal dependence of the signal on inert-gas solubility in the aqueous sample [8].
The system consists of a polymer membrane confined to multiple small micropores that separate the blood sample from the mass spectrometer and high-vacuum system, and gases diffuse through this membrane into the mass

18
spectrometer for analysis. As tonometry is not necessary, the native blood samples are flowed over the MMIMS probes, and the volatile gas partial pressures are analyzed directly by measuring the ion current of the mass/charge ratio for the respective gas.
Arterial and mixed venous blood samples were collected in glass syringes coated with EDTA (FORTUNA®OPTIMA®, 5ml, Luer-lock, Poulten & Graf GmbH, Wertheim, Germany) for analysis by Micropore Membrane Inlet Mass Spectrometry (MIGET by MMIMS System, Oscillogy®, Folsom, PA, USA).
Study Protocols Protocol study I For optimal detection by mass spectrometry, the six gases that have been used previously were as follows: SF6, krypton, desflurane, enflurane, diethylether, and acetone [7]. To enable direct comparison of the MMIMS and GC methods with samples taken at the same time, an infusion with eight inert gases (SF6, krypton, ethane, cyclopropane, desflurane, enflurane, diethylether, and acetone) was used, and six of these measured with MMIMS and six with GC.
The inert gas infusion was prepared by removing the air and 140 ml of saline from a 1-liter bag of saline, adding 100 ml of a mixture of SF6 (20%), ethane (60%), and cyclopropane (15%), and shaking this gas/saline mixture for 10 min to remove dissolved air from the liquid. The excess gas was expelled, and then 19 ml of gas mixture was added to the infusion bag. Next, 200 ml of pure SF6 and 22 ml of pure krypton gas were added to the infusion bag. Finally, the other gases were added with liquid injections: 150 µl desflurane, 180 µl enflurane, 500 µl diethylether, and 7.5 ml acetone. This mixture was infused into a peripheral vein at a basal rate of 2 ml·min-1. Fifteen minutes before each measurement, the infusion rate was increased to 1/300 of cardiac output. Preliminary experiments confirmed that this mixture and infusion rate provided adequate signal-to-noise ratio for each gas, for both methods.
Blood samples for MIGET were collected simultaneously from the pulmonary artery and systemic artery catheters in gas-tight, ungreased, matched barrel glass syringes with a three-way stopcock. After withdrawal of 5 ml of blood in a waste syringe to clear the dead space volume and avoid air bubbles, 7 ml of blood was collected for the GC method in 20 ml syringes prefilled with 0.2 ml of concentrated heparin (5,000 IU/ml) according to standard MIGET by GC procedure, followed by 2.5–2.8 ml of blood collected for the MMIMS method in 5 ml syringes prefilled with 0.2 ml of concentrated EDTA. Any visible gas bubbles were immediately

19
expelled before sealing the syringes with a stopcock. Duplicate mixed expired gas samples (one each for MMIMS and GC) were collected in dry 20 ml, matched-barrel glass syringes from a heated (40°C) mixing chamber (volume 2.5 l) connected to the ventilator outlet. Mixed expired sampling commenced, relative to the blood sampling, after 2.5 l of exhaled gas had passed through the mixing chamber.
Timeline study I:
Figure 1. Timeline of experimental protocol study I. Additional treatments included no treatment (normals), oleic acid administration, or selective left lower lobe (LLL) intubation. Each treatment was instituted and maintained for 45 min followed by MIGET measurements. For normal lungs, normal, hypoV, and hyperV indicate normal, hypo-, and hyperventilation, respectively. For oleic acid injury, PEEP of 5 cmH2O was followed by PEEPA, which was either low (1 cmH2O) or high (10 cmH2O); and then PEEPB, which was the opposite, either high or low. RM, recruitment maneuver; LLLhypoV, left lower lobe hypoventilation; LLLhyperV, LLL hyperventilation; LLLhyperV_DS, LLL hyperventilation with added external dead space.
Protocol studies II–IV Baseline: Following an alveolar recruitment maneuver [27] (40 cmH2O for 10 s) and 30 minutes of stabilization after instrumentation, baseline hemodynamic, ventilation, and gas exchange data were obtained.
Healthy state: Either desflurane (studies II–IV) or isoflurane (study IV) was administered via the KION® ventilator, with the vaporizer set at 5 Vol% for desflurane or 1 Vol% for isoflurane in an open system. Fresh gas flow was set to exceed double minute ventilation. Arterial (studies II–IV) and mixed venous (study IV) blood samples were obtained simultaneously after 0, 1, 2, 5, 10, 20, and 30 minutes, and after 45 and 60 minutes for isoflurane. Thereafter, the inhalation of the volatile agent was stopped, and the sampling sequence was repeated.
InduceAnesthesia, GeneralPrepara4on
Stabiliza4on PEEP5 PEEPA(lo/hi) PEEPB(hi/lo)
normalV hypoV hyperV
LLLhypoV LLLhyperV LLLhyperV+DS
NormalLungs
OleicAcidInjury
Selec7veLLLVen7la7on
90min 30min 45min 45min 45min
Treatment Basalinfsn
MIGET1 MIGET2 MIGET3 RM
20
Bronchoconstriction and repetition of wash-in and wash-out: Methacholine was either infused (study II) or intermittently aerosolized (studies III and IV) to maintain a constant doubling of baseline airway resistance for each pig throughout this experimental step. The uptake and elimination sampling for each volatile agent was repeated at the given time schedule.
Arterial blood samples were collected in glass syringes coated with EDTA for analysis by MIGET. For analysis, the blood samples flowed over the MMIMS probes and the volatile gas partial pressures were analyzed directly. The user entered essential physiologic data (cardiac output, minute ventilation, and core body temperature) into the machine, and the system adjusted the probe and sample temperatures to match core temperature. Systemic artery blood samples and mixed expired gas samples were injected into the machine. The system flows each sample over a microporous membrane inlet probe, measures the current signal from the mass spectrometer at m/e = 101 for desflurane or m/e = 51 for isoflurane, identifies the plateau signal, and averages that signal [7, 8, 28, 29].
Timeline studies II–IV:
Figure 2. Timeline of studies II–IV. Abbr.:RM, Recruitment Maneuver; MMIMS, Micropore Membrane Inlet Mass Spectrometry
Data Analysis and Statistics
Study I VA/Q distributions from GC were directly compared to the VA/Q distributions from MMIMS for each individual measurement in each animal by the Kolmogorov–Smirnov two-sample test [30], treating each paired measurement as an independent observation (i.e. without accounting for intra versus inter-individual differences). VA/Q distributions were also compared by calculations of moments of the distributions (mean VA/Q for the ventilation distribution or meanVQV, and mean VA/Q for the perfusion distribution or meanVQQ; logSDV and logSDQ; and skewness). Moment calculations were carried out in the usual way, which includes all compartments except dead space and shunt, for qualitative comparisons
Induction Anesthesia,
General Preparation
Stabilization Induce
Broncho- constriction
Volatile Elimination
Volatile Uptake
Volatile Elimination
Volatile Uptake
MMIMS Samples
RM Baseline Healthy Plateau
Bronchoconstriction Bronch.const. Plateau
End

21
between the GC and MMIMS data [31, 32]. Quantitative comparisons of the modes were carried out for the nine data sets in normal pigs by either paired t testing (if distributions were normal and there was no dependence of either magnitude or variance of paired differences on paired average [33]); or a sign test otherwise.
Comparison of means of the ventilation and perfusion distributions with the overall measured VA/Q ratio for normal lungs was performed with the Bland-Altman analysis [33]. First, the dead space recovered by MMIMS and GC for each experimental condition was averaged, and this dead space value was subtracted from the minute ventilation for each condition to estimate alveolar ventilation. Next, shunt recovered by MMIMS and GC for each condition was averaged and subtracted from measured cardiac output. The overall VA/Q ratio for the normal compartment was then calculated from the ratio of alveolar ventilation to effective perfusion. Next, a geometric average [34] of the mean VA/Q for ventilation and the mean VA/Q for perfusion was calculated for MMIMS and GC for each condition. Finally, these geometric means for MMIMS or GC were compared to the overall VA/Q calculated from minute ventilation and cardiac output.
The VA/Q distributions were used to predict paO2 using previously described algorithms [35-37]. For MIGET by GC, the calculations are included in the printout from the standard Fortran program used in the standard way, as reported in previous studies [38, 39], with default inputs for hemoglobin P50 and two-point tonometered pCO2 values. For MIGET by MMIMS, the calculations were carried out with Labview routines based on the same algorithms, with some minor updates. The algorithms used the same Kelman routines [35, 36] for O2 and CO2 dissociation curves, and the same alveolar gas exchange equations that include nitrogen exchange [37]. The MMIMS routines, however: (a) used a base-excess based approach [40] to locate the CO2 buffer line, rather than the two-point tonometered CO2 approach [41]; (b) used the cardiac output measured from thermodilution rather than a weighted average value from Fick balances on the inert gases; and (c) used a pig-specific value for hemoglobin P50 [42]. Comparisons of predicted versus measured paO2 were then carried out by Bland-Altman analysis [33].
For the experiments with selective left lower lobe hyperventilation, the individual lung segment etCO2 data were used to calculate the expected VA/Q distribution as described in detail in the appendix of paper I [29].
Studies II–IV Data analysis was performed with the Statistical Package for the Social Sciences (SPSS, v. 22, IBM Corporation, Armonk, New York, USA) and SigmaPlot® v. 11 (Systat Software Inc., San Jose, CA, USA).
The data were tested for normal distribution with the Shapiro–Wilk W test and are presented as means and standard deviations in the case of normal

22
distribution (cardiopulmonary and ventilation variables). Nonlinear regression analysis of MMIMS data was performed with Sigmaplot®. The curves are displayed as mean of data points with standard deviations.
The analysis of normally distributed data was performed by a repeated measures one-way analysis of variance (ANOVA) with post-hoc Bonferroni correction. The VA/Q distributions were compared after calculations of moments of the distributions (mean VA/Q, Vmean, Qmean, logSDV, logSDQ and skewness) by nonparametric Friedman’s test and Wilcoxon’s matched pairs test [30].
No data were lost during the experiment or were missed in the statistical analysis. The differences were considered to be statistically significant for all procedures if p < 0.05.

23
Results
Study I The results from the three protocols on healthy, oleic acid-exposed and individual left-lobe ventilation animals are pooled in the following, the reason being that the effects of experimental treatments are expected to affect both methods equally. The three protocols were designed to cause a wide range of VA/Q distributions and not to test effects of experimental treatments. Overall, the visual impression was that there was no difference between protocols on the agreement, or disagreement, between results from the MMIMS- and GC-based MIGET. All individual VA/Q distributions by both techniques are shown in the digital supplement [43].
Representative side-by-side comparisons of the retention/excretion (RE) curves and the accompanying VA/Q distributions for one subject with normal lungs for normal ventilation, hypoventilation, and hyperventilation are presented in Fig. 3. Representative results for one subject with oleic acid-injured lungs at three different PEEP levels are presented in Fig. 4. Results for one subject with selective LLL intubation are shown in Fig. 5. For each experiment, the perfusion distributions were compared with each other, and the ventilation distributions were compared with each other by the Kolmogorov–Smirnov two-sample test.

24
!Fi
gure
3.
Ret
entio
n-ex
cret
ion
(RE)
cur
ves
(top)
and
VA/Q
dis
tribu
tions
(bo
ttom
) fo
r on
e su
bjec
t w
ith n
orm
al l
ungs
dur
ing
norm
al
vent
ilatio
n (le
ft), h
ypov
entil
atio
n (m
iddl
e), a
nd h
yper
vent
ilatio
n (r
ight
). R
esul
ts fr
om th
e M
IGET
by
GC
are
in b
lue,
resu
lts fo
r MIG
ET
by M
MIM
S ar
e in
red.
For
the
RE
curv
es, s
olid
circ
les a
nd li
nes a
re th
e re
tent
ion
curv
es, o
pen
circ
les a
nd d
ashe
d lin
es a
re th
e ex
cret
ion
curv
es. T
he x
-axi
s is t
he O
stw
ald
parti
tion
coef
ficie
nt e
xpre
ssed
as t
he p
ower
of 1
0.
Hyp
erve
ntila
tion
PC-4
-3-2
-10
12
34
0.0
0.2
0.4
0.6
0.8
1.0
1.2
V/Q
ratio
0
0.0
1 0
.1 1
.0 1
0 1
00 in
f0.
00
0.05
0.10
0.15
0.20
MS
shu
nt 0
.034
GC
shu
nt 0
.036
MS
DS
0.3
5G
C D
S 0
.37
MS
RS
S 1
5.88
GC
RS
S 2
.86
Nor
mal
Ven
tilat
ion
PC-4
-3-2
-10
12
34
R or E
0.0
0.2
0.4
0.6
0.8
1.0
1.2
V/Q
ratio
0
0.0
1 0
.1 1
.0 1
0 1
00 in
f
fractional Q or V 0.00
0.05
0.10
0.15
0.20
MS
shu
nt 0
.019
GC
shu
nt 0
.018
MS
DS
0.3
7G
C D
S 0
.30
MS
RS
S 2
.93
GC
RS
S 0
.61
Hyp
oven
tilat
ion
PC-4
-3-2
-10
12
34
0.0
0.2
0.4
0.6
0.8
1.0
1.2
V/Q
ratio
0
0.0
1 0
.1 1
.0 1
0 1
00 in
f0.
00
0.05
0.10
0.15
0.20
MS
shu
nt 0
.043
GC
shu
nt 0
.033
MS
DS
0.4
5G
C D
S 0
.49
MS
RS
S 7
.64
GC
RS
S 1
.47

25
1
Fi
gure
4. R
E cu
rves
and
VA/Q
dis
tribu
tions
for o
ne s
ubje
ct w
ith o
leic
aci
d-in
jure
d lu
ngs
at th
ree
diff
eren
t PEE
P le
vels
. See
Fig
. 3 fo
r an
ex-
plan
atio
n of
col
ors,
sol
id a
nd d
ashe
d lin
es, a
nd s
olid
and
ope
n ci
rcle
s.
PE
EP
= 5
PC
-4-3
-2-1
01
23
4
R or E
0.0
0.2
0.4
0.6
0.8
1.0
1.2
V/Q
ratio
0
0.0
1 0
.1 1
.0 1
0 1
00 in
f
fractional Q or V 0.00
0.02
0.04
0.06
0.08
0.10
0.12
0.14
MS
shu
nt 0
.107
GC
shu
nt 0
.111
MS
DS
0.4
7G
C D
S 0
.41
MS
RS
S 0
.89
GC
RS
S 0
.85
PE
EP
= 1
PC
-4-3
-2-1
01
23
40.
0
0.2
0.4
0.6
0.8
1.0
1.2
V/Q
ratio
0
0.0
1 0
.1 1
.0 1
0 1
00 in
f0.
00
0.02
0.04
0.06
0.08
0.10
0.12
MS
shu
nt 0
.23
GC
shu
nt 0
.25
MS
DS
0.4
5G
C D
S 0
.39
MS
RS
S 1
.26
GC
RS
S 0
.18
PE
EP
= 1
0
PC
-4-3
-2-1
01
23
40.
0
0.2
0.4
0.6
0.8
1.0
1.2
V/Q
ratio
0
0.0
1 0
.1 1
.0 1
0 1
00 in
f0.
00
0.05
0.10
0.15
0.20
MS
shu
nt 0
.045
GC
shu
nt 0
.045
MS
DS
0.5
1G
C D
S 0
.39
MS
RS
S 7
.63
GC
RS
S 0
.73

26
1
Figu
re 5
. RE
curv
es a
nd V
A/Q
dis
tribu
tions
for o
ne s
ubje
ct w
ith s
elec
tive
LLL
intu
batio
n, fo
r sel
ectiv
e hy
po- a
nd h
yper
vent
ilatio
n of
the
LLL,
and
hyp
erve
ntila
tion
with
add
ed e
xter
nal d
eads
pace
. See
Fig
. 3 fo
r an
expl
anat
ion
of c
olor
s, s
olid
and
das
hed
lines
, sol
id a
nd o
pen
cir-
cles
.
LLL
Hyp
oven
tilat
ion
PC
-4-3
-2-1
01
23
4
R or E
0.0
0.2
0.4
0.6
0.8
1.0
1.2
1.4
V/Q
ratio
0
0.0
1 0
.1 1
.0 1
0 1
00 in
f
fractional Q or V 0.00
0.05
0.10
0.15
0.20
MS
shu
nt 0
.024
GC
shu
nt 0
.025
MS
DS
0.4
4G
C D
S 0
.29
MS
RS
S 1
0.30
GC
RS
S 1
.83
LLL
Hyp
erve
ntila
tion
PC
-4-3
-2-1
01
23
40.
0
0.2
0.4
0.6
0.8
1.0
1.2
V/Q
ratio
0
0.0
1 0
.1 1
.0 1
0 1
00 in
f0.
00
0.05
0.10
0.15
0.20
MS
shu
nt 0
.019
GC
shu
nt 0
.023
MS
DS
0.4
4G
C D
S 0
.38
MS
RS
S 6
.94
GC
RS
S 2
.67
LLL
Hyp
er p
lus
DS
PC
-4-3
-2-1
01
23
40.
0
0.2
0.4
0.6
0.8
1.0
1.2
1.4
V/Q
ratio
0
0.0
1 0
.1 1
.0 1
0 1
00 in
f0.
00
0.04
0.08
0.12
0.16
MS
shu
nt 0
.014
GC
shu
nt 0
.032
MS
DS
0.6
7G
C D
S 0
.59
MS
RS
S 0
.64
GC
RS
S 1
.80

27
Mean VA/Q, logSD, and skew values calculated in the traditional way with inclusion of all 48 non-shunt, non-dead space compartments are presented in Tables 1–3. For the subset of the nine experiments in pigs with normal lungs, there were no significant differences between the GC and MMIMS results for the mean VA/Q of the ventilation or perfusion distributions (mean paired difference, always in the order MS-GC, for the V distributions of 0.19, mean paired difference for the perfusion distributions of 0.07; p 0.22 and 0.39 respectively, paired t-tests). For both logSDV and logSDQ, the MMIMS method recovered significantly narrower distributions (mean paired difference for logSDV of 0.39, mean paired difference for logSDQ of 0.17; p 0.002 and 0.02, respectively, sign test). Skews were not significantly different between the methods (mean paired difference for skewV, 0.80; mean paired difference of skewQ, 0.16; p 0.50 and 0.09, respectively; sign test). Quantitative comparisons of modes did not include the oleic acid-injured groups and the LLL ventilation groups because the distributions for these experiments deviated substantially from a single, normal mode. The quantitative meaning of modes calculated from these non-normal distributions is therefore not interpretable in terms of position, spread, or shape.

28
Table 1. Moments of the VA/Q distributions for GC and MMIMS for normal lungs. Modes of the VA/Q distributions for GC and MMIMS calculated for all 48 compartments excluding shunt and dead space. Values listed are mean ± SD. MS refers to MMIMS, GC refers to GC. MeanVQV is the mean VA/Q of the ventilation distribution, meanVQQ is the mean VA/Q of the perfusion distribution. LogSDV and logSDQ are the log standard deviations of the ventilation and perfusion distributions. SkewV and skewQ are the skewness of the distributions.
nlV hypoV hyperV MSmeanVQV 1.4 ± 0.1 0.9 ± 0.2 2.3 ± 0.5 GCmeanVQV 1.3 ± 0.3 0.9 ± 0.1 1.9 ± 0.1 MSmeanVQQ 0.9 ± 0.1 0.6 ± 0.2 1.4 ± 0.3 GCmeanVQQ 0.9 ± 0.2 0.6 ± 0.2 1.2 ± 0.1 MSlogSDV 0.3 ± 0.1 0.6 ± 0.2 0.3 ± 0.1 GClogSDV 0.6 ± 0.1 0.9 ± 0.6 0.9 ± 0.2 MSlogSDQ 0.4 ± 0.1 0.3 ± 0.1 0.4 ± 0.1 GClogSDQ 0.5 ± 0.1 0.5 ± 0.1 0.6 ± 0.1 MSskewV 0.0 ± 0.0 1.0 ± 0.8 0.0 ± 0.0 GCskewV 0.1 ± 0.3 2.3 ± 3.3 1.4 ± 0.8 MSskewQ -0.1 ± 0.4 0.1 ± 0.0 -0.1 ± 0.2 GCskewQ 0.1 ± 0.0 0.1 ± 0.1 0.2 ± 0.1

29
Table 2. Moments of the VA/Q distributions for GC and MMIMS for oleic acid injury. Modes of the VA/Q distributions for GC and MMIMS calculated for all 48 compartments excluding shunt and dead space. Values listed are mean ± SD. MS refers to MMIMS, GC refers to GC. MeanVQV is the mean VA/Q of the ventilation distribution, meanVQQ is the mean VA/Q of the perfusion distribution. LogSDV and logSDQ are the log standard deviations of the ventilation and perfusion distributions. SkewV and skewQ are the skewness of the distributions.
PEEP5 PEEP1 PEEP10 MSmeanVQV 1.7± 0.4 2.2 ± 0.6 1.4 ± 0.3 GCmeanVQV 2.1 ± 0.7 2.7 ± 1.1 2.3 ± 0.3 MSmeanVQQ 0.8 ± 0.2 0.7 ± 0.4 1.0 ± 0.3 GCmeanVQQ 0.9 ± 0.2 0.8 ± 0.1 1.1 ± 0.4 MSlogSDV 0.4 ± 0.1 0.5 ± 0.1 0.4 ± 0.2 GClogSDV 1.0 ± 0.2 1.0 ± 0.4 1.2 ± 0.4 MSlogSDQ 0.6 ± 0.2 0.9 ± 0.3 0.3 ± 0.0 GClogSDQ 0.8 ± 0.2 1.1 ± 0.2 0.6 ± 0.1 MSskewV 0.1 ± 0.0 0.1 ± 0.1 0.4 ± 0.5 GCskewV 0.3 ± 0.5 0.1 ± 0.5 2.2 ± 1.1 MSskewQ -0.7 ± 0.8 -1.9 ± 0.5 0.1 ± 0.0 GCskewQ 0.4 ± 0.2 -1.1 ± 2.6 0.3 ± 0.2

30
Table 3. Moments of the VA/Q distributions for GC and MMIMS for selective LLL ventilation and added dead space. Modes of the VA/Q distributions for GC and MMIMS calculated for all 48 compartments excluding shunt and dead space. Values listed are mean ± SD. MS refers to MMIMS, GC refers to GC. MeanVQV is the mean VA/Q of the ventilation distribution, meanVQQ is the mean VA/Q of the perfusion distribution. LogSDV and logSDQ are the log standard deviations of the ventilation and perfusion distributions. SkewV and skewQ are the skewness of the distributions.
LLLhypo LLLhyper Hyper+DS MSmeanVQV 2.3 ± 0.3 2.4 ± 0.4 2.3 ± 0.4 GCmeanVQV 3.4 ± 1.6 3.3 ± 0.6 4.0 ± 0.9 MSmeanVQQ 1.5 ± 0.2 1.5 ± 0.3 0.7 ± 0.0 GCmeanVQQ 1.3 ± 0.3 1.3 ± 0.3 0.8 ± 0.1 MSlogSDV 0.3 ± 0.0 0.3 ± 0.1 0.7 ± 0.1 GClogSDV 1.2 ± 0.4 1.1 ± 0.1 1.9 ± 0.1 MSlogSDQ 0.4 ± 0.0 0.4 ± 0.0 0.5 ± 0.2 GClogSDQ 0.6 ± 0.1 0.7 ± 0.0 0.6 ± 0.1 MSskewV 0.0 ± 0.0 0.1 ± 0.1 0.8 ± 0.2 GCskewV 1.6 ± 1.2 2.2 ± 0.6 3.5 ± 1.6 MSskewQ 0.1 ± 0.0 0.1 ± 0.0 -0.1 ± 0.6 GCskewQ 0.4 ± 0.3 0.5 ± 0.1 0.7 ± 0.2

31
Comparison of the overall VA/Q ratios for subjects with normal lungs is presented in Fig. 6. After confirming by regression analysis that there was no significant linear dependence of difference on average, paired t-tests showed that the small biases (0.13 for GC, 0.038 for MMIMS) were not significantly different from zero (p 0.24 and 0.06, respectively).
Figure 3. Comparison of the recovered main VA/Q ratio (geometric mean) with the overall calculated VA/Q (overall VA/Q), by Bland-Altman plots (top) and by x-y scatter plots compared with the line of identity (bottom). For the Bland-Altman plots, the y data are the geometric mean of VA/Q for the ventilation and perfusion distributions minus the VA/Q calculated from minute ventilation and cardiac output (after correction for dead space and shunt). The dashed line marks a difference of zero, the middle line represents the mean difference or bias, and upper and lower lines represent mean ± 1.96 SD (SD of 0.30 for GC, 0.051 for MMIMS).
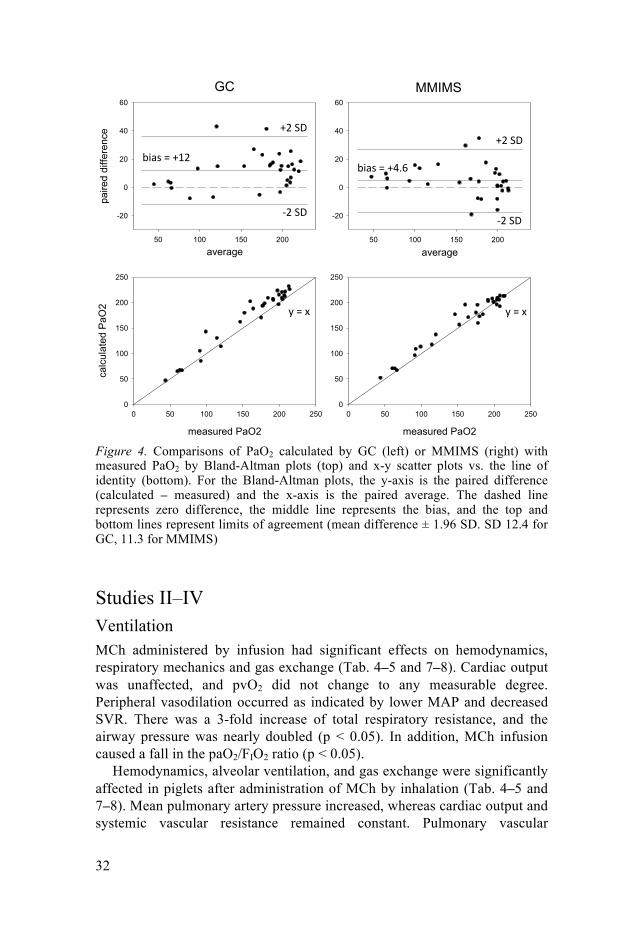
Predicted PaO2 from the VA/Q distributions for the GC and MMIMS methods are compared with the measured PaO2 by Bland-Altman analysis in Fig. 7. Regression analysis confirmed no significant linear dependence of difference on the average. The bias for both methods (12.0 for GC, 4.6 for MMIMS) was significantly different from zero (p 10-5 and 0.030 respectively, paired t-test).
overall VQ
0.0 0.5 1.0 1.5 2.0 2.5 3.0
geom
etric
mea
n of
V a
nd Q
0.0
0.5
1.0
1.5
2.0
2.5
3.0
overall VQ
0.0 0.5 1.0 1.5 2.0 2.5 3.00.0
0.5
1.0
1.5
2.0
2.5
3.0
GC
average0.5 1.0 1.5 2.0
paire
d di
ffere
nce
-1.0
-0.5
0.0
0.5
1.0
MMIMS
average0.5 1.0 1.5 2.0
-1.0
-0.5
0.0
0.5
1.0
!"#$%&%'()*+%
!"#$%&%,()(-%
.%&%/% .%&%/%
,0%12%
,0%12%
'0%12%
'0%12%
32
Figure 4. Comparisons of PaO2 calculated by GC (left) or MMIMS (right) with measured PaO2 by Bland-Altman plots (top) and x-y scatter plots vs. the line of identity (bottom). For the Bland-Altman plots, the y-axis is the paired difference (calculated – measured) and the x-axis is the paired average. The dashed line represents zero difference, the middle line represents the bias, and the top and bottom lines represent limits of agreement (mean difference ± 1.96 SD. SD 12.4 for GC, 11.3 for MMIMS)
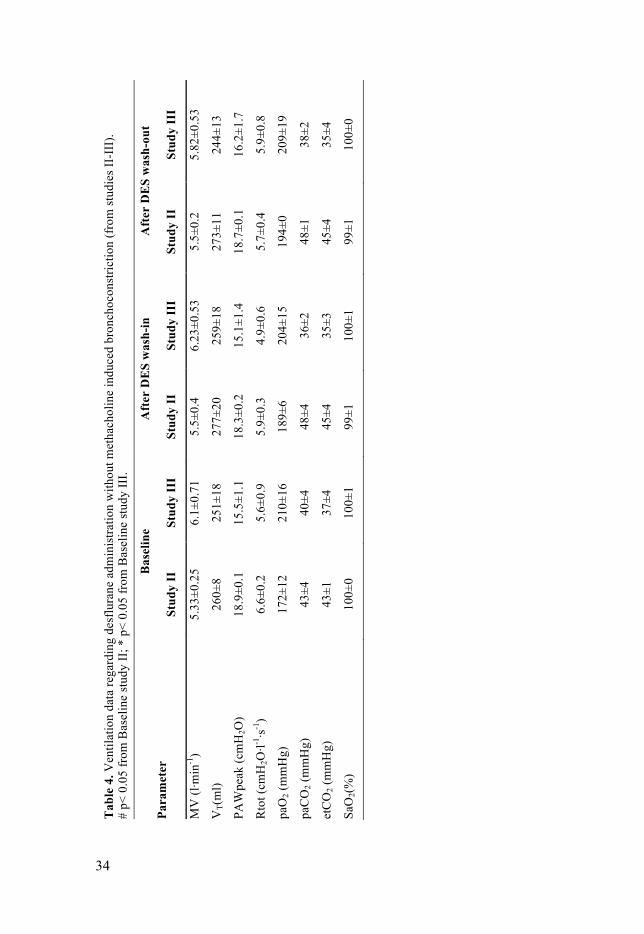
Studies II–IV Ventilation MCh administered by infusion had significant effects on hemodynamics, respiratory mechanics and gas exchange (Tab. 4–5 and 7–8). Cardiac output was unaffected, and pvO2 did not change to any measurable degree. Peripheral vasodilation occurred as indicated by lower MAP and decreased SVR. There was a 3-fold increase of total respiratory resistance, and the airway pressure was nearly doubled (p < 0.05). In addition, MCh infusion caused a fall in the paO2/FIO2 ratio (p < 0.05).
Hemodynamics, alveolar ventilation, and gas exchange were significantly affected in piglets after administration of MCh by inhalation (Tab. 4–5 and 7–8). Mean pulmonary artery pressure increased, whereas cardiac output and systemic vascular resistance remained constant. Pulmonary vascular
GC
average50 100 150 200
paire
d di
ffere
nce
-20
0
20
40
60
MMIMS
average50 100 150 200
-20
0
20
40
60
measured PaO2
0 50 100 150 200 250
calc
ulat
ed P
aO2
0
50
100
150
200
250
measured PaO2
0 50 100 150 200 2500
50
100
150
200
250
!"#$%&%'()%!"#$%&%'*+,%
')%-.%')%-.%
/)%-.%/)%-.%
0%&%1%0%&%1%

33
resistance was nearly doubled by MCh inhalation. The total respiratory resistance increased 5-fold, and the peak airway pressure was at least doubled. Gas exchange was severely impaired. These essential alterations caused by MCh administration were not affected by desflurane (1MAC) uptake and elimination. The wash-in of isoflurane up to 1Vol% in the inspired gas in normal piglets before MCh-induced bronchoconstriction had no significant effect on respiratory mechanics, ventilation or global gas exchange variables as compared to the initial baseline data with intravenous anesthesia. Hemodynamics, alveolar ventilation and gas exchange variables were significantly changed after administration of MCh by inhalation. Mean pulmonary artery pressure (MPAP) increased whereas mean arterial pressure (MAP), CO and systemic vascular resistance (SVR) remained constant. Pulmonary vascular resistance (PVR) nearly doubled on MCh inhalation. The total respiratory resistance (Rtot) under MCh increased more than 4-fold; the peak airway pressure (PIP) was at least doubled, and alveolar ventilation significantly decreased. Gas exchange was severely impaired, as indicated by lower paO2 and pvO2 and increased etCO2, paCO2, pvCO2, and increased venous admixture (Tab. 6 and 9).
34
Tab
le 4
. Ven
tilat
ion
data
rega
rdin
g de
sflu
rane
adm
inis
tratio
n w
ithou
t met
hach
olin
e in
duce
d br
onch
ocon
stric
tion
(fro
m st
udie
s II-
III)
. #
p< 0
.05
from
Bas
elin
e st
udy
II; *
p<
0.05
from
Bas
elin
e st
udy
III.
Para
met
er
Bas
elin
e A
fter
DE
S w
ash-
in
Aft
er D
ES
was
h-ou
t
Stud
y II
St
udy
III
Stud
y II
St
udy
III
Stud
y II
St
udy
III
MV
(l·m
in-1
) 5.
33±0
.25
6.1±
0.71
5.
5±0.
4 6.
23±0
.53
5.5±
0.2
5.82
±0.5
3
VT(
ml)
260±
8 25
1±18
27
7±20
25
9±18
27
3±11
24
4±13
PAW
peak
(cm
H2O
) 18
.9±0
.1
15.5
±1.1
18
.3±0
.2
15.1
±1.4
18
.7±0
.1
16.2
±1.7
Rto
t (cm
H2O
·l-1·s-1
) 6.
6±0.
2 5.
6±0.
9 5.
9±0.
3 4.
9±0.
6 5.
7±0.
4 5.
9±0.
8
paO
2 (m
mH
g)
172±
12
210±
16
189±
6 20
4±15
19
4±0
209±
19
paC
O2 (
mm
Hg)
43
±4
40±4
48
±4
36±2
48
±1
38±2
etC
O2 (
mm
Hg)
43
±1
37±4
45
±4
35±3
45
±4
35±4
SaO
2(%
) 10
0±0
100±
1 99
±1
100±
1 99
±1
100±
0

35
12
Tab
le 7
. Hem
odyn
amic
dat
a re
gard
ing
desf
lura
ne a
dmin
istra
tion
with
out m
etha
chol
ine
indu
ced
bron
choc
onst
rictio
n (f
rom
stud
ies I
I-II
I).
# p<
0.0
5 fr
om B
asel
ine
stud
y II
; * p
< 0.
05 fr
om B
asel
ine
stud
y II
I.
Para
met
er
Bas
elin
e A
fter
DE
S w
ash-
in
Aft
er D
ES
was
h-ou
t St
udy
II
Stud
y II
I St
udy
II
Stud
y II
I St
udy
II
Stud
y II
I pv
O2
(mm
Hg)
43
±1
43 ±
2
41±1
42
± 4
43
±4
42 ±
2
pvC
O2
(mm
Hg)
52
±1
47 ±
4
54±5
45
± 4
56
±1
46 ±
4
HR
(1·s-1
) 11
3±7
118
± 21
11
0±3
111
± 11
10
0±1
107
± 16
MA
P (m
mH
g)
86±8
96
± 2
1 79
±12
75 ±
22
65±1
90
± 1
8
MPA
P (m
mH
g)
21±1
19
± 3
21
±2
17 ±
2
20±1
18
± 3
CO
(l·m
in-1
) 4.
3±0.
2 4.
0 ±
0.8
3.9±
0.2
3.9
± 0.
4 3.
6±0.
2 3.
7 ±
0.8
PVR
(dyn
·s·cm
5-1 )
284±
10
282
± 88
32
8±55
27
5 ±
31
313±
13
276
± 75
SVR
(dyn
·s·cm
5-1 )
1484
±61
1868
± 6
21
1497
±308
16
53 ±
744
12
87±3
0 18
87 ±
737

36
14
Tab
le 9
. Hem
odyn
amic
dat
a re
gard
ing
isof
lura
ne a
dmin
istra
tion
(fro
m st
udy
IV).
§ p<
0.05
from
Bas
elin
e st
udy
IV
Para
met
er
Bas
elin
e A
fter
ISO
was
h-
in
Aft
er IS
O w
ash-
ou
t D
urin
g M
Ch
nebu
lizat
ion
Aft
er IS
O w
ash-
in
with
MC
h A
fter
ISO
was
h-
out w
ith M
Ch
pvO
2 (m
mH
g)
40±3
38
±2
39±2
36
±3
36±5
33
±4
pvC
O2 (
mm
Hg)
59
±8
53±3
55
±6
64±1
0 66
±12
70±1
1
HR
(1·s-1
) 11
7±16
10
0±13
98
±15
96±1
0§ 10
8±11
10
2±4
MA
P (m
mH
g)
76±8
67
±8
85±9
76
±12
73±9
69
±7
MPA
P (m
mH
g)
20±2
20
±2
22±1
31
±5§
31±6
§ 33
±7§
CO
(l·m
in-1
) 3.
2±0.
6 2.
8±0.
7 3.
0±0.
6 2.
9±0.
5 3±
0.3
2.8±
0.5
PVR
(dyn
·s·cm
5-1 )
263±
52
326±
61
339±
92
588±
218§
585±
180§
659±
204§
SVR
(dyn
·s·cm
5-1 )
1816
±607
17
63±5
36
2139
±510
18
43±4
03
1688
±343
17
65±4
86

37
MIGET
Figure 5. MIGET fractional ventilation (V) and pulmonary perfusion (Q) by different VA/Q ratios at baseline (A&C), during MCh infusion (B), and MCh inhalation (D). The data represent the averaged moments of ventilation and perfusion distribution in all piglets.
The infusion of MCh did not cause a difference VA/Q matching in comparison to healthy animals (Fig. 8, A and B). MCh inhalation on the other hand enhanced VA/Q mismatch as indicated by a shift of mean ventilation toward regions with higher VA/Q and of mean perfusion toward regions with lower VA/Q (Fig. 8, C and D). Dead space ventilation (VD/VT) was smaller during MCh inhalation, whereas pulmonary shunt was increased.
Pharmacokinetics of volatile anesthetics The arterial and mixed-venous concentration course for both volatile anesthetics could be expressed by the double exponential function ! ! ! ! ! ! ! ! !!!!" ! ! ! ! !!!" , describing the wash-in and ! ! ! ! ! ! !!!" ! ! !!!" , depicting the elimination phase before and during MCh injury (Fig. 9 and 10), where a is the fraction of the
! "
# $

38
lungs with fast kinetics, b is the fast exponential constant, c is the fraction of the lungs with slow kinetics, and d is the slow exponential constant.
The infusion of MCh induced bronchoconstriction and impaired arterial oxygenation but did not affect desflurane pharmacokinetics (Fig. 9, study II).
MCh nebulization on the other hand delayed desflurane uptake and elimination. The wash-in time to P50 was longer: 1.1 min vs. 0.5 min, as well as to P90: 14.8 min vs. 4.0 min (p < 0.05) in comparison with the uptake in healthy piglets. The time to the plateau level was delayed up to 30 min. Volatile elimination was accordingly delayed during MCh nebulization (Fig 9, study III).
Figure 6. Time course of desflurane blood concentrations assessed by Micropore Membrane Inlet Mass Spectrometry (MMIMS) during wash-in (A) and wash-out (B) from arterial blood in healthy (h) and MCh-injection injured piglets (M). Methacholine inhalation injury is displayed for wash-in into (C) and wash-out (D) from arterial blood. The data were calculated as means (SD) of all piglets after scaling the MMIMS signals in the individual piglet to the arterial plateau after 30 min. Note the time delay in desflurane pharmacokinetics during MCh inhalation. Enclosed are the mean coefficients (a, b, c, d) of the exponential regression functions displayed for wash-in (u) and wash-out (e) of desflurane from arterial blood . Abbr.: MMIMS, Micropore Membrane Inlet Mass Spectrometry; MCh, Methacholine.
!"#$%&'(")"*+,+('-.()/&.,)'&0"&+'*)1*..2)3(456)#7'*"2)0.)8*'0"'%)'&0"&+'*)99:9;)#+<('*)
!
"#$
%
"&'()*+,&$-+'./0,$0,12$+*1&*0+3$43225$6,789:$;#.$0,<)'02,$'=+3&5$12$;;>;?$'0@,+3$2<$.&+31.A$B0@'$+C&*$DE$F0,$
"&'()*+,&$-+'./0,$0,12$+*1&*0+3$43225$6,7G9:$;#.$0,.+3+H2,$'=+3&5$12$;;>;?$'0@,+3$2<$.&+31.A$B0@'$+C&*$DE$F0,$
"&'()*+,&$-+'./2)1$<*2F$+*1&*0+3$43225$6,789:$;#.$0,<)'02,$'=+3&5$12$;;>;?$'0@,+3$2<$.&+31.A$B0@'$+C&*$DE$F0,$
"&'()*+,&$-+'./2)1$<*2F$+*1&*0+3$43225$6,7G9:$;#.$0,.+3+H2,$'=+3&5$12$;;>;?$'0@,+3$2<$.&+31.A$B0@'$+C&*$DE$F0,$

39
Without MCh, the arterial isoflurane concentration reached 90% of the final level within 16.4 min during wash-in of the anesthetic. The elimination measurements revealed that 90% of the isoflurane had been eliminated from the circulation after 27.8 min. During MCh-induced bronchoconstriction, the uptake and elimination were delayed. Thus, for 1 Vol% isoflurane, 90% uptake and elimination were reached after 35.2 and 43.6 min (p < 0.05 compared to before MCh nebulization) (Fig. 10, study IV).
Figure 7. Time course of isoflurane blood concentrations assessed by Micropore Membrane Inlet Mass Spectrometry (MMIMS). Time course of isoflurane concentration during wash-in (A) into and wash-out (B) from arterial and wash-in (C) into and wash-out (D) from mixed venous blood before and during MCh nebulization. The data were calculated as mean ± SD of all piglets after scaling the MMIMS signals in the individual piglet to the arterial plateau after 60 min. Enclosed are the mean coefficients (a, b, c, d) of the arterial exponential regression functions, displayed for wash-in (1) and wash-out (2) of isoflurane. Abbr.: MMIMS, Micropore Membrane Inlet Mass Spectrometry; MCh, Methacholine.
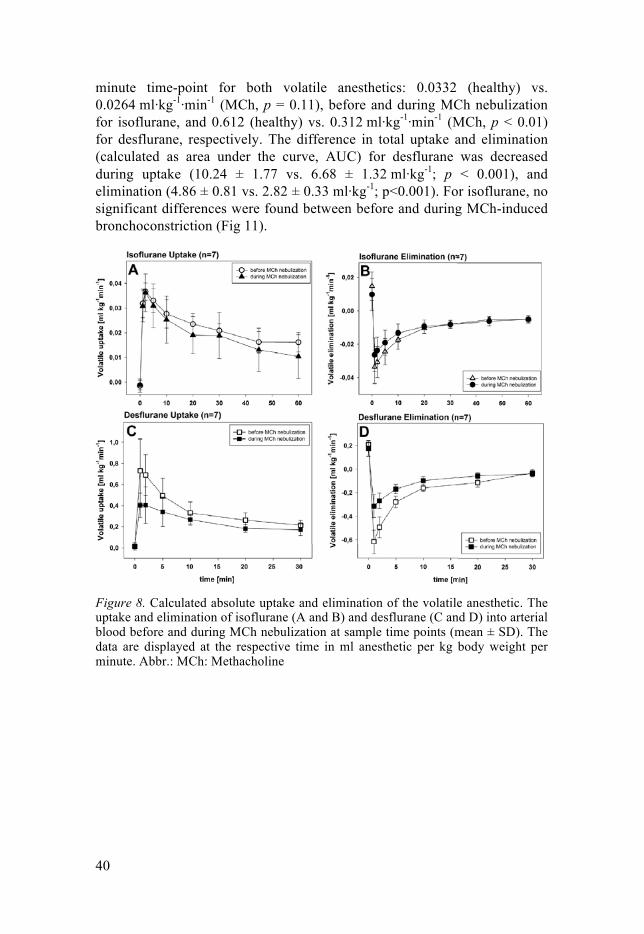
Calculated uptake and elimination The uptake of isoflurane peaked with 0.0366 ml·kg-1·min-1 in healthy piglets at the 2-minute time-point vs. 0.0362 ml·kg-1·min-1 during MCh inhalation (p = 0.21). In contrast, desflurane peaked at the 1-minute time-point and was 0.727 ml·kg-1·min-1 before and 0.402 ml·kg-1·min-1 during MCh-induced bronchoconstriction (p < 0.01). The elimination was greatest at the one-
!"#$%&'()*+'",-.(*.(/#*'&/)&.'0*10##2*3(4567*"8'0)2*/#*99!9:*".;('0*#<*,)'0/,=*>.;"*'?)&*@A*B.(*
!"#$%&'()*+'",-#%/*<&#B*'&/)&.'0*10##2*3(4567*"8'0)2*/#*99!9:*".;('0*#<*,)'0/,=*>.;"*'?)&*@A*B.(*
!"#$%&'()*+'",-.(*.(/#*B.C)2*D)(#%"*10##2*3(4567*"8'0)2*/#*99!9:*".;('0*#<*,)'0/,=*>.;"*'?)&*@A*B.(*
!"#$%&'()*+'",-#%/*<&#B*B.C)2*D)(#%"*10##2*3(4567*"8'0)2*/#*99!9:*".;('0*#<*,)'0/,=*>.;"*'?)&*@A*B.(*
40
minute time-point for both volatile anesthetics: 0.0332 (healthy) vs. 0.0264 ml·kg-1·min-1 (MCh, p = 0.11), before and during MCh nebulization for isoflurane, and 0.612 (healthy) vs. 0.312 ml·kg-1·min-1 (MCh, p < 0.01) for desflurane, respectively. The difference in total uptake and elimination (calculated as area under the curve, AUC) for desflurane was decreased during uptake (10.24 ± 1.77 vs. 6.68 ± 1.32 ml·kg-1; p < 0.001), and elimination (4.86 ± 0.81 vs. 2.82 ± 0.33 ml·kg-1; p<0.001). For isoflurane, no significant differences were found between before and during MCh-induced bronchoconstriction (Fig 11).
Figure 8. Calculated absolute uptake and elimination of the volatile anesthetic. The uptake and elimination of isoflurane (A and B) and desflurane (C and D) into arterial blood before and during MCh nebulization at sample time points (mean ± SD). The data are displayed at the respective time in ml anesthetic per kg body weight per minute. Abbr.: MCh: Methacholine

41
Discussion
In my PhD project, I have found that in experimental porcine models 1) a newly developed method, MMIMS for measurement of ventilation perfusion homogeneity in the lungs gives results similar to those obtained with the old, more complicated method, the multiple inert gas elimination technique, 2) MCh inhalation resulted in an asthma-like condition, 3) in this asthma model, the low soluble anesthetic gas desflurane had a delayed uptake and elimination but, 4) the uptake and elimination of a more soluble anesthetic gas, isoflurane, was minimally affected.
Below I will discuss the papers separately followed by a comprehensive conclusion.
Study I It is widely recognized that there is currently no way to know what the complete VA/Q distribution is in any given circumstance, and consequently, there is no absolute reference standard for VA/Q distributions. The main objective in study I was therefore a direct side-by-side comparison of these two methods with each other, accepting that the true underlying VA/Q distributions remain unknown. Additionally, several parameters derived from the VA/Q distributions were compared with directly measured external references: overall VA/Q ratio; predicted paO2; predicted bimodal VA/Q distributions on the basis of selective end-tidal CO2 analysis; and recovery of an external added dead space. Overall, the two methods agreed quite well with each other, in many cases showing RE curves and VA/Q distributions that were nearly identical. Parameters derived from both methods also showed good agreement with externally measured references. Because the GC method extracts most of the inert gas from the blood sample into a gas phase, the GC approach naturally uses more of the available inert gas for analysis, which tends to produce a higher signal-to-noise ratio (SNR) in terms of instrumental measurement noise. As a result, the GC method is more tolerant of lower inert gas infusion rates with minimal compromise in the data quality, whereas MMIMS requires a minimal infusion rate for acceptable raw measurement signals. Overall measurement noise, however, is determined by several factors in addition to instrument SNR; for example, accumulated errors during sample handling and manipulation. MMIMS

42
greatly reduces this type of error because there is no extraction and sample handling. Direct and automated analysis also should reduce dependence on local variations in extraction technique and reduce operator dependence, and thereby enhance reproducibility between laboratories, and between different studies in the same laboratory.
The methods are also different in terms of tolerance to errors in sample collection. The MMIMS method pushes the blood samples through relatively narrow channels and is much more sensitive to small clots in the sample than the GC method. MMIMS is also, in theory, much more sensitive to small air bubbles in the blood samples, because these can absorb large amounts of the insoluble gases. In contrast, in the GC method, the blood sample is exposed to a large gas volume as part of the extraction process, making small bubbles in the samples less problematic.
The extraction of inert gas from blood to gas phase imposes a major constraint on the overall analysis time [3, 5]. In addition, in the usual setup the GC peaks are entered manually into the program that calculates the VA/Q distributions [3, 6], with the result that in practice, VA/Q information is usually not available until several hours after a measurement. In contrast, the VA/Q distributions obtained with the MMIMS method are available within minutes after each measurement.
Finally, although MIGET by MMIMS requires specialized skill and training in infusion preparation and sample collection, the method is far less demanding with regard to the technical skills required to carry out the measurements. The automation of sample handling in MIGET by MMIMS has the potential to make VA/Q distributions more widely available to non-specialist laboratories.
Studies II–IV Methacholine administration MCh stimulates muscarinic receptors and causes smooth muscle contraction. The M1 receptor, located in the alveolar wall, is likely to be involved in a parenchymal response, whereas the M3 receptor, located in the airway smooth muscles, is responsible for airway effects [44]. Aerosolized MCh leads to constriction of both the airways and the parenchyma by affecting the different receptors and possibly by excessive parenchymal distortion caused by a heterogeneous response of the peripheral airways [45], prompting heterogeneity of ventilation distribution and altering VA/Q distribution.
The infusion of MCh induced bronchoconstriction and impaired arterial oxygenation but did not affect desflurane pharmacokinetics. The reason can be found in the practically unaltered VA/Q distribution during MCh infusion, caused by a homogenous increase in resistance.

43
The inhalation of MCh induced VA/Q-mismatch and shunt; both impair arterial oxygenation and consequently mixed venous PO2. Moreover, rises in end-tidal CO2 and in PaCO2 as well as in PvCO2 indicate a decrease in alveolar ventilation. The mean of ventilation distribution was shifted toward areas with higher VA/Q ratios. In addition, pulmonary vascular resistance was significantly increased. Thus, inhaled MCh induced a more uneven distribution of lung pathology, fairly similar to an asthma-like condition [46],which is comparable to an acute exacerbation of human asthma [47].
Airway resistance has its maximum in intermediate-size bronchi (segmental bronchi) but declines as the number of peripheral bronchioles and subsequently the cross-sectional area increase. However, in bronchoconstricted lungs, airway resistance is heterogeneously distributed and depends on the applied tidal volumes, as demonstrated in canine and rabbit experimental models [48, 49]. Hence, bronchoconstriction is heterogeneously distributed at a given tidal volume, with small bronchi varying between effectively open and nearly closed states [50]. This is remarkably predictive of the original observations on VA/Q inequality in asthmatic patients in which bimodal patterns with regions of normal or very low VA/Q ratio but not of intermediate VA/Q ratios are commonly observed [51].
Volatile Agents Isoflurane and desflurane are both racemic mixtures of halogenated ether compounds. Their blood solubility differs by a factor exceeding two, where isoflurane has a blood/gas partition coefficient of 1.32 ± 0.04 in humans and 1.07 ± 0.05 in pigs and desflurane of 0.498 ± 0.522 in humans and 0.502 ± 0.054 in pigs [52]. Both volatile agents have a certain degree of pungency and can cause airway irritation.
The amount of true shunt and low VA/Q regions has a decisive effect on the uptake and elimination of both volatile anesthetics. Classic studies modeling the kinetics of volatile anesthetics assume that the uptake is perfusion-limited [53], and they do not take into account heterogenic ventilation distribution [9, 54]. It should be noted that the total cardiac output and alveolar minute ventilation did not change throughout the experiments.
The difference in uptake of the two volatile agents can be explained firstly by differences in solubility and can be secondly related to the different extent of intrapulmonary shunt. Isoflurane has twice as a high solubility as desflurane in blood [52]. Prior models [10] and experimental data [55] suggested that shunt may impair uptake, and that the effect is even higher for gases with low solubility. Other modifications of VA/Q in addition to shunt (such as broadening and shift of the distribution modes) can have similar effects. This is of particular interest when considering COPD patients, who

44
have minor or no shunt but substantial ventilation of low VA/Q regions when awake, and shunt is mostly small, also during anesthesia [56].
The lower elimination rates of volatile anesthetics under conditions of VA/Q inequality pose a certain danger to patients after inhalation anesthesia. Leeson et al. demonstrated in a GasMan® simulation that reanesthetization can occur after prolonged inhalation anesthesia if the patient has episodes of severe hypoventilation after emergence from anesthesia [57]. A minimal ventilation of 0.5 l·min-1 (desflurane) and 1.5 l·min-1 (isoflurane) is necessary to avoid reanesthetization at 1MAC after 4 h. Furthermore, residual effects of opioids administered during anesthesia as well as benzodiazepines given for premedication have to be taken into account. Studies III–IV indicate that volatile anesthetics with higher solubility seem to have a higher safety margin in medical conditions in which bronchoconstriction with VA/Q mismatch plays a part.
Preliminary results from a successive study also show that under extreme physiologic conditions, increased cardiac output cannot compensate for reduced ventilation with regard to the uptake and elimination of desflurane. Even more, increased ventilation causes higher uptake and elimination in spite of reduced cardiac output.
Figure 9.
Limitations A limitation in studies II–IV can be related to the volatile itself. The Ostwald blood/gas partition coefficients of halogenated ether anesthetics are different in humans and animals. For desflurane it is 0.424 ± 0.522 in man and 0.502 ± 0.054 in pigs and for isoflurane 1.32 ± 0.04 in humans and 1.07 ± 0.05 in pigs [52]. In addition, volatile solubility strongly depends on blood temperature, which is different between humans and pigs (37 °C vs. 38–38.5 °C). Rather high desflurane alveolar concentrations may have
Desflurane uptake
time (min)
0 10 20 30 40
Des
flura
ne (m
L kg
-1m
in-1
)
0
2
4
6
healthy pigsHigh CO, low MVLow CO, high MV
Desflurane elimination
time (min)
0 10 20 30 40
Des
flura
ne (m
L kg
-1m
in-1
)
-8
-6
-4
-2
0
2healthy pigsHigh CO, low MVLow CO, high MV
time (min)
0 10 20 30 40
Sev
oflu
rane
(mL
kg-1
min
-1)
0,00
0,02
0,04
0,06healthy pigsHigh CO, low MVLow CO, high MV
Sevoflurane uptake
time (min)
0 10 20 30 40
Sev
oflu
rane
(mL
kg-1
min
-1)
-0,06
-0,04
-0,02
0,00
0,02
healthy pigsHigh CO, low MVLow CO, high MV
Sevoflurane elimination

45
resulted in local changes of the distribution of ventilation and pulmonary perfusion without affecting HPV and pulmonary shunt [58].
In addition, the piglet model may not provide a direct human comparison in terms of the severity of the physiological response to MCh, perhaps in part because of limited collateral ventilation in the pig [59]. Thus, MCh gas exchange effects in humans have generally been less severe. However, the quantitative conclusions on desflurane and isoflurane kinetics in piglets can be transposed to anesthesia in humans suffering from diseases such as COPD, asthma, and emphysema, which coincide with pulmonary VA/Q mismatch and increased right to left shunt, since the present results correlate desflurane and isoflurane wash-in/washout to VA/Q distribution.
The administered amounts of MCh were individualized to attain a similar effect in each pig. We used the surrogate target parameter peak airway pressure (PAW). Our results show that peak airway pressure was about doubled, and this can be considered as a clinically relevant index for dose titration.
The bronchodilating effects of desflurane and isoflurane appear different in varying species. In humans, desflurane and isoflurane exert similar effects on proximal airway tissues, while the effect on distal airways is lower for desflurane than isoflurane [60]. In contrast, animal experiments on rats revealed similar effects of the two volatile agents with regard to protection from MCh-induced bronchoconstriction [61]. Although we cannot categorically exclude an alleviating effect of the volatile anesthetics, it should be noted that respiratory mechanics were not influenced by the added volatile agents prior to and after MCh inhalation.
Importantly, the effect of temperature on the solubility of the volatile anesthetics has to be taken into account. Although the pigs were placed on heating mats, variations of ±2°C around the normal body temperature did occur. This might have had an effect on the calculations of volatile uptake.
Conclusions Study I A direct comparison of MIGET by MMIMS with conventional MIGET by GC in animal models that covered a wide range of normal and abnormal VA/Q distributions was made. The two methods agreed well, and parameters derived from both methods showed good agreement with externally measured references. The MIGET-by-MMIMS method was less technically demanding than MIGET by GC, and the measured VA/Q distributions from MMIMS were available within minutes, providing nearly real-time monitoring of the matching of alveolar ventilation and perfusion.

46
Study II–IV
The present porcine model of bronchoconstriction demonstrates a delay in volatile anesthetic uptake and elimination. This is related to the heterogeneity of ventilation, as indicated by broadening and shift of the distribution modes by MCh inhalation.
The difference in solubility of volatile anesthetics has a significant influence on their uptake and elimination in a piglet model of bronchoconstriction and VA/Q mismatch. The higher soluble isoflurane is affected to a lesser degree than the fairly insoluble desflurane.

47
Acknowledgements
The experimental studies were carried out at the Department of Surgical Sciences, Hedenstierna Laboratory of the Uppsala University, Sweden.
I would like to express my deep gratitude to all who have contributed to the success of this work.
In particular, I wish to thank:
Anders Larsson, my tutor, for his help and support, and above all, for asking the right questions at the right time.
Göran Hedenstierna, for his support and motivation, great generosity and kindness. His vast enthusiasm and experience makes the laboratory which carries his name a fantastic place for scientific research.
Thomas Hachenberg, for the promises he gave, the opportunities he opened, and for keeping every promise made. His inspiration, support and driving pressure has significantly encouraged my academic career.
Thomas Schilling, who has accompanied my professional and my research career since I was a medical student. For his help, support and mentoring I am deeply grateful.
Alf Kozian, who took me to Uppsala for my first visit to the lab, and since then has not only supported me during experiments, but has taught me a lot about anesthesia.
James E. Baumgardner, not only for building the MMIMS, but also for his support during the experiments. The studies would not have been possible without him.
João Batista Borges, for great discussions, not only about research. He always made it possible to support me during the experiments, even if he had other work to do.

48
I wish to express my special thanks to the staff members of the Hedenstierna Laboratory at Uppsala University, especially to: Agneta Ronéus, Kerstin Ahlgren, Monika Hall, Annelie Ryden, Anders Nordgren, Maria Swälas and Karin Fagerbrink for teaching, preparing and assisting in animal experiments.
Eva-Maria Hedin, without whose meticulous care the MIGET measurements would not have been possible.
Especially, thank you all for your vast kindness and for making the lab such a special place.
My colleagues in the Department of Anaesthesia of the Otto-von-Guericke-University Magdeburg for their help and support.
My family for support, patience and understanding.
And above all, my wife Inga and my children Bente, Onnen and Malin. You had to do without me, not only during my visits to Uppsala, but also during weekends and evenings. This is for you.
Moritz A. Kretzschmar, M.D., D.E.S.A.
Uppsala, 2016
***
The work was supported by the Swedish Medical Research Council (5315), by grants from the Swedish Heart Lung Fund, the Swiss National Foundation (320030_133046) and by institute sources oft he Uppsala University and the Otto-von-Guericke University, Magdeburg.

49
References
[1] Gea J, Roca J, Torres A, Agusti AG, Wagner PD, Rodriguez-Roisin R. Mechanisms of abnormal gas exchange in patients with pneumonia. Anesthesiology. 1991;75:782-9.
[2] Hedenstierna G. Contribution of multiple inert gas elimination technique to pulmonary medicine. 6. Ventilation-perfusion relationships during anaesthesia. Thorax1995. p. 85-91.
[3] Rodriguez-Roisin R, Wagner PD. Clinical relevance of ventilation-perfusion inequality determined by inert gas elimination. Eur Respir J. 1990;3:469-82.
[4] Agustí AG, Barberà JA. Contribution of multiple inert gas elimination technique to pulmonary medicine. 2. Chronic pulmonary diseases: chronic obstructive pulmonary disease and idiopathic pulmonary fibrosis. Thorax1994. p. 924-32.
[5] Wagner PD, Naumann PF, Laravuso RB. Simultaneous measurement of eight foreign gases in blood by gas chromatography. Journal of Applied Physiology1974. p. 600-5.
[6] Wagner PD. The multiple inert gas elimination technique (MIGET). Intensive Care Med2008. p. 994-1001.
[7] Baumgardner JE, Choi IC, Vonk-Noordegraaf A, Frasch HF, Neufeld GR, Marshall BE. Sequential V(A)/Q distributions in the normal rabbit by micropore membrane inlet mass spectrometry. J Appl Physiol2000. p. 1699-708.
[8] Baumgardner JE, Quinn JA, Neufeld GR. Micropore membrane inlet mass spectrometer probes suitable for measurement of tissue surface gas tensions. J Mass Spectrom1995. p. 563-71.
[9] Eger EI, Severinghaus JW. Effect of Uneven Pulmonary Distribution of Blood and Gas on Induction with Inhalation Anesthetics. Anesthesiology1964. p. 620-6.
[10] Eger EI. Respiratory and Circulatory Factors in Uptake and Distribution of Volatile Anaesthetic Agents. British journal of anaesthesia1964. p. 155-71.
[11] Eger EI. Uptake of inhaled anesthetics: The alveolar to inspired anesthetic difference. Anesthetic Uptake and Action Williams & Wilkins, Baltimore; 1974. p. 77-96.
[12] Hendrickx JF, Dishart MK, De Wolf AM. Isoflurane and desflurane uptake during liver resection and transplantation. Anesth Analg. 2003;96:356-62, table of contents.

50
[13] Hendrickx JF, Van Zundert AA, De Wolf AM. Sevoflurane pharmacokinetics: effect of cardiac output. Br J Anaesth. 1998;81:495-501.
[14] Hendrickx JF, Soetens M, Van der Donck A, Meeuwis H, Smolders F, De Wolf AM. Uptake of desflurane and isoflurane during closed-circuit anesthesia with spontaneous and controlled mechanical ventilation. Anesth Analg. 1997;84:413-8.
[15] Casati A, Marchetti C, Spreafico E, Mamo D. Effects of obesity on wash-in and wash-out kinetics of sevoflurane. Eur J Anaesthesiol. 2004;21:243-5.
[16] Lemmens HJ, Saidman LJ, Eger EI, 2nd, Laster MJ. Obesity modestly affects inhaled anesthetic kinetics in humans. Anesth Analg. 2008;107:1864-70.
[17] Macario A, Dexter F, Lubarsky D. Meta-analysis of trials comparing postoperative recovery after anesthesia with sevoflurane or desflurane. Am J Health Syst Pharm. 2005;62:63-8.
[18] Lopez-Campos JL, Tan W, Soriano JB. Global burden of COPD. Respirology. 2016;21:14-23.
[19] Mortality GBD, Causes of Death C. Global, regional, and national age-sex specific all-cause and cause-specific mortality for 240 causes of death, 1990-2013: a systematic analysis for the Global Burden of Disease Study 2013. Lancet. 2015;385:117-71.
[20] Seigne PW, Hartigan PM, Body SC. Anesthetic considerations for patients with severe emphysematous lung disease. Int Anesthesiol Clin. 2000;38:1-23.
[21] Eger EI, 2nd, Bahlman SH. Is the end-tidal anesthetic partial pressure an accurate measure of the arterial anesthetic partial pressure? Anesthesiology. 1971;35:301-3.
[22] Frei FJ, Zbinden AM, Thomson DA, Rieder HU. Is the end-tidal partial pressure of isoflurane a good predictor of its arterial partial pressure? Br J Anaesth. 1991;66:331-9.
[23] Landon MJ, Matson AM, Royston BD, Hewlett AM, White DC, Nunn JF. Components of the inspiratory-arterial isoflurane partial pressure difference. Br J Anaesth. 1993;70:605-11.
[24] Use NRCUCoRIiACa. Definition of Pain and Distress and Reporting Requirements for Laboratory Animals: Proceedings of the Workshop Held June 22, 2000. The National Academies Collection: Reports funded by National Institutes of Health: National Academies Press (US); 2000.
[25] Wagner PD LF. Gas chromatography techniques in respiratory physiology. In: AB O, editor. Techniques in the life sciences. Ireland: Elsevier Ireland; 1984. p. 403/1–/24.
[26] Wagner PD, Saltzman HA, West JB. Measurement of continuous distributions of ventilation-perfusion ratios: theory. J Appl Physiol1974. p. 588-99.
[27] Rothen HU, Sporre B, Engberg G, Wegenius G, Hedenstierna G. Re-expansion of atelectasis during general anaesthesia: a computed tomography study. Br J Anaesth. 1993;71:788-95.
[28] Duenges B, Vogt A, Bodenstein M, Wang H, Böhme S, Röhrig B, et al. A comparison of micropore membrane inlet mass spectrometry-derived

51
pulmonary shunt measurement with Riley shunt in a porcine model. Anesth Analg2009. p. 1831-5.
[29] Kretzschmar M, Schilling T, Vogt A, Rothen HU, Borges JB, Hachenberg T, et al. Multiple inert gas elimination technique by micropore membrane inlet mass spectrometry--a comparison with reference gas chromatography. J Appl Physiol. 2013;115:1107-18.
[30] Conover W. Practical Nonparametric Statistics. New York, NY: John Wiley and Sons; 1999.
[31] Gale GE, Torre-Bueno JR, Moon RE, Saltzman HA, Wagner PD. Ventilation-perfusion inequality in normal humans during exercise at sea level and simulated altitude. J Appl Physiol (1985). 1985;58:978-88.
[32] Roca J, Wagner PD. Contribution of multiple inert gas elimination technique to pulmonary medicine. 1. Principles and information content of the multiple inert gas elimination technique. Thorax1994. p. 815-24.
[33] Bland JM, Altman DG. Measuring agreement in method comparison studies. Stat Methods Med Res. 1999;8:135-60.
[34] Wagner PD, Laravuso RB, Uhl RR, West JB. Continuous distributions of ventilation-perfusion ratios in normal subjects breathing air and 100 per cent O2. J Clin Invest. 1974;54:54-68.
[35] Kelman GR. Digital computer subroutine for the conversion of oxygen tension into saturation. J Appl Physiol. 1966;21:1375-6.
[36] Kelman GR. Digital computer procedure for the conversion of PCO2 into blood CO2 content. Respir Physiol. 1967;3:111-5.
[37] West J, Wagner P. Pulmonary Gas Exchange. In: West J, editor. Bioengineering Aspects of the Lung. New York: Marcel Dekker; 1977. p. 361–457.
[38] Hachenberg T, Tenling A, Nyström SO, Tydén H, Hedenstierna G. Ventilation-perfusion inequality in patients undergoing cardiac surgery. Anesthesiology1994. p. 509-19.
[39] Rothen HU, Sporre B, Engberg G, Wegenius G, Högman M, Hedenstierna G. Influence of gas composition on recurrence of atelectasis after a reexpansion maneuver during general anesthesia. Anesthesiology1995. p. 832-42.
[40] Siggaard-Andersen O, Gothgen IH. Oxygen and acid-base parameters of arterial and mixed venous blood, relevant versus redundant. Acta Anaesthesiol Scand Suppl. 1995;107:21-7.
[41] Andersen OS, Engel K, Jorgensen K, Astrup P. A Micro method for determination of pH, carbon dioxide tension, base excess and standard bicarbonate in capillary blood. Scand J Clin Lab Invest. 1960;12:172-6.
[42] Serianni R, Barash J, Bentley T, Sharma P, Fontana JL, Via D, et al. Porcine-specific hemoglobin saturation measurements. J Appl Physiol (1985). 2003;94:561-6.
[43] Kretzschmar M, Schilling T, Vogt A, Rothen HU, Borges JB, Hachenberg T, et al. Digital supplement to: Multiple inert gas elimination technique by micropore membrane inlet mass spectrometry-a comparison with reference gas chromatography.

52
[44] Sly PD, Willet KE, Kano S, Lanteri CJ, Wale J. Pirenzepine blunts the pulmonary parenchymal response to inhaled methacholine. Pulm Pharmacol. 1995;8:123-9.
[45] Peták F, Hantos Z, Adamicza A, Asztalos T, Sly PD. Methacholine-induced bronchoconstriction in rats: effects of intravenous vs. aerosol delivery. J Appl Physiol. 1997;82:1479-87.
[46] Kirby M, Coxson HO, Parraga G. Pulmonary functional magnetic resonance imaging for paediatric lung disease. Paediatr Respir Rev. 2013;14:180-9.
[47] Wagner PD, Hedenstierna G, Rodriguez-Roisin R. Gas exchange, expiratory flow obstruction and the clinical spectrum of asthma. European Respiratory Journal1996. p. 1278-82.
[48] Wagner PD, Dantzker DR, Iacovoni VE, Tomlin WC, West JB. Ventilation-perfusion inequality in asymptomatic asthma. Am Rev Respir Dis. 1978;118:511-24.
[49] Shen X, Gunst SJ, Tepper RS. Effect of tidal volume and frequency on airway responsiveness in mechanically ventilated rabbits. J Appl Physiol (1985). 1997;83:1202-8.
[50] Anafi RC, Wilson TA. Airway stability and heterogeneity in the constricted lung. J Appl Physiol (1985). 2001;91:1185-92.
[51] Verbanck S, Gonzalez Mangado N, Peces-Barba G, Paiva M. Multiple-breath washout experiments in rat lungs. J Appl Physiol (1985). 1991;71:847-54.
[52] Soares JHN, Brosnan RJ, Fukushima FB, Hodges J, Liu H. Solubility of haloether anesthetics in human and animal blood. Anesthesiology2012. p. 48-55.
[53] Eger EI. Anesthetic uptake and action. Baltimore,: Williams & Wilkins; 1974. [54] Eger I, Edmond I, Saidman LJ. Illustrations of Inhaled Anesthetic Uptake,
Including Intertissue Diffusion to and from Fat. Anesth Analg. 2005;100:1020-33.
[55] Stoelting RK, Longnecker DE. The effect of right-to-left shunt on the rate of increase of arterial anesthetic concentration. Anesthesiology. 1972;36:352-6.
[56] Gunnarsson L, Tokics L, Lundquist H, Brismar B, Strandberg A, Berg B, et al. Chronic obstructive pulmonary disease and anaesthesia: formation of atelectasis and gas exchange impairment. Eur Respir J. 1991;4:1106-16.
[57] Leeson S, Roberson RS, Philip JH. Hypoventilation after inhaled anesthesia results in reanesthetization. Anesth Analg. 2014;119:829-35.
[58] Schwarzkopf K, Schreiber T, Preussler NP, Gaser E, Huter L, Bauer R, et al. Lung perfusion, shunt fraction, and oxygenation during one-lung ventilation in pigs: the effects of desflurane, isoflurane, and propofol. J Cardiothorac Vasc Anesth. 2003;17:73-5.
[59] Takeda J, Mackenzie CF, Watson R, Roberts HG, Jr., Moorman R, Hoff BH, et al. Collateral ventilation of obstructed lung during high-frequency oscillation in dogs and pigs. Crit Care Med. 1987;15:858-62.

53
[60] Mercier FJ, Naline E, Bardou M, Georges O, Denjean A, Benhamou D, et al. Relaxation of proximal and distal isolated human bronchi by halothane, isoflurane and desflurane. Eur Respir J. 2002;20:286-92.
[61] Habre W, Petak F, Sly PD, Hantos Z, Morel DR. Protective effects of volatile agents against methacholine-induced bronchoconstriction in rats. Anesthesiology. 2001;94:348-53.

Acta Universitatis UpsaliensisDigital Comprehensive Summaries of Uppsala Dissertationsfrom the Faculty of Medicine 1269
Editor: The Dean of the Faculty of Medicine
A doctoral dissertation from the Faculty of Medicine, UppsalaUniversity, is usually a summary of a number of papers. A fewcopies of the complete dissertation are kept at major Swedishresearch libraries, while the summary alone is distributedinternationally through the series Digital ComprehensiveSummaries of Uppsala Dissertations from the Faculty ofMedicine. (Prior to January, 2005, the series was publishedunder the title “Comprehensive Summaries of UppsalaDissertations from the Faculty of Medicine”.)
Distribution: publications.uu.seurn:nbn:se:uu:diva-304298
ACTAUNIVERSITATIS
UPSALIENSISUPPSALA
2016