Embed Size (px)
Citation preview

U.S. Department of Health and Human ServicesCenters for Disease Control and Prevention
Morbidity and Mortality Weekly ReportWeekly / Vol. 61 / No. 22 June 8, 2012
Continuing Education examination available at http://www.cdc.gov/mmwr/cme/conted_info.html#weekly.
Deep vein thrombosis (DVT) is a blood clot that occurs in a deep vein of the body; pulmonary embolism (PE) occurs when a clot breaks free and enters the arteries of the lungs. DVT and PE comprise venous thromboembolism (VTE), an important and growing public health concern (1,2). Hospitalization is a major risk factor for VTE, and many VTE events that occur among hospitalized patients can be prevented (2,3). A new pro-gram of the U.S. Department of Health and Human Services (Partnership for Patients: Better Care, Lower Costs) aims to reduce the number of preventable VTE cases in hospitals (4). To estimate the number of hospitalizations with VTE each year in the United States, CDC analyzed 2007–2009 data from the National Hospital Discharge Survey (NHDS). The results of that analysis determined that an estimated average of 547,596 hospitalizations with VTE occurred each year among those aged ≥18 years in the United States. DVT was diagnosed in an estimated annual average of 348,558 hospitalizations, and PE was diagnosed in 277,549; both DVT and PE were diagnosed in 78,511 hospitalizations. Estimates of the rates of hospital-izations with VTE were substantially higher among adults aged ≥60 years compared with those aged 18–59 years. These findings underscore the need to promote implementation of evidence-based prevention strategies to reduce the number of preventable cases of VTE among hospitalized patients.
NHDS uses a stratified multistage probability design to obtain a sample of discharges from nonfederal short-stay (average: <30 days) hospitals in the 50 states and District of Columbia (5). Medical and demographic information, up to seven listed discharge diagnoses, and disposition (including patient death) are collected for a sample of discharges from each hospital. Data including restricted design variables were accessed through the Research Data Center of CDC’s National Center for Health Statistics. For this report, International Classification of Diseases, Ninth Revision, Clinical Modification (ICD-9-CM) codes were used to identify hospitalizations of persons aged ≥18 years with discharge diagnoses of DVT or
PE. A DVT diagnosis was defined as the presence of any of the ICD-9-CM codes 451.1x, 451.81, 451.83, 453.2, 453.4x, 671.3x, and 671.4x. A PE diagnosis was defined as the pres-ence of any of the ICD-9-CM codes 415.1x and 673.2x. Hospitalizations with codes for either DVT or PE also were counted as having a VTE diagnosis. Whether DVT or PE were present on admission or acquired during the hospital stay could not be determined. Data from 2007–2009 were used in this analysis. Weighted estimates of the average annual number of hospitalizations with a discharge diagnosis of DVT or PE were divided by the 2008 midyear U.S. population estimates to derive rates of hospitalizations with a diagnosis of VTE per 100,000 population overall among adults aged ≥18 years, by sex and selected age groups.
During 2007–2009, an estimated annual average of 547,596 hospitalizations had a diagnosis of VTE for adults aged ≥18 years. Estimates for DVT and PE diagnoses were not mutu-ally exclusive. An estimated annual average of 348,558 adult
Venous Thromboembolism in Adult Hospitalizations — United States, 2007–2009
INSIDE405 Neonatal Herpes Simplex Virus Infection Following
Jewish Ritual Circumcisions that Included Direct Orogenital Suction — New York City, 2000–2011
410 Methodologic Changes in the Behavioral Risk Factor Surveillance System in 2011 and Potential Effects on Prevalence Estimates
414 Update: Influenza Activity — United States, 2011–12 Season and Composition of the 2012–13 Influenza Vaccine
421 Notes from the Field: Investigation of Leptospirosis Underreporting — Puerto Rico, 2010
422 QuickStats

Morbidity and Mortality Weekly Report
402 MMWR / June 8, 2012 / Vol. 61 / No. 22
The MMWR series of publications is published by the Office of Surveillance, Epidemiology, and Laboratory Services, Centers for Disease Control and Prevention (CDC), U.S. Department of Health and Human Services, Atlanta, GA 30333.Suggested citation: Centers for Disease Control and Prevention. [Article title]. MMWR 2012;61:[inclusive page numbers].
Centers for Disease Control and PreventionThomas R. Frieden, MD, MPH, Director
Harold W. Jaffe, MD, MA, Associate Director for ScienceJames W. Stephens, PhD, Director, Office of Science Quality
Stephen B. Thacker, MD, MSc, Deputy Director for Surveillance, Epidemiology, and Laboratory ServicesStephanie Zaza, MD, MPH, Director, Epidemiology and Analysis Program Office
MMWR Editorial and Production StaffRonald L. Moolenaar, MD, MPH, Editor, MMWR Series
John S. Moran, MD, MPH, Deputy Editor, MMWR SeriesTeresa F. Rutledge, Managing Editor, MMWR Series
Douglas W. Weatherwax, Lead Technical Writer-EditorDonald G. Meadows, MA, Jude C. Rutledge, Writer-Editors
Martha F. Boyd, Lead Visual Information Specialist
Maureen A. Leahy, Julia C. Martinroe, Stephen R. Spriggs, Terraye M. Starr
Visual Information SpecialistsQuang M. Doan, MBA, Phyllis H. King
Information Technology Specialists
MMWR Editorial BoardWilliam L. Roper, MD, MPH, Chapel Hill, NC, Chairman
Matthew L. Boulton, MD, MPH, Ann Arbor, MIVirginia A. Caine, MD, Indianapolis, IN
Jonathan E. Fielding, MD, MPH, MBA, Los Angeles, CADavid W. Fleming, MD, Seattle, WA
William E. Halperin, MD, DrPH, MPH, Newark, NJKing K. Holmes, MD, PhD, Seattle, WADeborah Holtzman, PhD, Atlanta, GATimothy F. Jones, MD, Nashville, TN
Dennis G. Maki, MD, Madison, WIPatricia Quinlisk, MD, MPH, Des Moines, IA
Patrick L. Remington, MD, MPH, Madison, WIJohn V. Rullan, MD, MPH, San Juan, PR
William Schaffner, MD, Nashville, TNDixie E. Snider, MD, MPH, Atlanta, GA
John W. Ward, MD, Atlanta, GA
hospitalizations had a diagnosis of DVT, and 277,549 adult hospitalizations had a diagnosis of PE. An estimated annual average of 78,511 adult hospitalizations (14% of overall VTE hospitalizations) had diagnoses of both DVT and PE.
The estimated average annual number of hospitalizations with VTE was successively greater among older age groups: 54,034 for persons aged 18–39 years; 143,354 for persons aged 40–59 years; and 350,208 for persons aged ≥60 years (Figure). The estimated average annual number of hospitalizations with VTE was comparable for men (250,973) and women (296,623).
The average annual rates of hospitalizations with a discharge diagnosis of DVT, PE, or VTE among adults were 152, 121, and 239 per 100,000 population, respectively (Table). For VTE, the average annual rates were 60 per 100,000 population aged 18–39 years, 143 for persons aged 40–49 years, 200 for persons aged 50–59 years, 391 for persons aged 60–69 years, 727 for persons aged 70–79 years, and 1,134 for persons aged ≥80 years. The rates of hospitalization were similar for men and women, and the point estimates increased for both sexes by age.
On average, 28,726 hospitalized adults with a VTE diagnosis died each year. Of these patients, an average of 13,164 had a DVT diagnosis and 19,297 had a PE diagnosis; 3,735 had both DVT and PE diagnoses.
Reported by
Hussain R. Yusuf, MD, James Tsai, MD, Hani K. Atrash, MD, Sheree Boulet, DrPH, Scott D. Grosse, PhD, Div of Blood Disorders, National Center on Birth Defects and Developmental Disabilities, CDC. Corresponding contributor: Hussain Yusuf, [email protected], 404-498-3937.
Editorial Note
The results of this analysis underscore the importance of VTE as a public health concern. Many of the VTE diagnoses reported via NHDS might have occurred during hospitaliza-tion, when the risk for VTE is known to be elevated (e.g., because of major surgery, immobility, or comorbid conditions)
What is already known on this topic?
Hospitalized patients are at increased risk for venous thrombo-embolism (VTE), which consists of deep vein thrombosis (DVT) and pulmonary embolism (PE). Many of the VTEs acquired by hospitalized patients are preventable.
What is added by this report?
During 2007–2009, an estimated annual average of 547,596 adult hospitalizations occurred for which a discharge diagnosis of VTE was recorded; 348,558 of these hospitalizations had a discharge diagnosis of DVT, and 277,549 had a discharge diagnosis of PE. A total of 78,511 had both discharge diagnoses.
What are the implications for public health practice?
VTE is an important public health concern. Greater efforts are needed to identify, develop, and implement VTE prevention strategies and to improve surveillance for VTE cases to reduce morbidity and mortality from VTE.

Morbidity and Mortality Weekly Report
MMWR / June 8, 2012 / Vol. 61 / No. 22 403
(1–3). Because VTE cases that occur in hospitals often are preventable, an opportunity exists to reduce disease burden through implementation of evidence-based prevention strate-gies in hospital settings (1,2,6).
The incidence of DVT and PE is known to be much higher among older adults compared with younger persons (7). In this analysis, the estimates of hospitalization rates with a dis-charge diagnosis of DVT, PE, or VTE were successively higher among older age groups. Although DVT and PE affect older
hospitalized patients the most, a substantial number of hospitalizations with a diagnosis of VTE occurred among younger patients. Previous research has not clearly demonstrated a consistent difference between the rates of VTE in men and women (8). The findings in this report indicate that hospitalization rates with a diagnosis of DVT, PE, or VTE were comparable between men and women.
Many DVT and PE events can be pre-vented through appropriate administration of prophylaxis, which might include pharmaco-logic agents (e.g., antithrombotic agents) or mechanical devices. Current use of prophylaxis in hospitalized patients might be suboptimal (1,9). CDC is collaborating with partners to promote implementation of evidence-based guidelines for prevention of DVT and PE in hospitalized patients. CDC also is developing a VTE module within the National Healthcare Safety Network, a web-based surveillance system for hospitals and health-care facilities.*
The findings in this report are subject to at least four limita-tions. First, whether DVT or PE was present on admission or onset occurred during the hospital stay cannot be determined. Second, DVT and PE diagnoses were identified using ICD-9-CM codes available in NHDS data rather than through medical record abstraction. Research suggests that most of the DVT and PE ICD-9-CM codes recorded in discharge records
TABLE. Estimated average annual rate (per 100,000 population) of hospitalizations with a diagnosis of deep vein thrombosis (DVT), pulmonary embolism (PE), or venous thromboembolism (VTE), by patient sex and age group — National Hospital Discharge Survey, United States, 2007–2009*
Age group (yrs)
DVT PE VTE
Total (95% CI)
Men (95% CI)
Women(95% CI)
Total (95% CI)
Men (95% CI)
Women(95% CI)
Total (95% CI)
Men (95% CI)
Women(95% CI)
Overall 152(127–177)
146(122–171)
158(131–185)
121(98–144)
115(91–138)
127(102–153)
239(199–279)
226(187–265)
252(208–296)
18–39 34(26–42)
32(23–40)
36(27–45)
33(25–40)
28(19–36)
38(28–48)
60(47–72)
53(40–65)
67(52–81)
40–49 81(63–98)
97(72–123)
64(47–81)
82(63–100)
85(61–109)
78(58–99)
143(114–172)
154(117–190)
132(103–161)
50–59 120(98–143)
144(113–175)
97(75–119)
111(86–135)
124(91–156)
99(73–124)
200(164–237)
226(180–272)
176(138–213)
60–69 247(194–299)
254(197–311)
241(181–301)
203(160–246)
208(159–257)
199(150–247)
391(315–468)
405(321–490)
379(293–465)
70–79 487(389–584)
469(362–576)
501(388–614)
349(264–434)
337(229–445)
359(276–442)
727(582–872)
720(556–884)
732(578–885)
≥80 791(649–934)
821(635–1,007)
775(629–921)
500(392–609)
537(390–684)
480(368–592)
1,134(927–1,340)
1,153(904–1,402)
1,123(911–1,336)
Abbreviation: CI = confidence interval.* Diagnoses of DVT and PE are not mutually exclusive; an estimated 78,511 patients received diagnoses of both DVT and PE. VTE estimates include patients with
diagnoses of either DVT or PE.
* Additional information available at http://www.cdc.gov/nhsn.
* Diagnoses of DVT and PE are not mutually exclusive; an estimated 78,511 patients received diagnoses of both DVT and PE. VTE estimates include patients with diagnoses of either DVT or PE.
† 95% confidence interval.
FIGURE. Estimated average annual number of hospitalizations with a diagnosis of deep vein thrombosis (DVT), pulmonary embolism (PE), or venous thromboembolism (VTE), by patient sex and age group — National Hospital Discharge Survey, United States, 2007–2009*
0
50
100
150
200
250
300
350
400
450
18–39 40–59 ≥60 Men Women
DVTPEVTE
Age group (yrs) and Sex
†
No.
(in
thou
sand
s)

Morbidity and Mortality Weekly Report
404 MMWR / June 8, 2012 / Vol. 61 / No. 22
and used in this study on average have positive predictive values ranging from 75% to 95% (10). Third, the unit of analysis in this report was hospitalization and not the number of persons with diagnoses of DVT or PE. Patients hospitalized multiple times for these conditions in a given year would be counted more than once in NHDS data. Finally, NHDS surveys a sample of hospitalizations in the United States; therefore, the findings are subject to sampling variability.
Patients should discuss VTE prevention with their health-care providers before and during hospitalization and adhere to prescribed therapies, as appropriate. Comprehensive public health efforts also are needed to prevent VTE among hospital-ized patients. Development and implementation of evidence-based prevention strategies are important to achieving this goal.
References 1. Raskob GE, Silverstein R, Bratzler DW, Heit JA, White RH. Surveillance
for deep vein thrombosis and pulmonary embolism: recommendations from a national workshop. Am J Prev Med 2010;38(4 Suppl):S502–9.
2. Beckman MG, Hooper C, Critchley SE, Ortel TL. Venous thromboembolism: a public health concern. Am J Prev Med 2010;38(4 Suppl):S495–501.
3. Heit JA. Venous thromboembolism: disease burden, outcomes and risk factors. J Thromb Haemost 2005;3:1611–7.
4. US Department of Health and Human Services. Partnership for patients: better care, lower costs. Washington, DC: US Department of Health and Human Services; 2011. Available at http://www.healthcare.gov/compare/partnership-for-patients. Accessed June 2, 2012.
5. Hall MJ, DeFrances CJ, Williams SN, Golosinskiy A, Schwartzman A. National Hospital Discharge Survey: 2007 summary. Natl Health Stat Rep 2010;26:1–20,24.
6. Maynard GA, Morris TA, Jenkins IH. Optimizing prevention of hospital-acquired venous thromboembolism (VTE): prospective validation of a VTE risk assessment model. J Hosp Med 2010;5:10–8.
7. Silverstein MD, Heit J, Mohr DN, Petterson TM, O’Fallon WM, Melton III LJ. Trends in the incidence of deep vein thrombosis and pulmonary embolism: a 25-year population-based study. Arch Intern Med 1998;158:585–93.
8. Tormene D, Ferri V, Carraro S, Simioni P. Gender and the risk of venous thromboembolism. Semin Thromb Hemost 2011;37:193–8.
9. Yu HT, Dylan ML, Lin J, Dubois RW. Hospitals’ compliance with prophylaxis guidelines for venous thromboembolism. Am J Health Syst Pharm 2007;64:69–76.
10. White RH, Garcia M, Sadeghi B, et al. Evaluation of the predictive value of ICD-9-CM coded administrative data for venous thromboembolism in the United States. Thromb Res 2010;126:61–7.

Morbidity and Mortality Weekly Report
MMWR / June 8, 2012 / Vol. 61 / No. 22 405
Herpes simplex virus (HSV) infection commonly causes “cold sores” (HSV type 1 [HSV-1]) and genital herpes (HSV-1 or HSV type 2 [HSV-2]); HSV infection in new-borns can result in death or permanent disability. During November 2000–December 2011, a total of 11 newborn males had laboratory-confirmed HSV infection in the weeks following out-of-hospital Jewish ritual circumcision, investi-gators from the New York City Department of Health and Mental Hygiene (DOHMH) learned. Ten of the 11 newborns were hospitalized; two died. In six of the 11 cases, health-care providers confirmed parental reports that the ritual circumcision included an ultra-Orthodox Jewish practice known as metzitzah b’peh, in which the circumciser (mohel, plural: mohelim) places his mouth directly on the newly cir-cumcised penis and sucks blood away from the circumcision wound (direct orogenital suction). In the remaining cases, other evidence suggested that genital infection was introduced by direct orogenital suction (probable direct orogenital suction). Based on cases reported to DOHMH during April 2006–December 2011, the risk for neonatal herpes caused by HSV-1 and untyped HSV following Jewish ritual circumcision with confirmed or probable direct orogenital suction in New York City was estimated at 1 in 4,098 or 3.4 times greater than the risk among male infants considered unlikely to have had direct orogenital suction. Oral contact with a newborn’s open wound risks transmission of HSV and other pathogens. Circumcision is a surgical procedure that should be performed under sterile conditions. Health-care professionals advising parents and parents choosing Jewish ritual circumcision should inquire in advance whether direct orogenital suction will be performed, and orogenital suction should be avoided.
Investigations of Reports In November 2004, DOHMH was notified of twin male
infants who developed disseminated HSV-1 infection follow-ing ritual circumcision (Table 1, cases 3 and 4); one died. The twins were born by cesarean delivery with surgical rupture of membranes and discharged at 4 days of life with normal physi-cal examinations. Their mother had no history of oral or genital herpes and no genital lesions at or after delivery. At 8 days of life, the twins were circumcised by mohel A, who performed direct orogenital suction. At 16 days of life, both twins were evaluated for fever and lesions on their abdomen, buttocks, and perineum, including the genitals. HSV-1 was isolated from
skin lesions of both twins. Twin A, who had been circumcised first, died from disseminated HSV-1 infection.
Investigation of 14 hospital staff members who cared for the infants after birth found no clinical evidence of current HSV infection and no history of HSV infection in the preceding 2 years. Investigation of hospital records found infection control policies sufficient to prevent HSV transmission from staff to neonates and no evidence of nosocomial HSV transmission to any neonates during the previous 2 years. Histologic examina-tion of the diamniotic-dichorionic placenta showed no evidence of HSV infection. Maternal herpes serology showed HSV-1 antibody 4 weeks after the infants’ illness onset. Specimens col-lected from mohel A 97 days after the twins’ circumcisions were positive for antibody to HSV-1 (blood) and negative by culture and polymerase chain reaction (mouth swabs).
During the investigation, DOHMH learned of a 2003 case of neonatal HSV-1 infection following Jewish ritual circumcision that included direct orogenital suction by mohel A (Table 1, case 2). This infant developed vesicles on the penis, perineum, buttocks, back, and foot, beginning 10 days after circumcision. On investigation, the mother was negative for HSV-1 antibody. Hospital staff members who cared for the infant had no clini-cal evidence of herpes infection, and no evidence was found of nosocomial HSV transmission to neonates 2 years before and after the infant’s birth.
In 2005, DOHMH learned of three additional cases of neo-natal herpes infection following Jewish ritual circumcision with confirmed or probable direct orogenital suction. One case was an untyped HSV infection from 2000 (Table 1, case 1) and two cases were HSV-1 infections from 2005 (Table 1, cases 5 and 6).
Surveillance In April 2006, DOHMH established population-based sur-
veillance for neonatal herpes by modifying the New York City Health Code to mandate that laboratories report any laboratory test result indicating the presence of HSV in specimens from infants aged ≤60 days and that health-care providers report any infant aged ≤60 days receiving a diagnosis of herpes infec-tion, even if laboratory confirmation is lacking. During April 2006–December 2011, a total of 84 laboratory-confirmed cases of neonatal herpes were reported. Forty-five cases were in males (HSV-1: 22; HSV-2: 15; and untyped HSV: eight), and 39 cases were in females (HSV-1: 15; HSV-2: 18; and untyped HSV: six).
Neonatal Herpes Simplex Virus Infection Following Jewish Ritual Circumcisions that Included Direct Orogenital Suction —
New York City, 2000–2011

Morbidity and Mortality Weekly Report
406 MMWR / June 8, 2012 / Vol. 61 / No. 22
Cases of laboratory-confirmed HSV-1 or untyped HSV infection in male infants were investigated to determine date of illness onset and whether ritual circumcision had been per-formed and had included direct orogenital suction. For five (11%) of the 45 male cases (HSV-1: 4 and untyped HSV: 1) reported during April 2006–December 2011, confirmed or probable direct orogenital suction was ascertained. Among the five cases were two from 2011. One of those patients died (Table 1, case 11); the other patient (Table 1, case 10) was the brother of a 2008 case (Table 1, case 8). The brothers were both circumcised by the same mohel (mohel X), whom their parents declined to identify. All four HSV-1 cases (18% of the 22 cases of HSV-1 infections in male newborns during April 2006–December 2011) were in residents of a single zip code area that accounts for only 2.5% of all live male births to New York City residents. No other neonatal herpes cases were reported from that zip code area during April 2006–December 2011.
Estimate of Relative Risk To estimate the relative risk for neonatal herpes follow-
ing Jewish ritual circumcision with confirmed or probable direct orogenital suction, neonatal HSV cases reported from April 2006 through December 2011 were used to construct incidence rate numerators, and New York City vital statistics for live male births were used for incidence denominators. The incidence of laboratory-confirmed neonatal herpes (HSV-1 or untyped HSV) among males who had ritual circumcision with confirmed or probable direct orogenital suction was compared with the incidence of laboratory-confirmed HSV-1 or untyped HSV infection among males unlikely to have had direct orogenital suction.
To estimate the number of males potentially exposed to direct orogenital suction each year, first the number of males entering full-day or half-day kindergarten in Jewish day schools in New York City in 2010 was obtained (6,197) (1). Next, the proportion of those children attending schools that could be considered ultra-Orthodox (Hassidic, 2,665 [43%] and Yeshiva, 1,797 [29%]) was derived from New York City data included in a national census of Jewish day schools (2). Next, an assumption was made that 100% of males entering Hassidic schools (2,665), and 50% of those entering Yeshiva schools (899) would have had direct orogenital suction, yielding an estimated annual population at risk of 3,564. This estimate was multiplied by 5.75 (years) to estimate the number of male infants (20,493) likely exposed to direct orogenital suction during the April 2006–December 2011 surveillance period (Table 2).
The number of male infants unlikely to have been exposed to direct oral suction (352,411) was estimated using vital statistics data for the number of live male births (372,904) in New York City during the 5.75-year surveillance period, after subtract-ing the number of males estimated to have been exposed to direct oral suction (20,493).* The risk for neonatal HSV-1 or untyped HSV infection following Jewish ritual circumcision with confirmed or probable direct orogenital suction during April 2006–December 2011 in New York City was estimated to be 24.4 per 100,000, a risk 3.4 (95% confidence interval = 1.3–9.0) times greater than the risk for HSV-1 or untyped HSV infection among male infants unlikely to have had direct orogenital suction (Table 2).
TABLE 1. Reported cases of neonatal herpes simplex virus type 1 (HSV-1) or untyped HSV infection among male infants following ritual Jewish circumcision with confirmed or probable direct orogenital suction — New York City, 2000–2011
Case no. Patient Year Admitting hospitalGenital/Perineal
lesions? HSV type Died?Clinical
syndromeDirect orogenital
suction status* Mohel
1 2000 Hospital A Yes Untyped No SEM Probable Unknown
2 2003 Hospital B Yes HSV-1 No SEM Confirmed Mohel A
3 Twin A 2004 Hospital C Yes HSV-1 Yes Disseminated Confirmed Mohel A
4 Twin B 2004 Hospital C Yes HSV-1 No Disseminated Confirmed Mohel A
5 2005 None (treated as outpatient)
Yes HSV-1 No SEM Confirmed Mohel B
6 2005 Hospital C Yes HSV-1 No CNS Probable Unknown
7 2006 Hospital D Yes Untyped No SEM Confirmed Mohel C
8 Sibling A† 2008 Hospital C Yes HSV-1 No CNS Probable Mohel X
9 2008 Hospital C Yes HSV-1 No SEM Confirmed Unknown
10 Sibling B† 2011 Hospital C Yes HSV-1 No SEM Probable Mohel X
11 2011 Hospital C Yes HSV-1 Yes Disseminated Probable Unknown
Abbreviations: SEM = skin, eye, mouth; CNS = central nervous system. * Confirmed cases = parents reported that direct orogenital suction occurred; probable cases = parents would not directly answer questions about whether direct
orogenital suction occurred, but usually stated that all male infants in their community would be expected to have had direct orogenital suction. † Brothers born 3 years apart and circumcised by the same mohel, whom the parents declined to identify.
* 2010 live birth data were used for 2011 because 2011 data were not yet available.

Morbidity and Mortality Weekly Report
MMWR / June 8, 2012 / Vol. 61 / No. 22 407
Additional Findings and Public Health Actions Of the 11 known cases of HSV (nine HSV-1 and two untyped
HSV) following Jewish ritual circumcision with confirmed or probable orogenital suction during 2000–2011, the interval from circumcision to appearance of herpes lesions ranged from 5 to 20 days (median: 8 days) (Figure). Two sets of parents said they were unaware beforehand that direct orogenital suction would be per-formed. In five cases, the identity of the mohel could not be deter-mined; beginning in 2005, parents interviewed by DOHMH for the purposes of case investigation refused to explicitly state whether direct orogenital suction had been performed. Because mohel X could have been mohel A, the number of mohelim involved in the 11 cases could not be determined with certainty but was at least three and not more than eight.
Efforts made by DOHMH to prevent neonatal herpes included meetings with ultra-Orthodox Jewish community leaders to urge mohel A to stop practicing direct orogenital suction during circum-cision and issuing an alert to health-care providers and an open letter to the Jewish community warning that the practice poses a health risk. In addition, a legally binding directive was issued by the New York City Commissioner of Health directing mohel A to cease and desist from direct orogenital suction.
Reported by
Susan Blank, MD, Julie E. Myers, MD, Preeti Pathela, PhD, Kate Washburn, MPH, Jay K. Varma, MD, James L. Hadler, MD, Thomas A Farley, MD, New York City Dept of Health and Mental Hygiene, New York, New York. Julia A. Schillinger, MD, Div of Sexually Transmitted Disease Prevention, National Center for HIV/AIDS, Viral Hepatitis, STD, and TB Prevention, CDC. Corresponding contributor: Julia A. Schillinger, [email protected], 347-396-4078.
Editorial Note
Previous reports have described neonatal HSV-1 infection following Jewish ritual circumcision that included direct oro-genital suction (3,4), including two additional cases in New York City occurring 10 years apart (5) that are not included in this report. The findings of this investigation and the previ-ously published reports are consistent with a cause-and-effect relationship between Jewish ritual circumcision with direct orogenital suction and neonatal HSV-1 infection. The previous reports and these 11 additional cases strongly suggest HSV-1 can be transmitted to a neonate when circumcision involves direct orogenital suction of the penile incision.
Most neonatal HSV infections (85%) are transmitted during delivery from a mother with genital herpes; 5% of infections are congenital, and 10% are acquired after birth, usually from adult care-givers. The majority of infections present in the first 2 weeks of life. In mothers with genital herpes lesions at term, risk for perinatal transmission can be reduced by cesarean delivery (6).
For the 11 cases described in this report, transmission from the mother or health-care workers was largely excluded, and the preponderance of evidence pointed to acquisition during orogenital suction. First, in the cluster of three cases associ-ated with mohel A, the twins were born by cesarean delivery, and the mother of the other HSV-infected neonate was HSV seronegative. Second, neonatal HSV-1 infection in males is uncommon, with a median of three cases each year in New York City, making it improbable that a single mohel would be associated with more than one case of male HSV-1 neonatal
TABLE 2. Number of reported cases of laboratory-confirmed neonatal herpes simplex virus type 1 (HSV-1) or untyped HSV infection among male infants aged ≤60 days, by exposure status — New York City, April 2006–December 2011
Exposure
No. of cases of male HSV-1
or untyped HSV infection
Estimated male infant population
at riskRate per 100,000
Ritual circumcision with confirmed or probable direct orogenital suction
5 20,493 24.4
Unlikely to have had direct orogenital suction
25 352,411 7.1
Total 30 372,904 8.0
Sources: New York City mandatory reporting of cases by laboratories.
New York State Education Department, Information and Reporting Services. Basic educational data system. Albany, NY: New York State Education Department; 2012. Available at http://www.p12.nysed.gov/irs/beds.
Schick M. A census of Jewish day schools in the United States, 2008–2009. New York, NY: The Avi Chai Foundation; 2009. Available at http://avichai.org/ wp-content/uploads/2010/06/Census-of-JDS-in-the-US-2008-09-Final.pdf.
What is already known on this topic?
Cases of neonatal herpes simplex type 1 (HSV-1) infection following Jewish ritual circumcision with direct orogenital suctioning of the circumcision site have been reported in the United States, Canada, and Israel.
What is added by this report?
This report describes the largest series of cases (11) of neonatal herpes associated with Jewish ritual circumcision with direct orogenital suction, and is the first to estimate relative risk. During April 2006–December 2011, infant males who under-went circumcision with confirmed or probable direct orogenital suction had an estimated risk 3.4 times greater than the risk for HSV-1 or untyped HSV infection among male infants unlikely to have had direct orogenital suction.
What are the implications for public health practice?
Circumcision is a surgical procedure that can transmit infection if not performed under sterile conditions. Oral contact with an open wound in a neonate risks transmission of HSV and other pathogens. Professionals advising parents and parents choosing Jewish ritual circumcision should be aware of this risk, and direct orogenital suction should be avoided.

Morbidity and Mortality Weekly Report
408 MMWR / June 8, 2012 / Vol. 61 / No. 22
herpes in 2 years by chance alone. Although mohel A had no evidence of shedding HSV when tested, oral HSV shedding is intermittent and difficult to detect without repeated sam-pling (7). Third, the timing of symptom onset in all cases was consistent with acquisition during circumcision. Fourth, the location of herpes lesions on the neonates’ genitals and related dermatomes is unusual and suggests infection was introduced at the genitals. Finally, all nine typed cases were HSV-1, which usually is transmitted orally.
The findings in this report are subject to at least one limi-tation. Although this report is the first to quantify the risk associated with the practice of direct orogenital suction during Jewish ritual circumcision, the relative risk depends, in part, on assumptions used to estimate the number of male infants who undergo circumcision with direct orogenital suction, and those assumptions might not be valid. For example, because not all of the cases were in ultra-Orthodox Jewish families, estimates of the exposed population might be underestimated. However, if the exposed population was overestimated, the risk associated with the practice of direct orogenital suction might be greater than described in this report.
Age (days)
0 8 15 22 4229 36 49
Case
s
2
3
4
5
6
7
8
9
10
11
10
7
7
8
7
20
7
12
11
9
51
CircumcisionLesions
FIGURE. Number of days between Jewish ritual circumcision* and appearance of herpes lesions, among male infants with neonatal herpes following Jewish ritual circumcision with confirmed or probable orogenital suction — New York City, 2000–2011
* For some cases, date of circumcision was reported only as “eighth day of life,” which might differ from the age calculated by medical convention. Jewish law has various rules for scheduling circumcision; for example, circumcision might be delayed if an infant is ill.
Rabbinical authorities in some ultra-Orthodox Jewish communities maintain that direct orogenital suction is an integral part of ritual circumcision; other ultra-Orthodox authorities permit removal of blood by other means (e.g., a glass tube). Oral suction of an open wound poses an inherent risk for trans-mission of HSV-1 and other pathogens to a newborn infant and is not safe. Circumcision is a surgical procedure that involves cutting intact skin; sterile technique should be used to minimize infection risk.
Preventing the practice of direct orogenital suction is difficult, because ritual circumci-sion is a religious practice that usually occurs outside of health-care facilities. Continued efforts are needed to work with mohelim to adopt safe practices and educate parents regarding the risks for direct orogenital suc-tion. Before circumcision, mohelim should inform both parents whether they perform direct orogenital suction and explain the risk of herpes transmission, so that parents can choose not to have their newborn exposed. In 2004, the prevalence of HSV-1 infection was 73% in New York City adults aged ≥20 years (8). Given the high prevalence of HSV-1
infection in the general population and risk for asymptomatic shedding, mohelim should assume they are infected and at risk for transmitting HSV.
Physicians should counsel parents considering out-of-hospital Jewish ritual circumcision about the risks associated with direct orogenital suction and, when evaluating a recently circumcised male infant with herpes infection, inquire about direct orogenital suction. Because approximately 20% of neo-natal herpes patients do not have skin lesions (9), physicians should consider herpes infection when evaluating a newborn infant with fever following Jewish ritual circumcision. Even where neonatal HSV reporting is not mandated, physicians should notify local health departments about cases potentially associated with direct orogenital suction to prevent further cases. Local health departments should then notify the mohel who performed the procedure, so that he can voluntarily cease putting infants at risk. To protect infants’ health, public health departments might need to take legal measures to ensure mohelim associated with cases of neonatal herpes cease the practice of direct orogenital suction.

Morbidity and Mortality Weekly Report
MMWR / June 8, 2012 / Vol. 61 / No. 22 409
References 1. New York State Education Department, Information and Reporting
Services. Basic educational data system. Albany, NY: New York State Education Department; 2012. Available at http://www.p12.nysed.gov/irs/beds. Accessed June 4, 2012.
2. Schick M. A census of Jewish day schools in the United States, 2008–2009. New York, NY: The Avi Chai Foundation; 2009. Available at http://avichai.org/wp-content/uploads/2010/06/Census-of-JDS-in-the-US-2008-09-Final.pdf. Accessed June 4, 2012.
3. Gesundheit B, Grisaru-Soen G, Greenberg D, et al. Neonatal genital herpes simplex virus type 1 infection after Jewish ritual circumcision: modern medicine and religious tradition. Pediatrics 2004;114:259–63.
4. Distel R, Hofer V, Bogger-Goren S, Shalit I, Garty BZ. Primary genital herpes simplex infection associated with Jewish ritual circumcision. Isr Med Assoc J 2003;5:893–4.
5. Rubin L, Lanzkowsky P. Cutaneous neonatal herpes simplex infection associated with ritual circumcision. Pediatr Infect Dis 2000;19:266–8.
6. Brown ZA, Wald A, Morrow RA, Selke S, Zeh J, Corey L. Effect of serologic status and cesarean delivery on transmission rates of herpes simplex virus from mother to infant. JAMA 2003;289:203–9.
7. Miller C, Danaher R. Asymptomatic shedding of herpes simplex virus (HSV) in the oral cavity. Oral Surgery Oral Med Oral Pathol Oral Radiol Endod 2008;105:43–50.
8. New York City Department of Health and Mental Hygiene. New York City Health and Nutrition Examination Survey. New York, NY: New York City Department of Health and Mental Hygiene; 2004. Available at http://www.nyc.gov/html/doh/html/hanes/hanes.shtml. Accessed June 4, 2012.
9. Kimberlin DW. Neonatal herpes simplex infection. Clin Microbiol Rev 2004;17:1–13.

Morbidity and Mortality Weekly Report
410 MMWR / June 8, 2012 / Vol. 61 / No. 22
In the past few years, all large population health surveys that depend on telephone interviews, including the Behavioral Risk Factor Surveillance System (BRFSS), have had to adjust to the rapid rise in the proportion of U.S. households that have a cel-lular telephone but no landline telephone. To maintain survey coverage and validity, surveys have had to add cellular telephone households to their samples. In addition, telephone surveys have had to make adjustments in weighting to account for declining response rates by adopting new methods of weighting to adjust survey data for differences between the demographic characteristics of respondents and the target population. Since 2004, BRFSS has been planning and testing the addition of cellular telephone households and improvements in its methods of statistical weighting. These new methods were implemented during the fielding of the 2011 BRFSS, which is to be released in 2012. This policy note describes the methodologic changes and their potential effects on BRFSS prevalence estimates. Preliminary assessments indicate that the inclusion of cellular telephone respondents and the move to a new method of weighting might increase prevalence estimates for health risk behaviors and chronic disease in many states. Carefully planned communication to public health officials and nonscientific audiences of the effect of changes in methods on estimates is needed to prevent misinterpretation.
BRFSS, begun by CDC in 1984, is a coordinated collection of population health surveys conducted by the 50 states, the District of Columbia, and five U.S. territories. Taken together, these surveys make up the largest ongoing public health survey in the world; in 2010, the number of completed interviews was 430,000 (1). With technical and methodologic assistance from CDC, state health departments contract with telephone call centers to conduct the BRFSS surveys continuously through the year using a standardized core questionnaire and optional modules, plus additional state-added questions. The federal government, state governments, and many universities, private organizations, and researchers use BRFSS data to identify the frequency of health behaviors and conditions, track progress toward health objectives, evaluate the effects of disease preven-tion activities, and rapidly assess emerging health problems (e.g., novel influenza and influenza vaccination patterns) (2).
Adjustment and improvement of methods is a part of all public health surveillance systems, including surveys such as BRFSS. All surveys must adjust their methods from time to time to account for changes in population, behaviors, technolo-gies, and standards. In 2002, for example, the Substance Abuse
and Mental Health Services Administration (SAMHSA) was obliged to change methods for the National Survey on Drug Use and Health to match current survey standards. Users had to account for discontinuities caused by these new methods that were not related to changes in real prevalence (3).
In 2004, an expert panel of survey methodologists met at CDC to consider the challenges facing telephone surveys and the implications for BRFSS. The panel made two major recommendations: 1) address the growing effects of cellular telephone–only households on coverage provided by the sample, and 2) develop improved weighting, adjustment, and estimation methods that could reduce the potential for bias and maintain validity as response rates declined and cellular telephone interviews were incorporated. CDC set a goal of implementing these changes with the release of the 2011 BRFSS dataset (4).
The proportion of U.S. households using only cellular tele-phones is rising steadily (Figure 1). Estimates for the first half of 2011 indicate that 36.4% of U.S. households rely exclusively on cellular telephones (5). In 2006, in response to the grow-ing percentage of cellular telephone–only households and at the recommendation of the 2004 expert panel, CDC began testing changes in BRFSS survey methods to accommodate the addition of cellular telephones. In 2008, CDC funded a cellular telephone pilot study in 18 states, and by 2010, 48 states were conducting interviews of cellular telephone–only households as part of their regular data collection. These pilot studies allowed the states to test survey samples containing responses from landline telephone households and from cellular telephone–only households and helped them gain experience in administering and analyzing surveys containing cellular telephone interviews. CDC has provided each state with developmental datasets from 2008–2010 data, which include landline telephone responses with existing weighting methods, landline telephone responses with the new weight-ing methods, and combined landline and cellular telephone responses using the new weighting methods to allow the states to test the effects of the new methods on state-level estimates. The median proportion of all completed BRFSS interviews that are conducted by cellular telephone will be approximately 11% for the 2011 BRFSS dataset and approximately 20% for the 2012 dataset.
Since the 1980s, CDC has used a statistical method called “poststratification” to weight BRFSS survey data. Poststratification is a standard method for weighting survey
Methodologic Changes in the Behavioral Risk Factor Surveillance System in 2011 and Potential Effects on Prevalence Estimates

Morbidity and Mortality Weekly Report
MMWR / June 8, 2012 / Vol. 61 / No. 22 411
data (6) and is a relatively straightforward process of simultane-ously adjusting survey respondent data to known proportions of age (in categories), race/ethnicity, sex, geographic region, or other characteristics of a population taken from U.S. Census information. Poststratification is limited by access to informa-tion on each demographic characteristic for each of the regions or areas. For example, if researchers wish to weight information by county and proportions of weighting variables are unknown at the county level, poststratification is not an appropriate method of weighting.
In 2006, in accordance with the recommendations of the 2004 expert panel, CDC began testing “raking” (iterative proportional fitting), a more sophisticated weighting method. Raking, in contrast with the poststratification method, makes adjustments for each variable individually in a series of data processing–intensive iterations (7). As each variable in the weighting process is included, the weights are adjusted until the sample weights are representative of the population.
Raking presents several advantages over poststratification. Because raking does not require demographic information for small geographic areas, it allows for the introduction of more demographic variables suggested by the BRFSS expert panel (e.g., education level, marital status, and home ownership) into the statistical weighting process than would have been possible using poststratification, thereby reducing the poten-tial for bias and increasing the representativeness of estimates. Moreover, because state level demographic characteristics of cellular telephone–only households are not available, weight-ing with poststratification is not feasible. Raking, which does not rely on information on smaller geographic areas, allows for the incorporation of a crucial variable, telephone
ownership (households with landline or cellular telephones) in the weighting methodology of BRFSS. Beginning with the 2011 dataset, raking will succeed poststratification as the sole BRFSS statistical weighting method.
Evaluations conducted by CDC using 2010 and 2011 BRFSS data indicate that the addition of cellular telephone–only households will improve survey coverage for certain population groups. For example, the proportion of interviews conducted with respondents who have lower incomes, lower educational levels, or are in younger age groups will increase, because these groups more often exclusively rely on cellular telephones for personal communications. Inclusions of cellular telephone–only respondents thereby will increase coverage of portions of the population that are not included when only landline telephone interviews are conducted. Because these groups of respondents represent populations with higher numbers of risk factors, estimates of health risk behaviors likely will increase.
Adoption of the new methods also will result in BRFSS state-level prevalence estimates for 2011 and subsequent years that will vary from estimates that would have been achieved with previous weighting procedures (Figure 2). These discon-tinuities will vary by survey question and state, and they will be driven by state-to-state variations in demographic variables used for raking and the proportion of respondents who use cellular telephones. Assessments at CDC indicate that preva-lence estimates for some of the most salient indicators of poor health or negative health behaviors measured by BRFSS will increase in the majority of states. Certain of these increases will be caused by the adoption of raking as the new statistical
FIGURE 1. Estimated percentage of households that are cellular telephone–only, by period — National Center for Health Statistics, United States, 2008–2011
Source: Blumberg SJ, Luke JV. Wireless substitution: early release estimates from the National Health Interview Survey, January–June 2011. Available at http://www.cdc.gov/nchs/data/nhis/earlyrelease/wireless201112.pdf.
0
5
10
15
20
25
30
35
40
Jan−Jun
2008
Jul−Dec
2008
Jan−Jun
2009
Jul−Dec
2009
Jan−Jun
2010
Jul−Dec
2010
Jan−Jun
2011
Perc
enta
ge
Period
What is already known on this topic?
Public health telephone surveys, such as the Behavioral Risk Factor Surveillance System (BRFSS), must adjust to account for the increasing proportion of cellular telephone–only house-holds and declining response rates.
What is added by this report?
The 2011 BRFSS public use dataset, when released, will include modifications of weighting methods and modes of data collection. Raking weighting will be used, and cellular tele-phone surveys will be incorporated into the data. These changes likely will affect state-level estimates of health risk behaviors and chronic disease.
What are the implications for public health practice?
Public health officials should be aware of the changes in weighting and modes of data collection by BRFSS and under-stand that trend analyses might show artifactual differences between 2011 data and data from previous years. Proactive communications with the nonscientific community likely will help mitigate misinterpretations of changes in prevalence estimates.

Morbidity and Mortality Weekly Report
412 MMWR / June 8, 2012 / Vol. 61 / No. 22
weighting method, and others will be caused by the addition of cellular telephone households. Differences resulting from weighting can be seen by comparison of poststratification and raking using landline-only data (Figure 2). The effect of cellular telephone inclusion is then seen by comparison of landline data with combined landline and cellular telephone data after rak-ing. The use of raking also might change state-level estimates for chronic disease indicators (i.e., asthma, stroke, coronary heart disease, and diabetes), for the prevalence of self-reported “fair” or “poor” health, and for no physical activity, obesity, heavy drinking, and smoking.
Although, raking might cause state prevalence trends for cer-tain risk factors to shift upward, in general, the shape of trend lines over time might not be affected. For example, in a particular state where the adoption of raking causes an absolute increase in the trend line for a particular prevalence estimate, the shape and slope of the line could remain stable. Data presented here cannot be used as national estimates because they do not include all states and do include data from U.S. territories.
One risk factor, current smoking, serves as an example of how estimates might shift in certain states. Preliminary analysis by CDC using developmental datasets for 2007–2010 reveals that adoption of raking shifts the aggregated trend line for current smoking upward by approximately 2.3–2.8 percent-age points for the years 2007–2010, but the shape and slope
of the trend line does not change materially (Figure 3). The addition of cellular telephone households to the aggregated state samples for 2009 and 2010 shifts the absolute estimates slightly further upward.
State and federal public health officials have expressed concern that trend line shifts in BRFSS prevalence estimates resulting from these changes in methods might be misinterpreted by the public, policy makers or legislators as real changes in the health behaviors of states’ populations. This, in turn, could have adverse ramifications for public health funding and other support. The risk for misinterpretation can be reduced by a careful assessment of the changes in BRFSS health indicators in each state, and establishment of a proactive communication plan to explain the causes of discontinuities to public health officials, policy makers, legislators, and other nonscientific audiences. Each state has a BRFSS coordinator who can assist the state with analyses needed to guide responses to the changes and formulate an appropriate communications plan. CDC is working with the coordinators and other state public health personnel to provide additional materials that will help with these plans. Interpretation of changes in prevalence from one year to the next is a difficult task, especially in years where meth-ods are adjusted. Communication plans should emphasize that 1) shifts in prevalence estimates for 2011 might not represent trends in risk factor prevalence in the population but instead
FIGURE 2. Prevalence estimates of behaviors and conditions, by weighting method and telephone sample — Behavioral Risk Factor Surveillance System (BRFSS), United States,* 2010
* Data are inclusive of all states and territories in BRFSS, except Tennessee and South Dakota, which lacked sufficient numbers of cellular telephone interviews in 2010.
0
5
10
15
20
25
30
Asthma Stroke Heart attack
Coronary heart
diseases
Diabetes
Behavior/Condition
Fair/Poor health
Nophysicalactivity
Obesity Heavydrinking
Currentsmoker
Healthinsurance
Prev
alen
ce e
stim
ate
(%)
Landline telephone only (poststrati�ed) Landline telephone only (raking) Landline and cellular telephone (raking)

Morbidity and Mortality Weekly Report
MMWR / June 8, 2012 / Vol. 61 / No. 22 413
merely reflect improved methods of measuring risk factors, 2) occasional improvements in methods, with accompanying effects on results, have been a necessary part of all public health surveillance systems, including population surveys, and 3) the changes in BRFSS methods are especially important to keep up with changes in telephone use in the U.S. population and to take advantage of improved statistical procedures.
Reported by
Carol Pierannunzi, PhD, Machell Town, MS, William Garvin, Frederick E. Shaw, MD, JD, Lina Balluz, ScD, Div of Behavioral Surveillance, Office of Surveillance, Epidemiology, and Laboratory Svcs, CDC. Corresponding contributor: Carol Pierannunzi, [email protected], 404-498-0501.
Acknowledgments
Office on Smoking and Health, National Center for Chronic Disease Prevention and Health Promotion, CDC.
References 1. CDC. Behavioral Risk Factor Surveillance System: 2010 survey data.
Atlanta, GA: US Department of Health and Human Services, CDC; 2011. Available at http://www.cdc.gov/brfss/technical_infodata/surveydata/2010.htm. Accessed January 6, 2012.
2. CDC. Interim results: state specific influenza vaccination coverage—United States, August 2010–February 2011. MMWR 2011;60:737–43.
3. Kennet J, Gfroerer J, eds. Evaluating and improving methods used in the National Survey on Drug Use and Health. Rockville, MD: US Department of Health and Human Services, Substance Abuse and Mental Health Services Administration, Office of Applied Studies; 2005. Available at http://www.samhsa.gov/data/nsduh/methods.pdf. Accessed May 31, 2012.
4. Hu SS, Pierannunzi C, Balluz L. Integrating a multimode design into a national random-digit–dialed telephone survey. Prev Chronic Dis 2011; 8:A145.
5. Blumberg SJ, Luke JV. Wireless substitution: early release estimates from the National Health Interview Survey, January–June 2011. Atlanta, GA: US Department of Health and Human Services, CDC; 2011. Available at http://www.cdc.gov/nchs/data/nhis/earlyrelease/wireless201112.pdf. Accessed December 20, 2011.
6. Groves R. Survey errors and survey costs. New York, NY: John Wiley & Sons; 1989.
7. Battaglia MP, Frankel MR, Link MW. Improving standard poststratification techniques for random-digit–dialing telephone surveys. Survey Research Methods 2008;2:11–9.
FIGURE 3. Weighted prevalence estimates for current smokers, by year, weighting method, and telephone source — Behavioral Risk Factor Surveillance System (BRFSS), United States,* 2000–2010
* Data are inclusive of all states and territories in BRFSS, except Tennessee and South Dakota, which lacked sufficient numbers of cellular telephone interviews in 2010.
0
5
10
15
20
25
30
2000 2001 2002 2003 2004 2005 2006 2007 2008 2009 2010
Prev
alen
ce e
stim
ate
(%)
Year
Landline telephone only (poststrati�cation)Landline and cellular telephone (raking)Landline telephone only (raking)

Morbidity and Mortality Weekly Report
414 MMWR / June 8, 2012 / Vol. 61 / No. 22
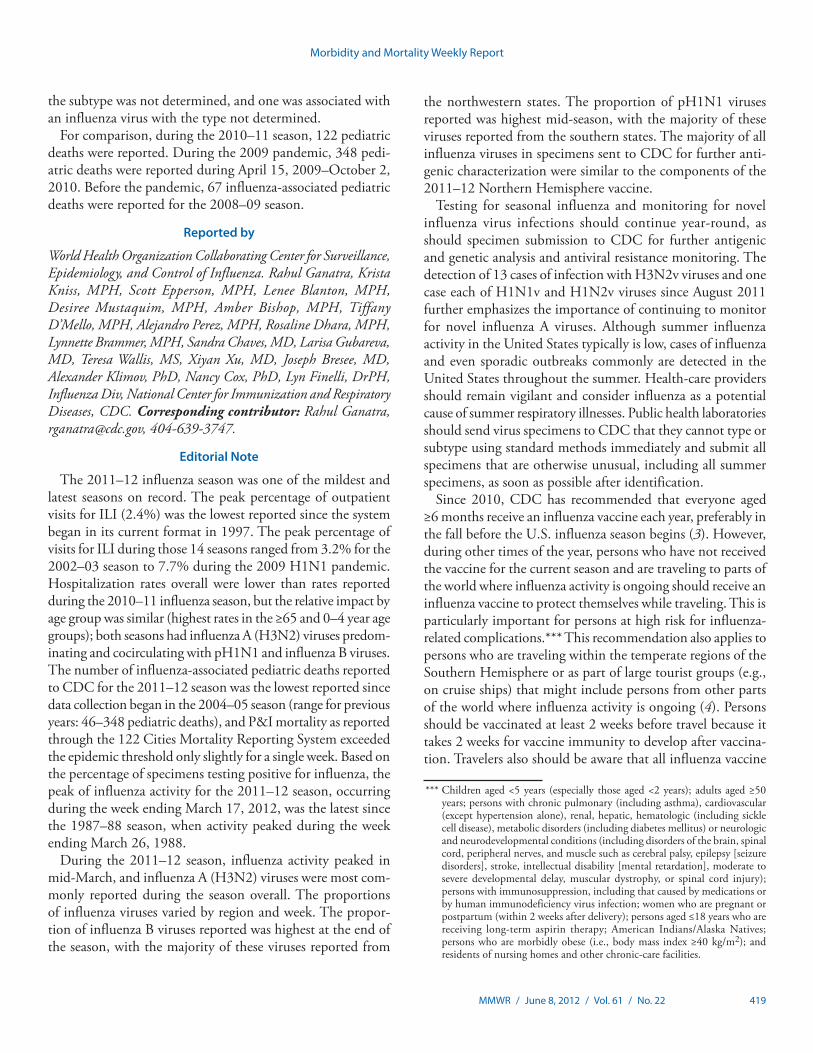
During the 2011–12 influenza season in the United States, influenza activity* occurred at low levels during October through December and increased in January and February before peaking in mid-March. Influenza A (H3N2) viruses pre-dominated overall, but influenza A (H1N1)pdm09 (pH1N1) and influenza B viruses also circulated widely. This influenza season was mild compared with recent years, with a lower percentage of outpatient visits for influenza-like illness (ILI),† lower rates of hospitalizations, and fewer deaths attributed to pneumonia and influenza. This report summarizes influenza activity in the United States during the 2011–12 influenza season (October 2, 2011–May 19, 2012) and reports the rec-ommendations for the components of the 2012–13 Northern Hemisphere influenza vaccine.
Viral Surveillance During October 2, 2011–May 19, 2012, World Health
Organization (WHO) and National Respiratory and Enteric Virus Surveillance System (NREVSS) collaborating labo-ratories in the United States tested 169,453 specimens for influenza viruses; 22,417 (13%) were positive (Figure 1). Of the positive specimens, 19,285 (86%) were influenza A viruses, and 3,132 (14%) were influenza B viruses. Among the influenza A viruses, 14,968 (78%) were subtyped; 11,002 (74%) were influenza A (H3N2) viruses, and 3,966 (26%) were pH1N1 viruses.
The proportion of specimens testing positive for influenza during the 2011–12 season first exceeded 10% (indicating higher levels of viral circulation) during the week ending February 4, 2012, and peaked at 32% during the week ending March 17, 2012.
Although influenza A (H3N2) viruses predominated, pH1N1 and influenza B viruses also circulated widely, and the relative proportion of each type and subtype varied by geographic region and week. From October through December 2011, fewer than 5% of specimens tested for influenza were positive. Of those that
were positive, 81% were influenza A and 19% were influenza B viruses. As activity increased in January 2012, the proportion of influenza A viruses increased, accounting for 88%–95% of viruses reported each week from January 1 to March 17. Although pH1N1 viruses accounted for only 4% of influenza A viruses reported from October through December, that propor-tion increased to 22% from January through mid-March. The largest number of both influenza A (H3N2) and pH1N1 viruses were reported for the week ending March 17. As influenza A activity declined, the number of influenza B viruses increased, with the largest number of influenza B viruses reported for the week ending April 21.
Regional§ differences were observed in the timing of influ-enza activity and the relative proportions of circulating viruses. Using the percentage of specimens testing positive for influenza to determine the peak of influenza activity, activity peaked in regions 2, 3, 4, 5, 6, 7, 8, and 9 during March 4–24 (weeks 10–12), but peak activity was not observed in regions 1 and 10 until the weeks ending April 21 (week 16) and March 31 (week 13), respectively. The highest proportion of influenza B viruses was observed in region 10 (40%). The proportion of influenza B viruses in the other regions ranged from 3% in regions 7 and 8 to 21% in region 2. Among influenza A viruses, regions 5 and 7 were strongly influenza A (H3N2) predominant, with A (H3N2) accounting for 93% and 90%, respectively, of subtyped influenza A viruses. In contrast, pH1N1 viruses accounted for 42% of subtyped influenza A viruses in region 2, 60% in region 6, and 41% in region 8.
Novel Influenza A Viruses Thirteen cases of human infection with a novel swine-origin
influenza A (H3N2) variant (H3N2v) virus have been reported since August 2011 (1). These H3N2v viruses had the M gene from the pH1N1 virus. The thirteen cases were identified in six states: Indiana (two cases), Iowa (three), Maine (two),
Update: Influenza Activity — United States, 2011–12 Season and Composition of the 2012–13 Influenza Vaccine
* The CDC influenza surveillance system collects five categories of information from eight data sources: 1) viral surveillance (World Health Organization collaborating laboratories, the National Respiratory and Enteric Virus Surveillance System, and novel influenza A virus case reporting); 2) outpatient illness surveillance (U.S. Outpatient Influenza-Like Illness Surveillance Network); 3) mortality (122 Cities Mortality Reporting System, and influenza-associated pediatric mortality reports); 4) hospitalizations (FluSurv-NET which includes the Emerging Infections Program and surveillance in four additional states); and 5) summary of geographic spread of influenza (state and territorial epidemiologist reports).
† Defined as a temperature of ≥100.0°F (≥37.8°C), oral or equivalent, and cough or sore throat, in the absence of a known cause other than influenza.
§ The 10 U.S. Department of Health and Human Services regions include the following states and territories: Region 1: Connecticut, Maine, Massachusetts, New Hampshire, Rhode Island, and Vermont; Region 2: New Jersey, New York, Puerto Rico, and the U.S. Virgin Islands; Region 3: Delaware, District of Columbia, Maryland, Pennsylvania, Virginia, and West Virginia; Region 4: Alabama, Florida, Georgia, Kentucky, Mississippi, North Carolina, South Carolina, and Tennessee; Region 5: Illinois, Indiana, Michigan, Minnesota, Ohio, and Wisconsin; Region 6: Arkansas, Louisiana, New Mexico, Oklahoma, and Texas; Region 7: Iowa, Kansas, Missouri, and Nebraska; Region 8: Colorado, Montana, North Dakota, South Dakota, Utah, and Wyoming; Region 9: Arizona, California, Hawaii, Nevada, American Samoa, Commonwealth of the Northern Mariana Islands, Federated States of Micronesia, Guam, Marshall Islands, and Republic of Palau; Region 10: Alaska, Idaho, Oregon, and Washington.

Morbidity and Mortality Weekly Report
MMWR / June 8, 2012 / Vol. 61 / No. 22 415
Pennsylvania (three), Utah (one), and West Virginia (two). One of the 13 cases occurred in an adult, and 12 occurred in children. Three cases resulted in hospitalization; all three patients have recovered fully from their illness. Six of the 13 cases were in persons who reported no recent exposure to swine. In addition, two other novel viruses were identified during the 2011–12 season: one case of influenza A (H1N2) variant (H1N2v) was identified in Minnesota, and one case of influ-enza A (H1N1) variant (H1N1v) was identified in Wisconsin. One case was in a person who reported close contact with swine preceding symptom onset; both patients are fully recovered.
Antigenic Characterization Since October 1, 2011, CDC has antigenically characterized
1,887 influenza viruses submitted by U.S. laboratories includ-ing 527 pH1N1 viruses, 1,058 influenza A (H3N2) viruses, and 302 influenza B viruses. Of the 527 pH1N1 viruses tested, 503 (95%) were characterized as A/California/7/2009-like, the pH1N1 component of the 2011–12 influenza vaccine. Twenty-four viruses (5%) of the 527 tested showed reduced titers with antiserum produced against A/California/7/2009. Of the 1,058
influenza A (H3N2) viruses, 864 (82%) were characterized as A/Perth/16/2009-like, the influenza A (H3N2) component of the 2011–12 influenza vaccine for the Northern Hemisphere. A total of 194 (18%) of the 1,058 tested showed reduced titers with antiserum produced against A/Perth/16/2009.
Of the 302 influenza B viruses tested, 147 (49%) belonged to the B/Victoria lineage, and 139 (95%) of these were charac-terized as B/Brisbane/60/2008-like, the influenza B component for the 2011–12 Northern Hemisphere influenza vaccine. Eight (5%) of the 147 viruses belonging to the B/Victoria lineage showed reduced titers with antisera produced against B/Brisbane/60/2008. A total of 155 (51%) viruses tested belonged to the B/Yamagata lineage.
Resistance to Antiviral Medications Since October 1, 2011, a total of 2,756 influenza virus
specimens have been tested for antiviral resistance. All 317 influenza B viruses tested were sensitive to both oseltamivir and zanamivir. Among 1,275 influenza A (H3N2) viruses tested, no resistance to oseltamivir or zanamivir was detected. Among the 1,164 pH1N1 viruses tested for resistance to oseltamivir,
FIGURE 1. Number and percentage of respiratory specimens testing positive for influenza reported to CDC, by type, surveillance week, and year — World Health Organization and National Respiratory and Enteric Virus Surveillance System collaborating laboratories, United States, October 2, 2011–May 19, 2012
0
10
20
30
40
50
0
500
1,000
1,500
2,000
2,500
3,000
% positive
No.
of p
osit
ive
spec
imen
s
Surveillance week and year
2011 2012
40 42 44 46 48 50 52 2 4 6 8 10 12 14 16 18 20
A (H1N1)pdm09A (H3)A (subtyping not performed)B% positive

Morbidity and Mortality Weekly Report
416 MMWR / June 8, 2012 / Vol. 61 / No. 22
16 (1.4%) were found to be resistant, and of the 518 viruses tested for resistance to zanamivir, all were found to be sensitive.
High levels of resistance to the adamantanes (amantadine and rimantadine) persist among pH1N1 and influenza A (H3N2) viruses currently circulating globally.
Composition of the 2012–13 Influenza Vaccine The Food and Drug Administration’s Vaccines and Related
Biological Products Advisory Committee recommended that the 2012–13 trivalent influenza vaccine for the United States contain A/California/7/2009-like (pH1N1), A/Victoria/361/2011-like (H3N2), and B/Wisconsin/1/2010-like (B/Yamagata lineage). This represents a change in the influenza A (H3N2) and influ-enza B components from the 2011–12 Northern Hemisphere influenza vaccine formulation. This recommendation was based on global influenza virus surveillance data related to epidemiology and antigenic characteristics, serologic responses to 2011–12 trivalent seasonal vaccines, and the availability of candidate strains and reagents.
U.S. Outpatient Illness Surveillance Nationally, the weekly percentage of outpatient visits for ILI
to health-care providers participating in the U.S. Outpatient Influenza-Like Illness Surveillance Network (ILINet) met, but did not exceed, the national baseline level¶ of 2.4% for 1 week (the week ending March 17, 2012) during the 2011–12 influ-enza season (Figure 2). This was the only season since ILINet began operating in its current configuration (i.e., since the 1997–98 season) that the percentage of outpatient visits for ILI did not exceed the baseline. For comparison, during the 2008–09 influenza season (the season preceding the 2009 pandemic), the peak percentage of outpatient visits for ILI was 3.6% and occurred in mid-February; during the 2009 pandemic, the peak percentage of outpatient visits for ILI was 7.7% and occurred in late October (2). The peak percentage of outpatient visits for ILI during the most recent influenza season (2010–11) was 4.5% and occurred in early February. During the 2011–12 season, on a regional level, the percentage of visits for ILI failed to meet or exceed region-specific baselines in regions 1, 2, 3, 6, and 9. The percentage of outpatient visits for ILI met or exceeded its baseline levels for a single week in regions 4 and 8, for 3 weeks in region 10, 6 weeks in region 5, and 7 weeks in region 7. ILINet data are used to produce a weekly state-level measure
of ILI activity** varying from minimal to high: the number of states experiencing high ILI activity peaked during the week ending March 17 (week 11) with four states.
U.S. State-Specific Activity Levels State and territorial epidemiologists report the geographic
distribution of influenza in their states through a weekly influ-enza activity code.†† The geographic distribution of influenza activity was most extensive during the week ending March 17, 2012 (week 11), when 20 states reported widespread influenza activity and 20 states reported regional influenza activity. During the week ending May 19, one state was still reporting widespread influenza activity. The number of states reporting widespread or regional activity during the peak week of activ-ity has ranged from 49 to 50 states during the previous three influenza seasons (CDC, unpublished data, 2012).
U.S. Influenza-Associated Hospitalization CDC monitors hospitalizations associated with laboratory-
confirmed influenza infections using the FluSurv-NET§§
¶ The national and regional baselines are the mean percentage of visits for ILI during noninfluenza weeks for the previous three seasons plus two standard deviations. A noninfluenza week is a week during which fewer than 10% of specimens tested positive for influenza. National and regional percentages of patient visits for ILI are weighted on the basis of state population. Use of the national baseline for regional data is not appropriate.
** Activity levels are based on the percentage of outpatient visits in a state attributed to ILI and are compared with the average percentage of ILI visits that occur during weeks with little or no influenza virus circulation. Activity levels range from minimal, which would correspond to ILI activity from outpatient clinics being at or below the average, to high, which would correspond to ILI activity from outpatient clinics being much higher than the average. Because the clinical definition of ILI is nonspecific, not all ILI is caused by influenza; however, when combined with laboratory data, the information on ILI activity provides a useful picture of influenza activity in the United States.
†† Levels of activity are 1) no activity; 2) sporadic: isolated laboratory-confirmed influenza cases or a laboratory-confirmed outbreak in one institution, with no increase in activity; 3) local: increased ILI, or at least two institutional outbreaks (ILI or laboratory-confirmed influenza) in one region of the state, with recent laboratory evidence of influenza in that region, with virus activity no greater than sporadic in other regions; 4) regional: increased ILI activity or institutional outbreaks (ILI or laboratory-confirmed influenza) in at least two but less than half of the regions in the state with recent laboratory evidence of influenza in those regions; and 5) widespread: increased ILI activity or institutional outbreaks (ILI or laboratory-confirmed influenza) in at least half the regions in the state, with recent laboratory evidence of influenza in the state.
§§ FluSurv-NET conducts population-based surveillance for laboratory-confirmed influenza-related hospitalizations in children aged <18 years (since the 2003–04 influenza season) and adults aged ≥18 years (since the 2005–06 influenza season). The FluSurv-NET covers approximately 80 counties in the 10 Emerging Infections Program states (California, Colorado, Connecticut, Georgia, Maryland, Minnesota, New Mexico, New York, Oregon, and Tennessee) and additional Influenza Hospitalization Surveillance Project (IHSP) states. IHSP began during the 2009–10 season to enhance surveillance during the 2009 H1N1 pandemic. IHSP sites included Iowa, Idaho, Michigan, Oklahoma, and South Dakota during 2009–10 season; Idaho, Michigan, Ohio, Oklahoma, Rhode Island, and Utah during the 2010–11 season; and Michigan, Ohio, Rhode Island, and Utah during the 2011–12 season. Incidence rates are calculated using National Center for Health Statistics population estimates for the counties included in the surveillance catchment area. Laboratory confirmation is dependent on clinician-ordered influenza testing, and testing for influenza often is underutilized because of the poor reliability of rapid test results and greater reliance on clinical diagnosis for influenza. As a consequence, cases identified as part of influenza hospitalization surveillance likely are an underestimation of the true number of persons hospitalized with influenza.

Morbidity and Mortality Weekly Report
MMWR / June 8, 2012 / Vol. 61 / No. 22 417
surveillance system. Cumulative hospitalization rates (per 100,000 population) were calculated by age group based on 2,356 total hospitalizations during October 2, 2011–April 28, 2012, of which 274 occurred among persons aged 0–4 years, 195 among persons aged 5–17 years, 526 among persons aged 18–49 years, 423 among persons aged 50–64 years, and 938 among persons aged ≥65 years. The cumulative hospitaliza-tion rate (per 100,000 population) for this period was 14.2 among children aged 0–4 years, 4.2 among children aged 5–17 years, 4.1 among adults aged 18–49 years, 8.5 among adults aged 50–64 years, and 30.4 among adults aged ≥65 years. The cumulative incidence for all age groups since October 2, 2011, was 8.6 per 100,000 (Figure 3). During the past three influenza seasons, age-specific hospitalization rates have ranged from 35.5 to 72.8 per 100,000 population for ages 0–4 years, 6.4 to 27.3 for ages 5–17 years, 3.6 to 23.1 for ages 18–49 years, 5.1 to 30.8 for ages 50–64 years, and 13.5 to 65.9 for ages ≥65 years.
As of May 19, 2012, among the 1,237 (66%) of 1,887 FluSurv-NET adult patients for whom medical chart data were available for analysis, the most frequent underlying conditions were chronic lung disease (42%), cardiovascular disease (37%),
and metabolic disorders (34%). Five percent of adult patients hospitalized with influenza were pregnant. Among 333 chil-dren hospitalized with laboratory-confirmed influenza, 47% did not have any known underlying conditions, and 19% had underlying asthma or reactive airway disease.
U.S. Pneumonia- and Influenza-Related Mortality During the 2011–12 influenza season, the percentage of
deaths attributed to pneumonia and influenza (P&I) exceeded the epidemic threshold¶¶ for 1 week, during the week ending January 21, 2012 (week 3) and peaked at 7.9% (Figure 4). From the 2008–09 season through the 2010–11 season, the peak percentage of P&I deaths ranged from 7.9% to 9.1%, and the total number of consecutive weeks at or above the epidemic threshold ranged from 3 to 13 (CDC, unpublished data, 2012).
¶¶ The seasonal baseline proportion of P&I deaths is projected using a robust regression procedure in which a periodic regression model is applied to the observed percentage of deaths from P&I that were reported by the 122 Cities Mortality Reporting System during the preceding 5 years. The epidemic threshold is set at 1.645 standard deviations above the seasonal baseline.
FIGURE 2. Percentage of visits for influenza-like illness (ILI) reported to CDC, by surveillance week and year — U.S. Outpatient Influenza-Like Illness Surveillance Network, United States, September 28, 2008–May 19, 2012
* The national baseline is the mean percentage of visits for ILI during noninfluenza weeks for the previous three seasons plus two standard deviations. A noninfluenza week is a week during which <10% of specimens tested positive for influenza. Use of the national baseline for regional data is not appropriate.
0
1
2
3
4
5
6
7
8
% o
f vis
its fo
r ILI
Surveillance week and year
% ILI
National baseline*
40
2008 2009 2010
5040 50 10 20 30 40 50 10 20 30 40 50 10 10
2011 2012
20 2030

Morbidity and Mortality Weekly Report
418 MMWR / June 8, 2012 / Vol. 61 / No. 22
U.S. Influenza-Related Pediatric Mortality
For the 2011–12 influenza season, 26 laboratory-confirmed influenza-associated pediatric deaths were reported. These deaths were reported from 15 states: Arkansas (one case), Arizona (one), California (six), Florida (two), Hawaii (one), Missouri (one), North Carolina (two), New Jersey (one), Nevada (three), New York (one), Oklahoma (one), Texas (three), Virginia (one), Washington (one), and Wisconsin (one). Their mean and median ages were 7.3 and 6.5 years, respec-tively; three children were aged <6 months, six were aged 2–4 years, 12 were aged 5–11 years, and five were aged 12–17 years. Six of the 26 deaths reported were associated with influenza B viruses, five deaths were associated with influenza A (H3) viruses, seven were associated with pH1N1 viruses, seven were associated with an influenza A virus for which
0
4
8
12
16
20
24
28
32
36
40
40 42 44 46 48 50 52 2 4 6 8 10 12 14 16
Rate
s pe
r 100
,000
pop
ulat
ion
Surveillance week and year2011 2012
0–4 yrs5–17 yrs18–49 yrs50–64 yrs≥65 yrsOverall
* FluSurv-NET conducts population-based surveillance for laboratory-confirmed influenza related hospitalizations in children aged <18 years (since the 2003–04 influenza season) and adults aged ≥18 years (since the 2005–06 influenza season). The FluSurv-NET covers approximately 80 counties in the 10 Emerging Infections Program states (California, Colorado, Connecticut, Georgia, Maryland, Minnesota, New Mexico, New York, Oregon, and Tennessee) and additional Influenza Hospitalization Surveillance Project states.
FIGURE 3. Rates of hospitalization for laboratory-confirmed influenza, by age group, surveillance week, and year — FluSurv-NET* surveillance system, United States, October 2, 2011–April 28, 2012
FIGURE 4. Percentage of all deaths attributable to pneumonia and influenza (P&I), by surveillance week and year — 122 Cities Mortality Reporting System, United States, 2007–May 19, 2012
* The epidemic threshold is 1.645 standard deviations above the seasonal baseline. † The seasonal baseline is projected using a robust regression procedure that applies a periodic regression model to the observed percentage of deaths from P&I
during the preceding 5 years.
4
6
8
5
7
9
10
% o
f all
deat
hs a
ttrib
uted
to P
&I
Surveillance week and year
2007 2008 2009 20112010 2012
40 50 10 20 30 40 50 10 20 30 40 50 10 20 30 40 50 10 20 2030 40 50 10
Epidemic threshold*
Seasonal baseline†
Morbidity and Mortality Weekly Report
MMWR / June 8, 2012 / Vol. 61 / No. 22 419
the subtype was not determined, and one was associated with an influenza virus with the type not determined.
For comparison, during the 2010–11 season, 122 pediatric deaths were reported. During the 2009 pandemic, 348 pedi-atric deaths were reported during April 15, 2009–October 2, 2010. Before the pandemic, 67 influenza-associated pediatric deaths were reported for the 2008–09 season.
Reported by
World Health Organization Collaborating Center for Surveillance, Epidemiology, and Control of Influenza. Rahul Ganatra, Krista Kniss, MPH, Scott Epperson, MPH, Lenee Blanton, MPH, Desiree Mustaquim, MPH, Amber Bishop, MPH, Tiffany D’Mello, MPH, Alejandro Perez, MPH, Rosaline Dhara, MPH, Lynnette Brammer, MPH, Sandra Chaves, MD, Larisa Gubareva, MD, Teresa Wallis, MS, Xiyan Xu, MD, Joseph Bresee, MD, Alexander Klimov, PhD, Nancy Cox, PhD, Lyn Finelli, DrPH, Influenza Div, National Center for Immunization and Respiratory Diseases, CDC. Corresponding contributor: Rahul Ganatra, [email protected], 404-639-3747.
Editorial Note
The 2011–12 influenza season was one of the mildest and latest seasons on record. The peak percentage of outpatient visits for ILI (2.4%) was the lowest reported since the system began in its current format in 1997. The peak percentage of visits for ILI during those 14 seasons ranged from 3.2% for the 2002–03 season to 7.7% during the 2009 H1N1 pandemic. Hospitalization rates overall were lower than rates reported during the 2010–11 influenza season, but the relative impact by age group was similar (highest rates in the ≥65 and 0–4 year age groups); both seasons had influenza A (H3N2) viruses predom-inating and cocirculating with pH1N1 and influenza B viruses. The number of influenza-associated pediatric deaths reported to CDC for the 2011–12 season was the lowest reported since data collection began in the 2004–05 season (range for previous years: 46–348 pediatric deaths), and P&I mortality as reported through the 122 Cities Mortality Reporting System exceeded the epidemic threshold only slightly for a single week. Based on the percentage of specimens testing positive for influenza, the peak of influenza activity for the 2011–12 season, occurring during the week ending March 17, 2012, was the latest since the 1987–88 season, when activity peaked during the week ending March 26, 1988.
During the 2011–12 season, influenza activity peaked in mid-March, and influenza A (H3N2) viruses were most com-monly reported during the season overall. The proportions of influenza viruses varied by region and week. The propor-tion of influenza B viruses reported was highest at the end of the season, with the majority of these viruses reported from
the northwestern states. The proportion of pH1N1 viruses reported was highest mid-season, with the majority of these viruses reported from the southern states. The majority of all influenza viruses in specimens sent to CDC for further anti-genic characterization were similar to the components of the 2011–12 Northern Hemisphere vaccine.
Testing for seasonal influenza and monitoring for novel influenza virus infections should continue year-round, as should specimen submission to CDC for further antigenic and genetic analysis and antiviral resistance monitoring. The detection of 13 cases of infection with H3N2v viruses and one case each of H1N1v and H1N2v viruses since August 2011 further emphasizes the importance of continuing to monitor for novel influenza A viruses. Although summer influenza activity in the United States typically is low, cases of influenza and even sporadic outbreaks commonly are detected in the United States throughout the summer. Health-care providers should remain vigilant and consider influenza as a potential cause of summer respiratory illnesses. Public health laboratories should send virus specimens to CDC that they cannot type or subtype using standard methods immediately and submit all specimens that are otherwise unusual, including all summer specimens, as soon as possible after identification.
Since 2010, CDC has recommended that everyone aged ≥6 months receive an influenza vaccine each year, preferably in the fall before the U.S. influenza season begins (3). However, during other times of the year, persons who have not received the vaccine for the current season and are traveling to parts of the world where influenza activity is ongoing should receive an influenza vaccine to protect themselves while traveling. This is particularly important for persons at high risk for influenza-related complications.*** This recommendation also applies to persons who are traveling within the temperate regions of the Southern Hemisphere or as part of large tourist groups (e.g., on cruise ships) that might include persons from other parts of the world where influenza activity is ongoing (4). Persons should be vaccinated at least 2 weeks before travel because it takes 2 weeks for vaccine immunity to develop after vaccina-tion. Travelers also should be aware that all influenza vaccine
*** Children aged <5 years (especially those aged <2 years); adults aged ≥50 years; persons with chronic pulmonary (including asthma), cardiovascular (except hypertension alone), renal, hepatic, hematologic (including sickle cell disease), metabolic disorders (including diabetes mellitus) or neurologic and neurodevelopmental conditions (including disorders of the brain, spinal cord, peripheral nerves, and muscle such as cerebral palsy, epilepsy [seizure disorders], stroke, intellectual disability [mental retardation], moderate to severe developmental delay, muscular dystrophy, or spinal cord injury); persons with immunosuppression, including that caused by medications or by human immunodeficiency virus infection; women who are pregnant or postpartum (within 2 weeks after delivery); persons aged ≤18 years who are receiving long-term aspirin therapy; American Indians/Alaska Natives; persons who are morbidly obese (i.e., body mass index ≥40 kg/m2); and residents of nursing homes and other chronic-care facilities.

Morbidity and Mortality Weekly Report
420 MMWR / June 8, 2012 / Vol. 61 / No. 22
manufactured for the 2011–12 season expires by June 30, 2012, after which influenza vaccines will not be available in the United States until the 2012–13 vaccine is available in the fall.
As a supplement to influenza vaccination, antiviral drugs are an important adjunct to reduce the impact of influenza. Based on recommendations of the Advisory Committee on Immunization Practices, antiviral treatment is recommended as soon as possible for patients with confirmed or suspected influenza who have severe, complicated, or progressive illness; who require hospitalization; or who are at higher risk for
influenza-related complications (5). Antiviral treatment also may be considered for outpatients with confirmed or suspected influenza who do not have known risk factors for severe illness if treatment can be initiated within 48 hours of illness onset. Recommended antiviral medications include oseltamivir and zanamivir. Recent viral surveillance and resistance data indicate that the majority of currently circulating influenza viruses are sensitive to these medications. Amantadine and rimantadine should not be used because of sustained high levels of resistance to these drugs among circulating influenza A viruses.
Acknowledgments
Participating state and territorial health departments and state public health laboratories. U.S. World Health Organization collaborating laboratories. National Respiratory and Enteric Virus Surveillance System collaborating laboratories. U.S. Outpatient ILI Surveillance Network. FluSurv-NET. Influenza Associated Pediatric Mortality Surveillance System. 122 Cities Mortality Reporting System.
References 1. CDC. Update: influenza A (H3N2)v transmission and guidelines—five
states, 2011. MMWR 2012;60:1741–4. 2. Brammer L, Blanton L, Epperson S, et al. Surveillance for influenza during
the 2009 influenza A (H1N1) pandemic—United States, April 2009–March 2010. Clin Infect Dis 2011;52(Suppl 1):S27–35.
3. CDC. Prevention and control of influenza with vaccines: recommendations of the Advisory Committee on Immunization Practices (ACIP). MMWR 2010;59(No. RR-8).
4. CDC. Influenza prevention: information for travelers. Atlanta, GA: US Department of Health and Human Services, CDC; 2011. Available at http://www.cdc.gov/flu/travelers/travelersfacts.htm. Accessed May 31, 2012.
5. CDC. Antiviral agents for the treatment and chemoprophylaxis of influenza: recommendations of the Advisory Committee on Immunization Practices (ACIP). MMWR 2011;60(No. RR-1).
What is already known on this topic?
CDC collects, compiles, and analyzes data on influenza activity year-round in the United States. The influenza season generally begins in the fall and continues through the winter and spring months; however, the timing and severity of influenza activity varies by geographic location and season.
What is added by this report?
During the 2011–12 influenza season, influenza A (H3N2), influenza A (H1N1)pdm09, and influenza B viruses cocirculated. In addition, 15 cases of infection with novel influenza A viruses were reported. Compared with recent influenza seasons, this season had a lower percentage of outpatient visits for influenza-like illness, lower rates of hospitalizations, and fewer deaths attributed to pneumonia and influenza.
What are the implications for public health practice?
All unvaccinated persons aged ≥6 months should be offered influenza vaccine throughout the influenza season. In addition, timely empiric antiviral treatment is recommended for patients with severe, complicated, or progressive influenza illness, those at higher risk for influenza complications, or those for whom treatment can be started within 48 hours of illness onset.

Morbidity and Mortality Weekly Report
MMWR / June 8, 2012 / Vol. 61 / No. 22 421
Investigation of Leptospirosis Underreporting — Puerto Rico, 2010
Leptospirosis, a zoonosis transmitted through contact with the urine of infected animals, either directly or through expo-sure to contaminated water or soil, is a frequent cause of acute febrile illness (AFI) (1) and can be difficult to distinguish from dengue in areas where both are endemic (2,3). Approximately 5%–10% of patients with leptospirosis are affected severely; the case-fatality rate in those with severe disease is 5%–15% (4). Early identification of leptospirosis cases and early administra-tion of penicillin G or doxycycline can reduce the duration and severity of illness (5).
Human leptospirosis is a reportable disease in Puerto Rico. During 2000–2009, approximately 15–100 cases of suspected leptospirosis were reported to the Puerto Rico Department of Health (PRDH) each year. In 2010, a total of 59 leptospirosis cases were reported, including one death. Barriers to determin-ing the actual burden of leptospirosis in Puerto Rico include the unavailability of diagnostic testing on the island, no sys-tem of veterinary surveillance to detect animal cases, and no environmental surveillance to identify circulating serovars.
In January 2010, CDC’s Dengue Branch initiated enhanced surveillance in Puerto Rico to determine the rate of dengue deaths through detection of fatal AFI cases at hospitals and pathology laboratories, and through review of death certificates. Autopsy tissue specimens from suspected cases were tested by CDC’s Infectious Diseases Pathology Branch for dengue virus and other pathogens, including Leptospira (the cause of leptospirosis).
This enhanced fatal AFI surveillance system identified 20 laboratory-confirmed and five suspected fatal cases of leptospirosis in 2010 in Puerto Rico (0.67 deaths per 100,000 residents). If the PRDH passive case reporting system captured all cases of leptospirosis, three to nine reported deaths from 59 reported cases would have been expected, for a rate of 0.08–0.24 deaths per 100,000. These findings suggest that 60%–90% of fatal leptospirosis cases are not reported, reflect-ing underrecognition of cases, underreporting, or both.
As a first step toward developing strategies to improve leptospirosis surveillance and diagnostic capacity in Puerto Rico, reasons for underreporting were investigated. A con-venience sample of 19 physicians and 39 veterinarians were interviewed to assess their knowledge of the clinical presenta-tion and treatment of leptospirosis and reporting requirements. The physician interviewees were volunteers from two academic medical centers in Puerto Rico, and the veterinarians who were
interviewed were recruited during a major veterinary confer-ence. The physicians and veterinarians also were asked about their perception of barriers to reporting cases of leptospirosis and barriers to leptospirosis diagnostic testing. Of those inter-viewed, 95% were able to describe the signs and symptoms, risk factors, and appropriate treatment for leptospirosis. All believed diagnostic services were not timely, and very few were satisfied with the availability. More than 95% of physicians also believed they could distinguish leptospirosis from dengue. All veterinarian interviewees were willing to report cases of leptospirosis in animals if a case reporting system was in place.
Lack of timely diagnostic services and the absence of a system to report animal cases of leptospirosis (which could act as sen-tinels for risk of human disease) appear to be barriers to report-ing cases in humans and animals, respectively. To strengthen leptospirosis surveillance, prevention, and diagnostic services, PRDH and CDC agreed on a plan to 1) implement a new surveillance system that records suspected cases of leptospirosis in humans and animals; 2) develop diagnostic capacity for leptospirosis within PRDH or clinical laboratories; 3) promote use of Food and Drug Administration–approved rapid tests in the field; and 4) revise case definitions for reporting. The new system will integrate case report data with laboratory data from PRDH, which will confirm cases and identify serovars.
Reported by
Brenda Rivera, DVM, Puerto Rico Dept of Health. William A. Bower, MD, Marta Guerra, DVM, Dianna Blau, DVM, Div of High-Consequence Pathogens and Pathology, Kay M. Tomashek, MD, Div of Vector-Borne Diseases, National Center for Emerging and Zoonotic Infectious Diseases; Mahesh Swaminathan, MD, Tyler Sharp, PhD, EIS officers, CDC. Corresponding contributor: Marta Guerra, [email protected], 404-639-3951.
References 1. McBride AJ, Athanazio DA, Reis MG, Ko AI. Leptospirosis. Curr Opin
Infect Dis 2005;18:376–86. 2. Bruce MG, Sanders EJ, Leake JA , et al. Leptospirosis among patients
presenting with dengue-like illness in Puerto Rico. Acta Trop 2005;96:36–46.
3. Libraty DH, Myint KSA, Murray CK, et al. A comparative study of leptospirosis and dengue in Thai children. PLoS Negl Trop Dis 2007;1:e111.
4. Levett PN. Leptospirosis. Clin Microbiol Rev 2001;14:296–326. 5. Edwards CN, Nicholson GD, Hassell TA, Everard CO, Callender J.
Penicillin therapy in icteric leptospirosis. Am J Trop Med Hyg 1988;39:388–90.
Notes from the Field

Morbidity and Mortality Weekly Report
422 MMWR / June 8, 2012 / Vol. 61 / No. 22
0
2
4
6
8
10
12
14
16
18
20
Large central Large fringe Medium Small Town/City(Micropolitan)
Rural
NonmetropolitanMetropolitan
Rate
Type of locality
Males Females
QuickStats
FROM THE NATIONAL CENTER FOR HEALTH STATISTICS
* Per 100,000 standard population. Deaths from homicide are those coded *U01–*U02, X85–Y09, and Y87.1 in the International Classification of Diseases, 10th Revision.
† Counties were classified into urbanization levels based on a classification scheme that considers metropolitan/nonmetropolitan status, population, and other factors.
Among males and females, the homicide rate during 2007–2009 was highest in large central metropolitan counties. For males, the age-adjusted homicide rate in large central metropolitan counties was 76% higher than the rate in medium metropolitan counties (14.4 versus 8.2 per 100,000 population) and more than double (122%–129% higher) the rates in other types of localities. For females, the homicide rates ranged from a high of 2.9 in large central metropolitan counties to 1.9 in large fringe metropolitan counties. In each type of locality, the homicide rate was much higher for males than females. Overall, the homicide rate was 9.1 per 100,000 population for males and 2.5 for females.
Sources: National Vital Statistics System. County-level mortality file. Available at http://www.cdc.gov/nchs/deaths.htm and http://wonder.cdc.gov/mortsql.html.
Ingram DD, Franco SJ. NCHS urban-rural classification scheme for counties. Vital Health Stat 2012;2(154).
Reported by: Deborah D. Ingram, PhD, [email protected], 301-458-4733; Sheila J. Franco.
Age-Adjusted Homicide Rates,* by Sex and Type of Locality† — United States, 2007–2009

U.S. Government Printing Office: 2012-523-043/02015 Region IV ISSN: 0149-2195
The Morbidity and Mortality Weekly Report (MMWR) Series is prepared by the Centers for Disease Control and Prevention (CDC) and is available free of charge in electronic format. To receive an electronic copy each week, visit MMWR’s free subscription page at http://www.cdc.gov/mmwr/mmwrsubscribe.html. Paper copy subscriptions are available through the Superintendent of Documents, U.S. Government Printing Office, Washington, DC 20402; telephone 202-512-1800.
Data presented by the Notifiable Disease Data Team and 122 Cities Mortality Data Team in the weekly MMWR are provisional, based on weekly reports to CDC by state health departments. Address all inquiries about the MMWR Series, including material to be considered for publication, to Editor, MMWR Series, Mailstop E-90, CDC, 1600 Clifton Rd., N.E., Atlanta, GA 30333 or to [email protected].
All material in the MMWR Series is in the public domain and may be used and reprinted without permission; citation as to source, however, is appreciated.
Use of trade names and commercial sources is for identification only and does not imply endorsement by the U.S. Department of Health and Human Services.
References to non-CDC sites on the Internet are provided as a service to MMWR readers and do not constitute or imply endorsement of these organizations or their programs by CDC or the U.S. Department of Health and Human Services. CDC is not responsible for the content of these sites. URL addresses listed in MMWR were current as of the date of publication.
Morbidity and Mortality Weekly Report