Embed Size (px)
Citation preview

NeuroImage 118 (2015) 301–312
Contents lists available at ScienceDirect
NeuroImage
j ourna l homepage: www.e lsev ie r .com/ locate /yn img
Full length article
Venous cerebral blood volume increase during voluntary locomotionreflects cardiovascular changes
Bing-Xing Huo a, Stephanie E. Greene a, Patrick J. Drew a,b,⁎a Center for Neural Engineering Department of Engineering Science and Mechanicsb Department of Neurosurgery Pennsylvania State University, University Park, PA 16802, USA
⁎ Corresponding author at: Department of EnginDepartment of Neurosurgery W-317 Millennium SciencUniversity, University Park, PA 16802.
E-mail address: [email protected] (P.J. Drew).
http://dx.doi.org/10.1016/j.neuroimage.2015.06.0111053-8119/© 2014 Elsevier Inc. All rights reserved.
a b s t r a c t
a r t i c l e i n f oArticle history:Received 8 January 2015Accepted 3 June 2015Available online 6 June 2015
Keywords:Neurovascular couplingLocomotionImagingFrontal cortexSomatosensory cortex
Understanding how changes in the cardiovascular system contribute to cerebral blood flow (CBF) and volume(CBV) increases is critical for interpreting hemodynamic signals. Here we investigated how systemic cardiovas-cular changes affect the cortical hemodynamic response during voluntary locomotion. In the mouse, voluntarylocomotion drives an increase in cortical CBF and arterial CBV that is localized to the forelimb/hindlimb represen-tation in the somatosensory cortex, as well as a diffuse venous CBV increase. To determine if the heart rateincreases that accompany locomotion contribute to locomotion-induced CBV and CBF increases, we occludedheart rate increases with the muscarinic cholinergic receptor antagonist glycopyrrolate, and reduced heart ratewith the β1-adrenergic receptor antagonist atenolol. We quantified the effects of these cardiovascular manipula-tions on CBV and CBF dynamics by comparing the hemodynamic response functions (HRF) to locomotion acrossthese conditions. Neither the CBF HRF nor the arterial component of the CBV HRF was significantly affected bypharmacological disruption of the heart rate. In contrast, the amplitude and spatial extent of the venous compo-nent of the CBV HRF were decreased by atenolol. These results suggest that the increase in venous CBV duringlocomotion was partially driven by peripheral cardiovascular changes, whereas CBF and arterial CBV increasesassociated with locomotion reflect central processes.
© 2014 Elsevier Inc. All rights reserved.
Introduction
Local cerebral blood flow is controlled centrally by local neuralactivity via neurovascular coupling (Attwell et al., 2010; Hillman,2014; Logothetis, 2008), but also can be affected by peripheral cardio-vascular changes, which are buffered to varying degrees by cerebralautoregulation (Lassen, 1959; Lucas et al., 2010; Tzeng and Ainslie,2013). Understanding the relative balance of central and peripheralcontributions to the cerebral hemodynamic response is critical fordrawing inferences from hemodynamic signals across behavioral statesand comparing healthy versus diseased populations (D'esposito et al.,2003; Iadecola, 2004, 2013). However, there is an incomplete under-standing of how systemic cardiovascular changes impact cerebralblood flow (CBF) and volume (CBV) increases.
Sensory evoked hemodynamic changes are typically thought of asa linear convolution of the stimulus with a hemodynamic responsefunction (HRF) (Boynton et al., 1996; Glover, 1999; Vazquez and Noll,1998). It is important to determine if the HRF reflects purely centralprocesses, such as neural and/or astrocytic control (Attwell et al.,
eering Science & Mechanics,e Complex Pennsylvania State
2010; Hamel, 2006; Hillman, 2014; Petzold and Murthy, 2011), or ifthe HRF is affected by changes in the cardiovascular system, such asincreases or decreases in heart rate (Chang et al., 2009). Because CBVincreases are generated by the dilation of both arteries and veins(Drew et al., 2011; Kim et al., 2007; Kim and Kim, 2011; Lee et al.,2001; Silva, 2005; Zong et al., 2012), in order to interpret CBV signalsit is essential to understand how cardiovascular state affects bothtypes of vessels. Arteries and veins will be affected by blood pressuredifferentially, as arteries have active autoregulatory responses (Faraciand Heistad, 1990; Harder, 1984), while veins passively change theirdiameters in response to pressure changes (Boas et al., 2008; Buxtonet al., 1998; Edvinsson et al., 1983; Mandeville et al., 1999; Zheng andMayhew, 2009). Consistent with these observations, measurements ofthe responses of individual cerebral arteries and veins in anesthetizedmice, where the heart rate is lowered relative to the awake animal,have shown that anesthesia completely blocked the dilation of cerebralveins to sensory stimulation that was normally present in the awakeanimal (Drew et al., 2011). Fluctuations in cardiovascular and respirato-ry processes can affect resting and sensory-evoked cerebral hemody-namic signals (Birn et al., 2008a,b, 2009; Chang et al., 2009; Shmueliet al., 2007), and blood pressure can affect BOLD (blood-oxygen leveldependent) signals (Kalisch et al., 2001; Wang et al., 2006). Imagingmodalities that permit subject motion, such as near-infrared spectros-copy (NiRS) (Ferrari and Quaresima, 2012; Piper et al., 2014) may also
302 B.-X. Huo et al. / NeuroImage 118 (2015) 301–312
be sensitive to cardiovascular changes accompanyingmovement. Theseresults suggest that in addition to changes in blood vessel diameterevoked by central processes, changes in cardiovascular state may alsocontribute to the hemodynamic response.
The largest, normal physiological perturbations in the cardiovascularsystem take place during exercise, making exercise a natural test casefor investigating the significance of cardiovascular changes in affectingcerebral hemodynamic signals. Exercise increases heart rate, cardiacoutput and systemic blood pressure (Mitchell, 1985; Yancey andOverton, 1993). While there is a large, but contradictory, body of litera-ture on the effects of exercise on CBF in humans (Ogoh and Ainslie,2009), the imaging techniques available in animalmodels have alloweda better understanding of the cerebral hemodynamic changes duringexercise, as well as their microvascular basis. During voluntary locomo-tion in mice, increases in CBV and CBF are largely localized to theforelimb/hindlimb (FL/HL) representations in the primary somatosen-sory cortex (SI), with little change in the frontal cortex (FC) (Huoet al., 2014). The increases in CBV and CBF are linearly related tolocomotion, and are well-captured by HRFs (Huo et al., 2015) similarto the one used in BOLD-based fMRI (Boynton et al., 1996; Glover,1999). The CBV HRF can be decomposed into arterial and venous com-ponents (Huo et al., 2015; Silva et al., 2007). The locomotion-evokedarterial component of the CBVHRF is largest in the cortical FL/HL repre-sentation, while the spatial distribution of venous component of theCBV HRF is more uniform across frontal and parietal cortical surface(Huo et al., 2015). Because average neural activity and hemodynamicsignals in FC decouple during locomotion (Huo et al., 2014), it isconceivable that other physiological processes, such as cardiovascularchanges, contribute to locomotion-evoked CBV and CBF changes.
Here, we tested if the disruption of normal cardiovascular changesaccompanying voluntary locomotion affected locomotion-evoked CBVand CBF HRFs. If pharmacological occlusion or reduction of the heartrate increases during locomotion altered the locomotion-evoked HRFs,then systemic cardiovascular processes contribute to the observedchanges in CBV andCBF, and thus any evoked changes in cerebral hemo-dynamic signals cannot be entirely attributed to central (neural andastrocytic) processes. We blocked muscarinic acetylcholine receptorswith glycopyrrolate, which increases heart rate and cardiac output(Seifert et al., 2010), elevates resting blood pressure (Hamner et al.,2012), and blocks parasympathetic outflow. In humans, glycopyrrolatecan block exercise-induced CBF increases (Seifert et al., 2010) (but seeRokampet al., 2014).Weblockedβ1-adrenergic receptorswith atenolol,which reduces heart rate and blood pressure (Fitzgerald et al., 1978;Joyner et al., 1986) and decreases cardiovascular output (Joho et al.,2006). Neither glycopyrrolate nor atenolol crosses the blood-brainbarrier (Franko et al., 1962; Neil Dwyer et al., 2012). Using laser Dopplerflowmetry (LDF) and intrinsic optical signal (IOS) imaging, wefound that the CBF HRF and the arterial component of the CBV HRF tolocomotion were not significantly affected by these pharmacologicaldisruptions of normal cardiovascular fluctuations. In contrast, theamplitude of the venous component of the locomotion-evoked CBVHRF was significantly decreased under the influence of atenolol. Ourfindings indicate that during normal behavior, a substantial amount ofthe venous component of the CBV HRF could be driven by cardiovascu-lar changes.
Methods
Animals
All experimental procedureswere performed in accordancewith theInstitutional Animal Care and Use Committee of the Pennsylvania StateUniversity, University Park and NIH guidelines. A total of 13 maleC57BL/6 J mice (Jackson Laboratory) were used. Mice were housedindividually and kept on a 12-hour light/dark cycle.
Surgery
Mice were 4 to 10 months old (23–33 g) at the time of surgery. Allsurgical procedures were performed under isoflurane anesthesia. Micewere implanted with head bolts, and either bilateral or unilateralreinforced thinned-skull windows for IOS and LDF measurements.Detailed surgical procedures for creating reinforced thinned-skull win-dows have been described previously (Drew et al., 2010; Huo et al.,2014, 2015; Shih et al., 2012). We attached a custom-machined titani-um head bolt to the dorsal aspect of the exposed skull, posterior tolambda. We then installed chronic, coverslip-reinforced thinned-skullwindows spanning both frontal and parietal cortices, bilaterally in 10mice, and unilaterally in 3 others. Black dental acrylic was used to min-imize reflected light. In the three mice with unilateral thinned-skullwindows, self-tapping 3/32” #000 screws were placed into the skullcontralateral to the windows over the frontal (+2.0 mm A-P and1.0 mm M-L from bregma) and parietal (−0.5 mm A-P and2.0 mm M-L from bregma) cortices for use as electrocortogram(ECoG) electrodes. The screws were connected via stainless steelwires (A-MSystems, #793600) to an electrical connector for differentialECoG measurements.
Experiments
Mice were head-fixed on top of a spherical treadmill (60-mmdiameter) covered with anti-slip tape. The treadmill had one rotationaldegree of freedom. The animal’s velocity was recorded using an opticalrotary encoder (Gao and Drew, 2014) (US Digital, E7PD-720-118)attached to the axle of the treadmill. All data were collected usingcustom-written software in LabView 8.6 (National Instruments). ForCBV measurements (n = 13), four 530 nm LEDs (Thorlabs, M530L2-C1) (Bouchard et al., 2009), with ±10 nm filters (Thorlabs, FB530-10),uniformly illuminated the area of the thinned skull window(s). Because530 nm is an isobestic point of hemoglobin (Prahl, 2006), CBV increasesdue to arterial and venous dilations cause a decrease in reflectance (Huoet al., 2015). Intrinsic images (256 × 256 pixels, 27–43 μm/pixel) werecaptured using a CCD camera (Dalsa, Pantera 1 M60)(Huo et al., 2014,2015) at an acquisition frequency of 30 frames/s (for ~3 minutes) forheart rate measurements (Fig. 1), or at 3 frames/s (for ~33 minutes)for locomotion-driven CBV HRF measurements. A camera (Microsoft,LifeCam Cinema) was used to monitor the animal’s behavior. In thisexperimental setup, instrumentation noise in measures of reflectancehas a root-mean square (RMS) amplitude of ~0.01% (Huo et al., 2014),which is ~100x smaller than the spontaneous ongoing fluctuations inhemodynamic signals that are found in awake rodents (Huo et al.,2014, 2015) and ~1000× smaller than the locomotion evoked signalsmeasured here (Huo et al., 2014, 2015). For CBF measurements, alaser Doppler flowmeter (LDF) (Oxford Optronix, OxyFlo) probe waspositioned at a 30-degree angle over the frontal or parietal cortex ofthe left hemisphere (n=7) of animalswith bilateral thinned-skull win-dows. CBFwas onlymeasured in one location per trial. For simultaneousLDF and IOSmeasurements, a 530±5nmfilter was attached to the CCDcamera to block light emitted by the LDF probe. Because the LDF probepartially obscured thewindow over the left hemisphere, on trials whereCBFmeasurements weremade, only the right hemispherewas includedin calculating the spatial spread of the arterial and venous signals. ECoGwas recorded differentially from screws in the frontal and parietalcortices, amplified (DAM80, WPI Inc.), and band-pass filtered between0.1 Hz and 200 Hz (Brownlee Precision, Model 440). The measuredCBF and CBV signals report fractional, not absolute, changes in cerebralblood flow and volume, respectively.
Sterile saline (Teknova), glycopyrrolate (50 μg/kg in saline, Sigma-Aldrich), and atenolol (2mg/kg in saline, Sigma-Aldrich)were intraper-itoneally injected into all of the 13 mice. The animal was allowed toacclimate to the treadmill for at least 30 minutes prior to the injection.Only one injection was made for each animal per day. The interval

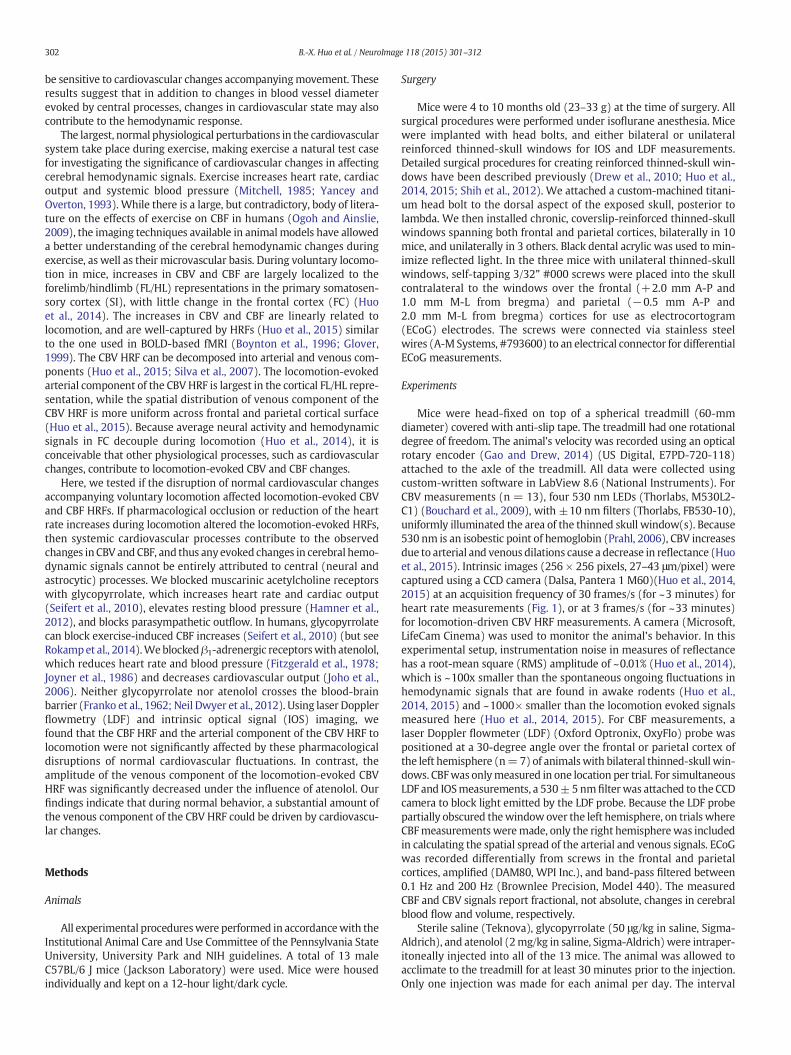
Fig. 1. Effects of pharmacological perturbations on heart rate, cortical activity, and behavior. (A) Example trials showing the spectrograms of the IOS and ECoG after injections of saline,glycopyrrolate, or atenolol, respectively. Locomotion events are denoted by gray dots (top row). In the spectrograms of IOS (middle row), the heart rate-related oscillation is visible asthe frequency corresponding to the peak power in the 5-15Hz band (purple line). In the spectrograms of ECoG (bottom row), locomotion-related increases in gamma-band power (definedas 40–100 Hz, excluding 55–65 Hz) are visible. Superimposed on the ECoG spectrogram is the gamma-band power gain (in dB APγ, cyan line, right axis). (B) At rest (left) and duringlocomotion (right), themean heart rate was significantly affected by the injection of glycopyrrolate or atenolol compared to saline injection. After saline or atenolol injection, locomotionsignificantly increased heart rate during locomotion compared to at rest. Glycopyrrolate increased heart rate such that there was no significant difference between the resting heart rateand heart rate during locomotion. Pairwise two-sample t-tests: N.S., not significant; *p b 0.05; ** p b 0.01; *** p b 0.001. (C) Gamma-band power gain during locomotion, as compared toat rest (APγ) was unaffected by glycopyrrolate or atenolol. (D) Fraction of time spent locomoting after the injection of saline, glycopyrrolate, or atenolol were not significantly different.One-way ANOVA: N.S., not significant.
303B.-X. Huo et al. / NeuroImage 118 (2015) 301–312
between any two consecutive injections was at least 24 hours.Injections were interleaved such that no two consecutive injectionswere the same drug and the order of the drug/saline injections wasrandomized such that no two animals received the injections in thesame order. The heart rate was monitored from the IOS immediatelybefore and after injection. Heart rate changes were used as a markerof drug efficacy. We found that the changes in heart rate induced byglycopyrrolate and atenolol lasted for more than 40 minutes and1 hour, respectively (data not shown). Based on these measurements,we recorded the IOS at 30 frames/s for 3–7 minutes after drug/salineinjection to verify that the drug had an effect, and then recorded theIOS for ~33 minutes at 3 frames/s. These 33-minute trials were usedto fit the locomotion-evoked CBV and/or CBF HRFs under the influenceof either drug or saline. In each mouse, 1 to 4 trials were taken undereach condition. In one mouse, there was no detectable increase in CBFin the frontal cortex (FC) during locomotion after glycopyrrolateinjection. This animal was excluded from the glycopyrrloate CBF HRFestimation.
At the conclusion of experiments, mice were deeply anesthetizedand transcardially perfused. Tangential slices of the cortex wereprocessed for cytochrome oxidase staining (Drew and Feldman, 2007)to reconstruct the forelimb (FL) and hindlimb (HL) representations inthe primary sensory cortex (SI). We aligned the histological imageswith the IOS images using a combination of vascular morphology andfiduciary marks (Drew and Feldman, 2009; Huo et al., 2014, 2015). Ineach hemisphere, a polygon of interest enclosing the FL/HL representa-tion was selected based on cytochrome oxidase staining (Fig. 5)(Huo et al., 2014, 2015). One animal with a unilateral reinforcedthinned-skull window, whose FL/HL representation we were not ableto reconstruct histologically, was excluded from IOS analyses that re-quired identification of the FL/HL region. The position of the LDF probe
was histologically verified to bewithin the FL/HL region for parietal cor-tex measurements.
Data analysis
All analyses were performed in Matlab (MathWorks). The velocityfrom the optical rotary encoder was binarized into locomotion eventsand downsampled to the IOS frame rate (Huo et al., 2015). For eachanimal, a baseline IOS image was calculated for each day of imagingas the average during a ~10-s period of rest. The baseline, R0, wastaken from a time period after the animal had been on the treadmillfor N30minutes, but before any injectionwasmade. The baseline periodwas chosen such that it was not preceded by a long locomotion bout(Huo et al., 2015). IOS images from all trials within the same day werenormalized against this baseline. The fractional change of reflectanceΔR/R0 was calculated for each pixel in the IOS image as (R-R0)/R0. Tomonitor heart rate, we calculated the multi-taper power spectrogramof the spatial average of ΔR/R0 across the entire window using theChronux toolbox (Mitra and Bokil, 2008), with a 3.33-smovingwindowat steps of 1 s and frequency resolution of 0.23Hz. The heart rate in eachtime bin was determined by finding the peak frequency within the 5-15 Hz band. LDF signals measuring CBF were down-sampled to 3 Hzby averaging within each 0.33-s time bin. Similar to the IOS baseline,the baseline CBF, Q0, was determined as the average CBF, Q, over a peri-od of ~10 s when the animal was stationary and no visible behaviorwasobserved, and prior to any injection. Only one baseline per daywas usedfor all the trials on a given day. The fractional change of CBF, ΔQ/Q0, wasgiven by: (Q-Q0)/Q0.We calculated the power spectrogramof ECoG datausing a sliding 1-s window, with a step size of 0.3 s, and frequencyresolution of 0.9 Hz. The power gain was calculated by dividing theinstantaneous power spectrum by the baseline power spectrum. The

304 B.-X. Huo et al. / NeuroImage 118 (2015) 301–312
baseline ECoG power spectrum was averaged over a manually selected~10-s period when the animal was stationary. The baseline wastaken during a time period after the animal had been on the treadmillfor N30 minutes, before any injection was made, and when the heartrate was within the normal resting heart rate range. The power gainwas calculated by dividing the instantaneous power spectrum by thebaseline power spectrum. The gamma-band power gain, APγ, wasthe average power gain within gamma-band (40–100 Hz, excluding55–65 Hz) in decibels (dB).
To compare the effects of saline, glycopyrrolate and atenolol onlocomotion-evoked CBV and CBF HRFs, we quantified the CBV-relatedΔR/R0 and CBF-related ΔQ/Q0 using a linear convolution model(Boynton et al., 1996; Huo et al., 2015; Silva, 2005) with binarized loco-motion events as inputs (Huo et al., 2015). This model is schematicallyillustrated in Fig. 2. This simple model accurately captured the essentialdynamics of individual vessels under normal physiological conditions,and allowed us to visualize the differences in the spatial spread ofarterial and venous blood volume responses (Huo et al., 2015). TheCBV HRF at each pixel was fitted by the sum of two decaying exponen-tials with zero delay: a fast (arterial) component with a time constantof 4 s (ai), and a slow (venous) component with a time constant of40 s, (vi), and a constant (DC) term. The DC term accounted for anytrial-to-trial fluctuations in baseline. Fitted values of ai and vi for eachpixel within the same animal and condition were averaged across trialsafter registration of the IOS images. It should be noted that while directmeasurements of venous diameters in awakemice have shown that thevenous diameters return to baseline over tens of seconds after stimula-tion (Drew et al., 2011; Gao and Drew, 2014; Huo et al., 2015), there is
Fig. 2. Linear model reliably quantifies CBV and CBF responses to locomotion after drug or salinlocomotion. The fractional change in the IOS, ΔR/R0, which mirrors changes in CBV, is composcomponent (blue), which ismore diffuse. For clarity, the DC component is not shown.Middle: Ain the frontal cortex (FC, center, red), a large and brief arterial CBV increase in the FL/HL area (bcomotion bout saturates the arterial CBV increases (red), and drives a substantial venous CBV inthe FL/HL area being somewhat larger. The sum of the arterial and venous components is showtion. Left: LDFmeasured CBFwithin a small area in the FC (blue) or FL/HL area (green).Middle: Insmaller than in the FL/HL area (bottom row). Right: Similarly, in response to sustained locomotcomponent of CBV response in A. (C) Comparison of Pearson’s correlation coefficient (r) betweeglycopyrrolate, and atenolol injections. There was no significant difference in the fitting qualitythe different cardiovascular conditions. n= 12mice. (D) Comparison of Pearson’s correlation coFL/HL area (green boxes) after saline, glycopyrrolate, and atenolol injections, demonstrating thaafter glycopyrrolate injection, where n = 6 mice.
evidence that the dynamics of veins are faster in humans (Dechent et al.,2011; Hua et al., 2011; van Zijl et al., 2012). Because previous work hasshown that fitted HRF parameters were very stable across multiplemeasurements separated by days to weeks (Huo et al., 2015), weaveraged across trials to reduce the variability of the HRF estimates.
The root-mean-square (RMS) of difference between the fit and theCBV data, averaged over the FL/HL representation, was calculated forevery animal after each injection. The ‘rest state’ was defined as whenthe animal was not moving, where the absolute value of the change inthe fit was b1 × 10-6, that is, when the fitted response was very closeto constant. All other periods were defined as the locomotion state forRMS difference comparisons.
The CBF HRF was characterized as a decaying exponential with twofree parameters, the amplitude, AQ, and the time constant, τQ (Huoet al., 2015). The total change of ΔQ/Q0 following a locomotion eventwas the integrated area of the CBF HRF, AQτQ. We fit AQ and τQ to mini-mize themean-squared error between themodel-estimated ΔQ/Q0 andthe actual measurement. We fit the CBF with a single time constant fortwo reasons. First, direct two-photon microscopy measurements ofblood velocity through capillaries in awake mice have shown thatflow increases and decreases rapidly with the onset and offset of stimu-lation, closely tracking arterial diameter response to the same stimulus(Drew et al., 2011). Thus, we would expect under normal physiologicalconditions that the change in CBF should track arterial dilation, whichhave time constants of a few seconds (Huo et al., 2015). Secondly, asingle exponential kernel matches the CBF dynamics very well. If theCBF response had similar dynamics as the CBV response, that is a mix-ture of fast and slow processes, the fit by the single time constant
e injections. (A) Left: Schematic illustrating the linear model of the CBV HRF in response toed of an arterial component (red), which is localized to the FL/HL area of SI, and a venoussingle locomotion event (top), or impulse, drives a slight change in the arterial componentottom, red), and small increase in venous CBV in both regions (blue). Right: A sustained lo-crease (blue) in both FC (center) and FL/HL area (bottom), with the venous CBV increase inn inmagenta. (B) Schematic illustrating the CBF HRF and dynamics in response to locomo-response to a single locomotion event, the amplitude of the CBF HRF in FC (center row)wasion, the HRF was substantially smaller in FC than in the FL/HL area, mimicking the arterialn the CBVmodel fitting andmeasuredΔR/R0 for all the pixels in the FL/HL area after saline,between the saline and drug injected trials, showing the validity of the CBV model acrossefficient between the CBF fittedwith themodel andmeasuredΔQ/Q0 in FC (blue boxes) ort the HRFmodel was valid across different conditions. n= 7mice, except for frontal cortex

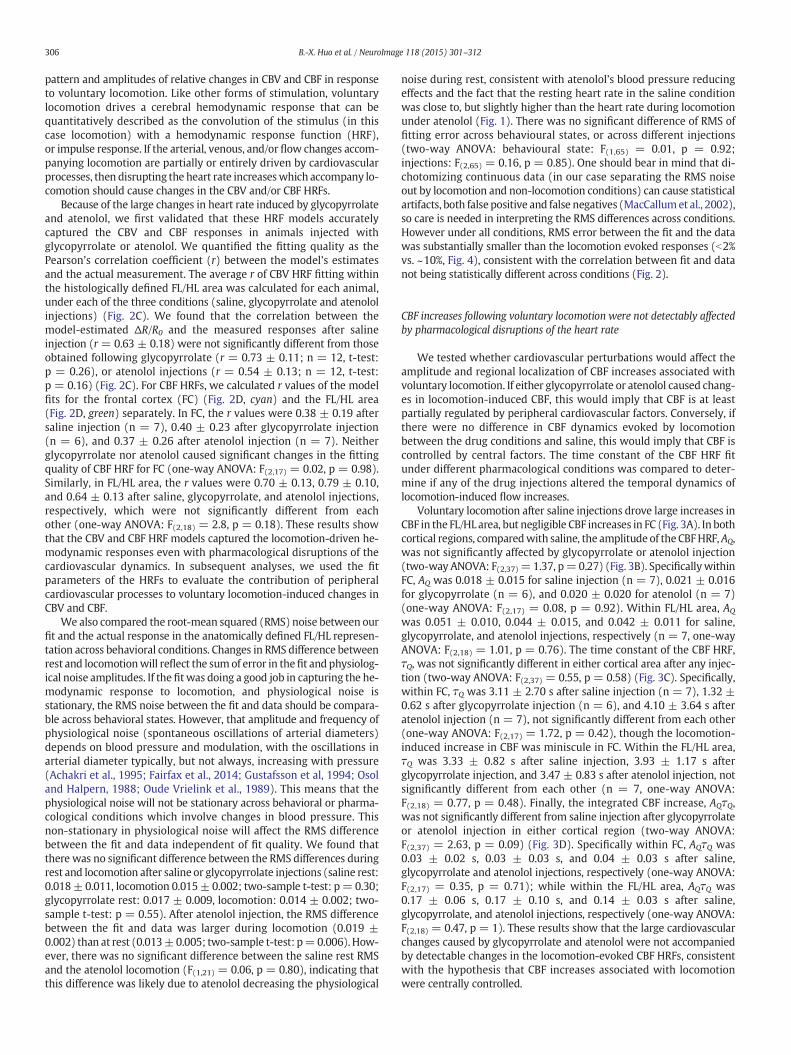
Fig. 3. Locomotion-induced changes in CBF in the frontal cortex and FL/HL representation were unaffected by pharmacological manipulations of heart rate. (A) Example trials showinglocomotion-evoked increases in CBF in the frontal cortex (FC, blue line) and FL/HL representation (green line) of somatosensory cortex, and their respective fits with the CBF HRF model(magenta line). The area sampled by the LDF probe is illustrated as an oval in either FC (blue) or FL/HL area (green). Bregma is denoted by a brown dot. Using locomotion events(gray dots) as the stimulus, the model well fit the observed changes of CBF (r = 0.50 in FC; r = 0.85 in FL/HL area). (B-D) Comparing fitted parameters of the CBF HRF, including theamplitude AQ (B), the time constant τQ (C), and integrated response, AQτQ (D), in FC (blue boxes) and FL/HL area (green boxes) after saline, glycopyrrolate, or atenolol injection. n = 7mice for all measures, except for FC after glycopyrrolate injection, where n = 6.
305B.-X. Huo et al. / NeuroImage 118 (2015) 301–312
would yield an intermediate time constant between the arterial and ve-nous time constants. Our CBF HRF fits consistently give time constantsvery close to those of the arterial dynamics (Huo et al., 2015), matchingthe observed response (Fig. 3), and indicating that locomotion-inducedCBF increases are best fit with a single time constant.
To quantify the effects of different drugs, we compared averagesusing one-way ANOVA for comparisons across all injections, andmulti-way ANOVA for comparison between injections in addition toother conditions. Two-sample t-tests were used for between-injectioncomparisons. We used the modified Bonferroni method to correct forall multiple comparisons. To compare the spatial extent of the arterialand venous CBV changes after drug injections, we regressed the arterialor venous amplitudes of CBV HRF (ai or vi) of all pixels within the FL/HLarea after drug injection against the fitted ai or vi of the same pixels aftersaline injection, fixing the intercept at the origin. A regressioncoefficient differing from unity meant the drug had altered the overallamplitude of the arterial and/or venous component of the hemodynam-ic response to locomotion. The spatial spread of the active arterial orvenous responses was defined as the area of pixels within the windowwith ai or vi greater than half of the 99-percentile of the peak response.
All reported numbers are mean +/− standard deviation unlessotherwise indicated. Statistical power was computed post hoc usingG*power (Faul et al., 2007)
Results
Glycopyrrolate and atenolol affect heart rate, but did not detectably altercortical neural activity or behavior
Wefirst validated that glycopyrrolate and atenolol altered heart rate,but not neural activity or behavior. We did this to establish that anyeffects that they had on relative changes in CBF and CBV were not dueto changes in neural activity. Using high-speed (30 frames/s)(Bouchard et al., 2009; Chen et al., 2011; Huo et al., 2015) IOS imagingof head-fixedmice voluntarilymoving on a spherical treadmill, wemea-sured heart rates (Fig. 1A) during voluntary locomotion after the injec-tion of saline, glycopyrrolate, or atenolol. After saline injection, the heartrate was 9.7 ± 1.2 Hz at rest (n = 13). Glycopyrrolate significantly in-creased resting heart rate to 11.1 ± 0.8 Hz (t-test: p = 0.0011), while
atenolol significantly decreased the resting heart rate to 7.4 ± 0.8 Hz(t-test: p = 1.5 × 10⁻⁵). During locomotion in saline injected mice,heart rates increased to 10.5 ± 0.8 Hz. Glycopyrrolate increased heartrate during locomotion to 11.4 ± 0.5 Hz (t-test: p = 0.0024), whileatenolol decreased the heart rate to 8.4 ± 0.7 Hz (t-test: p =4.3 × 10⁻⁷), compared to saline injection (Fig. 1B). Glycopyrrolate raisedresting heart rate such that heart rate during locomotion was notsignificantly higher than at rest (t-test: p = 0.22, power = 0.89).
To test if increases in neural activity accompanying locomotion (Huoet al., 2014; Niell and Stryker, 2010; Paukert et al., 2014; Polack et al.,2013) were affected by glycopyrrolate or atenolol, we quantified thelocomotion-driven gamma-band power gain compared to rest, APγ, inthe ECoG signal. Increases in gamma-band power are correlated withincreases in blood flow (Logothetis et al., 2001; Niessing et al., 2005;Siero et al., 2013). The ECoG was recorded differentially from screwsin the frontal and parietal cortices, so it will reflect the neural activityover the entire hemisphere. The gain in gamma-band power duringlocomotion, APγwas significantly greater than zero after saline injection(1.31 ± 0.39 dB, n = 3, t-test: p = 0.03) (Fig. 1A). Neitherglycopyrrolate (1.54 ± 0.31 dB) nor atenolol (1.58 ± 0.39 dB) signifi-cantly altered APγ compared to saline injection (one-way ANOVA:F(2,6) = 0.43, p = 0.67) (Fig. 1C), showing that these drugs did notdetectably alter cortical neural activity. Finally, the fraction of timespent locomoting was not affected by drug injections (15% ± 8.2% forsaline, 16% ± 8.8% for glycopyrrolate, 17% ± 8.2% for atenolol; n = 13,one-way ANOVA: F(2,36) =0.39, p = 0.68) (Fig. 1D). Neither drug pro-duced any visible gross alteration of behavior (grooming, movement,posture, etc.) in the mice. Consistent with their inability to cross theblood-brain barrier (Franko et al., 1962; Neil Dwyer et al., 2012), neitherglycopyrrolate nor atenolol detectably altered the cortical neuralactivity evoked by voluntary locomotion, or the fraction of time themouse spent locomoting, but they did cause significant changes inheart rate at rest and/or during locomotion.
Changes in locomotion-driven CBV and CBF were reliably quantified by alinear model after glycopyrrolate or atenolol injection
We then asked if alterations of the normal locomotion-driven heartrate increases by glycopyrrolate or atenolol would affect the spatial
306 B.-X. Huo et al. / NeuroImage 118 (2015) 301–312
pattern and amplitudes of relative changes in CBV and CBF in responseto voluntary locomotion. Like other forms of stimulation, voluntarylocomotion drives a cerebral hemodynamic response that can bequantitatively described as the convolution of the stimulus (in thiscase locomotion) with a hemodynamic response function (HRF),or impulse response. If the arterial, venous, and/or flow changes accom-panying locomotion are partially or entirely driven by cardiovascularprocesses, then disrupting the heart rate increaseswhich accompany lo-comotion should cause changes in the CBV and/or CBF HRFs.
Because of the large changes in heart rate induced by glycopyrrolateand atenolol, we first validated that these HRF models accuratelycaptured the CBV and CBF responses in animals injected withglycopyrrolate or atenolol. We quantified the fitting quality as thePearson’s correlation coefficient (r) between the model’s estimatesand the actual measurement. The average r of CBV HRF fitting withinthe histologically defined FL/HL area was calculated for each animal,under each of the three conditions (saline, glycopyrrolate and atenololinjections) (Fig. 2C). We found that the correlation between themodel-estimated ΔR/R0 and the measured responses after salineinjection (r = 0.63 ± 0.18) were not significantly different from thoseobtained following glycopyrrolate (r = 0.73 ± 0.11; n = 12, t-test:p = 0.26), or atenolol injections (r = 0.54 ± 0.13; n = 12, t-test:p = 0.16) (Fig. 2C). For CBF HRFs, we calculated r values of the modelfits for the frontal cortex (FC) (Fig. 2D, cyan) and the FL/HL area(Fig. 2D, green) separately. In FC, the r values were 0.38 ± 0.19 aftersaline injection (n = 7), 0.40 ± 0.23 after glycopyrrolate injection(n = 6), and 0.37 ± 0.26 after atenolol injection (n = 7). Neitherglycopyrrolate nor atenolol caused significant changes in the fittingquality of CBF HRF for FC (one-way ANOVA: F(2,17) = 0.02, p = 0.98).Similarly, in FL/HL area, the r values were 0.70 ± 0.13, 0.79 ± 0.10,and 0.64 ± 0.13 after saline, glycopyrrolate, and atenolol injections,respectively, which were not significantly different from eachother (one-way ANOVA: F(2,18) = 2.8, p = 0.18). These results showthat the CBV and CBF HRF models captured the locomotion-driven he-modynamic responses even with pharmacological disruptions of thecardiovascular dynamics. In subsequent analyses, we used the fitparameters of the HRFs to evaluate the contribution of peripheralcardiovascular processes to voluntary locomotion-induced changes inCBV and CBF.
We also compared the root-mean squared (RMS) noise between ourfit and the actual response in the anatomically defined FL/HL represen-tation across behavioral conditions. Changes in RMS difference betweenrest and locomotionwill reflect the sumof error in thefit and physiolog-ical noise amplitudes. If the fit was doing a good job in capturing the he-modynamic response to locomotion, and physiological noise isstationary, the RMS noise between the fit and data should be compara-ble across behavioral states. However, that amplitude and frequency ofphysiological noise (spontaneous oscillations of arterial diameters)depends on blood pressure and modulation, with the oscillations inarterial diameter typically, but not always, increasing with pressure(Achakri et al., 1995; Fairfax et al., 2014; Gustafsson et al, 1994; Osoland Halpern, 1988; Oude Vrielink et al., 1989). This means that thephysiological noise will not be stationary across behavioral or pharma-cological conditions which involve changes in blood pressure. Thisnon-stationary in physiological noise will affect the RMS differencebetween the fit and data independent of fit quality. We found thatthere was no significant difference between the RMS differences duringrest and locomotion after saline or glycopyrrolate injections (saline rest:0.018± 0.011, locomotion 0.015± 0.002; two-sample t-test: p= 0.30;glycopyrrolate rest: 0.017 ± 0.009, locomotion: 0.014 ± 0.002; two-sample t-test: p = 0.55). After atenolol injection, the RMS differencebetween the fit and data was larger during locomotion (0.019 ±0.002) than at rest (0.013±0.005; two-sample t-test: p=0.006). How-ever, there was no significant difference between the saline rest RMSand the atenolol locomotion (F(1,21) = 0.06, p = 0.80), indicating thatthis difference was likely due to atenolol decreasing the physiological
noise during rest, consistent with atenolol’s blood pressure reducingeffects and the fact that the resting heart rate in the saline conditionwas close to, but slightly higher than the heart rate during locomotionunder atenolol (Fig. 1). There was no significant difference of RMS offitting error across behavioural states, or across different injections(two-way ANOVA: behavioural state: F(1,65) = 0.01, p = 0.92;injections: F(2,65) = 0.16, p = 0.85). One should bear in mind that di-chotomizing continuous data (in our case separating the RMS noiseout by locomotion and non-locomotion conditions) can cause statisticalartifacts, both false positive and false negatives (MacCallumet al., 2002),so care is needed in interpreting the RMS differences across conditions.However under all conditions, RMS error between the fit and the datawas substantially smaller than the locomotion evoked responses (b2%vs. ~10%, Fig. 4), consistent with the correlation between fit and datanot being statistically different across conditions (Fig. 2).
CBF increases following voluntary locomotion were not detectably affectedby pharmacological disruptions of the heart rate
We tested whether cardiovascular perturbations would affect theamplitude and regional localization of CBF increases associated withvoluntary locomotion. If either glycopyrrolate or atenolol caused chang-es in locomotion-induced CBF, this would imply that CBF is at leastpartially regulated by peripheral cardiovascular factors. Conversely, ifthere were no difference in CBF dynamics evoked by locomotionbetween the drug conditions and saline, this would imply that CBF iscontrolled by central factors. The time constant of the CBF HRF fitunder different pharmacological conditions was compared to deter-mine if any of the drug injections altered the temporal dynamics oflocomotion-induced flow increases.
Voluntary locomotion after saline injections drove large increases inCBF in the FL/HL area, but negligible CBF increases in FC (Fig. 3A). In bothcortical regions, comparedwith saline, the amplitude of the CBFHRF, AQ,was not significantly affected by glycopyrrolate or atenolol injection(two-way ANOVA: F(2,37)= 1.37, p=0.27) (Fig. 3B). SpecificallywithinFC, AQ was 0.018 ± 0.015 for saline injection (n = 7), 0.021 ± 0.016for glycopyrrolate (n = 6), and 0.020 ± 0.020 for atenolol (n = 7)(one-way ANOVA: F(2,17) = 0.08, p = 0.92). Within FL/HL area, AQ
was 0.051 ± 0.010, 0.044 ± 0.015, and 0.042 ± 0.011 for saline,glycopyrrolate, and atenolol injections, respectively (n = 7, one-wayANOVA: F(2,18) = 1.01, p = 0.76). The time constant of the CBF HRF,τQ, was not significantly different in either cortical area after any injec-tion (two-way ANOVA: F(2,37) = 0.55, p = 0.58) (Fig. 3C). Specifically,within FC, τQ was 3.11 ± 2.70 s after saline injection (n = 7), 1.32 ±0.62 s after glycopyrrolate injection (n = 6), and 4.10 ± 3.64 s afteratenolol injection (n = 7), not significantly different from each other(one-way ANOVA: F(2,17) = 1.72, p = 0.42), though the locomotion-induced increase in CBF was miniscule in FC. Within the FL/HL area,τQ was 3.33 ± 0.82 s after saline injection, 3.93 ± 1.17 s afterglycopyrrolate injection, and 3.47 ± 0.83 s after atenolol injection, notsignificantly different from each other (n = 7, one-way ANOVA:F(2,18) = 0.77, p = 0.48). Finally, the integrated CBF increase, AQτQ,was not significantly different from saline injection after glycopyrrolateor atenolol injection in either cortical region (two-way ANOVA:F(2,37) = 2.63, p = 0.09) (Fig. 3D). Specifically within FC, AQτQ was0.03 ± 0.02 s, 0.03 ± 0.03 s, and 0.04 ± 0.03 s after saline,glycopyrrolate and atenolol injections, respectively (one-way ANOVA:F(2,17) = 0.35, p = 0.71); while within the FL/HL area, AQτQ was0.17 ± 0.06 s, 0.17 ± 0.10 s, and 0.14 ± 0.03 s after saline,glycopyrrolate, and atenolol injections, respectively (one-way ANOVA:F(2,18) = 0.47, p = 1). These results show that the large cardiovascularchanges caused by glycopyrrolate and atenolol were not accompaniedby detectable changes in the locomotion-evoked CBF HRFs, consistentwith the hypothesis that CBF increases associated with locomotionwere centrally controlled.

Fig. 4. Arterial and venous components of CBV response to locomotion after injections of saline, glycopyrrolate, or atenolol. (A) Example trial starting 20 minutes after saline injectionshowing locomotion-induced changes in reflectance and model fit. The black line shows the fractional change of IOS, ΔR/R0, averaged within a ~0.1 mm2 area within the parietal cortex(smallmagenta box inC). Grey dots show locomotion events. Themagenta line shows thefittedΔR/R0 changes. The red line shows the arterial component of thefittedΔR/R0 response, andthe blue line shows the venous component of the fitted ΔR/R0 response, both from the model illustrated in Fig. 2. For clarity, the DC component is not shown. The r between the fittedresponse and the measured ΔR/R0 was 0.84. (B) The HRF model used in (A). The red line is the arterial component of the HRF, and the blue line is the venous component of the HRF.The magenta line shows the total HRF, which is the sum of the arterial and venous components. (C) Correlation coefficients (r) of all pixels between the measured ΔR/R0 response andthe fitted data. The average r over both windows was 0.65. (D) Example trial starting 20 minutes after glycopyrrolate injection showing locomotion-induced changes in reflectanceand model fit. The ΔR/R0 was the average over the same area as in (A), enclosed by the magenta box in (F). The average r was 0.89 within this area. (E) Arterial (red) and venous(blue) components of the HRF (magenta) used to fit the data in (D). (F) Map of values of r for all pixels within the windows under glycopyrrolate. The average r over the entire windowwas 0.66. (G) Example trial showing locomotion-induced changes in reflectance andmodel fit starting 20minutes after atenolol injection, averaged over the same area as in (A), shown asthe enclosed area by themagenta box in (I). The average r was 0.71 within this area. (H) HRFs of the fittedΔR/R0 and its arterial and venous components. (I) Map of r values for all pixelswithin the windows under atenolol. The r averaged over both windows was 0.48.
307B.-X. Huo et al. / NeuroImage 118 (2015) 301–312
Locomotion-driven arterial CBV responses were not detectably affected bypharmacological disruptions of the heart rate
We tested whether the disruption of normal cardiovascular dynam-ics associated with locomotion would alter the amplitude or spatialextent of the locomotion-evoked CBV HRF (Huo et al., 2015) (Fig. 2A).Examples of CBV time courses during voluntary locomotion after saline,glycopyrrolate or atenolol injections are shown in Fig. 4.
We first determined if the arterial component of the CBV HRF wasaffected by cardiovascular manipulations. The amplitude of the fittedarterial component of the CBV HRF for each pixel ai in an examplemouse is shown in Fig. 5A. The network of large arteries on the corticalsurface was clearly visible, due to the large magnitudes of their fitted
arterial component, verifying that the fitting procedure captured thearterial dynamics. To show systematic spatial variations in the ampli-tude of the arterial CBV response to locomotion, we calculated theaverage of ai across the medial-lateral axis within each hemisphere,and the rostral-caudal average of ai in both hemispheres. After salineinjection, the average magnitude of ai was largest within the parietalcortex, but small or negative in the frontal cortex, consistentwith previ-ous measurements made under normal physiological conditions (Huoet al., 2015). A very similar spatial distribution and amplitude in thefitted values of ai were seen after glycopyrrolate or atenolol injection,indicating that these drugs had no effect on the arterial component ofthe CBV HRF. To quantify any drug effects on the amplitude of thearterial component of the CBV HRF in the FL/HL area, we performed

Fig. 5. Pharmacological manipulations of locomotion-induced heart rate changes did not affect the arterial component of the CBV HRF. (A) Images showing the spatial variation in mag-nitudes of the fitted arterial components, ai, of the CBV HRF across the dorsal cortex after injections in an example mouse. Brighter red indicates larger magnitude of the fitted arterialcomponent. Window extents are outlined in white. Yellow polygons denote the histologically determined FL/HL area in SI. Left and right vertical plots show the average fitted arterial re-sponse ai along the rostral-caudal axis in the left and right hemispheres, respectively. Bottomhorizontal plots show average arterial responses ai along themedial-lateral axis of each hemi-sphere. Black lines show averages of ai after saline injection, red lines showaverage ai after glycopyrrolate or atenolol injection. Scale bar: 1mm. (B)Within SI FL/HL areas,mean pixel-wiseregression coefficients of the amplitudes of arterial responses ai after drug injection against saline injection for the same animal. A regression coefficient of one implies no change relative tosaline injection (n = 12mice, t-tests compared to unity). (C) The ratio between the arterial active area after glycopyrrolate or atenolol injection, Idrug, and the arterial activated area aftersaline injection, Isaline, showing no significant differences between the spatial spread of the arterial response across conditions. A ratio of one implies no change in the activated area. Theheight of the bar plot shows the mean of the ratio Idrug/Isaline (n = 13 mice, t-tests compared to unity).
308 B.-X. Huo et al. / NeuroImage 118 (2015) 301–312
pixel-wise regression between the values of ai obtained under salineand drug-injected conditions within the same mouse. We restrictedthis quantification of fit amplitudes to the anatomically defined FL/HLrepresentation because the FL/HL representation responds strongly tolocomotion, as measured by increases in CBF and CBV. This will ensurethat the correlation between the fits and the hemodynamic responsewas high, ensuring an accurate quantification of the individual compo-nents of the hemodynamic response. We found that the coefficient ofregression against the saline control was not significantly differentfrom unity for glycopyrrolate (1.04± 0.35, t-test: p = 0.70) or atenolol(0.93± 0.25, t-test: p= 0.70) injections (n= 12) (Fig. 5B). This lack ofa difference indicated that neither drug significantly affected the arterialcomponent of the CBV HRF. To quantify the spatial spread of arterialcomponent of the CBV response, we defined the arterial activated areaas the area with magnitudes of ai greater than half of the 99%tile re-sponse (Huo et al., 2014). We first evaluated the arterial activated areachanges over the entire window after glycopyrrolate or atenololinjection by taking the ratio of the activated area after drug injectionto the activated area after saline injection within the same animal. Weused this metric because window size and position varied acrossanimals. This ratio was not significantly different from 1 for eitherglycopyrrolate (0.98 ± 0.22, t-test: p = 0.78; n = 13) or atenolol(1.11 ± 0.30, t-test: p = 0.41; n = 13) (Fig. 5C). When we restrictedthe activated area analysis to the pixels in the anatomically-definedFL/HL area, the arterial activated area was not significantly differentfrom saline controls in the glycopyrrolate (0.89 ± 0.18, t-test: p =0.06; n = 12), or atenolol (1.03 ± 0.24, t-test: p = 0.63; n = 12)
conditions. These results showed that the amplitude and spatial distri-bution of the arterial component of the CBVHRFwere not detectably af-fected by cardiovascular manipulations.
Venous CBV increases accompanying locomotion were significantly attenu-ated by atenolol, but not by glycopyrrolate
We then investigated the effects of pharmacologically induced car-diovascular perturbations on the venous component of the CBV HRF.An example of the venous componentfit amplitudes for a saline injectedmouse is shown in Fig. 6A. In contrast to arterial component of the CBVHRF, the distribution of the pixels with large magnitudes of venouscomponent, vi, was spatially diffuse, with large draining veins clearlyvisible across the entire cortex (Fig. 6A, left). The amplitudes and spatialpatterns of the vi were similar between glycopyrrolate and saline injec-tion conditions (Fig. 6A, middle). However, the spatial distribution andmagnitudes of vi after atenolol injection were noticeably decreasedcompared to saline controls (Fig. 6A, right).
To quantify the effects of glycopyrrolate and atenolol on the venouscomponent of CBV HRF, we regressed the fitted values of vi afterglycopyrrolate or atenolol injection against the fitted vi after saline in-jection for pixels in the SI FL/HL representation. As with the arterialcomponent of the response, we restricted this quantification to the an-atomically defined FL/HL representation to ensure that only pixels thatwere robustly driven by locomotion were used to quantify the venousresponse.We found that atenolol significantly decreased themagnitudeof the venous component of the CBV HRFwithin the FL/HL area (0.44 ±

Fig. 6. Atenolol decreased the magnitude and spatial extent of the venous component of the CBV HRF. (A) Images showing the spatial variation in amplitudes of the fitted venouscomponents, vi, of the CBV HRF across the dorsal cortex after injections in an example mouse. Brighter blue indicates larger magnitudes of vi. Left and right vertical plots show the viaveraged along the rostral-caudal axis of the left and right hemispheres, respectively. Horizontal plot show the average vi along the medial-lateral axis of each hemisphere. Black linesshow the average vi after saline injection,while blue lines show average vi after glycopyrrolate or atenolol injection. Scale bar: 1mm. (B)Within SI FL/HL areas,mean pixel-wise regressioncoefficients of the amplitudes of vi after drug injection against saline injection for the same animal. Atenolol, but not glycopyrrolate, significantly decreased the amplitudes of the venouscomponent of the CBV HRF in the FL/HL representation (n= 12mice, t-tests compared to unity) *, p b 0.05. (C) Themean ratio between the venous activated area after glycopyrrolate oratenolol injection, Idrug, and the venous activated area after saline injection, Isaline shows a decrease in the venous activated area after injection of atenolol (n=13mice, t-tests compared tounity) *, p b 0.05.
309B.-X. Huo et al. / NeuroImage 118 (2015) 301–312
0.68, t-test: p = 0.033; n = 12; power = 0.85), but glycopyrrolate didnot (0.71± 0.59, t-test: p= 0.12; n= 12) (Fig. 6B).We also quantifiedthe effects of glycopyrrolate and atenolol on the spatial spread of the ve-nous component of the CBV HRF induced by locomotion. We found thatthe venous activated area was significantly reduced by atenolol (0.57±0.47, t-test: p=0.013; n=13; power=0.93), butwas not significantlychanged by glycopyrrolate (1.03 ± 0.53, t-test: p = 0.86; n = 13)(Fig. 6C). The same results held true when we restricted the venous ac-tivated area analysis to the FL/HL area, where the venous activated areawas significantly reduced by atenolol (0.63 ± 0.57, t-test: p = 0.045;n = 12), but was not significantly changed by glycopyrrolate injection(1.24 ± 0.88, t-test: p = 0.38; n = 12). These results showed that themagnitude and spatial spread of the venous component of thelocomotion-evoked CBV HRF were significantly decreased by atenolol,but not glycopyrrolate, indicating that the normal venous CBV responseto locomotion was at least partially due to cardiovascular changesassociated with locomotion.
Discussion
Studying cerebral hemodynamics during normal physiological func-tions is important for understanding the robustness of neurovascularcoupling. The present study tested the hypothesis that increases inCBF and CBV associatedwith locomotion are controlled solely by centralprocesses, rather than by peripheral cardiovascular changes. We foundthat glycopyrrolate occluded a significant component of the normalheart rate increase during locomotion (Wray et al., 2001), but it didnot detectably alter locomotion-induced CBV or CBF changes. Whileatenolol decreased heart rate by ~20%, it had no detectable effects on
locomotion-induced changes in CBF or arterial CBV. However, atenololdrastically reduced the venous component of the CBV response to loco-motion. This suggests that the normal venous distension accompanyinglocomotion requires normal heart rate modulations, implying that bothcardiovascular and central processes (dilation of nearby arteries andpotentially other vessels by neurons and/or astrocytes) (Huo et al.,2014; Vazquez et al., 2014) drive the CBV increase in response tolocomotion. Our results suggest that stimulus-locked cardiovascularchanges normally are a component of the cerebral hemodynamic re-sponse. Because tasks can modulate physiological processes such asbreathing (Birn et al., 2009), it is possible that cardiovascular-drivenchanges contribute to global hemodynamic signals (Gonzalez-Castilloet al., 2012). Although atenolol did not cause any significant changesin the amount of time spent locomoting or in modulations of thegamma-band power ECoG during locomotion relative to saline injec-tions, we cannot completely rule out any subtle neural or behavioralchanges that might contribute to its effects on locomotion-induced ve-nous CBV changes.
Although the arterial CBV and CBF responses to locomotionwere ro-bust to cardiovascular perturbations, the attenuation of the venous CBVresponse after atenolol injection could be explained by a limited abilityof upstream arteries to autoregulate (Lassen, 1959; Lucas et al., 2010;Tzeng and Ainslie, 2013). Between the heart and the surface vessels ofthe brain from which we measured flow and volume signals (Blinderet al., 2010, 2013; Chen et al., 2011) are the large arteries in the circleof Willis (Vrselja et al., 2014), and the initial segments of the largecerebral arteries. These large vessels at the base of the brain contributea substantial amount to the resistance of the cerebral vascular network(Faraci and Heistad, 1990), allowing them to exert a strong regulatory

310 B.-X. Huo et al. / NeuroImage 118 (2015) 301–312
influence on pressures experienced by downstreamvessels in thedorsalcortex. If these vessels have a limited ability to buffer blood pressures atthe low end of the autoregulatory range, this would explain themarkedreduction in the venous response to locomotion under atenolol. The lossof cerebral venous dilation to sensory stimulation at low heart rates issimilar to results from anesthetized mice, where the heart rate isdecreased to a similar extent as atenolol, and veins do not dilate inresponse to sensory stimulation (Drew et al., 2011).
There are several caveats to our results. First, intrinsic optical signalimaging only captures relative changes in hemodynamic signals fromthe upper layers of the cortex (Tian et al., 2011), so we cannot commenton the hemodynamic responses in deeper layers or absolute changes.Secondly, we do not know the exact pressures experienced bythe blood vessels on the surface of the cortex. The pressure in thesmall cortical vessels that control local blood flow is likely to not to betightly linked to the systemic blood pressure. The amplitude of dilationsof cerebral vessels will not only depend on blood pressure, but also onintracranial pressure (Ursino and Lodi, 1997). Dilation of cerebralblood vessels will cause increases in intracranial pressure (Risberget al., 1969), which will oppose further increase in vascular volume.
One potential concern is that the effects of atenolol we see herecould be due to change in the dynamics, that is a speedup or slowdown of the venous CBV response, rather than a decrease in the ampli-tude. There was no detectable change in the dynamics of the fastcomponent of the locomotion induced CBV increase (Fig. 4). If thevenous response were sped up (had a smaller time constant), then thefast component of the linear fit would increase, and the large veinswould become visible in the map of the fast (arterial) component ofthe fit amplitudes (Fig. 5). Veins in the dorsal cortex are easily distin-guishable from arteries, as veins drain into the sagittal sinus, and donot show the anastomoses seen in the arterial network (Blinder et al.,2010), which are visible in the maps of the fast components (Fig. 5A),thus any ‘cross-talk’ would be recognizable. Since we see no veins inthe arterial maps, and the amplitude of the arterial component doesnot change, this indicates that the venous dynamicswere not accelerat-ed by atenolol. If the venous response was slowed by atenolol, thiswould tend to increase the overall integrated response of the slowcomponent to locomotion, which is the opposite of the effect we seehere, suggesting that slowing was not taking place. The decrease inthe slow component could not be explained by a change in the arterialdynamics, because atenolol did not alter the time constant of the CBFresponse (Fig. 3C), and flow increases in the parenchyma closely followarterial dynamics (Drewet al., 2011;Huo et al., 2015). Another potentialconcern would be that the increase in RMS noise during locomotionunder atenolol might obscure any true venous signals or be due topoor fitting of the venous signal. This seems unlikely, because venousresponses are slow, lasting for tens of seconds (Kim and Kim, 2010,2011; Drew et al., 2011; Huo et al., 2015), while the physiological‘noise’, due to spontaneous fluctuations in arterial diameter, happenson a faster time scale than the venous response (Drew et al., 2011;Huo et al., 2015; Figure 4), which means that the RMS noise was in adistinct frequency band from where our significant change in responsewas observed. If anything, the increase in RMS noise should be associat-ed with changes in arterial responses, whichwe did not observe (Figs. 4and 5).
What physiological processes, other than changes in cardiovascularstate, could explain the decreased venous response and unchanged ar-terial responses to locomotion we observed under atenolol? One possi-bility that we cannot rule out is that there was a change in the neuralactivity during locomotion, indirectly mediated by atenolol, that is notreflected in the ECoG, and that only affected the venous response.ECoG is a coarse measure of neural activity, as it will only measure theaverage activity of many neurons. It is possible that a small subset ofneurons, whose activity was not detectable in the ECoG, could exert adisproportionate influence on the vascular response (Cauli and Hamel,2010). However, we do not know of a physiological mechanism that
could link changes in the local neural activity during locomotion tovenous distention alone. Because the dilation of cerebral vessels willdepend on the difference between the blood pressure and the intracra-nial pressure, another possibility would be that raised intracranial pres-sure (in addition to cardiovascular changes) opposes the venousdilation during locomotion. The choroid plexus, where cerebral spinalfluid (CSF) is produced, is innervated by sympathetic adrenergic nerves,and activation of these fibers decreases cerebral spinal fluid production(Lindvall et al., 1978; Edvinsson and Lindvall, 1978). Blocking adrener-gic receptors could possibly increase CSF production, and raise intracra-nial pressure, which might have the effect of opposing venous dilation.However, this possibility is speculative, especially since beta-blockersdo not change intracranial pressure (Auer et al., 1983), and intracranialpressure changes due to CSF production changes are thought to happenon much longer times scales than the changes we observed.
Our observation that cerebral venous blood volume changes reflectperipheral cardiovascular changes in addition to central processesalignswell with previous reports that BOLD fMRI signals, which primar-ily report oxygenation and volume of venous blood (Kim and Ogawa,2012), can be affected by physiological fluctuations (Birn et al., 2008a,b; Birn, 2012; Chang et al., 2009, 2013; Chang andGlover, 2009). Our re-sults suggest that cerebral blood flow and arterial volume changes werenot detectably affected by large changes in the cardiovascular dynamics,and thus are probably driven by central signals. However, venousvolume changes are at least partially driven by cardiovascular changesaccompanying the functional activation. The implication of this resultis that in functional imaging studies, where comparisons are drawnacross groups with potentially different cardiovascular states, as inaging and disease studies (D'esposito et al., 2003; Iadecola, 2010,2013), or use stimuli that might drive heart rate changes (such asemotionally charged images or aversive stimuli) (Straube et al., 2007;LaBar et al., 1998), or pharmacological fMRI studies with compoundsthat affect the cardiovascular system (Jenkins, 2012), or during restingstate studies during which the heart-rate and other cardiovascular pro-cesses naturally fluctuate (Chang et al., 2013; Goldberger et al., 2002),the measured hemodynamic signals are likely to be contaminated bycardiovascular effects. Under conditions where there might be largecardiovascular changes, it may be preferable to use hemodynamicmeasures that are less dependent on fluctuations in venous blood vol-ume (such as arterial spin labeling and other techniques (Calamanteet al., 1999; Cavusoglu et al., 2012)), or use brief stimuli, which do notcause significant increases in venous volume (Drew et al., 2011;Hillman et al., 2007; Kim et al., 2007; Kim and Kim, 2010; Zong et al.,2012).
Conflict of interest
None
Acknowledgments
This work was supported by an award from the American HeartAssociation (12SDG9130022), a Scholar Award from the McKnight En-dowment Fund for Neuroscience, NS078168 and NS079737 from theNIH to PJD, and ARRA stimulus funds through NS070701. The authorswould like to thank M. Nguyen, M. Sedigh-Sarvestani, A. Vazquez, andN. Zhang for comments on the manuscript, and Y.-R. Gao for assistancewith data processing.
References
Achakri, H., Stergiopulos, N., Hoogerwerf, N., Hayoz, D., Brunner, H.R., Meister, J.J., 1995.Intraluminal pressure modulates the magnitude and the frequency of inducedvasomotion in rat arteries. J. Vasc. Res. 32, 237–246.
Attwell, D., Buchan, A.M., Charpak, S., Lauritzen, M., Macvicar, B.A., Newman, E.A., 2010.Glial and neuronal control of brain blood flow. Nature 468, 232–243.

311B.-X. Huo et al. / NeuroImage 118 (2015) 301–312
Auer, L.M., Edvinsson, L., Johansson, B.B., 1983. Effect of sympathetic nerve stimulationand adrenoceptor blockade on pial arterial and venous calibre and on intracranialpressure in the cat. Acta Physiol. Scand. 119, 213–217.
Birn, R.M., 2012. The role of physiological noise in resting-state functional connectivity.NeuroImage 62, 864–870.
Birn, R., Murphy, K., Bandettini, P., 2008a. The effect of respiration variations on indepen-dent component analysis results of resting state functional connectivity. Hum. BrainMapp. 29, 740–750.
Birn, R.M., Smith, M.A., Jones, T.B., Bandettini, P.A., 2008b. The respiration responsefunction: the temporal dynamics of fMRI signal fluctuations related to changes inrespiration. NeuroImage 40, 644–654.
Birn, R.M., Murphy, K., Handwerker, D.A., Bandettini, P.A., 2009. fMRI in the presence oftask-correlated breathing variations. NeuroImage 47, 1092–1104.
Blinder, P., Shih, A.Y., Rafie, C., Kleinfeld, D., 2010. Topological basis for therobust distribution of blood to rodent neocortex. Proc. Natl. Acad. Sci. 107,12670–12675.
Blinder, P., Tsai, P.S., Kaufhold, J.P., Knutsen, P.M., Suhl, H., Kleinfeld, D., 2013. The corticalangiome: an interconnected vascular network with noncolumnar patterns of bloodflow. Nat. Neurosci. 16, 889–897.
Boas, D.A., Jones, S.R., Devor, A., Huppert, T.J., Dale, A.M., 2008. A vascular anatomicalnetwork model of the spatio-temporal response to brain activation. NeuroImage40, 1116–1129.
Bouchard, M.B., Chen, B.R., Burgess, S.A., Hillman, E.M.C., 2009. Ultra-fast multispectraloptical imaging of cortical oxygenation, blood flow, and intracellular calciumdynamics. Opt. Express 17, 15670–15678.
Boynton, G.M., Engel, S.A., Glover, G.H., Heeger, D.J., 1996. Linear systems analysis offunctional magnetic resonance imaging in human V1. J. Neurosci. 16, 4207–4221.
Buxton, R., Wong, E., Frank, L., 1998. Dynamics of blood flow and oxygenation changesduring brain activation: the balloon model. Magn. Reson. Med. 39, 855–864.
Calamante, F., Thomas, D.L., Pell, G.S., Wiersma, J., Turner, R., 1999. Measuring cerebralblood flow using magnetic resonance imaging techniques. J. Cereb. Blood FlowMetab. 19, 701–735.
Cauli, B., Hamel, E., 2010. Revisiting the role of neurons in neurovascular coupling. Front.Neuroenerg. 2, 1–9.
Cavusoglu, M., Bartels, A., Yeşilyurt, B., Uludağ, K., 2012. Retinotopic maps and hemody-namic delays in the human visual cortex measured using arterial spin labeling.NeuroImage 59, 4044–4054.
Chang, C., Glover, G.H., 2009. Relationship between respiration, end-tidal CO2, and BOLDsignals in resting-state fMRI. NeuroImage 47, 1381–1393.
Chang, C., Cunningham, J.P., Glover, G.H., 2009. Influence of heart rate on the BOLD signal:The cardiac response function. NeuroImage 44, 857–869.
Chang, C., Metzger, C.D., Glover, G.H., Duyn, J.H., Heinze, H.-J., Walter, M., 2013.Association between heart rate variability and fluctuations in resting-state functionalconnectivity. NeuroImage 68, 93–104.
Chen, B.R., Bouchard, M.B., Mccaslin, A.F.H., Burgess, S.A., Hillman, E.M.C., 2011. High-speed vascular dynamics of the hemodynamic response. NeuroImage 54, 1021–1030.
Dechent, P., Schütze, G., Helms, G., Merboldt, K.D., Frahm, J., 2011. Basal cerebral bloodvolume during the poststimulation undershoot in BOLD MRI of the human brain.J. Cereb. Blood Flow Metab. 31, 82–89.
D'esposito, M., Deouell, L.Y., Gazzaley, A., 2003. Alterations in the BOLD fMRI signal withageing and disease: a challenge for neuroimaging. Nat. Rev. Neurosci. 4, 863–872.
Drew, P.J., Feldman, D.E., 2007. Representation of moving wavefronts of whiskerdeflection in rat somatosensory cortex. J. Neurophysiol. 98, 1566–1580.
Drew, P.J., Feldman, D.E., 2009. Intrinsic signal imaging of deprivation-inducedcontraction of whisker representations in rat somatosensory cortex. Cereb. Cortex19, 331–348.
Drew, P.J., Shih, A.Y., Driscoll, J.D., Knutsen, P.M., Blinder, P., Davalos, D., Akassoglou, K.,Tsai, P.S., Kleinfeld, D., 2010. Chronic optical access through a polished and reinforcedthinned skull. Nat. Methods 7, 981–984.
Drew, P.J., Shih, A.Y., Kleinfeld, D., 2011. Fluctuating and sensory-induced vasodynamicsin rodent cortex extend arteriole capacity. Proc. Natl. Acad. Sci. 108, 8473–8478.
Edvinsson, L., Lindvall, M., 1978. Autonomic vascular innervation and vasomotorreactivity in the choroid plexus. Exp. Neurol. 62, 394–404.
Edvinsson, L., Högestätt, E.D., Uddman, R., Auer, L.M., 1983. Cerebral veins: fluorescencehistochemistry, electron microscopy, and in vitro reactivity. J. Cereb. Blood FlowMetab. 3, 226–230.
Fairfax, S.T., Mauban, J.R.H., Hao, S., Rizzo, M.a., Zhang, J., Wier,W.G., 2014. Ca2+ signalingin arterioles and small arteries of conscious, restrained, optical biosensor mice. Front.Physiol. 5, 1–9.
Faraci, F., Heistad, D., 1990. Regulation of large cerebral arteries and cerebralmicrovascular pressure. Circ. Res. 66, 8.
Faul, F., Erdfelder, E., Lang, A.-G., Buchner, A., 2007. G*Power 3: A flexible statistical poweranalysis program for the social, behavioral, and biomedical sciences. Behav. Res.Methods 39, 175–191.
Ferrari, M., Quaresima, V., 2012. A brief review on the history of human functional near-infrared spectroscopy (fNIRS) development and fields of application. NeuroImage 63,921–935.
Fitzgerald, J.D., Ruffin, R., Smedstad, K.G., Roberts, R., McAinsh, J., 1978. Studies on thepharmacokinetics and pharmacodynamics of atenolol in man. Eur. J. Clin. Pharmacol.13, 81–89.
Franko, B.V., Alphin, R.S.,Ward, J.W., Lunsford, C.D., 1962. Pharmacodynamic evaluation ofglycopyrrolate in animals. Ann. N. Y. Acad. Sci. 99, 131–149.
Gao, Y.-R., Drew, P.J., 2014. Determination of vessel cross-sectional area by thresholdingin Radon space. J. Cereb. Blood Flow Metab. 34, 1180–1187.
Glover, G., 1999. Deconvolution of impulse response in event-related BOLD fMRI.NeuroImage 9, 416–429.
Goldberger, A., Amaral, L., Hausdorff, J., Ivanov, P., Peng, C., Stanley, H., 2002. Fractaldynamics in physiology: alterations with disease and aging. Proc. Natl. Acad. Sci. U.S. A. 99, 2466.
Gonzalez-Castillo, J., Saad, Z.S., Handwerker, D.A., Inati, S.J., Brenowitz, N., Bandettini, P.A.,2012. Whole-brain, time-locked activation with simple tasks revealed using massiveaveraging and model-free analysis. Proc. Natl. Acad. Sci. 109, 5487–5492.
Gustafsson, H., Bülow, A., Nilsson, H., 1994. Rhythmic contractions of isolated, pressurizedsmall arteries from rat. Acta Physiol. Scand. 152, 145–152.
Hamel, E., 2006. Perivascular nerves and the regulation of cerebrovascular tone. J. Appl.Physiol. 100, 1059.
Hamner, J.W., Tan, C.O., Tzeng, Y.C., Taylor, J.A., 2012. Cholinergic control of the cerebralvasculature in humans. J. Physiol. Lond. 590, 6343–6352.
Harder, D.R., 1984. Pressure-dependent membrane depolarization in cat middle cerebralartery. Circ. Res. 55, 197–202.
Hillman, E.M.C., 2014. Coupling mechanism and significance of the BOLD signal: A statusreport. Annu. Rev. Neurosci. 37, 161–181.
Hillman, E.M.C., Devor, A., Bouchard, M.B., Dunn, A.K., Krauss, G.W., Skoch, J., Bacskai, B.J.,Dale, A.M., Boas, D.A., 2007. Depth-resolved optical imaging andmicroscopy of vascu-lar compartment dynamics during somatosensory stimulation. NeuroImage 35,89–104.
Hua, J., Stevens, R.D., Huang, A.J., Pekar, J.J., van Zijl, P.C.M., 2011. Physiological origin forthe BOLD poststimulus undershoot in human brain: vascular compliance versusoxygen metabolism. J. Cereb. Blood Flow Metab. 31, 1599–1611.
Huo, B.-X., Smith, J.B., Drew, P.J., 2014. Neurovascular coupling and decoupling in thecortex during voluntary locomotion. J. Neurosci. 34, 10975–10981.
Huo, B.-X., Gao, Y.-R., Drew, P.J., 2015. Quantitative separation of arterial and venouscerebral blood volume increases during voluntary locomotion. NeuroImage 105,369–379.
Iadecola, C., 2004. Neurovascular regulation in the normal brain and in Alzheimer'sdisease. Nat. Rev. Neurosci. 5, 347–360.
Iadecola, C., 2010. The overlap between neurodegenerative and vascular factors in thepathogenesis of dementia. Acta Neuropathol. 120, 287–296.
Iadecola, C., 2013. The pathobiology of vascular dementia. Neuron 80, 844–866.Jenkins, B.G., 2012. Pharmacologic magnetic resonance imaging (phMRI): Imaging drug
action in the brain. NeuroImage 62, 1072–1085.Joho, S., Ishizaka, S., Sievers, R., Foster, E., Simpson, P.C., Grossman, W., 2006. Left
ventricular pressure-volume relationship in conscious mice. Am. J. Physiol. HeartCirc. Physiol. 292, H369–H377.
Joyner, M.J., Freund, B.J., Jilka, S.M., Hetrick, G.A., Martinez, E., Ewy, G.A., Wilmore, J.H.,1986. Effects of beta-blockade on exercise capacity of trained and untrained men: ahemodynamic comparison. J. Appl. Physiol. 60, 1429–1434.
Kalisch, R., Elbel, G.-K., Gössl, C., Czisch, M., Auer, D.P., 2001. Blood pressure changesinduced by arterial blood withdrawal influence bold signal in anesthesized rats at 7Tesla: Implications for pharmacologic MRI. NeuroImage 14, 891–898.
Kim, T., Kim, S., 2010. Cortical layer-dependent arterial blood volume changes: improvedspatial specificity relative to BOLD fMRI. NeuroImage 49, 1340–1349.
Kim, T., Kim, S.-G., 2011. Temporal dynamics and spatial specificity of arterial and venousblood volume changes during visual stimulation: implication for BOLD quantification.J. Cereb. Blood Flow Metab. 31, 1211–1222.
Kim, S.-G., Ogawa, S., 2012. Biophysical and physiological origins of blood oxygenationlevel-dependent fMRI signals. J. Cereb. Blood Flow Metab. 32, 1188–1206.
Kim, T., Hendrich, K.S., Masamoto, K., Kim, S.-G., 2007. Arterial versus total blood volumechanges during neural activity-induced cerebral blood flow change: implication forBOLD fMRI. J. Cereb. Blood Flow Metab. 27, 1235–1247.
LaBar, K.S., Gatenby, J.C., Gore, J.C., LeDoux, J.E., Phelps, E.A., 1998. Human amygdalaactivation during conditioned fear acquisition and extinction: a mixed-trial fMRIstudy. Neuron 20, 937–945.
Lassen, N.A., 1959. Cerebral blood flow and oxygen consumption in man. 39, 183–238.Lee, S., Duong, T., Yang, G., Iadecola, C., Kim, S., 2001. Relative changes of cerebral arterial
and venous blood volumes during increased cerebral blood flow: implications forBOLD fMRI. Magn. Reson. Med. 45, 791–800.
Lindvall, M., Edvinsson, L., Owman, C., 1978. Sympathetic nervous controlofcerebrospinal fluid production from the choroid plexus. Science (New York,N.Y.) 201, 176–178.
Logothetis, N.K., 2008. What we can do and what we cannot do with fMRI. Nature 453,869–878.
Logothetis, N., Pauls, J., Augath, M., Trinath, T., Oeltermann, A., 2001. Neurophysiologicalinvestigation of the basis of the fMRI signal. Nature 412, 150–157.
Lucas, S.J.E., Tzeng, Y.C., Galvin, S.D., Thomas, K.N., Ogoh, S., Ainslie, P.N., 2010. Influence ofchanges in blood pressure on cerebral perfusion and oxygenation. Hypertension 55,698–705.
MacCallum, R.C., Zhang, S., Preacher, K.J., Rucker, D.D., 2002. On the practice of dichotomi-zation of quantitative variables. Psychol. Methods 7, 19–40.
Mandeville, J.B., Marota, J.J.A., Ayata, C., Zaharchuk, G., Moskowitz, M.A., Rosen, B.R.,Weisskoff, R.M., 1999. Evidence of a cerebrovascular Postarteriole Windkessel withdelayed compliance. J. Cereb. Blood Flow Metab. 679–689.
Mitchell, J.H., 1985. Cardiovascular control during exercise: central and reflex neuralmechanisms. Am. J. Cardiol. 55, 34D–41D.
Mitra, P., Bokil, H., 2008. Observed brain dynamics. Oxford University Press.Neil Dwyer, G., Bartlett, J., McAinsh, J., Cruickshank, J.M., 2012. Beta-adrenoceptor
blockers and the blood-brian barrier. Br. J. Clin. Pharmacol. 11, 549–553.Niell, C.M., Stryker, M.P., 2010. Modulation of visual responses by behavioral state in
mouse visual cortex. Neuron 65, 472–479.Niessing, J., Ebisch, B., Schmidt, K.E., Niessing, M., Singer, W., Galuske, R.A.W., 2005.
Hemodynamic signals correlate tightly with synchronized gamma oscillations.Science 309, 948–951.

312 B.-X. Huo et al. / NeuroImage 118 (2015) 301–312
Ogoh, S., Ainslie, P.N., 2009. Cerebral blood flow during exercise: mechanisms ofregulation. J. Appl. Physiol. 107, 1370–1380.
Osol, G., Halpern,W., 1988. Spontaneous vasomotion in pressurized cerebral arteries fromgenetically hypertensive rats. Am. J. Physiol. 254, H28–33.
Oude Vrielink, H.H., Slaaf, D.W., Tangelder, G.J., Reneman, R.S., 1989. Changes invasomotion pattern and local arteriolar resistance during stepwise pressurereduction. Pflugers Arch. 414, 571–578.
Paukert, M., Agarwal, A., Cha, J., Doze, V.A., Kang, J.U., Bergles, D.E., 2014. Norepinephrinecontrols astroglial responsiveness to local circuit activity. Neuron 82, 1263–1270.
Petzold, G.C., Murthy, V.N., 2011. Role of astrocytes in neurovascular coupling. Neuron 71,782–797.
Piper, S.K., Krueger, A., Koch, S.P., Mehnert, J., Habermehl, C., Steinbrink, J., Obrig, H.,Schmitz, C.H., 2014. A wearable multi-channel fNIRS system for brain imaging infreely moving subjects. NeuroImage 85, 64–71.
Polack, P.-O., Friedman, J., Golshani, P., 2013. Cellular mechanisms of brain state-dependent gain modulation in visual cortex. Nat. Neurosci. 16, 1331–1339.
Prahl, S., 2006. Optical absorption of hemoglobin. Oregon Medical Laser Center(http://omlc.org/spectra/hemoglobin/).
Risberg, J., Lundberg, N., Ingvar, D.H., 1969. Regional cerebral blood volume during acutetransient rises of the intracranial pressure (plateau waves). J. Neurosurg. 31,303–310.
Rokamp, K.Z., Olesen, N.D., Larsson, H.B., Hansen, A.E., Seifert, T., Nielsen, H.B., Secher,N.H., Rostrup, E., 2014. Glycopyrrolate does not influence the visual or motor-induced increase in regional cerebral perfusion. Front. Physiol. 5.
Seifert, T., Fisher, J.P., Young, C.N., Hartwich, D., Ogoh, S., Raven, P.B., Fadel, P.J., Secher,N.H., 2010. Glycopyrrolate abolishes the exercise-induced increase in cerebralperfusion in humans. Exp. Physiol. 95, 1016–1025.
Shih, A.Y., Driscoll, J.D., Drew, P.J., Nishimura, N., Schaffer, C.B., Kleinfeld, D., 2012. Two-photon microscopy as a tool to study blood flow and neurovascular coupling in therodent brain. J. Cereb. Blood Flow Metab. 32, 1277–1309.
Shmueli, K., van Gelderen, P., de Zwart, J.A., Horovitz, S.G., Fukunaga, M., Jansma, J.M.,Duyn, J.H., 2007. Low-frequency fluctuations in the cardiac rate as a source ofvariance in the resting-state fMRI BOLD signal. NeuroImage 38, 306–320.
Siero, J.C., Hermes, D., Hoogduin, H., Luijten, P.R., Petridou, N., Ramsey, N.F., 2013. BOLDconsistently matches electrophysiology in humansensorimotor cortex at increasingmovement rates: a combined7T fMRI and ECoG study on neurovascular coupling.J. Cereb. Blood Flow Metab. 33, 1448–1456.
Silva, A.C., 2005. Perfusion-based fMRI: Insights from animal models. J. Magn. Reson.Imaging 22, 745–750.
Silva, A.C., Koretsky, A.P., Duyn, J.H., 2007. Functional MRI impulse response for BOLD andCBV contrast in rat somatosensory cortex. Magn. Reson. Med. 57, 1110–1118.
Straube, T., Mentzel, H.-J., Miltner, W.H.R., 2007. Waiting for spiders: Brain activationduring anticipatory anxiety in spider phobics. NeuroImage 37, 1427–1436.
Tian, P., Devor, A., Sakadžić, S., Dale, A.M., Boas, D.A., 2011. Monte Carlo simulation of thespatial resolution and depth sensitivity of two-dimensional optical imaging of thebrain. J. Biomed. Opt. 16, 016006.
Tzeng, Y.-C., Ainslie, P.N., 2013. Blood pressure regulation IX: cerebral autoregulationunder blood pressure challenges. Eur. J. Appl. Physiol. 114, 545–559.
Ursino, M., Lodi, C.A., 1997. A simple mathematical model of the interaction betweenintracranial pressure and cerebral hemodynamics. J. Appl. Physiol. 82, 1256–1269.
van Zijl, P.C.M., Hua, J., Lu, H., 2012. The BOLD post-stimulus undershoot, one of the mostdebated issues in fMRI. Neuroimage 62, 1092–1102.
Vazquez, A.L., Noll, D.C., 1998. Nonlinear aspects of the BOLD response in functional MRI.NeuroImage 7, 108–118.
Vazquez, A.L., Fukuda, M., Crowley, J.C., Kim, S.-G., 2014. Neural and hemodynamicresponses elicited by forelimb- and photo-stimulation in channelrhodopsin-2 mice:Insights into the hemodynamic point spread function. Cereb. Cortex 24, 2908–2919.
Vrselja, Z., Brkic, H., Mrdenovic, S., Radic, R., Curic, G., 2014. Function of circle of Willis.J. Cereb. Blood Flow Metab. 1–7.
Wang, R., Foniok, T., Wamsteeker, J.I., Qiao, M., Tomanek, B., Vivanco, R.A., Tuor, U.I., 2006.Transient blood pressure changes affect the functional magnetic resonance imagingdetection of cerebral activation. NeuroImage 31, 1–11.
Wray, D.W., Formes, K.J., Weiss, M.S., O-Yurvati, A.H., Raven, P.B., Zhang, R., Shi, X., 2001.Vagal cardiac function and arterial blood pressure stability. Am. J. Physiol. Heart Circ.Physiol. 281, H1870–H1880.
Yancey, S.L., Overton, J.M., 1993. Cardiovascular responses to voluntary and treadmillexercise in rats. J. Appl. Physiol. 75, 1334–1340.
Zheng, Y., Mayhew, J., 2009. A time-invariant visco-elastic windkessel model relatingblood flow and blood volume. NeuroImage 47, 1371–1380.
Zong, X., Kim, T., Kim, S.-G., 2012. Contributions of dynamic venous blood volume versusoxygenation level changes to BOLD fMRI. NeuroImage 60, 2238–2246.