Embed Size (px)
Citation preview

I
Vendor Managed Inventory (VMI)
- An analysis of how Microsoft could implement VMI functionality in the ERP system Microsoft Dynamics AX.
Master’s Thesis
Authors: Peter Gurenius Johanna Wicander
Supervisors: Ola Johansson Department of Packaging Logistics, Lund University
Per Lykke Lynnerup Microsoft Development Center Copenhagen

II

III
Preface
This master’s thesis has been written during the autumn and spring of 2006/2007 as the final part of our education in Industrial Engineering and Management at the Faculty of Engineering at Lund University. The study was carried out in collaboration with and with assistance from Microsoft Development Center in Copenhagen and the Division of Packaging Logistics at Lund University.
We would initially like to regard a special thank to Ola Johansson, our supervisor at the Division of Packaging Logistics at Lund University and Per Lykke Lynnerup, our supervisor at Microsoft Development Center Copenhagen. They have given us interesting inputs and valuable support along the way. In addition we would like to thank all persons involved in our project in any way at both Microsoft Development Center and the Division of Packaging Logistics for their time and effort spent aiding us.
We would also like to thank Mikael Ståhl Elvander at the Department of Industrial Mangement and Logistics at Lund University for his help and support when conducting this thesis. Furthermore, we would like to express gratitude to all interviewees at our case companies for their time and valuable information. Without our visits at your companies this thesis would not have been possible to conduct.
Lund, April 16, 2007
Peter Gurenius Johanna Wicander

IV

V
Abstract
Title: ”Vendor Managed Inventory (VMI) – An analysis of how Microsoft could implement VMI functionality in the ERP system Microsoft Dynamics AX.”
Authors: Peter Gurenius Johanna Wicander
Supervisors: Ola Johansson, Department of Packaging Logistics, Lund University
Per Lykke Lynnerup, Microsoft Development Center, Copenhagen
Background issues:
VMI is being increasingly implemented in companies and therefore Microsoft wants to have this functionality in the ERP system Microsoft Dynamics AX. Today, in version 4.0 of AX, there is no VMI functionality and customers have to buy add on VMI solutions from Microsoft’s partners. However, these solutions are customer specific and do not lead to competitiveness for Microsoft in the long run. Microsoft wants to have generic VMI functionality build into AX, why Microsoft has started a large project for implementing advanced trading functionality in AX, including VMI.
Purpose:
The purpose of this master’s thesis is to “investigate how Microsoft could
implement VMI functionality in Microsoft Dynamics AX”. To achieve this, three research questions will be answered regarding purposes of starting VMI relationships, information needed in VMI collaborations and communication methods.
Method:
Since little prior research is done on VMI implementations into ERP systems the authors have conducted benchmarking case studies at six companies, both suppliers and customers working with different VMI solutions. The conclusions and recommendations are to a large extent based on the findings from the case studies.
Conclusions:
In summary, the case companies have reported overall positive results after implementing VMI and want to develop the collaborations further. The findings from the study indicate that more or less the same information is

VI
needed irrespective of how the information is sent. However, differences in how the information is sent are found.
Recommendations to Microsoft:
The authors believe after having conducted literature and case studies that it is necessary for Microsoft to have VMI functionality in AX to be able to compete successfully in the future. The authors present a generic solution for VMI in AX, in which configurations can be made easily to suit different methods of communication.
Key Words:
VMI, ERP, Microsoft Dynamics AX, supply chain collaboration, information sharing

VII
Sammanfattning
Titel: ”Vendor Managed Inventory (VMI) – En analys av hur Microsoft kan implementera VMI-funktionalitet i ERP systemet Microsoft Dynamics AX.”
Författare: Peter Gurenius Johanna Wicander
Handledare: Ola Johansson, Avdelningen för förpackningslogistik, Lunds universitet
Per Lykke Lynnerup, Microsoft Development Center, Köpenhamn
Bakgrund:
VMI blir allt vanligare på företag varför Microsoft vill implementera denna funktionalitet i deras ERP system Microsoft Dynamics AX. I dagens version av AX 4.0 finns ingen VMI funktionalitet varför kunderna måste köpa tilläggslösningar för VMI från Microsofts partners. Dessa lösningar är dock kundspecifika och gynnar inte Microsofts konkurrenskraft på lång sikt. Microsoft vill ha generisk VMI funktionalitet inbyggt i AX och har därför startat ett stort projekt för att starta implementering av bland annat VMI funktionalitet.
Syfte:
Syftet med detta examensarbete är att “undersöka hur Microsoft kan implementera VMI funktionalitet i Microsoft Dynamics AX”. För att kunna göra detta kommer tre forsknings frågor, rörande motiv till VMI implementeringar, vilken information som behövs i VMI samarbeten samt olika kommunikationsmetoder att besvaras.
Metod:
Eftersom lite forskning har gjorts rörande VMI implementering i ERP system har författarna genomfört undersökande fall studier på sex företag, både leverantörer och kunder som arbetar med olika VMI lösningar. Slutsatserna och rekommendationer är till stor del baserade på information från dessa fallstudier.
Slutsatser:
Företagen rapporterade överlag positiva resultat efter att ha startat VMI samarbeten och vill vidare utveckla samarbetena. Författarna har kommit fram till att mer eller mindre samma information behövs i ett VMI samarbete,

VIII
oberoende av hur informationen skickas. Det finns dock skillnader i hur informationen skickas mellan företagen.
Rekommendationer till Microsoft:
Efter att ha genomfört teori och fallstudier, menar författarna att det är nödvändigt för Microsoft att ha VMI funktionalitet i AX för att kunna konkurrera på ett framgångsrikt sätt på marknaden i framtiden. Författarna presenterar en generisk lösning för VMI i AX, i vilken konfigurationer kan göras enkelt för att passa olika kommunikationsmetoder.
Nyckelord:
VMI, ERP, Microsoft Dynamics AX, samarbete i försörjningskedjan, informationutbyte
IX
Table of Contents
1. INTRODUCTION ..........................................................................................................1
1.1. INTRODUCTION OF ERP SYSTEMS AND VMI ............................................................1 1.2. BACKGROUND ISSUES ..............................................................................................2 1.3. PURPOSE OF THE THESIS ..........................................................................................3 1.4. RESEARCH QUESTIONS.............................................................................................3 1.5. FOCUS AND DELIMITATIONS ....................................................................................3 1.6. TARGET GROUP ........................................................................................................4 1.7. STRUCTURE OF THE THESIS ......................................................................................4
2. METHODOLOGICAL FRAMEWORK......................................................................7
2.1. RESEARCH APPROACH ..............................................................................................7 2.1.1. The analytical approach.....................................................................................7 2.1.2. The systems approach.........................................................................................8 2.1.3. The actors approach...........................................................................................8 2.1.4. Research approach in this thesis ........................................................................9
2.2. RESEARCH METHODS ...............................................................................................9 2.2.1. Quantitative method ...........................................................................................9 2.2.2. Qualitative method ...........................................................................................10 2.2.3. The inductive method........................................................................................11 2.2.4. The deductive method .......................................................................................11 2.2.5. The abductive method.......................................................................................11 2.2.6. Research method in this thesis..........................................................................12
2.3. RESEARCH STRATEGY ............................................................................................12 2.3.1. Case Studies......................................................................................................13
2.4. DATA COLLECTION.................................................................................................14 2.4.1 Primary data.....................................................................................................14 2.4.2 Secondary data .................................................................................................14 2.4.3 Interviews .........................................................................................................15 2.4.4 Literature studies..............................................................................................16
2.5. ANALYSIS ..............................................................................................................16 2.6. CREDIBILITY ..........................................................................................................16
2.6.1. Validity .............................................................................................................17 2.6.2. Reliability .........................................................................................................17 2.6.3. Objectivity.........................................................................................................18
3. THEORETICAL FRAMEWORK ..............................................................................19
3.1. THE TRADITIONAL SUPPLY CHAIN ..........................................................................19 3.1.1. Problems with the traditional supply chain......................................................19 3.1.2. The traditional order process ...........................................................................21
3.2. THE VMI ORDER PROCESS .....................................................................................22 3.2.1. Manually based VMI ........................................................................................24 3.2.2. Electronic based VMI .......................................................................................25
3.3. THE VMI IMPLEMENTATION ..................................................................................25 3.3.1. Purpose with VMI implementations..................................................................25 3.3.2. Potential Benefits and Disadvantages ..............................................................26 3.3.3. The Agreement..................................................................................................29 3.3.4. Businesses and Products Suitable for VMI-collaboration projects ..................30 3.3.5. Obstacles and pitfalls .......................................................................................31
X
3.3.6. How can you measure VMI profitability? – The total cost model ....................31 3.4. INFORMATION SHARING .........................................................................................33
3.4.1. Information needed in a VMI relationship .......................................................33 3.4.2. Online and offline communication....................................................................35 3.4.3. Communication methods ..................................................................................36 3.4.4. Communication types .......................................................................................37
3.5. ERP SYSTEMS ........................................................................................................39 3.5.1. History of ERP..................................................................................................39 3.5.2. ERP...................................................................................................................40 3.5.3. Extended ERP...................................................................................................41
4. PRESENTATION OF MICROSOFT.........................................................................43
4.1. MICROSOFT CORPORATION ....................................................................................43 4.2. MICROSOFT DEVELOPMENT CENTER COPENHAGEN...............................................43 4.3. MICROSOFT DYNAMICS AX ...................................................................................44 4.4. CUSTOMERS AND PARTNERS ..................................................................................45
5. BENCHMARKING CASE STUDIES ........................................................................47
5.1. SCA PACKAGING ...................................................................................................47 5.1.1. SCA Packaging.................................................................................................47 5.1.2. VMI at SCA Packaging.....................................................................................47 5.1.3. Result of the VMI implementation ....................................................................49 5.1.4. ERP integration ................................................................................................49 5.1.5. VMI in the future...............................................................................................51
5.2. CEPA STEELTECH..................................................................................................52 5.2.1. CEPA Steeltech.................................................................................................52 5.2.2. VMI at CEPA Steeltech.....................................................................................53 5.2.3. Result of the VMI implementation ....................................................................53 5.2.4. ERP integration ................................................................................................54 5.2.5. VMI in the future...............................................................................................55
5.3. TETRA PAK ............................................................................................................56 5.3.1. Tetra Pak ..........................................................................................................56 5.3.2. VMI at Tetra Pak ..............................................................................................56 5.3.3. Results of the VMI integration..........................................................................57 5.3.4. ERP integration ................................................................................................57 5.3.5. VMI in the future...............................................................................................59
5.4. PROCORDIA FOOD ..................................................................................................60 5.4.1. Procordia Food ................................................................................................60 5.4.2. VMI at Procordia Food ....................................................................................61 5.4.3. Result after VMI implementation......................................................................63 5.4.4. ERP integration ................................................................................................63 5.4.5. VMI in the future...............................................................................................63
5.5. ALFA LAVAL..........................................................................................................64 5.5.1. Alfa Laval .........................................................................................................64 5.5.2. VMI at Alfa Laval .............................................................................................64 5.5.3. Result after VMI implementation......................................................................67 5.5.4. ERP integration ................................................................................................67 5.5.5. VMI in the future...............................................................................................68
5.6. ARCOMA ................................................................................................................69 5.6.1. Arcoma .............................................................................................................69 5.6.2. VMI at Arcoma .................................................................................................69 5.6.3. Result after VMI implementation......................................................................70

XI
5.6.4. ERP integration ................................................................................................71 5.6.5. VMI in the future...............................................................................................72
6. CROSS CASE ANALYSIS ..........................................................................................75
6.1. CASE COMPANIES ...................................................................................................75 6.2. VMI IMPLEMENTATION ..........................................................................................76 6.3. ERP INTEGRATION .................................................................................................79 6.4. INFORMATION SHARING .........................................................................................82 6.5. RESULT OF THE VMI IMPLEMENTATION.................................................................85 6.6. FUTURE DEVELOPMENT..........................................................................................87
7. CONCLUSIONS ...........................................................................................................89
7.1. ANSWERS TO RESEARCH QUESTIONS ......................................................................89 7.1.1. RQ1: Why do companies implement VMI?.......................................................89 7.1.2. RQ2: What information needs to be transferred between the supplier and the
customer and vice versa in a VMI relationship? ..............................................91 7.1.3. RQ3: How can the information be transferred between the supplier’s and the
customer’s ERP system in a VMI relationship? ...............................................92 7.2. SUGGESTIONS TO MICROSOFT ................................................................................94
7.2.1. Generic VMI solution for AX – customer .........................................................95 7.2.2. Generic VMI solution for AX – supplier...........................................................96
7.3. SUGGESTIONS TO FURTHER STUDIES ......................................................................97
8. REFERENCES..............................................................................................................99
8.1. BOOKS ...................................................................................................................99 8.2. ARTICLES .............................................................................................................100 8.3. ORAL SOURCES ....................................................................................................102 8.4. INTERNET SOURCES .............................................................................................102
APPENDIX ............................................................................................................................... I
APPENDIX A: INTERVIEW GUIDE BENCHMARKING CASE STUDIES.................II
APPENDIX B: SIGNALS IN THE INFORMATION SHARING ................................... VI

XII

1
1. Introduction
The following chapter starts by introducing ERP systems and VMI in order to
enlarge the reader’s knowledge of the concepts. Secondly, background issues
are discussed leading to the purpose of the thesis. The purpose is split into
three research questions and focus and delimitations are stated. Finally, the
authors present the structure of the thesis.
1.1. Introduction of ERP systems and VMI
An Enterprise Resource Planning (ERP) system is an information system that integrates all manufacturing and related applications for an entire enterprise. It is the most widely accepted technology for establishing electronic links and transmitting messages within short time (Leopoulos et. al, 2005).
During the last decades there has been a change in the business environment leading to extended ERP requirements. A focus on core competence and an increased usage of outsourcing have made supply chain collaboration a central issue. From being able to handle information flow within corporate boundaries the big challenge today is to extend ERP systems to supply chain partners (Zuckerman, 2005). A collaboration form that is increasingly used is vendor managed inventory (VMI).
In a VMI relationship the supplier is responsible for placing replenishment orders, not the customer as in the traditional case. The supplier has access to stock balance and expected consumption at the customer’s site and is responsible for the replenishment (Aronsson et al., 2003).
To illustrate this replenishment system in a VMI relationship an example of how water is replenished in a house can be used. When there is a need for water, the consumer turns on the tap and at the same time more water is replenished from the distribution line in the house, which is further connected to water reservoirs upstream. No orders are sent by the customer; the replenishment orders are placed by water suppliers upstream based on customer demand information. In Figure 1.1, a water tank model is shown, where the water level in this example corresponds to inventory levels at companies in any supply chain.

2
Figure 1.1: Water tank model of a VMI replenishment system (Holmström et al., 2003)
If the water replenishment service did not exist, the consumer would have to order a certain amount of water to be able to take a shower, do the dishes etc. The consumer would probably order an amount of water not corresponding to the actual water demand. The order variance amplification from the customer upstream in the supply chain is known as the Bullwhip effect and causes severe problems, explained more in detail in section 3.1.1. VMI creates visibility in the supply chain and the bullwhip effect can be reduced significantly as the supplier can react faster and replenishes based on actual customer demands. Companies implementing VMI can gain advantages in improved service levels, lower administration costs and decreased inventory levels.
1.2. Background Issues
Microsoft has developed an ERP system called Microsoft Dynamics AX, hereafter referred to as AX. This system is sold through partners who develop customer specific solutions based on the main system and implement it at the customer. The end customers are mostly small- and medium-sized companies. AX supports both distribution companies and manufacturing companies, but the primary customer segment for AX is manufacturing companies (Astrup, Oct 18, 2006).
Because of the fact that VMI is being increasingly implemented in companies Microsoft wants to have this functionality in AX. In version 4.0 of AX there is no VMI functionality and customers have to buy add on VMI solutions from

3
Microsoft’s partners. These solutions are customer specific and do not lead to competitiveness for Microsoft in the long run. Microsoft wants to have generic VMI functionality build into AX, why they have started a large project for implementing advanced trading functionality, including VMI. However, to fulfil special customer needs, customer specific solutions will still exist as add ons via partners (Lynnerup, Oct 18, 2006).
1.3. Purpose of the Thesis
The main purpose of this master’s thesis is to:
investigate how Microsoft could implement VMI functionality
in the ERP system Microsoft Dynamics AX.
1.4. Research Questions
The authors have found little prior research about VMI implementations into ERP systems. To be able to give recommendations to Microsoft the authors will conduct benchmarking case studies with its purpose of answering the following research questions:
RQ1: Why do companies implement VMI?
RQ2: What information needs to be transferred between the supplier and the customer and vice versa in a VMI relationship?
RQ3: How can the information be transferred between the supplier’s and the customer’s ERP system in a VMI relationship?
1.5. Focus and Delimitations
The authors will focus on customer needs for VMI and the conceptual design of the VMI implementation, Figure 1.2. These are the areas where Microsoft is facing the biggest challenge and the authors’ academic knowledge will contribute the most. In the detailed design, involving communication protocols and programming issues, Microsoft has well working procedures and the authors have limited knowledge in these fields. Thus, the detailed design will not be discussed in this thesis.
A VMI relationship can be studied both from the supplier’s and the customer’s point of view, where the supplier and the customer can be either manufacturing companies or distributors. Due to time limitations and limited

4
access to case companies the authors are focusing on manufacturing companies. These customers are the main market for AX, why the authors find this limitation justifiable. The VMI relationship is, however, studied from both the supplier’s and the buyer’s point of view, Figure 1.2.
Figure 1.2: Area of focus of the thesis
1.6. Target group
The main target group is employees at Microsoft Development Center in Copenhagen working with VMI implementation in Microsoft Dynamics AX.
A secondary target group is students with basic knowledge in Supply Chain Management. Furthermore, academic researcher studying VMI and ERP integration issues could benefit from reading this thesis.
1.7. Structure of the Thesis
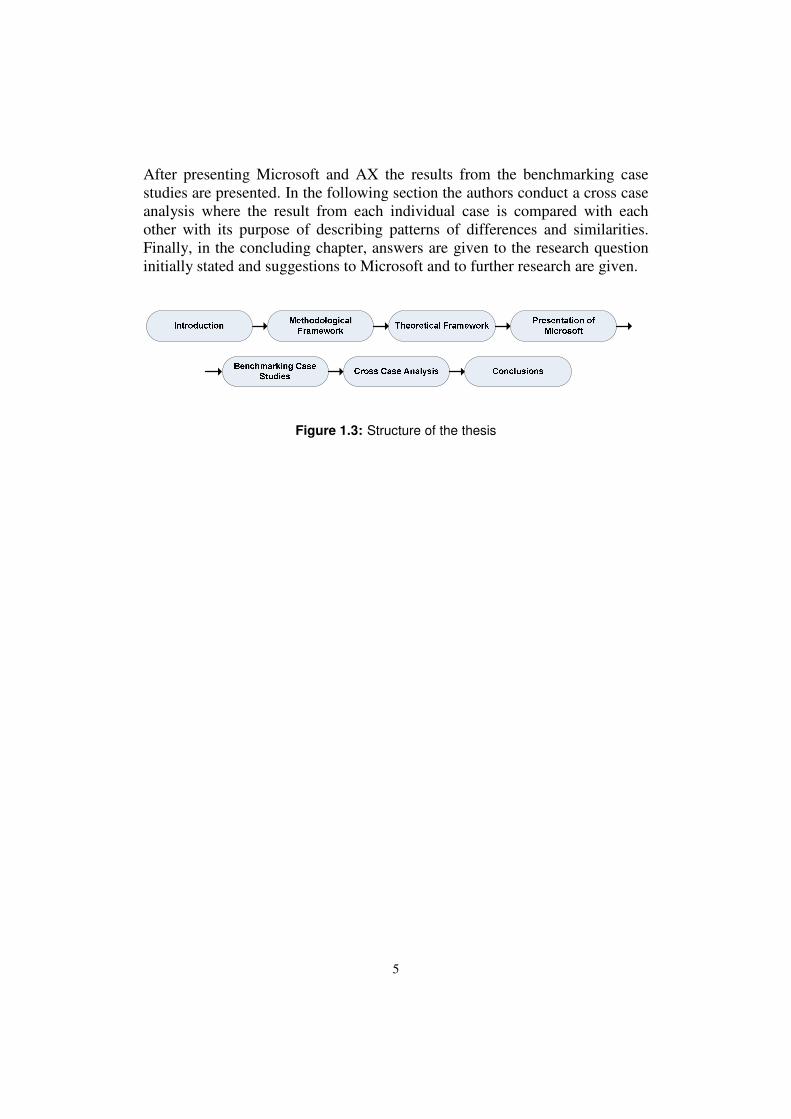
The structure of this thesis is presented in Figure 1.3. Initially the authors give an introduction to the background issues and formulate the purpose of the thesis. Thereafter the methods used in the research are presented. In the following section of the report the theoretical framework is presented which serves as a basis for the analysis together with the result from the case studies.
5
After presenting Microsoft and AX the results from the benchmarking case studies are presented. In the following section the authors conduct a cross case analysis where the result from each individual case is compared with each other with its purpose of describing patterns of differences and similarities. Finally, in the concluding chapter, answers are given to the research question initially stated and suggestions to Microsoft and to further research are given.
Figure 1.3: Structure of the thesis

6

7
2. Methodological Framework
In scientific research the methodological framework is crucial to give the
research its necessary credibility. It is also of importance to enable the reader
to value the results based on the authors’ scientific approach. This chapter
aims to define and present possible, as well as chosen, methods for this thesis.
2.1. Research approach
Arbnor & Bjerke (1997) present three methodological approaches; the
analytical approach, the systems approach and the actors approach, which are described in the subsequent sections.
2.1.1. The analytical approach
The analytical approach states that the whole precisely equals the sum of the parts; i.e. after recognizing different parts of the whole, the parts can be attached to get the total picture. Thus, the problem can be divided into smaller parts and solved individually. The analytical researcher seeks causal relations, i.e. one event must lead to another one. The more confirmed hypothesis involved in the process, the better the theory of reality becomes. However, the researcher needs a lot of data to confirm the theories and the process must follow a determined theory that either verifies or falsifies the data (Arbnor & Bjerke, 1997).
Furthermore, the theory is not dependent on individuals and the situation that is created, The analytical approach starts with facts and ends with facts. Another assumption implied in the theory is that objects do not change during time, or in such a way that it becomes impossible to explain the object by explaining the separate parts of the object (Arbnor & Bjerke, 1997).
The analytical approach emphasis simplicity; the researcher should be able to recognize and isolate the causing factors. By using objective and measurable factors, the analytical approach explains the social reality (Arbnor & Bjerke, 1997).
An example of how an implementation of the analytical approach would work in the real world is selecting people for a soccer team. According to the analytical approach, the single best goal keeper, the best forward etc. should be selected, not considering how they suit each other in a team (Arbnor & Bjerke, 1997).

8
2.1.2. The systems approach
In the systems approach, different parts are depending on each other. Thus, the different small parts cannot be added together to a whole to provide information. In this approach, a synergistic effect occurs stating that not only the small parts are of importance, but more significant how the parts are put together to a whole. To receive valuable and reliable information, the total picture must be considered more than in the analytical approach. In contradiction to the analytical approach, it is not possible to remove some parts of the system and still have the same behavior in the systems approach. The researcher seeks relations among focused forces and their results. The classification of the system is both changing and improving (Arbnor & Bjerke, 1997).
Furthermore, knowledge developed in this approach is characterized by systems and the behaviors of individuals are discussed in terms of systems. The systems are both changing and improving. However, with the systems approach the study does not result in an absolute theory and is hard to apply to another case. Though, the results can facilitate analysis of other similar cases (Arbnor & Bjerke, 1997).
Connecting the systems approach with the soccer example mentioned in the previous section, the relations between the players and the team as a whole is more important than the individual players. Hence, the best combination of players would be chosen instead of excellent individual performances as in the analytical approach. Additionally, the opponents and the playing field should be involved in the reflection, when using the systems approach (Arbnor & Bjerke, 1997).
2.1.3. The actors approach
The actors approach is focusing on understanding social contents and wholes instead of finding explanations. The researcher acquires greater knowledge about the social process by studying the individuals and their relations. The approach does not describe the reality as objective or independent, but as a social construction dependent on the individuals in it. The whole is comprehended via the actors and the social constructed reality consists of different levels with humans and reality in direct connection to each other. Reality is described in terms of how different people interpret, perceive and act.
According to Holme & Solvang (1997) the actors approach is appropriate if there is need for creativity and unpredictable events in the process. According to the systems approach, emphasis are on teamwork and exchange of actions

9
but the actors approach explain the whole based on the characteristics of the parts, not the characteristics of the whole. The knowledge gained in this approach is concentrated on the actors, i.e. depends on the individuals (Arbnor & Bjerke, 1997; Holme & Solvang, 1997). The actors approach stimulates to a deeper and more overall impression of the process and encourages the individual to create his own perceptions.
Once again, using the soccer team as an example of the approaches, the best team would consist of a set of leading actors with good technical skills combined with a desired attitude to the team spirit. Additionally, the players on the couch are included in the actors approach as they influence the social relations in the soccer team (Arbnor & Bjerke, 1997).
2.1.4. Research approach in this thesis
An analytical approach would take neither the totality of a company nor organizational behaviors into account. Furthermore, the actors approach emphasis the parts and not the whole, and is more focused on understanding individuals. Additionally, the actors approach is not giving explanations and thus not appropriate for a master’s thesis. With the systems approach, the authors can make use of qualitative data and draw general conclusions involving organizational behavior. Hence, the systems approach is the most appropriate for this thesis.
2.2. Research methods
According to Holme & Solvang (1997) there are two different ways of research approaches, the quantitative and the qualitative. Both aim to contribute to a better understanding of how people behave and react. The most important difference between the two approaches is how they handle numerical data and statistics (Holme & Solvang, 1997) but there are other differences as well (Saunders et al., 2000). In this thesis the authors also have to choose between the deductive method and the inductive method depending on how the use of theory will be carried out.
2.2.1. Quantitative method
In quantitative methods the overall understanding of the purpose is at focus. The quantitative method can be described as a linear series of steps moving from theory to conclusion, constructed as a research strategy that emphasizes quantification in the analysis and collection of data. Moreover, the quantitative

10
method is a search for indicators and depends on hard and reliable data (Bryman & Bell, 2003).
Information is transformed into numerical data and quantities and statistical analyses are based upon these data and quantities (Bryman & Bell, 2003). To be able to draw correct conclusions the collection of information must be made in a structured way. Furthermore, the quantitative method tries to standardize the research by separating the concrete information collection on the one hand and the development of theories and problems on the other hand. Additional knowledge that is gained during the research will not lead to any changes in the planning or structure. The strength of this method is the opportunity for standardization, e.g. all surveys have the same questions, and the result can be easily generalized and applied on more cases than in the qualitative method. However, there is no guarantee that the generalized information is relevant for the research purpose (Holme & Solvang, 1997).
2.2.2. Qualitative method
The qualitative method is a method that describes words rather than quantification of data (Bryman & Bell, 2003). As the quantitative method is based on structure, the qualitative one is characterized by flexibility and is a more open-ended research strategy. The interviews are more flexible, i.e. if a question is forgotten or is not understood, the question can be reformulated. The contribution of constantly new insights and understandings is an advantage with this method (Holme & Solvang, 1997).
Another advantage with the qualitative method is the contribution of a comprehensive picture of the situation (Holme & Solvang, 1997). In the qualitative method the interpreting of the information is at focus, e.g. motives and social connections, and the information is not suitable for transformation into numbers (Holme & Solvang, 1997). It relies on the meaning of action and investigating of people in natural environments (Bryman & Bell, 2003).
Though, the difficulty in comparing information from different interviews is a disadvantage and the found information may not be applicable on other cases (Bryman & Bell, 2003). Qualitative research methods often use deep personal interviews as a primary source and this result in criticism on the method for being too subjective, i.e. the qualitative findings rely too much on what is significant to the researcher. The lack of standard procedures leads to difficulty in replicating the observations and findings.

11
2.2.3. The inductive method
The inductive method implies constructing theories by using accurate knowledge and general law (Arbnor & Bjerke, 1997). Wiedersheim-Paul & Eriksson (2001) define the inductive method as when conclusions are made upon empirical data. A weakness with the inductive method is that it is seldom based upon all possible observations.
In the inductive method, the theory is the outcome of the research. Drawing generalization out of observations is at focus in the inductive process and these observations and findings will lead to a theory. The qualitative research process is connected with the inductive method since it is generating theories and outcomes (Bryman & Bell, 2003).
2.2.4. The deductive method
Arbnor & Bjerke (1997) define the deductive method as a logical analysis of what general theory states about a specific event tomorrow. The deductive method involves logical conclusions, e.g. geometrical solutions trained in school (Wiedersheim-Paul & Eriksson, 2001). It is also referred to as “the evidence” method due to the fact that the method derive (deduce) new hypothesis based upon earlier systems. The theory is never complete but by using empirical investigations the theory can be reinforced or weakened (Holme & Solvang, 1997).
In this method the researcher possesses a great amount of knowledge about the subject to devise a good hypothesis (Holme & Solvang, 1997). The known theory will lead to observations and findings; that is the reverse case of the inductive method where observations will result in new or changed theory. A weakness with the method is that only formulated hypothesis will be tested. The quantitative method is connected with the deductive method since both are testing theories (Bryman & Bell, 2003).
2.2.5. The abductive method
The abductive method is the third alternative method. This method is a combination between the inductive and the deductive methods and implies that the researcher can go back and forth between empirical data and existing theory. The abductive method allows the use of existing theory but at the same time see new relations in the collected empirical data (Wallén, 1996).

12
2.2.6. Research method in this thesis
According to Holme & Solvang (1997) there is no competitiveness between the quantitative method and the qualitative one, but it is of importance to choose the right method for the right situations.
In the quantitative method the emphasis is on measuring the extent of an opinion, an attitude or behaviour instead of measuring the character of it. In contradiction, the qualitative method entails detailed descriptions of situations, people, observed behaviour and direct quotations by people about their experiences and opinions. The fact that the qualitative method is based on interviews, documentation and observations is a motive for the use of the qualitative method in this thesis. However, some quantitative features, like standardized questions to facilitate the comparison, will be used in the thesis. Though, the questions will be open-ended and the overall interview will be more flexible and new knowledge and facts will be gained.
Depending on what data that will be collected from the benchmarking interviews, the thesis will have either a more quantitative or a more qualitative approach. After having conducted the benchmarking case studies, the data collected entailed descriptions and less numerical information. Thus, the data that lead to results and conclusions showed that the qualitative method has been used in this master’s thesis.
To answer the research questions the authors will study literature to seek information about VMI. This will be followed by interviews with people at Microsoft Development Center Copenhagen and at the case companies. The studied theories will be compared to the results from the benchmarking studies and finally results and conclusions will be presented. For these research questions, the deductive method is appropriate. Conversely, when giving suggestions to Microsoft, new generalizations were made and new models were drawn. Thus, the inductive method is appropriate in this part.
However, as mentioned earlier, the deductive and inductive method can be combined into the abductive method. This is the most suitable solution in this thesis as it includes both the inductive and the deductive approaches and the authors will alternate between using existing theory and generalizing new theory.
2.3. Research strategy
In this master’s thesis, case studies will be used as the research strategy. The authors have conducted benchmarking case studies at six different companies with its purpose of finding answers to the research questions and the purpose of this thesis.

13
2.3.1. Case Studies
Yin (2003) defines case studies: “A case study is an empirical inquiry that investigates a contemporary
phenomenon within its real-life context, especially when the boundaries
between phenomenon and context are not clearly evident (Yin, 2003, p. 13)”. Case studies are suitable for master’s thesis within logistics and procurement. Conducting case studies in this thesis was the most appropriate choice and therefore no other strategies will be presented. Furthermore, case studies work well with the systems approach and the holistic view of the system is at focus. Different aspects and point of views of a case can be considered (Yin, 2003).
Yin presents a case study method that will be used as the methodological approach in this thesis, Figure 2.1. As seen in the figure, at first, theory development should take place. Another prerequisite for a successful case study is to select cases and define what is to be investigated. Each case study will be studied individually and consists of a whole study and will be summarized in a report including significant information and conclusions. Each case’s conclusions are considered to be the information needing replication by other individual cases. Finally the individual cases will be compared and cross case conclusions will be drawn. Multiple case studies improve theory building by comparing two or more cases and hence achieving a better knowledge if the theory will or will not hold.
Figure 2.1: Case study method (Yin, 2003)
14
2.4. Data collection
There are two methods of collecting data for a thesis of this kind; primary or secondary data collection. The two methods differ due to the purpose of why the data is collected. The authors have focused on selecting data at interviews and studying literature.
2.4.1 Primary data
Primary data implies the process of collecting new data, i.e. collecting primary information. Primary information can be collected in three ways; direct observations, experiments and interviews (Arbnor & Bjerke, 1997).
The authors collected primary data from interviews with key persons at Microsoft Development Centre Copenhagen and at the interviewed case companies. The interviews was carried out through meetings using two standardized questionnaires, one for customer companies and one for supplier companies, which can be found in Appendix A. The standardized template was used to facilitate the comparison with the results from the different interviews. There have also been questions asked outside the standardized form to obtain as accurate information as possible. The authors chose open questions without fixed alternative answers to counteract that the respondents are biased by the questions and alternatives. Both authors have been present at all the interviews, further described in section 2.4.3.
2.4.2 Secondary data
Secondary data implies collecting previously collected information. This was mainly done by studying articles and textbooks. According to Arbnor & Bjerke (1997), secondary material is important for the systems approach used in this thesis, due to the comparison with other real systems.
When possible, the original source to the article has been found. The theoretical framework is mainly based on secondary data from articles and textbooks and the authors have considered that secondary data may not always be as objective as primary data. Validity and objectivity have been emphasized and protected by using accepted sources and databases, e.g. the “ELIN system” at Lund’s University and “Scholar Google”.
The authors have also studied a literature review about VMI to obtain understanding and gain knowledge about VMI and being able to describe appropriate purpose and delimitations.

15
2.4.3 Interviews
According to Holme & Solvang (1997) there are different ways to collect information; experiments, observation, surveys and analyses. In each case the structure and planning should be made before the collection of information starts. Moreover, Holme & Solvang state that surveys and interviews are the most common forms of investigations. According to Arbnor & Bjerke (1997) there are different ways of conducting an interview:
• Personal interview (face to face) • Telephone interview • Mail questionnaire • Group questionnaire
There are benefits and weaknesses with all four methods. A benefit with personal interviews is that the interviewer gets direct contact with the respondent and can easier study reactions and body language. However, the interviewer can save a lot of time and effort by conducting a telephone interview. The questions can be formulated in the same way in both cases. A questionnaire requires even less time, but has a weakness in limited information and flexibility.
Interviews can vary a lot in the format and degree of standardization. A standardized questionnaire has the same questions whereas a non structured interview implies a low degree of standardization. Furthermore, as mentioned in section 2.4.1 open questions imply no fixed alternatives while closed questions have fixed alternative answers for the respondent. The most extreme interview takes place in a free and easy manner with almost daily conversations between the respondent and the interviewer and includes a lot of qualitative information, which is, however, harder to interpret.
Emphasis in this thesis has been on interviews made at Microsoft Development Centre Copenhagen and selected case companies. Mainly, personal interviews have been conducted at each company with open questions to ensure that all essential information has been discussed. All questions were written before the interview so both the interviewers and the respondents at the companies were prepared.
The interviewed people at the case companies were all responsible for VMI at their companies. All interviews lasted about 2 hours and both the authors were making notes independently during the interviews. The templates can be shown in Appendix A and contained questions about VMI implementation, results and ERP solution. The interviews were documented on computers right after conducting the interview to maintain the reliability. Before starting the
16
cross case analysis, follow up questions were asked, either by e-mail or on the telephone. The companies were also asked if there were any misinterpretations or errors in the analysis and they were able to comment on confidentiality of the data.
2.4.4 Literature studies
There is little literature to be found regarding the integration of VMI in ERP systems. As mentioned in 2.4.2 literature studies present secondary data and knowing which literature is the most reliable and appropriate is almost impossible. The authors have also tried to put emphasis on maintaining objectivity through out the literature studies, further described in section 2.6.3.
Primarily, the authors have used scientifically databases as search engines. Most of the articles have been found by searching in the free electronically search engine at Lund’s University, the “ELIN-system” and “Scholar Google” by search words like e.g “VMI”, “Traditional Supply Chain”, “ERP system”,
“VMI + ERP system”, “VMI + Supply Chain collaboration” etc. Often the article found was based upon earlier articles and the authors have tried to find the primary source of the article to receive reliable information. The authors have also studied textbooks about VMI and supply chain management to conduct dependable and trustworthy information for the thesis.
2.5. Analysis
The collected empirical data from the benchmarking case studies are presented in chapter 5. In chapter 6 the authors present a cross case analysis where the results from each case study are compared with each other with its purpose of describing patterns of differences and similarities.
In chapter 7 the authors firstly answer the research questions initially stated based on the findings from the cross case analysis and the literature studies. Further, suggestions to Microsoft are given on how VMI functionality could be implemented in AX.
2.6. Credibility
To attain high credibility it is important to ensure that the sources are critically revised. Below the concepts of validity, reliability and objectivity are presented.

17
2.6.1. Validity
Validity is defined by Wiedersheim-Paul & Eriksson (2001) as the ability to measure what is determined to be measured. Thus, validity refers to the underlying data in the study; if the data is significant for the conclusions and coincides with the goals of the measurement (Holme & Solvang, 1997). The validity can be describe as how an investigation can be applied upon a remaining target group, e.g. if a complete implementation of VMI should be implemented in Dynamics AX (Widersheim-Paul & Eriksson, 2001). A technique for guaranteeing the validity is to reflect the thesis from as many angles as possible. To achieve this, the researcher should strive to be in the system for a long time, discuss with significant people and study as much secondary data as possible (Arbnor & Bjerke, 1997).
While writing this report, the authors have tried to confirm our conclusions and suggestions with both Microsoft and the interviewed case companies to ensure that the conclusions coincides with the purpose of this thesis. The last research question was revised in order to generalize the research questions and being able to provide suggestions to Microsoft.
One limitation in this master’s thesis is that the interviewed employee at the case company was not always able to answer all the questions in the template. This was often the case regarding the questions of ERP solutions and results after VMI implementation and in some cases, not all essential information could be collected.
2.6.2. Reliability
Reliability implies to the consistency of a measure of a concept; e.g. a questionnaire should give dependable and stable responses. Moreover, high reliability ensures that a repeated investigation should result in the same responses as in the first one. A system with high reliability should be independent on the investigator as well as the divisions (e.g. persons and organizations) that are examined. A low level of reliability always leads to low validity, whereas a high level of reliability is essential, but not a guarantee, for obtaining a good validity (Bryman & Bell, 2003).
To achieve high reliability a question form was prepared and sent out to the respondents before the interview. The questions were the same to all companies, but with one section only for suppliers and one section for customers. Furthermore, the interviewed people were able to report misinterpretations and errors made when the authors had conducted the benchmarking case studies. By asking control questions after the interviews
18
and questions that confirm each other at the interviews, high reliability was secured.
2.6.3. Objectivity
Another important aspect when writing a master’s thesis is to keep a high level of objectivity by collecting information without a preconceived notion. This can be achieved by always naming the reference where the information was gathered and state which parts are the authors own opinions and predictions (Bryman & Bell, 2003).
The authors have tried to uphold the objectivity by studying as many sources as possible to secure accurate information. At the interviews, the authors have tried to uphold the objectivity even though conducting six benchmarking case studies would unavoidably lead to some kind of prejudged opinions towards the end.

19
3. Theoretical Framework
The third chapter starts by introducing supply chain management and its
connection to VMI. First, the traditional order process and vendor managed
inventory will be described to enlarge the reader’s knowledge of the
differences between these concepts. Furthermore, essential information
needed for VMI and how the information can be shared is described. The last
part of this chapter describes ERP systems and how these can facilitate the
VMI implementation.
3.1. The traditional supply chain
A supply chain is a physical network in where different entities of material, cash and information are transferred. At the start of the chain, there is some kind of supplier providing raw material and the chain ends with the customer consuming what is produced. The material typically flows in a downstream direction and cash in the opposite, whereas information flows in both directions (Mattson, 2000).
The purpose of supply chain management is to satisfy customer requirements as efficiently as possible. The increased needs to respond quickly to market changes and customer needs have lead to companies along the supply chain becoming more dependent on each other. A result of the enhanced cooperation between the companies is supply chain management (Mattson, 2000). Supply chain management is the science of managing this process and has drawn increased attention in recent years when companies use their supply chain as a core competence (Yang et al., 2003).
Supply chain management integrates supply and demand management within and across companies. Information exchange is a precondition for building an efficient and effective supply chain. Since the introduction of EDI, electronic data interface, a key issue in improving supply chains has been the transfer of information between companies (Kaipia et al., 2002).
3.1.1. Problems with the traditional supply chain
Much waste and problems in the supply chain can be traced to the bullwhip effect. The bullwhip effect describes the amplification of demand variability from the customer back to the supplier. It occurs when information about the demand for a product gets distorted as it passes from one part of the supply chain to another (Yang et al., 2003). That is to say, a small change in the

20
demand from the end customers will result in a big demand changes for the supplier far upstream in the supply chain, Figure 3.1 (Disney & Towill, 2003).
There are five causes of the bullwhip effect; demand signaling processing, non
zero lead-times, order batching, price variations, rationing and gaming (Disney & Towill, 2003).
Demand signaling processing and none zero lead times refer to the high fluctuation in the supply chain that occurs when the upstream manager readjusts the demand received from the downstream operations (Lee et al., 1997). The fluctuations in the supply chain are also amplified when the supplier has to deal with irregular ordering, referred to as order batching (Lee et al., 1997).
Price promotions which results in price variations lead to the scenario that the selling does not reflect the consumption pattern; the buying quantities are often much bigger than the fluctuation of the consumption rate and contribute to the bullwhip effect (Lee et al., 1997).
The bullwhip effect also grows when orders are increased due to rationing and gaming by the suppliers when the demand is exceeded. The customers overstate their real needs, not by increase in consumption but because of anticipation. The pattern results in a vicious circle with misrepresentation of the demand signal (Lee et al., 1997). All these disturbances amplify upstream in the supply chain and the result is increased inventory stocks (Elvander, 2006).
When the customer places orders without regard to the impact on upstream partners, the performance of the entire supply chain is affected (Yang et al., 2003). Collaboration agreements between supplier and customer contribute to opportunities for reducing the impact of the bullwhip effect and creating a more proficient supply chain (Yang et al., 2003).
Vendor Managed Inventory (VMI) is a collaboration agreement stated to offer the most potential in reducing the bullwhip effect by removing the buyer entirely from placing the replenishment orders (Yang et al., 2003). Elimination of the bullwhip effect as a result of VMI implementations are also mentioned by Huang et al. (2005) and Disney & Towill (2003). VMI will be further described in section 3.2 and forward.

21
Consumption Customers Retailers Wholesalers Manufacturers Suppliers
Uncertainty
Demand
Figure 3.1: The Bullwhip effect (Lee & Whang, 2001)
3.1.2. The traditional order process
In the traditional supply chain an order is sent from the customer to the supplier when there is a need for replenishment, Figure 3.2. The customer decides when and how much should be delivered (Aronsson et al., 2003).
Figure 3.2: The traditional order process (Aronsson et al., 2003)

22
Each entity in the supply chain places production orders and replenishes stock without having any formal collaboration between the customer and supplier. The only information that the supplier has access to is the orders issued by the buyer. Traditionally, all involved entities must decide how much to order to satisfy the customer needs at their specific level in the supply chain, Figure 3.3 (Holmweg et al., 2005). According to Disney and Towill (2003) one problem in traditional supply chains is that each entity only has access to information about what the customer wants and not data on what the end customer actually is buying. This lack of visibility of the actual demand is often referred to as the
bullwhip effect, as discussed in the previous section (Holweg et al., 2005).
Order Delivery
PurchasingMaterial
planning
Material
demand
Available
material
Order
handling
Material planning/
Delivery planning
Manufacturing/
Picking
Packing/
Delivery
Customer
Supplier
Figure 3.3: The traditional order- and delivery process (Mattson, 2002)
3.2. The VMI order process
In Vendor Managed Inventory (VMI) the supplier is in charge of maintaining the customer’s inventory levels and generating the purchase orders, not the customer. The supplier has access to stock balance and expected consumption at the customer’s site and is responsible for the replenishment, Figure 3.4 (Aronsson et al., 2003). By implementing VMI the responsibilities for the supplier changes from preciseness and delivery times to availability and inventory turnover (Kaipia et al., 2002).

23
Figure 3.4: Vendor Managed Inventory (Aronsson et al., 2003)
A seen in Figure 3.5 below, the supplier is now responsible for some activities that used to belong to the customer. Thus, several working moments for the customer are being removed and are now under the responsibility of the supplier. The order processing at the customer is eliminated as the supplier now is in charge of creating the material and delivery planning (Mattson, 2002).
Delivery
PurchasingMaterial
planning
Material
demand
Available
material
Order
handling
Material planning/
Delivery planning
Manufacturing/
Picking
Packing/
Delivery
Customer
Supplier
Infromation
(in some
cases)
Figure 3.5: The order- and delivery process in VMI (Mattson, 2002)
The supplier decides the quantity to be delivered on the basis of information about sales, forecasts and stock levels from the customer. The buyer has to

24
guarantee a continuous flow of information to facilitate the supplier to put together realistic order proposals (De Toni & Zamolo, 2005). The information from the customer is used to develop strategies for which products should be supplied to maximize the profit, and the replenishment programs required to ensure that these products are consistently available to the buyer (Cottrill, 1997).
The information is the same that the customer’s staff had access to when they managed their inventory. The supplier sends order proposals to the purchasing and material planning departments at the customer, whereas the customer sends information about demand and inventory levels (Mattson, 2002). However, the customer is not totally released from his responsibilities, as the customer is responsible for setting the framework within which the system operates (Hines, 2000).
There are two ways to manage vendor managed inventories; manually and electronically (Aronsson et al. 2003).
3.2.1. Manually based VMI
In the manually based VMI the supplier gets access to the customer’s inventories. The supplier is responsible to inspect the inventory levels physically at regular occasions (Aronsson et al., 2003). Based on expected demand, the supplier refills the inventory (Mattson, 2002). This method is referred to as the “Breadman” principle since it is often applicable when bakeries deliver bread to grocery stores and replenish the inventories after requirements (Mattson, 1999). Moreover, manually based VMI is also applied to indirect articles in the business- and industry companies, e.g. replenishment of office supplies (Mattson, 2002).
The inventory can be owned by either the supplier or the customer. If the customer is the owner a maximum level of replenishment should be determined so no improper use will occur. In contradiction, the supplier is responsible for weeding out old products and inventing when the supplier is the owner of the inventory (Mattson, 1999). When the supplier owns the inventory, the customer becomes the owner when the item is bought and paid at the cashier in the store. The supplier gets paid on basis of consumed items since the last delivery. This process can be facilitated by using bar-code systems (Mattson, 2002).

25
3.2.2. Electronic based VMI
In the electronic based VMI the supplier receives electronic data with the customer’s sales forecasts and inventory levels. The electronic data is generally sent via EDI or via the Internet. When receiving the data the supplier is in charge of creating and maintaining the inventory plan (Aronsson et al.,
2003)
With this system the supplier can do almost the same activities as the employees at the buyer. The electronic based VMI has a main disadvantage; the supplier has to learn how to use the customer’s system and since each customer can have different systems this result in an extensive need for training for the supplier. However, using EDI the supplier can use his own business system to handle the inventory levels (Mattson, 1999). When using EDI the purchasing system of the customer is integrated with the order system at the supplier. One limitation with EDI is the requirement of computer synchronization, system adaptation and testing (Jensen, 2001). Different kinds of IT solutions are available, both online communication and batch-transmission of data, where EDI can be used (Mattson, 2002).
Electronic based VMI and information needed for the VMI process will be described further in section 3.4.
3.3. The VMI implementation
There are several important aspects regarding VMI that companies must consider before launching VMI. Initially, they need to have a motive for the VMI implementation. Benefits, disadvantages and pitfalls are other aspects concerning VMI that are essential to consider. In this section, these issues are discussed as well as agreements and suitable projects and businesses for VMI collaborations.
3.3.1. Purpose with VMI implementations
Hines et al. (2000) state two main reasons why companies initiate VMI implementations; reduced administrative costs (with maintained or improved inventory availability) and improved service level.
The motives for implementing VMI tend to be different depending on if it is the supplier or the customer that takes the initiative. According to a case study performed by Nolan (1997), increased inventory turns and eliminating redundancies were motives for the customer. The customer can initiate the

26
VMI implementation with the purpose of reducing inventory costs (Hines et
al., 2000).
However, the driver could also be the supplier who wants to secure long-term working relationships and become more attached to the customers (Hines et
al., 2000). The favorable cooperative situation as a main goal for implementing VMI is also mentioned by Huang et al. (2005). Furthermore, these authors state that many small companies must implement VMI to satisfy big companies.
Often, the supplier can identify specific product types or categories that can be improved. Improving the processes can also add value to the customer (Hines et al., 2000). Similar cost benefits, by identifying the most profitable items for the supplier to produce, are also mentioned by Nolan (1997). Furthermore, optimization of the planning of production and transport are stated by De Toni & Zamolo (2005) as motives for the supplier.
3.3.2. Potential Benefits and Disadvantages
There are a number of potential benefits for the supplier as well as for the customer with VMI collaboration.
Potential benefits for the customer
Generally, VMI contributes to a lower inventory level and reduction in storage space at the buyer (www.vendormanagedinventory.com, Oct 20, 2006). This will result in reduced risks of obsolescence and damage and the customer’s cash flow is improved (Hines et al., 2000). Furthermore, decreased administrative costs have been found in several case studies conducted by Hines et al, (2000), when a large number of formal transactions have been eliminated due to the VMI implementation.
According to a case study conducted by De Toni & Zamolo (2005), the VMI implementation provided significant advantages for all involved parts in the supply chain. The customer achieved immediate response to their customer’s various requirements, improved customer service, experienced fewer errors due to the elimination of paper documents and increased market visibility. Improved service by receiving the right product at the right time is also mentioned by Hines et al. (2000).
Improved planning and reduced re-planning are also potential benefits for the customer (De Toni & Zamolo, 2005; Nolan, 1997). The customer can schedule the arrivals of items when the supplier makes an advanced shipment notice. This planning facilitates efficient loading/unloading and contributes to reduced

27
costs (Nolan, 1997). Furthermore, VMI can result in better management of risks and opportunities and greater sales. Another benefit was found in satisfying the final customer in terms of time and volume (De Toni & Zamolo, 2005).
Potential benefits for the supplier
The supplier can benefit from the accurate information about the point of sales and stock levels provided by the customer and make better forecasts and organize the production to suit the demand. The information transparency and decision points elimination tend to make the demand more even and easier for the supplier to anticipate (Huang et al., 2005; www.vendormanagedinventory.com, Oct 20, 2006). Furthermore, VMI contributes to a reduction in the ordering errors for the supplier (www.vendormanagedinventory.com, Oct 20, 2006).
VMI allows the supplier to be more flexible, by being able to adjust the timing and quantities to suit his own situation and decide when to replenish (Hines et
al., 2000; Kaipia et al., 2002). The supplier can also react faster to changes in customer demand (Kaipia et al., 2002). This improved planning due to decreased insecurity is also mentioned by Småros et al. (2003).
The supplier can make better use of the inventory, reduce buffer stock and space and hence decrease the level of tied up capital. The close relationship between the supplier and customer evolves strategic benefits as the supplier is integrated with the customer’s procedures, education and investments. There are high investments and switching costs for the customer and this renders the entry for competitive suppliers and tie the customers towards them (Hines et
al., 2000).
Using VMI, the delivery service improves also for the suppliers’ other customers that are not engaged in VMI due to better possibilities for the supplier to plan his own production (Kaipia et al., 2002).
Potential benefits for both the supplier and the customer
There are also some dual benefits for both the supplier and the buyer. VMI often contributes to reduced data entry errors due to a higher degree of system-to-system-communication. The companies also experience improved speed of the processing. Furthermore, both supplier and buyer are interested in providing better service to the end customer and having the right product ready when the customer needs it contributes to improved service. Closer partnership between supplier and customer will be formed and hence both

28
parties are interested in a successful implementation (www.vendormanagedinventory.com, Oct 20, 2006).
There are also several potential disadvantages for the supplier as well as for the customer with VMI collaboration.
Potential disadvantages for the customer
A fully implemented VMI process requires the customer to share confidential sales and product demand data with the supplier (Cottrill, 1997). The customer must give sensitive information to the supplier and can feel a loss of control (Kaipia et al., 2002). The fear of loosing control is also mentioned by De Toni & Zamolo (2005). They state that among many customers the fear of loosing control was initially present and was a restraining element for implementing VMI in practice. The risk for sensitive data and information leaking out to competitors is present when the supplier also supplies a competitor (Hines et
al., 2000).
Often, the customer is dependent on one supplier. If the VMI collaboration entails single sourcing with the VMI partner, there is a higher risk for the customer due to increased dependency. VMI collaboration also requires expensive investments in business systems, and often the customer has to compensate the supplier for their investments (Hines et al., 2000).
Potential disadvantages for the supplier
Hines et al. (2000) state that when VMI is initiated by the customer, the supplier is likely to incur both increased administration and inventory costs if the inventory management burden is off-loaded to the supplier. These increased costs are likely to have negative effects on cash flow and liquidity. Moreover, the supplier may have to adjust their system to meet the customers’ demands; new investments, new systems and enlarged inventory (Hines et al., 2000). Holweg et al. (2005) state that VMI can result in enlarged safety stock and smaller production batches if the supplier must adjust its production to one customer. Accordingly, enlarged administrative work is required if different customers require different systems for VMI (Holweg et al., 2005).
VMI collaboration can result in increased responsibilities for managing the inventory due to a dominant customer (Hines et al., 2000) or if the customer is not willing to give relevant and necessary information (Waller et al., 1999).
Another disadvantage for the supplier is that there is no guarantee that the VMI implementation will be successful; Huang et al., (2005) state that the VMI process requires extra expenditure but no extra sales volume will follow.

29
3.3.3. The Agreement
The general agreement should consist of a legal interpretation with basic order agreements, forecasting accuracy with acceptable deviations, and rest inventory balance with restrictions regarding exceeded inventories. Furthermore, the agreement should contain information about product introductions/terminations. The agreement consists of two parts; one partner contract which handles business and legal matters and is different in each individual relationship and one part containing the logistical flow of articles (Elvander, 2005). The business agreement should contain:
• Information exchange in where the customer is responsible for providing the supplier with the right information. Besides information about what is sent, there should also be information about how and when the information is sent as well as how the information is confirmed and treated.
• Error handling and information about crisis management and how disorder in normal routines should be treated.
• Security aspects about information handling and confidentiality.
• People responsible for the information and their back-ups.
The logistical agreement should contain lead-time, max- and min- balance, minimum delivery amount and multiple quantities (Elvander, 2005).
Hines et al. (2002) present another general framework for what main parts should be included in the agreement:
• Operational constraints with max allocated storage space, demand and delivery profiles. The delivery profiles contain information about notification period, min batch size and delivery windows.
• Performance measures with information about service level including forecast demand and variation. Customer ownership with inventory levels and inventory turns should also be included.
• Responsibility regarding insurance, obsolescence and damage and deterioration.
• Termination criteria for the products in the VMI relationship.
30
3.3.4. Businesses and Products Suitable for VMI-collaboration projects
Initially VMI was created for the grocery sector in the beginning of the ‘90s, but has been extended to other sectors, e.g. household electronics, packaging products and cars (De Toni, 2005).
In a case study conducted by Nolan (1997) it is suggested that suitable products for VMI have predictable demand patterns, large volumes and low prices. Yang et al. (2003) state that products with stable and predictable demand are the most appropriate for VMI. Accordingly, De Toni & Zamolo (2005) argue that products with highly unpredictable demand and low reliability and information accuracy are not suitable for VMI. The authors state high sales volume, short distance between firm and sales company, high level of know how and advanced IT as conditions for a successful VMI relationship. In contradiction, Kaipia et al. (2002) describe in their simulation study that VMI is more suitable for low volume products than traditional frequent purchase orders.
Yang et al. (2003) suggests through their simulation study that VMI offers the greatest benefits when the supplier is restricted to a few high volume clients. Furthermore, a smaller retail network mitigates the effect of demand variability significantly. Yang et al. (2003) further state that small networks of the highest volume retailers may be the most suitable for a VMI partnership as the total supply chain inventory levels in their simulation study increased as more customers were connected. Restricting the VMI collaboration to a few high volume retailers may be the best strategy when the products have highly variable demand.
De Toni & Zamolo (2005) argue that many people state that suitable products for VMI implementations are standard products with steady demand and long life cycle, referred to as “functional products” by Fisher (1997). In contradiction, Fisher (1997) states that “innovative products” need a reactive supply chain due to the high uncertainty of the market and low life cycle that increase the risk of obsolescence and high costs. Furthermore, De Toni & Zamolo (2005) state the “innovative products” are dependent on replenishment based on actual needs and not by warped forecasts and these products thus would gain more advantages from the VMI process. Therefore, both functional products and innovative products can benefit from VMI.
To conclude, no general guidelines regarding suitable products and businesses for VMI relationships can be found in the literature.

31
3.3.5. Obstacles and pitfalls
According to Nolan (1997) the customer has to be very important to the supplier and the supplier central to the customer as well, in order to achieve a successful VMI collaboration. Huang et al. (2005) present two conditions necessary for a successful VMI implementation. Firstly, the status of the user inventory must be transparent to the supplier at all times. Secondly, there is a need for the operations to be in standard procedure and consequently managed by IT technology.
Cottrill (1997) states that a VMI implementation that should elaborate further and be successful requires senior management support if the system has not been used in the company before. To have a properly and successful VMI implementation all parties must be able to communicate using the same protocols. It is difficult to create a common language for the exchange of electronic information as companies often use different ERP systems (Cottrill, 1997).
The investments needed to build integration between partners, and reaching a critical trading volume are examples of obstacles for a VMI implementation. Many companies are reluctant to consider the benefits of collaboration and continue to show distrust in transferring responsibilities and sharing data (De Toni & Zamolo, 2005). Likewise, Kaipia et al. (2002) state that the lack of trust between companies and uncertainty about potential VMI benefits are difficult obstacles when implementing VMI.
3.3.6. How can you measure VMI profitability? – The total cost model
One way to measure profitability is by using the total cost concept, in where all costs affected by a certain decision are gathered. The total cost model is a useful tool for the management of the logistical processes, as cost reduction in one area can cause increased costs in another part (Aronssson et al., 2003). In figure 3.6 the elements of the total cost concept is presented.
Service Levels
Service level is defined as when the right product, in the right amount and at the right time and price is delivered to the customer (Christopher, 1992). The service level consists of three costs; pre-transaction elements, transactions elements and post-transaction elements (Aronsson et al. 2003).

32
Transportation costs
Transportation costs are all costs involved in the administration and execution of transports. Transportation costs is the single largest logistics cost (Aronsson et al., 2003).
Administration costs
Administration costs include costs of orders processes, forecasts, invoicing, payments of salary, economic follow ups and other information costs. The information flows has a direct impact on the costs and efficiency throughout the logistic system (Aronsson et al. 2003).
Inventory costs
Inventory costs are costs related to the stored products but also for tied up capital and waste (Aronsson et al. 2003).
Production costs
Production costs are production preparation costs, capacity lost due to changeover and material handling, scheduling and expedition. Productivity, machine utilization and throughput time are efficient measurements for production costs (Aronsson et al. 2003).
Figure 3.6: The total cost model (Aronsson et al., 2003)

33
3.4. Information sharing
According to Christopher (1992) successful companies have one thing in common - the use of information and information technology (IT). Furthermore, Christopher (1992) states that information has always been important to efficient supply chain management, but today companies are using information sharing as core competence.
3.4.1. Information needed in a VMI relationship
Information transparency is unregulated access to relevant data across the supply chain, e.g. demand profiles, inventory levels and production forecasts, to counteract sub- optimized parts of the production as a result of ineffective communication (Hines et al., 2000).
Information transferred from the customer to the supplier is statistics on consumption, forecasts, balances and information about planned campaigns. In the opposite direction, planned replenishment orders and notifications on incoming deliveries are sent from the supplier to the customer (Mattson, 2002).
De Toni & Zamolo (2005) state in their case study that the exchanged information between the supplier and customer can be divided in three time horizons: long-term information, mid-term information and short-term information, Figure 3.7.
Historical data
Yearly forecasts
Monthly
Forecasts
Customers
orders
Assembling plans
BUDGET MONTHLY
FORECAST OF
SUPPLY
DELIVERY PLAN
EXCHANGED INFORMATION
Mid term Short termLong term
Figure 3.7: Exchanged information divided into three time horizons (De Toni & Zamolo, 2005)

34
Historical data and sales forecasts selected on the basis of the seasonal nature of the market, production capacity and bill of materials are included in the long term information. The budget is also included in this information category and contains forecasting data about supply for each component with relation to the whole following year. With this information, the supplier experiences the seasonal changes at the factory and knows when critical times will occur. However, VMI requires extra time for the supplier as he must compare the data of required production with his own production capacity to come to a decision regarding own investments and productions.
The mid term information contains the re-setting of forecasts based on actual market trends. Long term yearly data is delivered each month to the short-term management. The data related to each month is updated week by week. The suppliers can take advantage of this information and plan their own production capacity based on the customer’s requests.
The short term information is data based on real quantities of produced and sold items, orders received and bills of materials that are updated each week. This data, usually transmitted by EDI, is used for the daily check of target stock, replenishment need and updating of the delivery plan (De Toni & Zamolo, 2005).
As an example of information needed in a VMI relationship, a system of EDI messages is presented by Hall (2001) and on the homepage www.vendormanagedinventory.com (20 Okt, 2006). According to Hall (2001) there are three EDI transactions at the heart of the process. The first is the Product Activity Record (#852), which entails information about inventory levels, product activity and sales at the customer. Based on this information the VMI software calculates the need for an order and sends a Purchase Order to the supplier (#850). To inform the customer what to expect from the supplier, a Purchase Order Acknowledgement (#855) is sent, Figure 3.8.
VMI
SoftwareSUPPLER CUSTOMER
#855
Purchase Order
Acknowledgement
#850
Purchase Order
#852
Product Activity
Figure 3.8: EDI messages in a VMI process

35
After the purchase order acknowledgement, there are several additional EDI messages sent between the supplier and the customer, Figure 3.9. An Advanced Shipping Note (#856/857) is sent by the supplier just before the shipment containing information about the shipment. Furthermore, the customer sends a Receipt Advice (#861) to tell the supplier what was actually received. Finally, the supplier sends an Invoice (#810) and receives a Payment/Remittance Advice (#820).
Figure 3.9: EDI messages in a VMI process
All the signals are described more in detail in Appendix B.
3.4.2. Online and offline communication
In online communication, the one who is sending information is in direct contact with the receiving part during the whole information exchange. The supplier is connected via the Internet or telephone to the customer’s ERP system (Mattson, 2002). An online IT solution is preferable when there is need for real time- and/or complementary information in the system. However, a disadvantage with this solution is that the supplier must learn and control the customer’s system, and as each customer often have different systems this result in an extensive need for training for the employees at the supplier. If the supplier is collaborating with many customers, this IT solution can be
36
complicated, particularly if the customers have own ERP systems and not simplified planning systems (Mattson, 2002).
In offline communication, the sender and receiver are not in direct contact with each other during the information exchange; the information transferring is separated from the information processing. An example of offline communication is when an order is sent to the supplier via mail or via fax. The information processing activities are handled step by step, often by using batch-transmission (Mattson, 2002).
3.4.3. Communication methods
There are several different methods to communicate information between the systems and employees at companies and the most important methods are presented in this section.
E-mail is an off-line communication method where the information is transferred from one system to a receiving system via the Internet. The information is not sent in a structured form and thus cannot be interpreted by the receiving system. However, e-mail can be used to send automatically reminders about payments to the customer from the supplier’s ERP system. This can be a compliment to the more advanced and expensive EDI applications. Another advantage with e-mail is that attachments can be added which can be read by the ERP systems (Mattson, 2002).
EDI
EDI, Electronic Data Interchange, involves transferring of data by batch transmission between two computer systems in a standard format which can be interpreted and processed by the receiving system. Both systems must use the same standards for communicating and processing information. A file with information is generated in the sender’s ERP system and is translated by special EDI software into the Edifact standard format. Afterwards, the file is sent to the receiving system and is converted to a format used in this system and updated in the ERP system with a batch-program (Mattson, 2002). EDI offers data security and compatibility with legacy data systems.
EDI is appropriate when the company exchanges large amounts of information at frequent occasions. EDI requires both large investments and advanced IT competence and is mainly used at large companies. To facilitate for large

37
companies to communicate with smaller companies a combination of EDI and the Internet, web-EDI systems, have been developed. By using the web-EDI system each company can work with the existing technology at their company. A web browser is sufficient for smaller companies whereas larger companies can work with full system integration in their ERP systems (Mattson, 2002). Schary & Skjott-Larsen (2003) state that many companies use EDI when needing a high level of security and the Internet for more general communication.
XML
XML, eXtensible Markup Language, is a Meta language that can solve data interchange problems by identifying data files and tag them so they can be interpreted by different systems. Automated translation services between EDI and XML are provided by some suppliers (Schary & Skjott Larsen, 2003). XML can also be used to send structured information via the Internet and provides greater flexibility than EDI as the information is build up by contents and quibbles that you can define by your own (Mattson, 2002). Smaller firms often use XML instead of EDI because of the lower cost and higher flexibility (Schary & Skjott Larsen, 2003).
Internet
The Internet is a public and international network consisting of local networks communicating with common protocols. Internet provides on-line communication, like exchange of information on different homepages. In comparison with EDI, web based communication is available between human beings and companies. Today, web based communication is the dominating on-line communication method but has disadvantages, e.g. security problems in the information transferring (Mattson, 2002). Schary & Skjott Larsen (2003) state verification of sources to enable transactions, transmission and authentication of digital documents concerning contracts as other problems but that there is currently undergoing developments within these areas.
3.4.4. Communication types
In all communication between companies in the supply chain the information sharing can be performed either by humans or by systems. Mattson (2002) has identified four main communication types: human-to-human-communication, human-to-system-communication, system-to-human-communication and system-to-system-communication.

38
Human-to-human-communication
This is the simplest form of communication, where a human being is communicating directly with another human being without any system interface. Examples of this type of information sharing are telephone, mail and fax. E-mail can also be considered human-to-human-communication even though computers are used for sending and receiving the information. The reason for this is that the information sent is not readably for systems, without human interaction.
Human-to-system-communication
In this type of communication a human being is sending information which is readable for a system. This is an on-line type of communication, e.g. when a customer is registering an order in the supplier’s ERP system via an interface. The communication exchange is often interactive as the user receives continuous information from the system about what information is received, if it has been typed in correctly etc. However, today the online interactive process is often done with a temporary transaction database and the actual update of the database is done off-line with batched information. The reason for this is that the system is blocked for new incoming information during the update of the database. In large systems this results in unacceptable response times. Another reason is security reasons, especially when the information is sent via the Internet. The one typing in the information often does not notice the difference as long as the update of the database is performed right after every transaction. However, if the update is done at certain intervals, the information visible to the human being is not always the correct information which can lead to problems.
System-to-human-communication
In the third type of communication presented by Mattson (2002) the human being is also communicating with a system but this time the system takes the initiative to the information exchange. An example of this is an ordering point system where the supplier is responsible for the replenishment. At the re-ordering point, the customer’s ERP system automatically sends a message to responsible planners at the supplying company, for example by generating an e-mail. This message can be sent separately for every product at the re-ordering point or at certain intervals for the products which have reached the re-ordering point during the interval.

39
System-to-system-communication
When two systems are communicating with each other the on-line communication can be either interactive and transaction oriented or batch oriented. An example of the interactive and transaction oriented system-to-system communication is when a system at one company is reading information in one system and writing in the other during information processing. In batch oriented communication information is sent between the systems in batches at certain intervals, e.g. by EDI messages.
3.5. ERP systems
An Enterprise Resource Planning (ERP) system is an information system that integrates all manufacturing and related applications for an entire enterprise. It is the most widely accepted technology for establishing electronic links and transmitting messages within short time (Leopoulos et al., 2005).
Understanding the history and evolution of ERP is essential to understand its current applications and its future. In the subsequent section a brief historical background of the ERP development is given.
3.5.1. History of ERP
During the first half of the 20th Century companies could afford to keep inventory on hand to satisfy customer demand. The normal purchasing policy was a reorder point system where the assumption was that the customer would continue to order what they had ordered before and that the future would look very much like the past. However, this changed and a need for ordering only what was really needed arose. This was an impossible task to carry out by using a manual planning system and huge card decks with information. A computerized system was developed during the 1960s and 1970s which was called MRP (Material Requirements Planning). George Plossl, one of the fathers of MRP, describes MRP as a system which “…calculates what I need, compares it to what I have, and calculates what I need to go get and when”. Productivity and quality improved in the companies which effectively implemented MRP and the accompanying tools. The inventory asset was significantly reduced and cash flow improved as a result (Ptak and Schragenheim, 2000).
As more companies were adopting the new material planning methodology they realized that something important was missing. Not only did you need all the parts to get the job done, you also must have capacity to get the job done. Closing the loop with a capacity plan required extra mathematical calculations,

40
but since computers were increasing in power and decreasing in price the implementation could be done. However, new requirements arose with the realization that as every piece of inventory moved, finances moved as well. The power and affordability of available technology was able to track this inventory movements and financial activity. This new integrated system was called MRPII (Manufacturing Resource Planning) and closed the loop not only with the financial accounting system but also with the financial management system. Now all resources of a manufacturing company could be planned and controlled and companies quickly realized that to be competitive there was a requirement for this centralized communication system (Ptak and Schragenheim, 2000).
During the late 1980s and early 1990s the next shift came as “time to market” was getting increasingly shorter. The service level that was considered world class only a few years earlier was not good enough anymore as lead times had to be shortened. Customers were demanding to have their products delivered when, where and how they wanted them. This resulted in adoptions of the philosophies of just in time (JIT) and supplier partnerships as a way to remain competitive. Competitiveness and profitability was something that not only the production department focused upon. All enterprise resources had to be aligned to those goals and integrated in their approach to reach the corporate objectives. No longer could departments launch things over the wall to the next department. Integrated resource management became the focus for a competitive company (Ptak and Schragenheim, 2000).
In order to make good business decisions information was quickly needed at the decision makers’ fingertips. New technology made it possible to replace the large inflexible mainframes by new client-server technology. It was now possible to run a fully integrated MRPII system on a small personal computer which made it possible for even the smallest companies to implement the system. Enterprise Resource Management was now on the scene. The ERP systems include all the critical business issues for the enterprise which opened the door for non-manufacturing companies who wanted to become more cpmpetitive by best utilizing their assets, including information (Ptak and Schragenheim, 2000).
3.5.2. ERP
The ERP system is a software system which facilitates transparent integration of modules, providing flow of information between all functions within the enterprise in a consistently visible manner (Hossain et al., 2002). According to Davenport (1998) an ERP system can consist of functions within four different

41
main modules: Financials, Operation & Logistics, Human Resources and Sales and Marketing, Figure 3.10.
Implementing an ERP system can improve organizations’ functionalities, but this does not happen over night. The all-around cost savings and service improvements is very much dependent on how well the chosen ERP system fits into the organizational functionalities and how well the tailoring and configuration process of the system match with the business culture, strategy and structure of the organization (Hossain et al., 2002).
Figure 3.10: Module overview of an ERP system (Davenport, 1998)
3.5.3. Extended ERP
During the last decades there has been a change in the business environment leading to extended ERP requirements. A focus on core competencies and an

42
increased usage of outsourcing have made supply chain collaboration a central issue. From being able to handle information flow within corporate boundaries the big challenge today is to extend ERP systems to supply chain partners (Zuckerman, 2005).
An extension to supply chain management (SCM) and customer relationship management (CRM) enables effective multi-party relationships between the organization and its suppliers and customers, Figure 3.11. Adoptions of business-to-business (B2B) solutions are seen by many as the wave of current end future extensions of traditional ERP systems. Front-end Web-based Internet-business applications can be integrated with back-office ERP-based applications, enabling business transactions, such as order placement, purchasing and inventory updates, to take place between the customers, suppliers and the enterprise based on reliable, relevant data and applications instantly in a border-less domain. Extended ERP solutions are available from most of the ERP vendors (Hossain et al., 2002).
Figure 3.11: Extended ERP (Chen, 2001)

43
4. Presentation of Microsoft
In this section, the corporation and organization of Microsoft will be
introduced. Furthermore, Microsoft Development Center in Copenhagen will
be presented as well as its products and customers.
4.1. Microsoft Corporation
Microsoft was founded in 1975 by William H. Gates and Paul Allen. Microsoft does research, develops and sells software and hardware to institutions and organizations as well as to private customers. The head office is located in Redmond, Washington, in the United States. Today, Microsoft is a world wide corporation with over 60,000 employees in more than 100 countries. Besides the head office in Redmond, Microsoft has research centres in Beijing (China) and Cambridge (Great Britain). Microsoft also have different development centres and the largest one in Europe is located in Copenhagen, described further in section 4.2.
Microsoft serves their customers within three core business divisions:
• Platform Products and Services Division: Includes the Client Group, the Server & Tools Group and the Online Services Group
• Business Division: Includes the Information Worker Group, the Microsoft Business Solutions Group, and the Unified Communications Group
• Entertainment and Devices Division: Includes the Home & Entertainment Group and the Mobile & Embedded Devices Group
This master’s thesis investigates how VMI can be implemented in Microsoft Dynamics AX, which is a part of the Microsoft Business Solutions Group and thus under the Business Division. Microsoft Dynamics AX will be further described in section 4.3 (www.microsoft.com/About/CompanyInformation/ourbusinesses/business.mspx).
4.2. Microsoft Development Center Copenhagen
Microsoft Development Center Copenhagen (MDCC) is located in Vedbaek, just north of Copenhagen, and is Microsoft’s largest development center in Europe. MDCC has 900 employees from more than 40 countries and was

44
established in 2002, following the acquisition of the Danish company Navision.
MDCC develops a range of business management systems for customers all over the world and aims to become the world’s leading software development center for business solutions. MDCC’s goal is to develop simple and flexible business solutions which allow Microsoft’s partners to optimize the customers’ business processes. Microsoft has several ERP systems in which MDCC focuses on a continuous innovative and focused development and product management. The ERP systems allow businesses and organizations of all sizes to integrate all manufacturing and related applications. One of these ERP systems is Microsoft Dynamics AX (www.microsoft.com/danmark/om/presentation.mspx).
4.3. Microsoft Dynamics AX
Microsoft Dynamics AX (AX) is an integrated, adaptable business management solution that facilitates for companies exchanging documents electronically. It is a global solution that provides built-in, multi-site, multi-language and multi currency capabilities for more than 30 countries. The design facilitates new languages, sites and local functionality to be enabled easily.
AX works with other Microsoft products and has the same Microsoft-standard user interfaces. AX can automate business processes, eliminate data re-entry and improve decision making. There are different functionalities in AX that facilitates the business decisions e.g. supply chain management, manufacturing, distribution, financial management and customer relationship management, just to mention a few.
AX provides a layered architecture so the customers can customize one layer without affecting the functionality in other layers. Industry-specific solutions can be added to AX by a variety of partners and independent software vendors. AX integrates with other Microsoft technologies like Microsoft SQL Server 2005, and offers high-speed server-side performance. There is also an object-oriented architecture in AX that can scale up to support large distributed businesses, or scale down to support smaller companies (http://www.microsoft.com/danmark/dynamics/ax/product/overview.mspx).
45
4.4. Customers and partners
Most of the AX customers have 300-500 employees, but there are customers that have both more and fewer employees. Generally, the functionality of AX is better adapted for larger companies, whereas Microsoft Dynamics NAV is better suited for smaller companies. Microsoft Dynamics NAV (formerly Microsoft Navision) is a solution for growing small and midsize companies that can support customization and add-in-software to meet specific needs. Microsoft aims to provide solutions to companies of different sizes, but believe that the concentration will be on enterprise companies (Lynnerup, Feb. 20, 2007).
Microsoft cooperates with different partners and together with these Microsoft programs are developed and marketed. The partner helps the customer by implementing the solution.. All partners sell different kind of Microsoft products and the partner has to apply for selling a certain product (www.microsoft.com/danmark/om/presentation.mspx).

46
47
5. Benchmarking Case Studies
In this chapter all empirical findings and collected data from the case
interviews are presented. Firstly, the four suppliers are presented followed by
the two customers.
5.1. SCA Packaging
On November 21, 2006, the authors visited SCA Packaging in Randers, Denmark. An interview was conducted with Gitte Paulsen, project manager SCM/VMI. If nothing else is stated, the information in this section is based on this interview.
5.1.1. SCA Packaging
SCA, Svenska Cellulosa Aktiebolaget, was founded in 1929 and is today a global consumer goods and paper company that develops, produces and markets diapers, tissues, sanitary towels and packaging solutions for dairies. SCA had a turnover of 10.4 million Euros in 2005 and the company has about 50,000 employees in over 50 countries. SCA has 15 % of the European market share for paper and 14 % corrugated card board paper. In Denmark, 22 % of SCA’s market is for dairies (www.sca.com/en/About_SCA/SCA_in_Brief/, Nov 24, 2006).
5.1.2. VMI at SCA Packaging
One of SCA’s major customers is the dairy company Arla, and today Arla is the only company in Denmark SCA has VMI collaboration with. Arla has been a customer to SCA for a long time and is the dominating dairy in Denmark. Due to customer demands from Arla, who required a reduced inventory level, SCA started to implement VMI. Even though Arla made the decision to start the VMI implementation, SCA saw opportunities to gain advantages in a strengthened and closer relationship with Arla. Moreover, SCA wanted to improve their productivity by implementing VMI. SCA also wanted to improve the demand planning which would result in SCA knowing when to produce and deliver. Long term goals for SCA are to increase the number of customers involved in the VMI process. Having a larger share of VMI customers would lead to better possibilities to plan their production. 22 % of the total production at SCA is for dairies and today, 20 % of the dairies

48
are integrated within VMI, that is to say 4.4 % of the total production at SCA is included in the VMI process.
SCA and Arla have an interface solution called SMART in their VMI collaboration. The purchasing orders and material demand at Arla and the internal sales at SCA are now eliminated and integrated within SMART, Figure 5.1. SMART will be described further in section 5.1.4. SCA has worked with manual VMI with Arla before introducing SMART. Today, SCA still has manual VMI with some customers where SMART cannot be implemented, e.g. for the egg industry, where it is difficult to make a prognosis.
Figure 5.1: Eliminated processes in SCA’s supply chain
The pilot project started in December 2004 with one dairy and a limited number of products. In May 2006, the SCA factory in Grenaa, Denmark, had VMI collaborations with five dairies delivering approximately 600 products. SCA states that the overall implementation time was estimated at 3-6 months. SCA produces everyday commodities for consumption, and the demand patterns of their products differ. The products differ in terms of season (e.g. ice cream, cacao), variation from customers (e.g. sour cream) and production time. Moreover, on some products, the demand notice is one to two weeks, while some products have a demand notice of 24-48 hours before production. Generally, Arla often changes the color and labels on the packages and a result of this is that SCA tries to avoid large inventories as the products often changes.
When introducing the VMI concept at SCA, the reactions differed. The sales department was positive and saw great advantages, quite contrary to the people in the production. The implementation required a lot of time to achieve
49
a stabilized system and to reduce information errors that occurred in the beginning.
SCA owns its inventory and the products until they are received at Arla. Furthermore, SCA states that major risks with the VMI implementation occur when the system shuts down and the data cannot be read. Another problem is when the data is incorrect.
5.1.3. Result of the VMI implementation
SCA believes that the VMI implementation has increased the service levels towards Arla. Arla’s inventory has decreased sharply as they know the number of products to expect at the delivery. The sales volume has decreased initially, but SCA believes that the sales volume will stabilize in a year.
Before implementing VMI at SCA, they worked with EDI and normal make to order. When launching the VMI implementation, more order processes were required but today it is about the same amount as before starting the VMI process. Invoices are handled automatically in the ERP system and are not affected by the VMI implementation.
Regarding the inventory levels, no changes have occurred at the raw material. The inventory of finished goods has increased remarkably; today the goods are 17 days in inventory compared to between 0 and 1 day before the VMI implementation. However, SCA states that they need to maintain the 17 days level.
New set ups in the production have resulted in that both the productivity and the machine utilization has decreased and the throughput time has increased. The number of transportations has increased and sometimes SCA is required to deliver every day. However, there is a span with a minimum and maximum number of articles that each transport should contain, which facilitates the flexibility for SCA. Arla can gain advantages in less transportation as it requires time to control each delivery that arrives at Arla.
5.1.4. ERP integration
Both SCA and Arla use SAP R/3. SCA will only collaborate with customers that have the same ERP solution. The VMI process is integrated into SAP R/3 and the information flows between the two companies via SMART. The SMART system was developed by PipeChain whereas SCA’s E-business department in Brussels developed the system implementation at SCA. The implementation cost was about 30,000 Euros per dairy, and took 3-6 months to
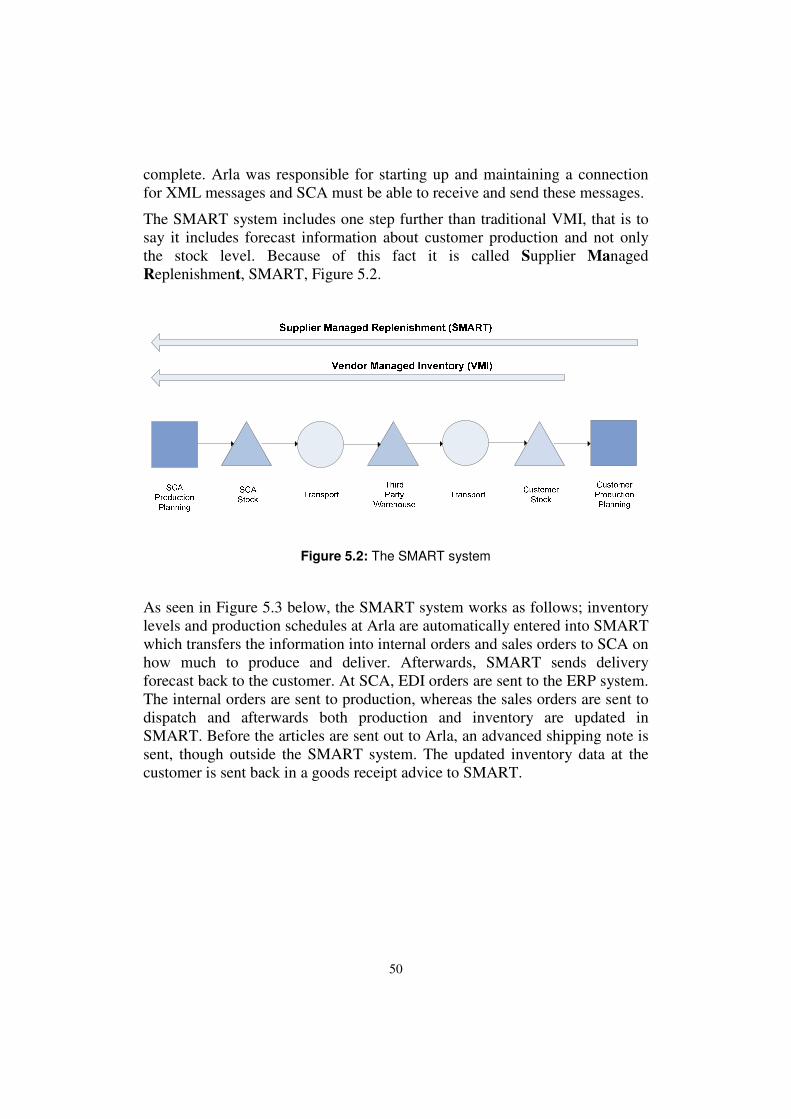
50
complete. Arla was responsible for starting up and maintaining a connection for XML messages and SCA must be able to receive and send these messages.
The SMART system includes one step further than traditional VMI, that is to say it includes forecast information about customer production and not only the stock level. Because of this fact it is called Supplier Managed Replenishment, SMART, Figure 5.2.
Figure 5.2: The SMART system
As seen in Figure 5.3 below, the SMART system works as follows; inventory levels and production schedules at Arla are automatically entered into SMART which transfers the information into internal orders and sales orders to SCA on how much to produce and deliver. Afterwards, SMART sends delivery forecast back to the customer. At SCA, EDI orders are sent to the ERP system. The internal orders are sent to production, whereas the sales orders are sent to dispatch and afterwards both production and inventory are updated in SMART. Before the articles are sent out to Arla, an advanced shipping note is sent, though outside the SMART system. The updated inventory data at the customer is sent back in a goods receipt advice to SMART.

51
Goods Receipt AdviceGoods Receipt Advice
Internal Sales and or Production
Planning
Production
Dispatch
Customer
Production Planning
Inventory
Production Planning
Inventory
Delivery ForecastDelivery Forecast
Internal Order
Sales Order
Internal OrderInternal Order
Sales OrderSales Order
Advanced Shipping NoteAdvanced Shipping Note
1 – Internal Order
2 – Sales Order
1
2
1 – Internal Order
2 – Sales Order
11
22
Figure 5.3: The Information in the SMART system
SCA finds the information provided by Arla sufficient and relevant. However, the information is not always accurate. This is often a result of changed information and planning by the customer when the production already has started at SCA. However, failures can easily be traced in SMART.
5.1.5. VMI in the future
The VMI collaboration contributes to visibility throughout the whole supply chain. SCA has gained advantages of perceiving the forecasts with planned consumption and therefore the number of urgent deliveries has decreased. The risk for obsolescence of the products will be minimized as SCA can plan its production based on the forecasts in SMART.
Among the disadvantages with the VMI implementation, the long implementation time and the expensive systems required are mentioned in previous sections. Furthermore, the VMI implementation makes great demands on both the customer’s ERP system as well on its IT department. To keep the data discipline on a high level is crucial for the result. Many of SCA’s customers still have manual VMI since SMART cannot be implemented at all companies. As mentioned in section 5.1.4 SCA will only start VMI collaboration if the customer has the same ERP system. However, a
Customer

52
light version of VMI with only a file with information is brought up for discussion.
One of the major risks with the VMI implementation is that if the system crashes or failures occur, the data will be incorrect. Both inaccurate forecast data and inadequate stock control would make the traditional supply chain more appropriate than vendor managed inventory. To handle these risks, SCA will improve the data discipline and process understanding. SCA states that they could profit more from the VMI relationship if more customers were involved in the process. This could result in that the production could be better adjusted to the VMI system and SCA could profit more from the VMI collaboration. More customers involved in the VMI process would also result in the information being better utilized.
One of the major problems is translating the forecasts into schedules for the producing machines. Today, SCA is only 5 days ahead of notice before they have to start producing the VMI products; 30 days on other products. APO, Advanced Planning Optimization, is about to be implemented at SCA which hopefully will make this problem less. Forecasts from the customers will be an input in APO which will calculate production capacity requirements.
When having implemented 50 % of the dairies SCA will reach the break even point. SCA has no intentions of involving any other companies but dairies in VMI relationships.
5.2. CEPA Steeltech
On November 23, 2006, the authors visited CEPA Steeltech’s site in Lund. An interview was conducted with Peter Nielsen, Local Manager. If nothing else is stated, the information in this section is based on this interview.
5.2.1. CEPA Steeltech
CEPA Steeltech (hereafter referred to as CEPA), until recently known as Steelpress Lund AB, has acquired parts of VILAS (Västman Invest Laserteknik AB) in Ludvika and formed CEPA Group. CEPA Group is family owned and has ca. 50 employees in Lund and has an estimated turnover of 65 Million SEK for 2007. They are specialized in steel shaping and deliver parts to European manufacturing companies, like Alfa Laval, ABB Motors and Haldex (www.cepa.se, Nov 25, 2006).

53
5.2.2. VMI at CEPA Steeltech
Alfa Laval in Lund launched a pilot VMI project with five suppliers in November 2005. CEPA was one of those suppliers and selected 40 articles suitable for this project. The project was initiated by Alfa Laval and CEPA had more or less no choice than to join the project. However, CEPA saw advantages in working closer to the customer and making it harder for the customer to change their supplier. Their long term goal is to reduce cost and become more competitive by more efficient production and lower transportation cost.
CEPA has access to Alfa Laval’s stock levels and demand forecasts via a web-portal. Information is manually collected from this portal and typed into CEPA’s own ERP system, described more in detail in section 5.2.4. The products delivered to Alfa Laval are both standard and complex parts, mainly for Alfa Laval’s plate heat exchanger production. The selling price varies from 20 SEK up to 5,000 SEK per product. The products in the VMI project can be divided into two categories. The first category contains products with a stable demand which are easy to handle. The second category contains products with a high demand at certain intervals. By producing these products to stock, whenever CEPA has available capacity, and deliver all products at the same time transport costs can be reduced.
CEPA is obligated to keep the stock in between a minimum and a maximum value. From the point of time when the products are delivered, the ownership changes to Alfa Laval’s side. However, CEPA is not paid until Alfa Laval takes the products from stock to the production. This policy is an incitement for CEPA not to always be close to the maximum value which leads to high stock handling costs for Alfa Laval. The major risk with the VMI project that CEPA perceives is the risk of not being paid for the delivered products due to the fact that Alfa Laval has overestimated the demand and not take as much from the stock as predicted.
CEPA delivers 90 percent of the total demand to 10 customers. It has other forms of VMI with many of these customers where CEPA receives a piece of paper with information about the demand. However, Alfa Laval is the only customer to which CEPA has access to real time information. Approximately 10 percent of the total demand is delivered to Alfa Laval, but CEPA predicts it to increase to 15 percent after the newly acquired business.
5.2.3. Result of the VMI implementation
CEPA’s service level towards Alfa Laval before the VMI implementation was as high as 99 percent and has therefore not increased. However, CEPA has

54
become a larger customer to Alfa Laval, their status has changed to “preferred supplier” and they have become a global supplier instead of a local one. These outcomes of the VMI implementation CEPA sees as very positive.
Regarding changes in administration CEPA experience no change in the over all level. There has indeed been more work when the employees first have to collect the information from the web portal and then manually type it in CEPA’s own ERP system. However, CEPA is able to check the demand of several products at a time in the portal, for example once a week, which was not the case before.
There has been no change in the inventory level of raw materials or work in process at CEPA after the VMI introduction. However, the amount of finished goods has decreased since CEPA now delivers to the stock at Alfa Laval instead of keeping the inventory in-house, waiting for an order to come.
After the VMI implementation the production efficiency has been slightly improved, but can be further improved. The material utilization has been improved, but the machine utilization is unchanged. The most positive thing regarding the production after the VMI implementation is that it is much easier to re-plan orders. This is also the most negative thing, since too much re-planning often leads to negative effects.
From delivering on every weekday to Alfa Laval CEPA has decided only to deliver on Wednesdays. The reason why they can do this is that as long as they keep the stock at Alfa Laval in-between the minimum and the maximum level they can decide whenever they want to deliver goods. This has resulted in lower transport costs for CEPA.
5.2.4. ERP integration
CEPA is using an ERP system called Monitor and has 20 licenses. Alfa Laval is using Jeeves and has developed a web portal for sharing information with CEPA. The portal is developed by a software company in Lund and Alfa Laval has paid for all development costs. The only thing CEPA has paid for is minor cost at the own site, e.g. extra computer screens.
In the portal CEPA is provided with demand information each day for each product, inventory level, max/min level and sales forecast for the next 3 months. CEPA can also look at statistics. There is no information that CEPA wants to have which is not shared by Alfa Laval. A model of the ERP integration can be seen in Figure 5.4.

55
Figure 5.4: CEPA’s ERP integration solution
The information collected from the web portal must be manually typed into Monitor and the orders are handled as a “normal” order in the production. By the time of delivery employees must again manually update both Monitor and the web portal.
Most of the information in the web portal is accurate except for the forecast information, which often is very inaccurate. This causes huge problems for CEPA since they do not know if they can trust them or not. Often the result is that CEPA does not produce based on the forecast, but on actual demand and previous experience.
5.2.5. VMI in the future
CEPA Steelech is satisfied with how the VMI implementation has been conducted. The web portal interface is the best solution since the decision about how much should be produced is taken by a human being. This decision would not be suitable for a computer to make. There are, however, disadvantages with the manual procedure such as the risk for typing in the wrong information, but these have minor impact on the end result.
There are, however, some improvements that could be made. CEPA would like to have added functionality in the web portal such as a special column for the supplier where they can sort the information in different ways.
CEPA states that they do not use the new information provided to improve their own production in any way. However, if a larger part of the total demand is included in VMI relationships, the need for re-planning would be less and costs will be reduced accordingly. Because of this fact, CEPA would like to start more VMI relationships in the future. Having more VMI relationships would also be of benefit when doing long term investments since CEPA has closer relationships to these customers.
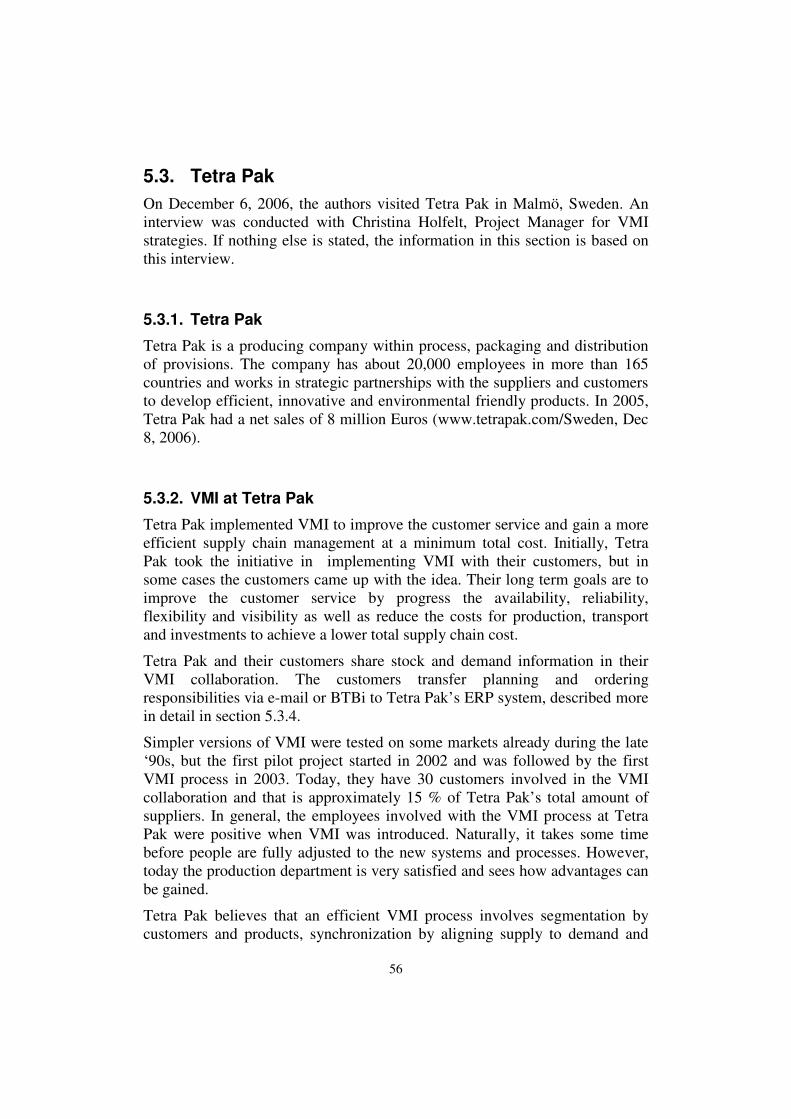
56
5.3. Tetra Pak
On December 6, 2006, the authors visited Tetra Pak in Malmö, Sweden. An interview was conducted with Christina Holfelt, Project Manager for VMI strategies. If nothing else is stated, the information in this section is based on this interview.
5.3.1. Tetra Pak
Tetra Pak is a producing company within process, packaging and distribution of provisions. The company has about 20,000 employees in more than 165 countries and works in strategic partnerships with the suppliers and customers to develop efficient, innovative and environmental friendly products. In 2005, Tetra Pak had a net sales of 8 million Euros (www.tetrapak.com/Sweden, Dec 8, 2006).
5.3.2. VMI at Tetra Pak
Tetra Pak implemented VMI to improve the customer service and gain a more efficient supply chain management at a minimum total cost. Initially, Tetra Pak took the initiative in implementing VMI with their customers, but in some cases the customers came up with the idea. Their long term goals are to improve the customer service by progress the availability, reliability, flexibility and visibility as well as reduce the costs for production, transport and investments to achieve a lower total supply chain cost.
Tetra Pak and their customers share stock and demand information in their VMI collaboration. The customers transfer planning and ordering responsibilities via e-mail or BTBi to Tetra Pak’s ERP system, described more in detail in section 5.3.4.
Simpler versions of VMI were tested on some markets already during the late ‘90s, but the first pilot project started in 2002 and was followed by the first VMI process in 2003. Today, they have 30 customers involved in the VMI collaboration and that is approximately 15 % of Tetra Pak’s total amount of suppliers. In general, the employees involved with the VMI process at Tetra Pak were positive when VMI was introduced. Naturally, it takes some time before people are fully adjusted to the new systems and processes. However, today the production department is very satisfied and sees how advantages can be gained.
Tetra Pak believes that an efficient VMI process involves segmentation by customers and products, synchronization by aligning supply to demand and

57
collaboration to get a total supply chain view and shared process. Benefits from the synchronization are stable and simplified production schedules, lower supply chain inventory and reduced effective lead time and increased responsiveness.
Generally, Tetra Pak is a critical supplier to the customers involved in the VMI process. However, the importance of the VMI customers to Tetra Pak is not as important; those customers are more “one of many” than critical. The products involved in the VMI process have typically a predictable and stable demand and are ordered in high volume. Tetra Pak have some demands and prerequisites for starting a VMI collaboration; regular supply chain planning cycles, removal of demand distortions and understanding of capacity constraints and synchronization capability.
Tetra Pak’s 30 VMI customers are located all over the world. In Sweden, the dairy company Arla is a major customer. Tetra Pak owns its inventory and when the goods are delivered, the ownership transfers to the customer. Tetra Pak states that stock outs is a major risk with the VMI implementation. Incurrent items are another problem. This risk has been mitigated by a detailed agreement that Tetra Pak has implemented and thereby lowered the obsolete stock to a minimum.
5.3.3. Results of the VMI integration
After implementing VMI at Tetra Pak, the service levels towards the customers have improved. The sales volumes are unchanged and that is also the case for the stock out costs. Regarding changes in administration Tetra Pak states that no change in work effort has occurred due to the VMI integration.
The VMI implementation has resulted in lower supply chain stock. The inventory for finished goods and the safety stock have decreased clearly, especially for the finished goods. The productivity has improved enormously after the VMI implementation. Likewise, the machine utilization has increased as Tetra Pak now has a 12 weeks notice when to produce and hence being able to be more flexible in the production. Furthermore, the numbers of transportations are unchanged in comparison with the number before the VMI process started.
5.3.4. ERP integration
Tetra Pak is using SAP R/3. Some of their customers have the same ERP system, but most of them have different ones. VMI is fully integrated in the ERP system. The information is either sent by e-mail and electronically
58
received and automatically interpreted by APO, Advanced Planner & Optimizer, irrespective of what ERP system the customer is using. Tetra Pak also has a solution where B2Bi handles the information.
APO operates in the areas concerning supply network planning, demand planning and distribution planning and deployment. In essence, APO creates automation of data handling and automatically calculations by data transfers and uploads. Furthermore, APO creates order in SAP R/3 and real time updates for stocks, production and deliveries. An advantage with having APO implemented in the ERP system is the clear planning results that can be shared between the sales company (MC) and the converting factory (CF).
The customer creates transfer data which is transferred to Tetra Pak by e-mail or B2Bi. Information provided from the customers is inventory balance, last week’s consumption and forecast, Figure 5.5. The customer data is analyzed and the customer is consulted if there is uncertainty in the data. By comparing the data with historical delivery data, a VMI forecast for the released period is created. Short term replenishments and deliveries are planned for the period. The long term replenishments are planned by comparing sales data with stock data. Sales order proposals are created for the short term replenishments as well as for the long term replenishments. In the next step, the production quantity and timing will be approved or changed and eventually one or more orders are created.
Material &Capacity Management
Order Handling Level 3 VMI
Customer
Order Management
ATransfer of
customer data
(e-mail)
Analyse Customer Data and consult with
customer if necessary
CreateVMI forecast for
the
Released Period
Plan long term
replenishments
for customers
Historical
Delivery
data
Service Level
AgreementMC - CF
Service Level
Agreement
MC - Customer
Placed
Sales Orders
Stock Data
Approve/change
production quantity
& timing
Sales Order
proposals
Order
Order
1
Plan
Deliveries
for the
Planning Period
Release
Shipping
Requirements
Receive
Shipping
Requirements
Register One
or More
Orders
Plan short term
replenishments
for customers
Figure 5.5: The order handling in the VMI process at Tetra Pak

59
A typical VMI cycle takes place during one week and starts with customer data transfer, VMI forecasts and replenishment planning on Monday, Figure 5.6. On the next day, delivery planning and delivery orders are released. On Wednesday, it is time for shipping planning and sales order planning and release. During this time, delivery orders and sales order are confirmed. Finally, on the fourth day, the reports are run and master data is updated.
Mon Tue Wed Thu Fri
Data
transfer
VMI
forecast
Replenplanning
Delivery planning
Sales
order planning
Run reports and update master data
Delivery
order release
Sales
order release
Shipping planning
Customer data
transfer
Delivery order
confirmation
Salesorder
confirmation
Figure 5.6: Example of a VMI planning cycle at Tetra Pak
5.3.5. VMI in the future
Tetra Pak states that B2Bi gives higher quality of data than e-mail as it is more accurate and causes less mistakes, e.g. if the one who is responsible for e-mails is not present. However, not all customers can have B2Bi and thus some have to work with an e-mail solution. Furthermore, Tetra Pak argues that the implementation would have been easier if all the customers had the same ERP system. The implementation would have been facilitated since fewer special solutions are required when there is direct connection between the ERP systems. It would also have been easier to locate customers and orders in the system. Tetra Pak states that a web portal would require their customers to enter a system that could be one of many if the customer has several suppliers asking for the same thing.
Tetra Pak is satisfied with the information sent from the customers and does not need any further information. Moreover, there is no unnecessary information provided by the customers. Tetra Pak states that most of the
60
information is accurate, but forecasts are never fully correct, but this is normal. According to the service level agreement, the customer has to accept what Tetra Pak is delivering based on the forecasts made by the customer. In essence, the only inaccurate information besides forecasts that usually occurs is small careless mistakes.
The forecasts from customers are compared with statistical data and Tetra Pak cross check manually for over or underestimated demand. Tetra Pak was expecting smaller order sizes after implementing VMI, but this was not the case. The batches have decreased markedly, whereas the fluctuations have decreased and contribute to overall even results at Tetra Pak. Tetra Pak is satisfied with how the VMI process has been conducted and has gained positive results in general.
Tetra Pak believes that the VMI implementation could profit more if the flow of data in the process is automated. Tetra Pak could also profit more by improving the service agreements and by having better follow ups of how the factories manage the VMI volumes. Tetra Pak believes there is a great potential for improvements by linking VMI to the production planning. The VMI process will be developed by involving more customers and larger volumes.
5.4. Procordia Food
On December 8, 2006, the authors visited Procordia Food’s site in Eslöv. An interview was conducted with Thomas Månsson, Production Planner and responsible for VMI at Procordia Food. If nothing else is stated, the information in this section is based on this interview.
5.4.1. Procordia Food
Procordia Food AB (herafter reffered to as PFAB) is one of the leading producers and marketers of food products in Sweden with brand names like Felix, BOB, Ekströms, Önos, Risifrutti, FUN Light and Grandiosa. The company has 1,350 employees and had a turnover in 2006 of 3 billion SEK. Production takes place in eight locations in Sweden; Eslöv, Tollarp, Fågelmara, Färjestaden, Kumla, Örebro and Vansbro. PFAB belongs to the Norwegian company Orkla ASA, which is one of the largest listed companies in Norway. The core businesses are branded consumer goods, speciality materials and financial investments (www.procordiafood.com, Jan 5, 2007).

61
Among other customers Semper is a big one. Semper sells food in cans made of glass and PFAB has manufactured the product since 1965. PFAB delivers finished products to distributions centers in Klippan and in Helsingfors owned by Semper, from which Semper distributes the products to the end customer. Annually, PFAB produces 50 million cans of food to Semper (www.procordiafood.com, Jan 5, 2007).
5.4.2. VMI at Procordia Food
PFAB has 6-7 VMI relationships based on the “ICA-model” where PFAB is provided with demand forecasts, stock balance and sales information every day through EDI and is responsible for the replenishment. PFAB sends a replenishment report and a delivery report when the products are shipped, Figure 5.7. However, PFAB realized that this solution had limitations when deciding upon involving Semper in a VMI relationship. Semper has an obligation to their customers that at all times be able to provide information about exactly when they will deliver. To be able to give this information Semper needs exact information about the status of every product at all times and before the VMI implementation numerous calls and e-mails were necessary to receive this information from PFAB. Having the information available in a system would be of benefit for both companies why PFAB and Semper in 2004 launched a project called “+98”. The main objectives for this project was to reduce stock levels at Semper, increase and keep the service level above 98 percent, increase production efficiency at PFAB and decrease the amount of administrative work at both companies.
Since no finished solution existed PFAB and Semper involved a consultancy firm, Intentia (now Lawson) to extend the “ICA-solution”. This was a pilot project for Intentia and the objectives were, besides the above mentioned, to develop a standard solution ready to implement at other companies. Because of this interest from Intentia they were willing to share the cost which, of course, resulted in reduced cost for PFAB and Semper.
The finished solution can be seen in Figure 5.8. The area inside the box contains the differences from the ICA-model. Semper is updated with a 30 days forecast based on PFAB’s production which is sent every day to Semper. The cans of food have to be in quarantine for quality check which can result in rejected products. To be fully updated Semper also receives a delivery report on finished products every day. By this solution Semper is able to fulfill the available to promise (ATP) agreement to their customers.

62
FORECAST
SALES REPORT
REPLENISHMENT REPORT
DELIVERY REPORT
INVOICE
STOCK BALANCE REPORT
SUPPLIER ICA HANDLARNAS AB
EDI - messages
Figure 5.7: The ICA-model.
Forecast 18 months
INVENTORY REPORT 1 time / day
Klippan
Helsingfors
Stock balance
SALESFORECAST 1 time / week
Eslöv
Existing planning
process
Manufacturing order
Existing production
process
New stock balance
Stock
balance
quarantine
Stock
balance
rejected
Stock
balance
finished
products
INVENTORY REPORT once a day
Goods reciept
Create purchasing
order?
Existing VMI distribution
order processDELIVERY NOTIFICATION
INVENTORY REPORT (30 days forecast) once a day
Customer order is
created
Invoice is created
Payment recieved Payment
Invoice recievedINVOICE
Added part
to the ICA-
model
SEMPERPFAB
Figure 5.8: VMI solution for PFAB and Semper

63
5.4.3. Result after VMI implementation
After the VMI implementation the service level has increased significantly. During a six months period in 2004 compared to an equally long period of time in 2003, the service level had increased by 4 percent. Furthermore, the new VMI processes have resulted in less administrative work for both companies.
At Semper’s sites in Klippan and Helsingfors there has been a 30 percent decrease in stock level as a direct effect of the VMI implementation. Also at PFAB there are fewer products in process as well as raw material due to the enlarged planning horizon. Since PFAB’s suppliers mainly are farmers an accurate 18 months forecast is very important as the farmers production is impossible to change on short notice. Moreover, the productivity and the machine utilization have been increased at PFAB. Regarding number of transports between PFAB and Semper there has been no significant change.
5.4.4. ERP integration
Both PFAB and Semper have the ERP system Movex. As mentioned in section 5.4.2 PFAB and Semper developed the VMI integration solution together with Intentia. From the idea to finished solution it took approximately 1.5 years to develop the solution and the implementation took approximately 6 months. The messages are sent through EDI and since PFAB has worked with EDI messages for a long period of time the only IT cost for them was an additional EDI channel. However, Semper had to invest more money to be able to handle the EDI traffic.
Except for the information shown in Figure 5.8 PFAB receives stock value and service level by e-mail on a monthly basis. All information except for the forecast is mostly accurate. Regarding the forecasts there is a trade off between service level and forecast accuracy. If Semper’s forecasts are very accurate it is possible for PFAB to keep a high service level and vice versa. According to PFAB the companies base this trade off on mutual trust and honesty.
5.4.5. VMI in the future
PFAB is very satisfied with the VMI relationship with Semper. In the beginning employees were sceptic but they quickly changed their minds when realising what positive effects VMI had. PFAB thinks the VMI solution is the best one for this relationship and cannot see any major risks with it. The

64
solution is, however, based on Movex communicating with Movex and does not work without changes on other ERP-systems.
In the VMI relationship with Semper PFAB cannot profit much more but they have gained experience which has resulted in PFAB being well prepared when the next VMI relationship will be implemented. Today PFAB has VMI relationships which correspond to approximately 20 percent of the turnover, and have the ambition to increase this figure.
Today, demand information is translated semi-manually into machine hours needed. This process can be fully automated by implementing Advance Planning Optimization (APO) which may improve the VMI process further. APO is implemented at other PFAB sites, but not yet in Eslöv.
5.5. Alfa Laval
On November 28, 2006, the authors visited Alfa Laval’s site in Lund. An interview was conducted with Ann Loftorp, Project Manager at Operations Development and responsible for VMI. If nothing else is stated, the information in this section is based on this interview.
5.5.1. Alfa Laval
Alfa Laval is a leading global provider of specialized products and engineering solutions. The equipment, systems and service are dedicated to assisting customers in optimizing the performance of their processes. Alfa Laval helps their customers to heat, cool, separate and transport products such as oil, water, chemicals, beverages, foodstuff, starch and pharmaceuticals. Alfa Laval is a global market leader with its three key technologies – Centrifugal Separation, Heat Transfer and Fluid Handling. In the Alfa Laval group there are 9,500 employees and the turnover for 2005 was 16.3 billion SEK (www.alfalaval.com, Jan 6, 2007).
5.5.2. VMI at Alfa Laval
During the ‘90s Alfa Laval started an internal discussion about introducing VMI. However, at that time, they were facing technical problems which put an end to the discussion. Not until 2003 the development of the VMI concept and the IT structure started. In 2004 and 2005 Alfa Laval did two pilot projects before the project launch in November 2005. Alfa Laval had the short term goal of involving 30 suppliers in VMI relationships by the end of 2006 but has
65
only succeeded in involving 16. Two thirds of the VMI suppliers are located in Sweden and one third in Europe.
The reason why Alfa Laval started to implement VMI was that they realised that they cannot compete well without optimising the processes upstream in the supply chain. Their long term goal is to strengthen the joint competitiveness by increased productivity and reduced tied up capital throughout the whole supply chain. When implementing VMI, the reactions from the employees at Alfa Laval were both positive and negative. The operative purchasers could spend more time on forecasting instead of operative tasks but the strategic purchasers were worried. They thought that the supplier would take the relationship for granted and that Alfa Laval would not dare to make great demands on the suppliers, which would lead to a “lock in”-effect. The major risk with VMI as Alfa Laval sees it is that it could be harder to switch suppliers and that they become more vulnerable when something unpredictable happen to the supplier.
The main criterion for Alfa Laval when choosing upon what supplier to involve in a VMI relationship is that the company is supplying Alfa Laval Lund AB, since a decision has been made on corporate level that this company should be the pilot company for VMI within the Alfa Laval Group. One common thing for all VMI suppliers is that they only deliver products specially made for Alfa Laval which are stored at Alfa Laval’s site.
Alfa Laval’s ordering process before the VMI implementation can be seen in Figure 5.9. Traditional purchasing orders are sent to the supplier and the supplier delivers according to these orders. In this traditional ordering process the legal border coincides with the administrative border. This is not the case in the VMI process, where the administrative borders is moved one step closer to Alfa Laval in the supply chain. However, the legal border stays the same, Figure 5.10. The supplier receives information about stock levels and demand forecast through a web portal. As long as Alfa Laval’s forecast is deviating in-between predetermined limits the supplier is obligated to keep available stock at Alfa Laval. The supplier decides how much and when they should deliver. The supplier is allowed to deliver and store as much as they want up to a predetermined level. If the supplier should deliver more than up to this level Alfa Laval takes no responsible for the extra inventory. This gives an incentive for the supplier not to keep the stock above this limit. Up to this level Alfa Laval takes full responsibility for the products delivered. However, the supplier only receives a monthly payment for the products Alfa Laval has taken out of stock during the previous month. By these restrictions Alfa Laval states that their VMI process is self-regulating.

66
Figure 5.11: The traditional order process at Alfa Laval
Figure 5.12: The VMI process at Alfa Laval
67
5.5.3. Result after VMI implementation
The service level between the VMI suppliers and Alfa Laval has become higher after the VMI implementation. However, in some relationships the service level has decreased due to inaccurate information from Alfa Laval’s side. The volume of goods has increased in general why it is hard to say whether the volume from the VMI suppliers has increase more than from other suppliers.
At Alfa Laval there is less work needed in the ordering process after the VMI implementation. The consequence of this is that the employees can spend more time on forecasting instead of ordering. The forecasts have become more accurate than before and Alfa Laval now measures the accuracy in a better way than before. Regarding the invoice process Alfa Laval is facing problems and the workload is higher than before. The invoices are dealt with in another ERP system, Movex.
Alfa Laval estimated that the inventory level would increase by 30 percent when implementing VMI, but there has been no difference. The reason for this can either be that Alfa Laval had too much stock before or that the suppliers do not have the time to replenish the stock due to an increase in demand.
Alfa Laval thinks that the incoming transports are less from the VMI suppliers. At least they have received information from the suppliers that their transport costs have decreased.
5.5.4. ERP integration
Alfa Laval Lund AB is using Jeeves, but different companies within the Alfa Laval Group are using other types of ERP systems. This is one reason for choosing to develop a web portal to share information with the VMI supplier; easy to implement with different ERP systems. The web portal is directly linked to Jeeves and can be seen as an extension of Jeeves, containing relevant information to share with the supplier. The supplier is provided with exactly the same information as an order handler at Alfa Laval would have had access to in a traditional ordering process. The supplier has to manually type the information into their own ERP system and also update the web portal manually once the shipment has been made, Figure 5.13.
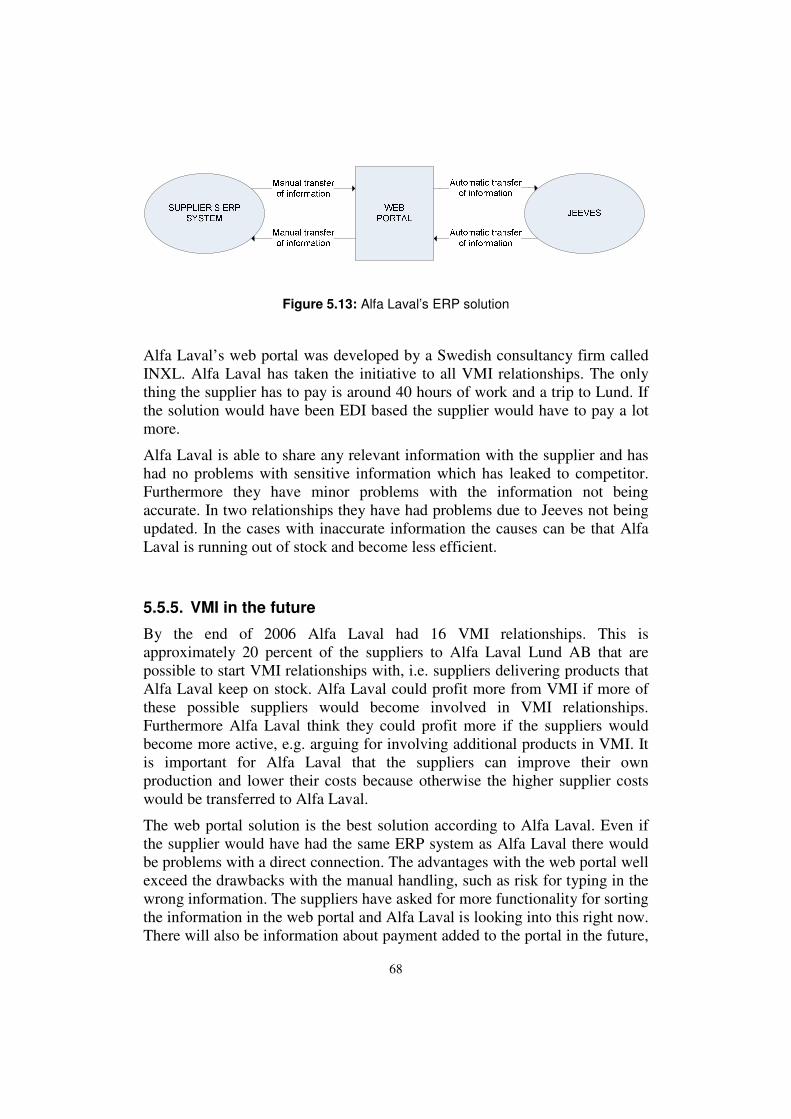
68
Figure 5.13: Alfa Laval’s ERP solution
Alfa Laval’s web portal was developed by a Swedish consultancy firm called INXL. Alfa Laval has taken the initiative to all VMI relationships. The only thing the supplier has to pay is around 40 hours of work and a trip to Lund. If the solution would have been EDI based the supplier would have to pay a lot more.
Alfa Laval is able to share any relevant information with the supplier and has had no problems with sensitive information which has leaked to competitor. Furthermore they have minor problems with the information not being accurate. In two relationships they have had problems due to Jeeves not being updated. In the cases with inaccurate information the causes can be that Alfa Laval is running out of stock and become less efficient.
5.5.5. VMI in the future
By the end of 2006 Alfa Laval had 16 VMI relationships. This is approximately 20 percent of the suppliers to Alfa Laval Lund AB that are possible to start VMI relationships with, i.e. suppliers delivering products that Alfa Laval keep on stock. Alfa Laval could profit more from VMI if more of these possible suppliers would become involved in VMI relationships. Furthermore Alfa Laval think they could profit more if the suppliers would become more active, e.g. arguing for involving additional products in VMI. It is important for Alfa Laval that the suppliers can improve their own production and lower their costs because otherwise the higher supplier costs would be transferred to Alfa Laval.
The web portal solution is the best solution according to Alfa Laval. Even if the supplier would have had the same ERP system as Alfa Laval there would be problems with a direct connection. The advantages with the web portal well exceed the drawbacks with the manual handling, such as risk for typing in the wrong information. The suppliers have asked for more functionality for sorting the information in the web portal and Alfa Laval is looking into this right now. There will also be information about payment added to the portal in the future,
69
where the supplier will be able to see how much Alfa Laval are going to pay the next coming month. However, the main complain from the supplier is that the credit time is longer than before since Alfa Laval is paying for the aggregated demand during the previous month. But has the credit time really become longer? According to Alfa Laval the case is often that the supplier has moved stock from its own site to Alfa Laval and therefore the time between production and payment is unchanged, i.e. the credit time.
To conclude, VMI at Alfa Laval will be further developed in the future, both conceptual and through IT development. In December 2006 the first VMI project outside Lund will start when a site in Italy becomes customer in a VMI relationship. In 2007 there will be starts of VMI relationships in North America.
5.6. Arcoma
On November 30, 2006, the authors visited Arcoma in Växjö, Sweden. An interview was conducted with Richard Lundberg, Purchaser and VMI Manager. If nothing else is stated, the information in this section is based on this interview.
5.6.1. Arcoma
Arcoma AB was founded in October 1990 and has today 61 employees in Sweden and 3 employees in the United States. They are specialized in development and production of stands for X-ray units. Arcoma manufactures both its own products and OEM products. The products are ergonomic adjusted for the customers and are easy to handle. Arcoma compete with a minority of other large companies, e.g. Siemens and Philips and the end customers are county council and private hospitals. In 2005, Arcoma had a turnover of 120 millions SEK. Some of their key suppliers are Fredriksons Verkstads AB, Swedrive AB and Orbit One AB.
5.6.2. VMI at Arcoma
After visiting a seminar in Växjö during the spring of 2005, Arcoma became the first extern pilot project for a simple VMI implementation conducted by Torbjörn Peterson. Arcoma had no previous experience with VMI but saw opportunities to increase the volume and the numbers of close supplier collaborations. Arcoma wanted to provide more exact demand information to

70
the suppliers and offer them an opportunity to be included more in the purchasing process.
Arcoma’s VMI collaborations are based on excel files that collect raw data from Arcoma’s ERP system. The information is sent by e-mail to the suppliers, described further in section 5.6.4. The purchasing department at Arcoma has a turnover of 60 million SEK, of which 40-45 million are from VMI implemented suppliers, i.e. 75 % of the purchasing costs comes from VMI suppliers. Initially, 15 suppliers started the VMI process by receiving forecasts about the demands at Arcoma. After working with the forecasts, each supplier got the opportunity of starting a complete VMI collaboration with Arcoma, and today seven key suppliers work with the new order processes. However, the remaining eight suppliers still work only with forecast information.
The seven suppliers were chosen after considering their rate of turnover, maturity of the supplier and value of the products. The suppliers are located in southern Sweden and their products are all high valued, frequently ordered and requires a certain lead time to be suitable for the VMI process. The demand pattern of the products is stable with no seasonal peaks except for when the public sector makes up the balance sheet.
Arcoma noticed positive reactions from the employees after introducing the VMI process. However, only the purchasing staff was involved in the process as the VMI implementation is not involved further in the company. The responsible persons for the IT considered the implementation less difficult and time consuming then expected. Arcoma owns their inventory. Furthermore, Arcoma states that there are always risks when suppliers are responsible for the order processing, e.g. if the suppliers inventory is on fire.
5.6.3. Result after VMI implementation
Arcoma states that service from the suppliers have been improved after implementing VMI. Arcoma has signed a service level agreement with the supplier that 96 % of the products should be delivered on time. The suppliers are pleased about the “delivery window” they have gained and the lack of charges when delays happen. Furthermore, the sales volume is unchanged but if Arcoma needs a new product, the VMI suppliers have advantages over the traditional ones. The stock outs have decreased, likely because of the JIT deliveries.
The invoices are not included in the VMI implementation and thus have not been measured. The forecasts have improved markedly, whereas the order processes are on the same level as before the VMI process started. The

71
ordering process has been facilitated and less human interference is required. Both inventories and safety stocks have decreased due to JIT. However, the JIT deliveries have increased the transportation costs. Additionally, the availability of material has increased and resulted in fewer stock outs and thus a more efficient production.
5.6.4. ERP integration
Arcoma is using an ERP system called iScala, while all their suppliers use different ERP systems, e.g Monitor, Garp and SAP. The VMI solution was conducted by Torbjörn Petterns, the development and implementation took two months and Arcoma paid for all of it.
As seen in figure 5.14 the ERP system works as follows; Arcoma performs the demand planning in its ERP system iScala, which includes information about the demands and the inventory. In iScala, the excel based program Supply Partner collects raw data from the SQL database. A calculation is accomplished in Supply Partner, based on the data from the excel files. The updated excel files contain information about the products and suitable supplier, and is sent via e-mail to the suppliers once a week. Arcoma receives an order confirmation which is updated in iScala. After the supplier has delivered, iScala is updated again with correct information. The only information the customers need is a program file, a parameter file with customer ID and the updated file from Arcoma. Supply Partner is mainly used by small and mid-sized companies.
The supplier have access to demand, customer orders, manufacturing orders, safety stocks and forecast of the next 70 days based on earlier consumption. The forecasts in iScala can be edited manually, but neither Arcoma nor the supplier can change anything in Supply Partner. The prices are included in the Supply Partner.
Figure 5.14: The Information flow in Arcoma’s VMI solution

72
The order confirmation could have been facilitated by using EDI confirmations directly into iScala, but this would result in a high implementation cost that Arcoma is not willing to pay for.
5.6.5. VMI in the future
Arcoma states that the balance of power has not changed after starting the VMI process since the suppliers are obligated to follow terms stated in the agreement. Arcoma share all essential information and state that VMI is a win-win situation where the information the suppliers receive will benefit Arcoma. The forecasts are never fully accurate, but they contribute satisfactory. The causes of the inaccurate information are failures in the balance and registration of customer orders, but failures are also possible to occur when orders are made too early. Another cause of incorrect information is the human factor and its influence on interpreting data. Mainly, the effects of the inaccurate information affect the preciseness of the deliveries, e.g. too late or too early deliveries, or deliveries that failed to appear. However, according to Arcoma, this is not a major problem.
The advantages with this ERP solution are the easiness to read and work with it and that, besides the raw data, graphic design is shown in the system. The suppliers have also appreciated the simplicity with the program. The ease with the excel files contributes to the fact that the suppliers can have different ERP systems than Arcoma without neither improve nor impair the VMI collaboration. There are risks with having a “one-man-business solution” like Supply Partner as only one person has the knowledge of the system.
However, the order confirmation could have been facilitated by implementing EDI into iScala. As mentioned in section 5.6.4 this would require a high cost and Arcoma does not have any plans to implement EDI into iScala before the volume of the articles increases. Furthermore, Arcoma wants to keep the simplicity and the matter of factness in the program and has no ambition of develop the program.
Initially, some of the suppliers questioned the changed responsibilities the VMI implementation involved. Arcoma offers collaboration with the suppliers based on forecasts delivered from Arcoma sent to the suppliers. After a testing time the supplier can choose to cooperate further and implement VMI completely, or continue the collaboration with only forecasts. Some suppliers are only suitable for collaboration with forecasts and not with orders and Arcoma only implements VMI in the cases where they think the implementation will benefit both companies.

73
The VMI collaboration will be developed with increased volumes and higher turnover on existing articles, not more suppliers. As stated, Arcoma has no intention of improving their VMI system, but they want the suppliers to have access to Arcoma’s design archives.

74

75
6. Cross Case Analysis
In this chapter the different case studies are compared in order to describe
patterns of differences and similarities.
6.1. Case companies
The authors have conducted case study interviews at six different companies in Sweden and Denmark. Four of these companies are suppliers in VMI relationships and two of the companies are customers. Among these companies, two of them, CEPA and Arcoma, are considered small companies with about 50 employees each. The remaining four companies are all large companies with over 1,000 employees, Figure 6.1. SCA, Tetra Pak and Alfa Laval are all worldwide companies and have factories outside of Sweden. PFAB is a part of the Norwegian company Orkla ASA, one of the largest companies in Norway. Table 6.1 shows the numbers of employees and turnover of the six case companies.
Figure 6.1: Relation between the size of the case companies and their part in the VMI relationship(s).

76
Table 6.1: Employees and turnover of case companies
CEPA PFAB SCA Tetra Pak Alfa Laval Arcoma
Supplier/Customer Supplier Supplier Supplier Supplier Customer Customer
Employees 50 1,350 50,000 in
50 countries
20,000 in 165
countries
9,500 worldwide
61 in Sweden
Turnover 65 million
SEK (2007) 3 billion
SEK (2006) 100 billion
SEK (2005)
80 billion SEK (Net.
sales 2005)
16 billion SEK (2005)
120 million SEK
6.2. VMI implementation
There are two different forms of VMI collaboration represented in this case study. All companies, except for PFAB, have a VMI relationship where both supplier and customer are manufacturers. PFAB has another kind of VMI relationship as PFAB manufactures products to Semper which distributes them, thus distribution VMI, Figure 6.2.
Figure 6.2: Case companies’ VMI relationships in the supply chain (Elvander, 2006)
Information about the VMI implementation is summarized in Table 6.2. The case companies all have different numbers of VMI partners. Tetra Pak has 30 VMI customers and Arcoma 7 VMI suppliers. CEPA has only Alfa Laval as customer, whereas Alfa Laval has 15 other VMI suppliers besides CEPA. Both PFAB and SCA only have one VMI customer each; Semper and Arla.

77
Among the case companies, the customer was the initiator of starting the VMI collaboration at CEPA, SCA, Alfa Laval and Arcoma. Tetra Pak has been the promoter of starting VMI with their customers initially, but in some cases the customer has taken the initiative. In the VMI collaboration between PFAB and Semper, both parties took the initiative in starting VMI between the companies.
Irrespective of if the supplier or the customer initiated the VMI collaboration, the initiator was always larger or of the same size as their partner. The authors believe that there is a connection between the company’s assets and their willingness to launch new projects, for example VMI collaborations. Generally, a larger company can risk more on new relationships and profit more than smaller companies. In essence, the authors believe that a customer can initiate VMI collaboration with its partner independent of how large the company is, whereas the supplier is likely to initiate VMI only when they are larger than their customer. This is because of the fact that the advantages gained in VMI collaborations, e.g. transferred order processes from the customer to the supplier, make it more tempting for a customer to start a VMI relationship.
There are several different reasons why the case companies implemented VMI. Two of the suppliers, CEPA and SCA, stated closer customer relationship as a motive for starting VMI collaborations. In general, the suppliers wanted to strengthen the relationship with their customers. The authors believe that this could be for two reasons; to increase the switching costs for the customer and improve the mutual trust between the two parties. Another purpose is reduced costs for the supplier. Decreased transportation costs are mentioned by both CEPA and Tetra Pak which also states reduced costs for production and investments as a motive for launching VMI collaborations. To conclude, the suppliers wanted to achieve an overall more efficient process with more efficient production, improved demand planning and decreased amount of administrative work.
Regarding the customers’ purpose of implementing VMI no general conclusions can be drawn between the larger Alfa Laval and the smaller Arcoma even though both companies initiated the VMI collaborations. Arcoma stated increased volume and closer supplier relationships as two main reasons, whereas Alfa Laval wanted to strengthen the competitiveness by increased productivity and reduced tied up capital.
All case companies started their VMI collaborations recently. Tetra Pak was the first one and started in 2003 and the other companies launched their VMI processes in 2004 or 2005. Since all VMI implementations have started recently not all long-term effects have been confirmed. This is the case of

78
SCA where more positive effects are expected after having worked with VMI for a couple of years.
Tetra Pak, SCA and PFAB all have general products in their VMI collaborations. SCA and PFAB both have VMI products from only one segment; dairy products and glass cans of foods for children. In the collaboration between CEPA and Alfa Laval, CEPA produces standard and complex steel parts that are specially made for Alfa Laval. All VMI products in Alfa Laval’s collaborations are specially made for Alfa Laval.
Regarding the demand pattern for the VMI products, all companies except for SCA and Alfa Laval stated that the demand pattern for their products were stable. However, CEPA had two different demand patterns; stable demand and high demand at certain intervals. SCA had different demand patterns but overall predictable demand with some seasonal peaks, e.g. ice cream during the summer. Tetra Pak also states that their VMI products are delivered in high volumes. The authors state that no general demand pattern for products in VMI collaborations can be found. However, stable or predictable demand is necessary to be able to plan the production properly and gain the advantages expected in VMI relationships.
All case companies, except for PFAB, state that there are several risks with VMI implementations. In general, incorrect information is by the suppliers declared as a large risk but is not mentioned as a risk by the customers. CEPA, SCA and Tetra Pak all state that incorrect data is a major risk that could result in incurrent items, stock outs (Tetra Pak) and not being paid on time due to overestimated demand (CEPA).
Regarding the customers, both companies stated a major risk for becoming more vulnerable when many responsibilities are transferred from the customer to the supplier. In particular, there is a risk when something happens to the supplier because of the fact that the customer is more dependent on the supplier in VMI relationships. Alfa Laval also states that a risk with VMI is that it is harder to switch supplier since the VMI suppliers become closer to the customer than other suppliers. This fact is stated to be an initiative for starting VMI collaborations by many suppliers.

79
Table 6.2: VMI implementation information from the case companies
CEPA PFAB SCA Tetra Pak Alfa Laval Arcoma
Initiative Customer Shared Customer Supplier Customer Customer
VMI partner(s)
Alfa Laval Lund AB
Semper Arla 30 VMI
customers 16 VMI
suppliers 7 VMI
suppliers
Purpose
Closer customer
relationship, reduce
transportation cost, become
more competitive
by more efficient
production
Reduce stock level at the customer,
increase and keep the
service level above 98 %,
increase production efficiency,
decrease the amount of
administrative work
Closer customer
relationship, improve demand planning
Improve customer service,
reduce the costs for
production, transports
and investments
Strengthen the joint
competitiveness by increased
productivity and reduced tied up
capital throughout the whole supply
chain
Increase the volume and the numbers
of close supplier
collaborations
VMI start Nov 2005 2004 May 2005 2003 Nov 2005 2005
VMI products
Standard and complex steel
parts specially
made for Alfa Laval
Glass cans of food
Packaging for daires
Packaging for food
Products specially made for Alfa Laval
which are stored at Alfa Laval’s site
High valued, x-ray
equipment solutions
Demand pattern
Two different: Stable
demand, high demand at
certain intervalls
Stable demand
Different
Predictable and stable demand,
high volume
Different Stable
Risks
Not beeing paid due to
overastimated demand
No particular Incorrect
data, system failures
Stock outs, incurrant
items
Harder to switch supplier, more vulnerable
when something
happen to the supplier
Transfering of the
reponsibility to the
supplier leads to a risk when
something happen to the
supplier
6.3. ERP integration
All information collected from the case interviews regarding ERP integration are summarized in Table 6.3.
The case companies have different solutions to the ERP integration problem in the VMI relationships. Some companies use an interface between the two ERP systems, while some have a direct connection. The exchanged information is also transferred in different ways: between humans and humans, systems and systems or between humans and systems. The relation between the ERP integration level and the communication type can be seen in Figure 6.3.

80
From the matrix some interesting conclusions can be drawn. Large companies, like PFAB and SCA, are found in the right part of the matrix. The authors believe that the fact that they are using the same large ERP system as their VMI partner facilitate the system-to-system commuincation. SCA is using an interface between the two ERP systems, while PFAB is directly linked to their customer. The authors believe that the fact that PFAB is collaborating with a customer which does not have an own production simplifies the integration and the direct connection is easier to implement. Tetra Pak is also directly linked to their customers, but is using both EDI and e-mail communication which result in some human-to-system communication. The reason for not being able to use only EDI messages, the authors believe is because Tetra Pak is collaborating with many different customers with different ERP systems. Not all customers are able to work with a B2Bi solution.
Alfa Laval is using a web portal as an interface between their ERP system and their suppliers’. Alfa Laval has many VMI suppliers with different ERP systems and states that this solution involving both human-to-system and system-to human communication is the best one for them. Because of this fact, Alfa Laval and CEPA is placed in-between the lower left and the lower right element of the matrix. Like CEPA, Arcoma is also a small company and their ERP solution is based on a simple interface and the main communication is between humans.
Figure 6.3: Relation between ERP integration level and communication type

81
Table 6.3: ERP integration information from the case companies
CEPA PFAB SCA Tetra Pak Alfa Laval Arcoma
ERP system Monitor Movex SAP R/3 SAP R/3 Jeeves iScala
ERP system partner
Jeeves Movex SAP R/3 Different Different Different
ERP integration type
Web portal Directly linked
Interface "SMART"
Directly linked Web portal
Simple Interface
"SupplyPartner"
Developer of the ERP solution
INXL Lawson (former Intentia)
PipeChain A standard SAP tool
INXL Torbjörn Peterson
Communication type
Manually (+ EDI)
EDI EDI EDI and e-mail EDI (+
manually) e-mail
Cost of implementation
Very little for CEPA
? ~30.000
Euro ?
Not known by
interviewee
20.000 SEK
Payer of the implementation
Customer
Shared by PFAB,
Semper and
Lawson (Intentia)
Both Tetra Pak Alfa Laval Arcoma
Pros with the solution
Decisions made by humans
Information can be
reached and
handled by different
employees - no
dependency on one employee
Visualization of the
information in SMART
is very clear,
customer production planning is visualized
Works with both EDI and
e-mail communicatio
n
No system integration problems
Easy to read and work with
it, graphic visualization, the suppliers
can have different ERP
systems
Cons with the solution
Risk of typing in
the wrong informatio
n
Does not work with other ERP systems
Translating forecasts to schedules
for the producing machines
Risk for inaccurate information with e-mail,
due to manual work
Risk of typing in
the wrong information
Manual work with order
confirmation, "one-man-business solution"
Regarding the cost for the VMI solutions, the authors conclude that the company which took the initiative to the VMI relationship often was the payer for the ERP solution. However, in the SCA-Arla relationship, SCA contributed to the payment even though Arla was the one who took the initiative. Furthermore, the authors conclude that the cost for an EDI based solution is much higher than for a manual one.
All case companies are satisfied with their ERP integration solution. Alfa Laval and CEPA both state that there is a risk for typing in the wrong information when working manually with the web portal, but that the pros well

82
exceeds the cons. CEPA state that it is necessary for them that there is a human being who takes decisions and Alfa Laval has a major advantage in having no system integration problems when working with several supplier with different ERP systems. PFAB states that their solution works perfectly well in the Semper relationship but in contradiction to the web portal the solution does not work with other ERP systems. Likewise, SCA’s SMART interface is designed for SAP and does not work with other ERP system, in contradiction to Tetra Pak’s solution. When working with several customers/suppliers the system independency seems to be important. Arcoma emphasises the simplicity with the ERP solution. Their solution is simple and cheap but works perfectly, independent of what ERP system the supplier has. Some manual work could be reduced by sending, for example, the order confirmation through EDI, but Arcoma is not willing to pay that price.
To conclude, the smaller case companies and/or companies which are collaborating with several customers have manual or semi-manual solutions, often with an interface. EDI communication and/or a direct link between the ERP systems are more common among large companies collaborating with a single company.
6.4. Information sharing
The information shared in each particular VMI relationship is summarized in Table 6.4. In all cases inventory levels, demand forecasts and historical data are shared by the customer in the relationships. In SCA’s case the information sharing goes one step further, as information from Arla’s production also is shared. This visualization of the production to the supplier can decrease the uncertainty in the supply chain further. Moreover, information about a maximum and a minimum level, in which the supplier should keep the inventory between, is shared by Alfa Laval and with SCA.
From all suppliers a delivery report is sent when the goods are shipped containing information about the goods and the transportation. In addition to this, in SCA’s and PFAB’s case, a replenishment report is sent before the shipment, containing information about what the supplier intend to deliver. In PFAB’s case Semper is daily updated about PFAB’s production status since Semper has an obligation to their customers that at all times be able to provide information about exactly when they will deliver. Additionally, the customer can confirm the delivery by sending a goods receipt advice. Finally, in all relationships, an invoice is sent to the customer.

83
Table 6.4: Information sharing in the case companies’ VMI relationships
Information shared by the customer
CEPA PFAB SCA Tetra Pak Alfa
Laval Arcoma
Inventory levels Yes Yes Yes Yes Yes Yes
Demand forecasts Yes Yes Yes Yes Yes Yes
Production planning No - Yes No No No
Historical data Yes Yes Yes Yes Yes Yes
Max/Min level Yes No Yes No Yes No
Goods receipt advice No No Yes No No No
Information shared by the supplier
Replenishment report No Yes Yes No No No
Delivery report Yes Yes Yes Yes Yes Yes
Invoice Yes Yes Yes Yes Yes Yes
Based on information from the case companies the authors visualize the cross case analysis result regarding information sharing in Figure 6.4. The broken lines represent information which is not shared in all relationships.
Figure 6.4: Information sharing in the case companies’ VMI relationships

84
When having concluded what kind of information is shared in the studied VMI relationships, the authors have summarized all additional issues regarding information sharing in Table 6.5. In general, the companies have minor problems with inaccurate information, except for the demand forecast. How to handle the forecast inaccuracy problem must be predetermined in the contract between the two companies.
Looking at the suppliers, the authors conclude that they are facing some difficulties in using the information received in order to improve their own production. CEPA states that they need a larger part of the total demand included in VMI relationships to be able to use the information shared to improve production planning. SCA is facing problems in translating the forecasts information into machine hours needed. In contradiction, PFAB states that the additional information provided has made the production more efficient. A reason for this could be that PFAB has a separate production line for the Semper products, which can be adjusted to this particular demand without interfering with other products. Furthermore, the customers do not feel that any information is sensible to share with the suppliers and the suppliers are in general satisfied with the information sharing and state that there is no information which is not shared which they would like to have.
Table 6.5: Information issues in the case companies’ VMI relationships
CEPA PFAB SCA Tetra Pak Alfa Laval Arcoma
Accuracy of information
Most of the information is accurate except for forecasts
Most of the information is accurate except for forecasts
Not always
accurate due to late replanning from the customer
Most of the information is accurate except for forecasts
Minor problems
Most of the information is accurate except for forecasts
Usage of information in own production
No, but if a larger part of the total
the demand is icluded in
VMI realtionships they would be able to
Yes
Problems in
translating forecasts
into production schedules
Yes - -
Additional information/functionality needed
A column for sorting
information in the web
portal
No No No
Sorting tool and payment
information in the web
portal
No
Sensible information to share
- - - - No No

85
6.5. Result of the VMI implementation
The results of the VMI implementations at the case companies are conducted based on the total cost model and are summarized in Table 6.6. For each parameter in the total cost model and for each company, there is an arrow indicating whether the parameter has increased, decreased or is unchanged at each company.
Table 6.6: Result of the VMI relationships
CEPA PFAB SCA Tetra Pak Alfa Laval Arcoma
Service levels → ↑ ↑ ↑ ↑ ↑ Administration costs → ↓ → → ↓ ↓
Inventory costs ↓ ↓ ↑ ↓ → ↓ Production costs ↓ ↓ ↑ ↓ - - Transportation costs ↓ → ↑ → ↓ ↑
All case companies, except for CEPA, state that the service level has been improved after starting VMI. At CEPA, the service level was already 99 % towards Alfa Laval and could not easily be improved further. However, Alfa Laval states that in some of their relationships the service level has decreased due to inaccurate information from Alfa Laval’s side.
Regarding administration costs, no company has stated higher administration costs after implementing VMI. CEPA, SCA and Tetra Pak state that their administration costs are unchanged. The administration costs did decrease at both PFAB as well as at Alfa Laval and Arcoma. Alfa Laval reports decreased administration levels as the employees can spend more time on forecast processes instead of ordering. However, the administration level has increased for the invoices which are dealt with in another ERP system, Movex. Arcoma states that the ordering process has been facilitated as less human interference is needed. To conclude, both customer companies show decreased administration costs whereas most of the suppliers state unchanged costs. The authors believe that the customers can benefit by fewer employees needed for the normal administrative tasks at their companies. Instead, these employees can focus on forecasts and other administrative tasks. Regarding the suppliers, some of them experienced increased administrative work directly after implementing VMI. However, this has been improved as the suppliers have

86
learned how to make use of the benefits of VMI and have access to more accurate information from the customer.
All suppliers, except for SCA, state that the inventory costs have decreased as a result of the VMI implementation. In the case of SCA, the company has had more difficulties in the beginning of their VMI collaboration than the other suppliers and has shown overall more negative results. At SCA, the inventory levels of the raw material are unchanged whereas the inventory of finished goods has increased remarkably from 1 day to 17 days in stock as a result of the VMI implementation. At both CEPA and PFAB the inventory levels have decreased due to the fact that the companies deliver to the stock at the customers’ site instead of storing the products inhouse waiting for the orders to come.
Regarding inventory levels at the customers, Arcoma reports decreased inventory costs whereas Alfa Laval stated that the inventory costs have not changed after implementing VMI. In the case of Alfa Laval, the company estimated an increased inventory level when starting VMI, but the result shows an unchanged level. Alfa Laval believes that there can be two reasons for this unchanged level; either the company had too much stock before or the suppliers do not have the time to replenish due to an increase in demand. At Arcoma, the inventory costs have decreased due to JIT deliveries.
The production costs have decreased at all suppliers, except for SCA. At SCA, both productivity and machine utilization decreased after starting VMI due to new set ups but today they have become more efficient. Also at CEPA, the production efficiency can be further improved. The company states that the material utilization has been improved, but not the machine utilization. Tetra Pak and PFAB state improved productivity and machine utilization due to flexibility in the production.
Regarding the transportation costs, different results have been found at both suppliers and customers. Both CEPA and Alfa Laval report the transports to be less after starting VMI. A reason for this can be that CEPA can choose to deliver only once a week as long as they keep the stock at Alfa Laval in-between the minimum and the maximum level. SCA states an increased number of transportations as SCA sometimes now is required to deliver every day. Though, SCA has a span with a minimum and maximum number of articles that each transport should contain and this span facilitates the planning of transportations for SCA. Arcoma states that their increased transportation costs are due to JIT, which contributes to decreased inventory levels but an increased number of transportations.

87
6.6. Future development
All companies, except for CEPA, state that their existing VMI relationships will be further developed. Both PFAB and SCA are implementing Advanced Planning Optimization (APO) which will help translating forecasts into production schedules. Tetra Pak aim to increase the profitability by automating the flow of data, improve the service agreements and gain a better understanding of how the factories manage the VMI volumes. At Alfa Laval the VMI process will be further developed both conceptually and through IT solutions. The VMI process at Arcoma will be developed by increased volumes and higher turnover of existing products. In contradiction to the other case companies, Arcoma has no plans for starting new VMI collaborations. Both CEPA and PFAB want to start new VMI relationships. In the cases of SCA and Tetra Pak, both companies will start more VMI relationships but especially with high volume customers. Alfa Laval will expand their VMI collaborations by launching VMI in both Italy and the United States.
To conclude, in general, the case companies aim to further develop their VMI solutions in the future either with existing VMI partners or by starting new VMI relationships.

88

89
7. Conclusions
Firstly in this concluding chapter, answers are given to the research questions
stated in chapter 1. Secondly, the main purpose of the thesis is discussed as
the authors present suggestions to Microsoft regarding the VMI
implementation in AX. Finally, suggestions for future research are made.
7.1. Answers to research questions
The answers to the research questions are given based on the findings from the literature studies and the cross case analysis.
7.1.1. RQ1: Why do companies implement VMI?
After conducting the case studies, the authors conclude that the initiator behind the VMI implementation was always larger or of the same size as the initiating company, irrespective of if it was the supplier or the customer who initiated the VMI process. This assumption is in accordance with previous information stated in the theoretical framework where both Hines et al. (2000) and Huang et al. (2005) state that smaller companies often must implement VMI to satisfy larger companies.
Regarding the purpose of the VMI implementation, the authors found a strengthened customer relationship as a motive for the suppliers to start VMI collaborations. Securing a long-term working relationships and gain a closer relationship with the customer is also stated in the theoretical framework as a motive for the suppliers (Hines et al., 2000: Huang et al., 2005). Regarding purpose for the customers, Nolan (1997) states increased inventory turns, and reduced inventory costs are mentioned as another motive by Hines et al.
(2000). Due to the fact that only two customer companies were interviewed, the authors cannot conclude a general purpose of why customers start VMI collaborations.
The VMI products at the case companies indicated to be very different and no general conclusions can be drawn either from the case studies or from the literature. Likewise, the authors state that no generic demand pattern can be found at the case companies. In essence, the case companies have stable and overall predictable demand for their VMI products. Stable and predictable demand needed for VMI products are in accordance with information stated in the theoretical framework (Nolan, 1997; Yang et al., 2003; De Toni & Zamolo, 2005). To conclude, the authors believe that stable or predictable demand is essential for a successful VMI collaboration. Moreover, the lack of

90
stable demand for the VMI products is one of the reasons for SCA’s negative results. According to Yang et al. (2003) the best strategy for SCA would be to restrict the VMI collaboration to a few high volume customers.
The customers mentioned strengthened relationship with the suppliers as a risk when the customer becomes more dependent on the supplier in a VMI collaboration, and thus it is harder to switch. This fear of losing the control is mentioned by Kaipia et al. (2002) and De Toni & Zamolo (2005). On the other hand, the suppliers state incorrect information from the customer as a large risk in the VMI implementations. The authors state that 100 % correct forecasts are impossible to provide, but correct information is an essential aspect for a successful VMI collaboration.
There are several possible benefits and disadvantages when starting VMI collaborations described in the theoretical framework. After conducting the case studies, the authors have evaluated the consequences of implementing VMI at the chosen companies.
Improved service level is mentioned by Hines et al. (2000) as a main reason why both suppliers and customers initiate VMI implementations. This assumption is in accordance with the fact that all case companies report an improved service level after starting VMI collaborations. The authors believe that this is due to the facilitated planning and reduced re-planning for the customer (De Toni & Zamolo, 2005; Nolan, 1997; Nolan, 1997) and information transparency and improved visibility for the supplier to anticipate deliveries (Huang et al., 2005). To conclude, improved visibility and flexibility are advantages for both customers and suppliers. However, information about service levels and information visibility must be regulated in an agreement to be apparent to both parts and avoid misinterpretations.
Reduced administrative costs were also mentioned by Hines et al. (2000) as a main reason why companies start VMI implementations. In the conducted case studies, the customer reported decreased administration costs whereas most suppliers have unchanged costs. The authors believe that decreased administration costs for the customers are effects of the fact that fewer employees are needed for the normal administrative tasks. This conclusion is in accordance with the theoretical framework where Hines et al. (2000) state that eliminated transactions for the customers can result in decreased administrative costs.
Regarding the inventory costs Hines et al. (2000) state that the supplier can benefit from VMI by making better use of the inventory and reduce buffer stock and tied up capital. The authors state that most companies, both suppliers and customers, reported decreased inventory costs. Even though two companies reported increased or unchanged inventory costs, the authors

91
believe that inventory costs will decrease at these companies after the VMI collaborations have been in practise for some years. To conclude, both the theoretical framework and the case studies confirm that there are great potentials for decreased inventory costs after starting VMI.
The production costs have decreased at all suppliers, except for SCA, but the authors believe that here is also a question of learning time for the new VMI process. Both Huang et al. (2005) and Kaipa et al. (2002) state that suppliers can make use of better information and forecast and thus organize their production after demand. The authors believe that SCA has reported more negative results in their collaboration with Arla due to the smaller production batches, mentioned in the literature by Holweg et al. (2005), and the adjustment to meet Arla’s demand with new set ups and enlarged inventory, mentioned by Hines et al. (2000). The authors conclude that there are possibilities for improved productivity at the supplier when implementing VMI but this depends on production demands stated by the customer.
In summary, the case companies have reported overall positive results after implementing VMI and want to develop the collaborations further. However, SCA reported more negative results than the other companies. One reason for this could be that the VMI collaboration between SCA and Arla started recently and has not had the time to stabilize, but another aspect could be that the products involved are not appropriate for VMI.
7.1.2. RQ2: What information needs to be transferred between the supplier and the customer and vice versa in a VMI relationship?
The authors conclude that the findings from the cross case analysis regarding the information needed in a VMI relationship coincides well with the findings from the literature studies. This can be summarized in Figure 7.1. The broken lines represent information which does not need to be sent, but is found to be sent in some VMI solutions.
The supplier is provided with demand forecast, inventory levels and historical data. If an agreement has been made about extending the visibility into the customer’s production, production planning information should also be provided. When delivering the products the supplier should send a delivery report about what products are sent. If the customer needs information earlier than at the time of shipment about what products will be sent, a replenishment report can be sent during the production process. Furthermore, the literature suggest a goods receipt advice to be sent by the customer to inform the supplier what products have been delivered, but the authors have found that

92
this report is skipped in some cases. Finally, an invoice is sent and a payment is made.
Figure 7.1: Information sharing in a VMI relationship
7.1.3. RQ3: How can the information be transferred between the supplier’s and the customer’s ERP system in a VMI relationship?
The authors conclude after having conducted literature and case studies, that the exchanged information can be transferred in several different ways between the supplier and the customer. All interviewed case companies are satisfied with their VMI solution and the authors conclude that there are different ways of transferring the information successfully. The authors believe that depending on the size of the company and the number of suppliers/customers, some communication methods are more appropriated than others.

93
Human-to-human-communication
The only human-to-human-communication type found in the case studies is e-mail, which is the simplest form of transferring information electronically. According to Mattson (2002), e-mail can be considered to be human-to-human-communication even though there is a need for computers to send and receive the information between the customer and supplier. The company using e-mails, Arcoma, emphasizes the simplicity and the low set up costs of their VMI solution and the fact that e-mails are independent of the other part’s ERP system. The authors believe that many companies have e-mail communication instead of, for example EDI, due to the lower costs. E-mails are not always sent in a structured or organized way and can be interpreted differently by humans. In this way, the VMI process can become dependent on one employee and cause problems as humans are involved in the decision making. The authors believe that e-mail communication is likely to be found at smaller companies where there are fewer employees involved in the VMI process.
Human-to-system / system-to-human-communication
A web portal provides both human-to-system and system-to-human communication. When the supplier collects the VMI information in the web portal there is a system-to-human communication. The web portal also has to be edited manually by the supplier, that is to say human-to-system communication. This VMI solution has the advantage of having no system integration problems and that humans are involved in the decision making. However, the manual editing in the system can cause problems if wrong information is typed into the web portal. The web portal can be an extension and directly linked to the customer’s ERP system and the information can be automatically transferred. The authors believe that a web portal between the supplier and customer is appropriate when the customer has many smaller suppliers with different ERP systems.
Another case of human-to-system-communication is when e-mails are sent by humans and interpreted by ERP systems. Examples of such communication the authors have found in Tetra Pak’s VMI solution. Also here there is a risk for inaccurate information due to manual work.
System-to-system-communication
System-to-system-communication offers two different VMI solutions; one with an interface between the two ERP systems and the other one when the ERP systems are directly linked.

94
Two of the interviewed case studies had directly linked VMI solutions between the ERP systems. The authors believe that the direct link is facilitated by having the same ERP system. Furthermore VMI integration costs can be less than with an interface requiring new set ups. If the company already is using EDI messages, the VMI implementation can be facilitated and the implementation costs even less. Furthermore, a direct linked VMI integration solution reduces errors and misinterpretations. Though, if errors occur in system-to-system-communication they can cause huge problems as the wrong information is directly transferred into the production.
As mentioned, a direct linked VMI solution is facilitated when both the supplier and the customer have the same ERP system and this can restrict the number of parts involved in the VMI collaboration. An interface between the ERP systems with more logic may be required to communicate the production planning information from the customer, even though both customer and supplier have the same ERP system. The authors have found an example of an interface solution of this kind at SCA.
7.2. Suggestions to Microsoft
Based on the findings from the literature studies and the cross case analysis the authors make suggestions to Microsoft in this section. Firstly, some general suggestions are made. Secondly, two main models of how Microsoft could implement VMI functionality in AX are discussed. The first one describes the case when AX is being used by the customer in a VMI relationship and the second when AX is being used by the supplier.
Microsoft will benefit from having VMI functionality in AX
The authors have found many potential benefits by implementing VMI in the literature studies. These advantages are confirmed by the benchmarking case studies as the case companies, in general, report positive results after having implemented VMI. Moreover, most companies intend to further develop the VMI relationships and start new ones in the future. These facts make the authors believe that it is necessary for Microsoft to have VMI functionality in AX to be able to compete successfully in the future.
Full visibility of information is needed
The authors conclude that it is not possible to implement VMI without sharing all the information shown in Figure 7.1. It is not possible to start a ”light

95
version” of VMI by, for example, only share inventory levels. Because of this fact, AX must be able to visualize this data when being used at the customer side in a relationship. When AX is being used by the supplier AX must be able to generate internal sales orders based on the information shared by the customer.
The VMI solution must be generic, flexible and easy to implement
The authors have found that the information which needs to be sent in a VMI relationship is sent in many different ways depending on differences in, for example, company sizes, ERP systems and number of VMI partners. To be able to satisfy all customers Microsoft must have a VMI solution which can use different methods of communication, e.g. EDI messages, e-mail and a web-portal. However, the solution must also be generic and easy to implement in order to satisfy customer needs without a need for add-on solutions by partners. Furthermore, the authors have found that a solution which is not dependent on a certain ERP system makes the customer more flexible as it can choose a VMI partner with any ERP system.
7.2.1. Generic VMI solution for AX – customer
The authors suggest a “generic VMI solution for AX – customer”, Figure 7.2. In this case the VMI customer is using AX and the supplier is using any ERP system.
The VMI information which needs to be shared must be extracted from AX. Whether or not production planning information should be shared should be stated in the VMI agreement between the two companies. As discussed earlier AX must be able to send the information in different ways in order to satisfy different customer needs. Therefore, the authors suggest that AX should be configured in such a way that it is able to send the information either by EDI, via a web portal or by e-mail. Thus, the customer is able to choose communication method when setting up a VMI relationship to a supplier. In the same way, the customer is able to choose communication method for the receiving VMI information.

96
Figure 7.2: Generic VMI solution for AX - customer
7.2.2. Generic VMI solution for AX – supplier
The authors also suggest a “generic VMI solution for AX – supplier”, Figure 7.3. In this case the VMI supplier is using AX and the customer is using any ERP system.
The VMI information is shared by the customer either by EDI, via a web portal or by e-mail and AX should be configured to be able to receive the information in the various ways. However, only receiving the information is not enough. The information must be interpreted and internal sales orders be created. AX should also be able to send a replenishment report and a delivery report in various ways. Also here, AX should be configured to be able to handle various methods of communication and Microsoft’s customer should be able to choose the most suitable one for the specific VMI relationship.
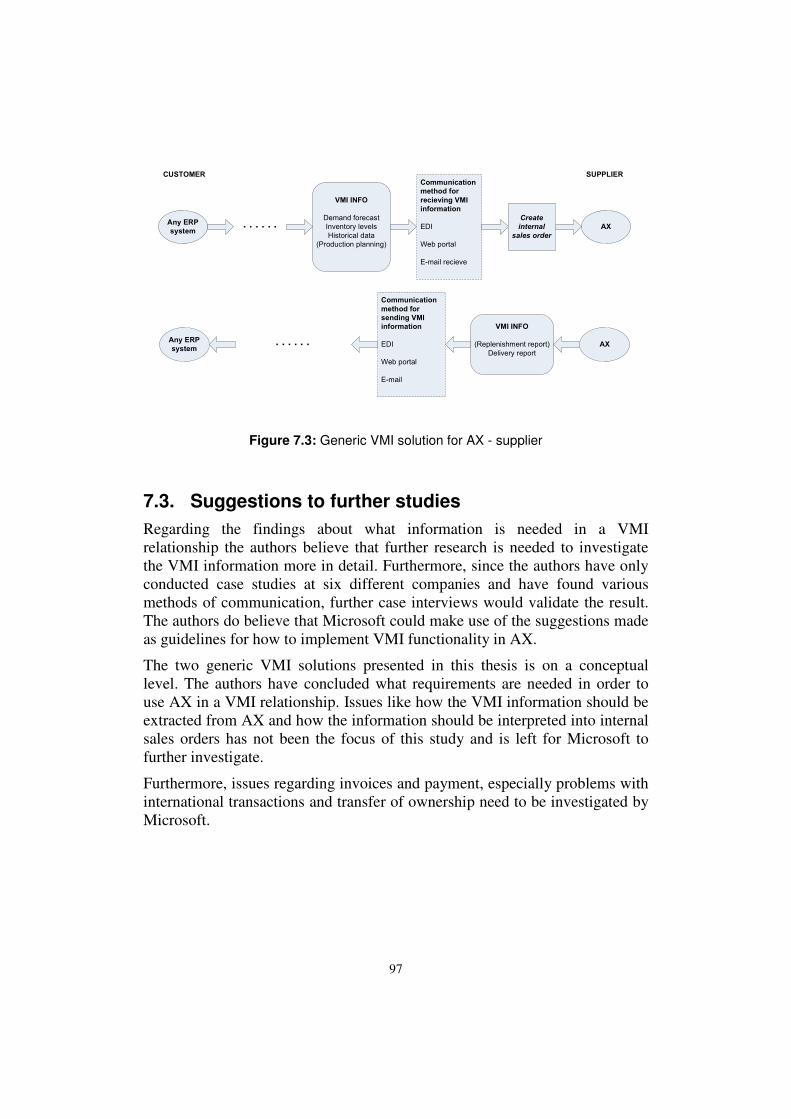
97
. . . . . . Any ERP
system
VMI INFO
Demand forecast
Inventory levels
Historical data
(Production planning)
Communication
method for
recieving VMI
information
EDI
Web portal
E-mail recieve
AX
VMI INFO
(Replenishment report)
Delivery report
Communication
method for
sending VMI
information
EDI
Web portal
AXAny ERP
system. . . . . .
Create
internal
sales order
CUSTOMER SUPPLIER
Figure 7.3: Generic VMI solution for AX - supplier
7.3. Suggestions to further studies
Regarding the findings about what information is needed in a VMI relationship the authors believe that further research is needed to investigate the VMI information more in detail. Furthermore, since the authors have only conducted case studies at six different companies and have found various methods of communication, further case interviews would validate the result. The authors do believe that Microsoft could make use of the suggestions made as guidelines for how to implement VMI functionality in AX.
The two generic VMI solutions presented in this thesis is on a conceptual level. The authors have concluded what requirements are needed in order to use AX in a VMI relationship. Issues like how the VMI information should be extracted from AX and how the information should be interpreted into internal sales orders has not been the focus of this study and is left for Microsoft to further investigate.
Furthermore, issues regarding invoices and payment, especially problems with international transactions and transfer of ownership need to be investigated by Microsoft.

98

99
8. References
8.1. Books
Arbnor, Ingeman; Bjerke, Björn, Methodology for creating business
knowledge, 2nd edition, SAGE Publications, Thousand Oaks, California, pp. 49-52, 65, 70, 80-83, 92-93, 157, 224-228.
Aronsson, Håkan; Ekdahl, Bengt; Oskarsson, Björn (2003), Modern logistik-
för ökad lönsamhet, Grahns Tryckeri AB, Lund, pp. 31-34.
Bryman, Alan; Bell, Emma (2003), Business research methods, 1st edition, Oxford University Press, Oxford, New York, pp. 12, 14, 25, 40, 76, 80, 88-89, 234, 279, 302-303.
Christopher, Martin (1992), Logistics and Supply Chain Management, 2nd edition, Biddles Ltd, Guildford and King’s Lynn, Great Britain, pp. 13, 195-201.
Hines, P.; Lamming, R.; Jones, D.; Cousins, P.; Rich, N. (2000), Value Stream
Management-Strategy and Excellence in the Supply Chain, 1st edition, Pearson Education Limited, Great Britain, pp. 335-355.
Holme, Idar Magne; Solvang, Bernt Krohn (1997), Forskningsmetodik-Om
kvalitativa och kvantitativa metoder, 2nd edition, Studentlitteratur, Lund, Sweden, pp. 13, 34-36, 51, 76, 79, 81.
Hossain, Liaquat; Patrick, Jon David; Rashid, M.A. (2002), Enterprise
Resource Planning: Global Opportunities & Challanges, Idea Group Publishing, Hershey.
Lee, H.L; Whang, S. (2001), The Practice of Supply Chain Management:
Where Theory and Application Converge, Springer, New York, pp.123-138.
Mattson, Stig-Arne (1999), Effektivisering av materialflöden i supply chains, Lenanders tryckeri AB, Kalmar.
Mattson, Stig-Arne (2000), Embracing Change-Management strategies in the
e-economy era, Intentia International, Print: Graphium/Västra Aros, Sweden, pp. 281-341.
Mattson, Stig-Arne (2002), Logistik i försörjningskedjor, 1st edition, Studentlitteratur, Lund, pp. 352- 362.
Ptak, Carol A.; Schragenheim, Eli (2000), ERP: Tools, Techniques and
Applications for Integrating the Supply Chain, Boca Raton, Fla.: St Lucie Press, cop.

100
Saunders, M.N.K.; Lewis, P; Thornhill, A. (2000), Research methods for business students, 2nd Edition, Financial Times/Prentice Hall, cop., Harlow
Schary, P.B.; Skjott-Larsen, T. (2003), Managing the global supply chain, 2nd edition, Copenhagen Business School Press, Copenhagen.
Wallén, G (1996), Vetenskapsteori och forskningsmetodik, Studentlitteratur, Lund.
Wiedersheim-Paul, F.; Eriksson, L-T (2001), Att utreda, forska och rapportera, Liber Ekonomi, Malmö, pp. 38, 200.
Yin, Robert K., 2003, Case study research: design and methods, 3rd edition, Sage Publications, Thousand Oaks, California, pp. 3, 13, 14.
8.2. Articles
Andres, A.; Nachtmann, H.; Waller, M.A. (2004), Supply Chain Information sharing in a vendor managed inventory partnership, Journal of Business
Logistics, Vol.25 No.1 Pages: 101-120.
Chen, Injazz J. (2001), Planning for ERP systems: analysis and future trend, Business Process Management Journal, Vol. 7, No. 5.
Cotrill, Ken (1997), Reforging the supply chain, The Journal of Business
Strategy, Nov. 1997, 18,6, pp. 35-39.
Davenport, Thomas H. (1998), Putting the Enterprise into the Enterprise System, Harward Business Review, July-August.
Disney, S.M. & Towell, D.R. (2003), Vendor-managed inventory and bullwhip reduction in a two-level supply chain, International Journal of
Operations& Production Management, 2003, 23, 5/6.
De Toni, A. & Zamolo, E (2005), From a traditional inventory to vendor managed inventory: A case study from the household electrical sector, International Journal of production economy, No.96, pp. 63-79.
Elvander, M. (2005), A theoretical mapping of the VMI concept - A literature review. Secondary source: Sandel and Jöhne (2002), Att jobba med leverantörsstyrda lager: VMI i praktiken. PLAN- nytt, No.3.
Fisher, M.L (1997), What is the right supply chain for your product, Harward
Business Rewiew, Vol.75 No.2.
Hall, Carl (2001), What is VMI?, Enterprice Data Management, 2001.
Holmström, J.; Småros, J.; Disney, S.M, Towill, D.R. (2003), Collaborative supply chain configurations: The implications for supplier performance in

101
production and inventory control, Paper presented at the 8th
international
symposium on Logistics, Seville, Spain, July 6th- 8th 2003.
Holweg, M; Disney, S; Holmström,J; Småros, J (2005), Supply Chain Collaboration: Making Sense of the Strategy Continuum, European
Management Journal, Vol 23, No. 2, pp. 170-181.
Huang, X, Lin, L., Xiong, Y (2005), Analysis of extra cost for small suppliers under VMI condition, Services Systems and Services Management, Vol.1, pp. 626-629.
Jensen, B (2001), It’s about time!, Communication World, Vol.18, No.3.pp.16-19.
Kaipia.J; Holmström, J; Tanskanen,K. (2002), VMI-What are you loosing if you let your customer place orders?, Production planning and control, Vol 13, No.1, pp. 17-25.
Lee,H.L; Padmanabhan, V.; Whang, S. (1997), The Bullwhip Effect in Supply Chains, Sloan Management Review, Spring 1997.
Leopoulos, V.; Kirytopoulos, K.; Voulgaridou, D. (2005), ERP systems as a component of the electronic supply chain: Classification of implementation risks, Computational Intelligence for Modelling, Control and Automation,
2005 and International Conference on Intelligent Agents, Web Technologies
and Internet Commerce, International Conference on, Vol. 1, 2005, pp. 676-682.
Nolan, K. (1997), For Marmon/Keystone, VMI Offers Real Procurement Solutions, Metal Center News, February 1997; 37,2.
Småros, J; Lehtonen,J.M; Appelqvist, P; Holmström, J. (2003), The impact on increasing demand visibility on production and inventory control efficiency, International Journal of physical distribution and logistics management, Vol. 33, No.4.
Waller, M; Johnson, M.E; Davis, T (1999), Vendor Managed Inventory in the retail supply chain, Journal of Business Logistics, Vol. 20, No.1.
Yang, K-K; Ruben, R.A.; Webster, S. (2003), Managing Vendor Inventory in a dual level distribution system, Journal of Business Logistics, 2003;24,2. pp. 91-108.
Zuckerman, Amy (2005), Pushing ERP Integration Into The Supply Chain, World Trade, Vol. 18, No. 3, pp. 54-55.

102
8.3. Oral Sources
Astrup, Vera, Microsoft Development Center Copenhagen
Holfelt, Christina, Project Manager for VMI strategies, Tetra Pak, Malmö
Loftorp, Ann, Project Manager at Operations Development and responsible for VMI, Alfa Laval, Lund
Lundberg, Richard, Purchaser and VMI Manager, Arcoma, Växjö
Lynnerup, Per Lykke, Program Manager, Microsoft Development Center Copenhagen
Månsson, Thomas, Production Planner and responsible for VMI, Procordia Food AB, Eslöv
Nielsen , Peter, Local Manager , CEPA Steeltech, Lund
Paulsen Byg, Gitte, Project Manager SCM/VMI, SCA Packaging, Randers
Ståhl Elvander, Mikael, Department of Industrial Management and Logistics, Lund University, Lund
8.4. Internet Sources
Elvander, M. (2006), www.tlog.lth.se/documents/2/Fö13VMI-föreläsning061120-MikaelS.Elvander.pdf, Nov 30, 2006
www.alfalaval.com, Jan 6, 2007
www.cepa.se, Nov 25, 2006
www.microsoft.com/danmark/om/presentation.mspx, Feb, 1, 2007
www.procordiafood.com, Jan 5, 2007
www.sca.com/en/About_SCA/SCA_in_Brief/, Nov 24, 2006
www.tetrapak.com/Sweden, Dec 8, 2006
www.vendormanagaedinventory.com, Oct. 20, 2006

I
Appendix

II
Appendix A: Interview Guide Benchmarking Case Studies
Basic facts
Date:
Company:
Interviewee:
Position:
General questions about VMI (ca. 30 min)
1. What are your responsibilities at your company?
2. Describe the VMI process at your company in short.
3. Why did you implement VMI at your company?
4. What are your short/long term goals?
5. Who initiated on the VMI implementation?
6. Why did you choose to collaborate with this partner?
7. When did you implement VMI?
8. What was the reaction from the employees at your company when
introducing VMI?
9. Where is your VMI-partner located?
10. What is the demand pattern of the product(s)?
11. What are the product(s) characteristics?
12. Who owns the inventory?
III
13. What is the major risk(s) with the VMI implementation?
14. What are your previous experiences with VMI?
15. How many VMI implementations does your company have?
VMI and ERP (ca. 30 min)
1. What type of ERP system are you using?
2. What type of ERP system is your VMI-partner using?
3. Is VMI integrated in your ERP-system or a stand-alone solution?
4. Is the VMI functionality standard in your ERP system or specially
design for your company?
5. Who developed the VMI solution?
6. How much did it cost?
7. How long time did it take to develop/implement?
8. Who paid for it, you or your VMI partner?
9. What information is shared? What is not shared?
10. How is the information shared?
Result of VMI implementation (ca. 30 min)
1. Have the VMI implementation resulted in changed service levels?
a. Sales volume? Stock out costs?
2. Have the VMI implementation resulted in changed administration
levels?

IV
a. Order process? Forecast process? Invoice process?
3. Have the VMI implementation resulted in changed inventory level?
a. Raw material? Finished goods? Work in process? Safety stock?
4. Have the VMI implementation changed the production?
a. Productivity? Machine utilization? Through put time?
5. Has the VMI implementation changed the number and type of
transportations?
6. What are the pros and cons with the ERP integration solution?
7. If you would have had the same ERP system as your VMI partner,
would this have made the implementation easier?
Supplier specific questions (ca. 30 min)
1. How many customers does your company have?
2. How large is the VMI-customer(s) in terms of demand?
3. Is there any information that is not provided by the customer that you
would like to have?
4. Is there any unnecessary information provided by the customer?
5. Is the information accurate?
6. What are the causes of inaccurate information?
7. What are the effects of inaccurate information?
8. Do you use the information to improve your own production?
9. How do you handle the trade off between VMI-deliveries and
production efficiency? - batching problems, safety stock etc.
V
10. How could you profit more from the VMI relationship?
11. Will the VMI relationship be further developed in the future?
Buyer specific questions (ca. 30 min)
1. How many suppliers does your company have?
2. How large is the VMI-customer(s) in terms of demand?
3. Has the balance of power changed to the supplier side?
4. Is any information sensitive to share with the supplier?
5. Has any information leaked to competitive companies during the VMI
process?
6. Is the information shared accurate?
7. What are the causes of inaccurate information?
8. What are the effects of inaccurate information?
9. How could you profit more from the VMI relationship?
10. Will the VMI relationship be further developed in the future?

VI
Appendix B: Signals in the information sharing
• #852 - Product Activity
This information is sent by the buyer and entails information about inventory level, product activity and sales at the buyer (www.vendormanagedinventory.com, Oct 20, 2006). The inventory information is generally divided in categories such as on order, on hand, committed, back ordered and so forth. This transaction is the core of the VMI process and is sent by the buyer on a determined schedule, often daily (Hall, 2001).
Main fields in product activity:
• Quantity Available (QA) - Current inventory available at the buyer.
• Stock Type (QA) - reference segment)-“P”= Managed, “N”= NonManaged
• Quantity on Order (OP) - The buyer’s backorder with the supplier.
• Quantity Out of Stock (QO) - Buyer’s backorder to end customer.
• Quantity Sold (QS) - Total volume sold since the last transmission.
• Frequency (QS) - Number of sales that makeup the total volume.
Other fields in product activity:
• Quantity Damaged (DG)
• Quantity on Hold (HL)
• Lost Sales (LS)
• Planned Order Quantity (OQ)
• Calculated Reorder Point (PO)
• Additional Demand Quantity (QD)
• Quantity in Transit (QI)
• Minimum Inventory Quantity (QL)

VII
• Maximum Inventory Quantity (QM)
• Quantity Received (QR)
• Adjustment to Inventory Quantity (QT)
• Quantity Returned by Customer (QU)
• Quantity Transferred (QZ)
• #850 - Purchase Order
The purchase order contains the items to be ordered (www.vendormanagedinventory.com, Oct 20, 2006). The supplier reviews the information on the #852 to decide if an order is needed. To begin with, the supplier must verify the data as accurate and significant. Much of this verification is done automatically by software programs at the supplier. On a prearranged schedule, the software calculates a reorder point for each item based on the movement data. Override information, such as promotions, seasonality and new items are also taken into account at this stage in the process. Furthermore, the VMI software compares the quantity available at the buyer with the reorder point for each item at each location and decides if there is need to make an order. After this, the order quantities are calculated and the order build process is completed (Hall, 2001).
• #855 - Purchase Order Acknowledgement
Sent by the supplier to the buyer to acknowledge an order and contains product numbers and quantities ordered (Hall, 2001). However, this message is often skipped.
• #856/857 - Advanced Ship Notice
Sent by the supplier just before the shipment leaves the supplier. The transmission entails contents of the shipment and additional information relating to the shipment (www.vendormanagedinventory.com, Oct 20, 2006), e.g. carrier and waybill information (Hall, 2001). According to Hall (2001), the suppliers often skip the #855 and only rely on the #856 to alert them to order and shipment.

VIII
• #861 - Receipt Advice
Information from the buyer about what was actually received by the buyer (www.vendormanagedinventory.com, Oct 20, 2006).
• #810 – Invoice
Electronic billing sent by the supplier to the buyer (www.vendormanagedinventory.com, Oct 20, 2006).
• #820 - Payment/Remittance Advice
Sent by the buyer to the supplier (www.vendormanagedinventory.com, Oct 20, 2006.