Embed Size (px)
Citation preview
INTERNATIONAL JOURNAL ON SMART SENSING AND INTELLIGENT SYSTEMS VOL. 8, NO. 4, DECEMBER 2015
2212
VEHICLE MODEL RECOGNITION BASED ON USING
IMAGE PROCESSING AND WAVELET ANALYSIS
Elyas Abbasi Jennat Abadi1, Soheyl Akhlaghi Amiri2, Masoud Goharimanesh3 and Aliakbar Akbari4*
1Mechanical engineering department, School of Engineering, Khayyam university of Mashhad, Mashhad, Iran,
2Electrical engineering department, School of Engineering, Ferdowsi university of Mashhad,
3Mechanical engineering department, School of Engineering, Ferdowsi university of Mashhad,
4*Mechanical engineering department, School of Engineering, Ferdowsi university of Mashhad,
* Corresponding Author
Submitted: Aug. 20, 2015 Accepted: Nov. 15, 2015 Published: Dec. 1, 2015
Abstract— Today, using intelligent transport systems such as identifying vehicle type for
monitoring traffic in urban areas can advantage a lot. In this paper, a new method has been
presented to detect vehicle type with only one reference image per class. Our algorithm is based on
searching mean gradients and analysing these changes by Daubechies wavelet transformation.
Firstly, a feature vector is obtained based on the car boundary changes of the side view image in
proposed system. This vector is then analyzed by Daubechies wavelet transformation and three
statistical criteria; variance, norm-1 and norm-2 are extracted from wavelet coefficients. Finally, a
similarity factor is defined to detect the same type of vehicles. The proposed algorithm is resistant
against car edge negligible changes and the experimental results indicate the high performance of
system in detecting the vehicle types.
Index terms: Image Processing, Wavelet Transform, Feature Vector, Similarity Factor.

Elyas Abbasi Jennat Abadi, Soheyl Akhlaghi Amiri, Masoud Goharimanesh and Aliakbar Akbari,
VEHICLE MODEL RECOGNITION BASED ON USING IMAGE PROCESSING AND WAVELET ANALYSIS
2213
I. INTRODUCTION
Nowadays, the intelligent control systems have entered the human life in different areas.
These systems far have reduced the number of human resources and resulted in the
improvement of industries towards automation process. Introduction of making intelligent
solutions is very efficient due to increasing population spread [1]. For instance many vision
based intelligent Transport Systems are used for detecting vehicle [2], license plate [3] and car
model [4]. Besides, diversity kind of sorting systems have been improved by implementing
image processing for product quality evaluation [5]. Furthermore, among machine vision
based systems, face and fingerprint recognition [6, 7], are very applicable for security regions
as they used for distinctive identification purposes. Today, due to increase of population and
complexity of the traffic control and laws enforcement and due to low labor available, traffic
control intelligently has a lot of merits such as minimum cost and time is dealt with this
important matter. Meanwhile, the intelligent transportation systems, especially based on
image processing will be very efficient.
Auto detection and its type is of issues that many researchers have researched about it until
now. For example in 2000 Paragios et al., have used a Gaussian statistical model in detecting
mobile objects border. They have actually achieved this fact by detecting the boundary
movement objects and connecting points that have the minimum distance together [8]. Three
years later, Mahmoudi and et al., deal with the objects edge images retrieval. They achieved
this important fact by applying two features of correlation and relation at the edges [9].
Besides, In 2007 Ambardekar took advantages of a spatial wired model for the vehicle
detection. He used the color comparison and background gradient as preprocessing [10].
In this paper we developed a new method for detecting car type from side view by employing
image processing. It should be noted that the car mask is obtained in the input image by
applying some morphology processes on the database images. In this regard some
preprocessing operation such as noise reduction and the mean retention filters are applied on
the input image. Then the car mask is obtained from the side view pre-mentioned input image.
In this stage the vehicle mask boundary is extracted and car shadow is removed from mask
image approximately and we compute the boundary image contour by using the proposed
algorithm. After describing the boundary of existing vehicle we have dealt with establishing
proper feature vector, then three statistical characteristics is obtained by using Daubechies
wavelet transformation from the proposed feature vector. Finally the similarity factor is

INTERNATIONAL JOURNAL ON SMART SENSING AND INTELLIGENT SYSTEMS VOL. 8, NO. 4, DECEMBER 2015
2214
defined based on three statistical criteria that we will explain it in the last part of the article.
Experimental results show that the method presented in this paper has been resistant against
the transmission of vehicle location and expresses similar description for them against the
vehicles minor changes.
This paper is organized as follows. The next two parts discuss about System Architecture and
Image Processing algorithms that was done on image for obtaining unique feature vector for
each vehicle type. In Section IV the wavelet analyzing is described, followed by introducing
statistical criteria and Experimental results. Finally conclusion is presented in section VI.
II. SYSTEM ARCHITECTURE
The three major modules of this vehicle type detection system are image processing, wavelet
analysis and statistical feature selection. Fig.1 illustrates the steps of our proposed vehicle
recognition system.
Figure 1. The scheme of the proposed vehicle detection model

Elyas Abbasi Jennat Abadi, Soheyl Akhlaghi Amiri, Masoud Goharimanesh and Aliakbar Akbari,
VEHICLE MODEL RECOGNITION BASED ON USING IMAGE PROCESSING AND WAVELET ANALYSIS
2215
III. IMAGE PROCESSING
a. Image capturing
At first we capture image with Sony 8 Mega pixel camera. Regarding to this issue that most
digital cameras have the automatic correction options of color and light, in this paper all of the
automatic correction options in the camera put in silent condition and rate of light and contrast
set in normal condition. Due to the sizes or resolution required, in this paper images have
been used with 640 480 dimensions which these size and camera characteristics have been
similar in every imaging such as instantaneous and non-instantaneous.
b. Pre-processing operation
At this phase, processes are performed on the images available in the database that result in
establishing more proper images for processing in the later stages. Considering that the
images have been used with the same light conditions in this article, we confine ourselves to a
few simple preprocessing. Firstly, the pixels data type has been converted to double type and
is located in the ranges of zero and one. Then, the input image that is usually in the form of
three channels or RGB turns into a gray level or one channel image. For noise decrement we
use rotationally symmetric Gaussian low pass filter of size 3*3 with standard deviation
calculated in OpenCV image processing toolbox [11, 12]. In OpenCV standard deviations
through the x and y axis are considered in (1) and (2).
8.03.012
nx
x
(1)
8.03.012
ny
y
(2)
c. Background Subtraction
In the tracking systems with a fixed camera always a pre-processing algorithms use for
detecting moving regions in each frame. Generally this type of methods is known as changes
detection algorithms. In fact it can be said that these algorithms make decision for identifying
moving areas in each frame according to the previous frames. Their main objective is
classification of image pixels into two categories, moving and background.
These algorithms do processes on different features of an image such as the pixel level, edge
or higher-level features such as boundary, lines and corners, in which for this paper the
characteristic of pixel level and background subtraction are used. For this purpose, after
reviewing the images resulting from subtraction operation of the three color components of

INTERNATIONAL JOURNAL ON SMART SENSING AND INTELLIGENT SYSTEMS VOL. 8, NO. 4, DECEMBER 2015
2216
image (R, G and B), grey image resulting from subtraction of the blue color component was
selected for subsequent processing. Then, the pixel data quantity is mapped to zero and one to
increase the selected image light intensity and improve its quality. For obtaining the vehicle
binary mask the threshold value of 0.2 was chosen empirically.
At this stage, in order to provide a more accurate shape of car, some of the morphology
process was done on afore-mentioned mask as follows: At first, areas from binary image that
have been surrounded by white pixels and have the zero amounts have filled and change to
white color. Then, we obtain ultimate mask of the car by applying open and close conversions
on output binary image. Result mask of some sample cars are depicted in Fig. 2.
(A) (B) (C)
Figure 2. (A): Sample images of car side view. (B): Background subtraction Mask.
(C): Output images of background subtraction algorithm.

Elyas Abbasi Jennat Abadi, Soheyl Akhlaghi Amiri, Masoud Goharimanesh and Aliakbar Akbari,
VEHICLE MODEL RECOGNITION BASED ON USING IMAGE PROCESSING AND WAVELET ANALYSIS
2217
d. Shadow Removal
Since shadows bring errors in the performance of computer vision algorithms such as tracking
and object recognition, different methods of shadow composition and removal have been
proposed in recent years [13]. As indicated in Fig. 3-A shadow boundaries have connection
with tires, so for having an accurate feature detection module, we omit part of tires that
connected with shadow. For this purpose, first the image has been segmented by using the
mean shift clustering algorithm [14]. Then, according to the radial interval, 18 to 30,
searching tire circles is done and accuracy of detection is confirmed by the user.
Doing the search process is by using the Hough transform on the segmented image [15]. By
applying this transformation and moving on image, the tire circles are marked with a special
radius and its place is created in a white square shape on Mask image. Now we obtain the
center coordinates of two squares in the y direction to remove the shadow, then from the
center which has a lower y coordinate or in other words, from the middle of the square which
is higher, we set equal to one until end of the vehicle image. Finally, the mask is created and
result of the shadow elimination process is displayed to the user. If it was desirable, the
process is terminated manually. Otherwise, the stages are repeated. Fig.3 shows this
procedure for sample image.
(A) (B)
(C) (D)
Figure 3. (A) A resulting image of background subtraction (B) Tire Mask
(C) Shadow Removal Mask (D) Output image of shadow removing algorithm.
INTERNATIONAL JOURNAL ON SMART SENSING AND INTELLIGENT SYSTEMS VOL. 8, NO. 4, DECEMBER 2015
2218
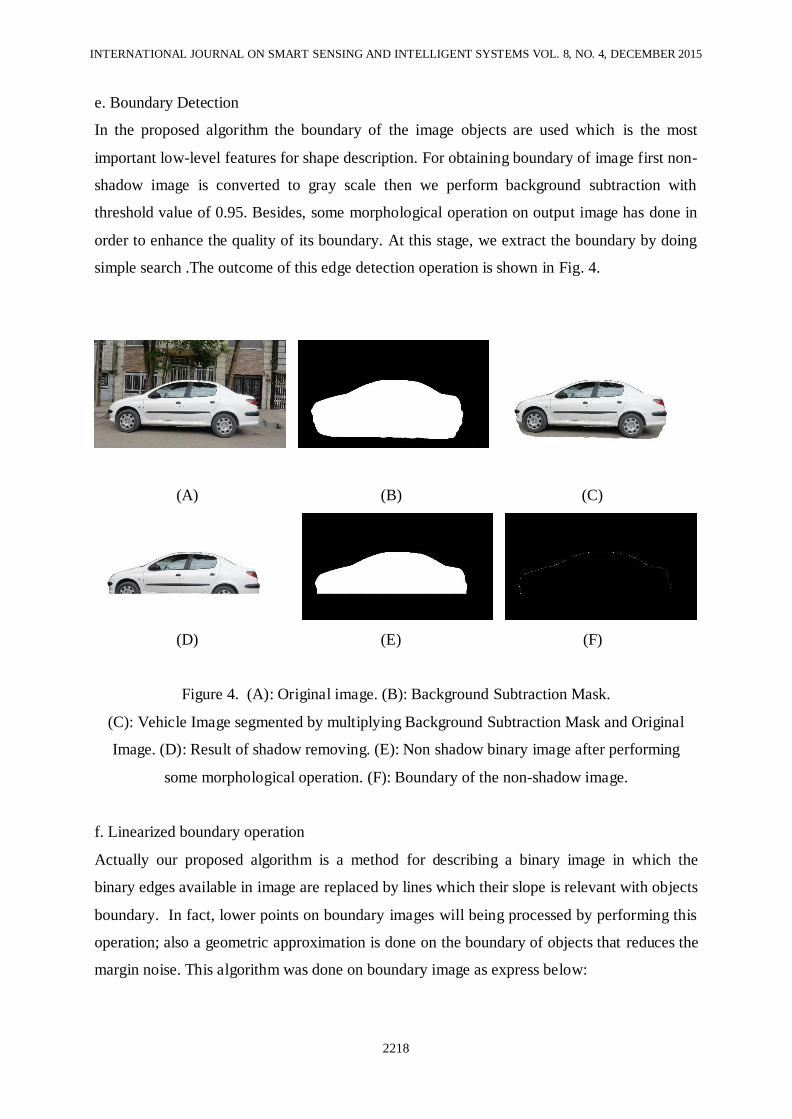
e. Boundary Detection
In the proposed algorithm the boundary of the image objects are used which is the most
important low-level features for shape description. For obtaining boundary of image first non-
shadow image is converted to gray scale then we perform background subtraction with
threshold value of 0.95. Besides, some morphological operation on output image has done in
order to enhance the quality of its boundary. At this stage, we extract the boundary by doing
simple search .The outcome of this edge detection operation is shown in Fig. 4.
(A) (B) (C)
(D) (E) (F)
Figure 4. (A): Original image. (B): Background Subtraction Mask.
(C): Vehicle Image segmented by multiplying Background Subtraction Mask and Original
Image. (D): Result of shadow removing. (E): Non shadow binary image after performing
some morphological operation. (F): Boundary of the non-shadow image.
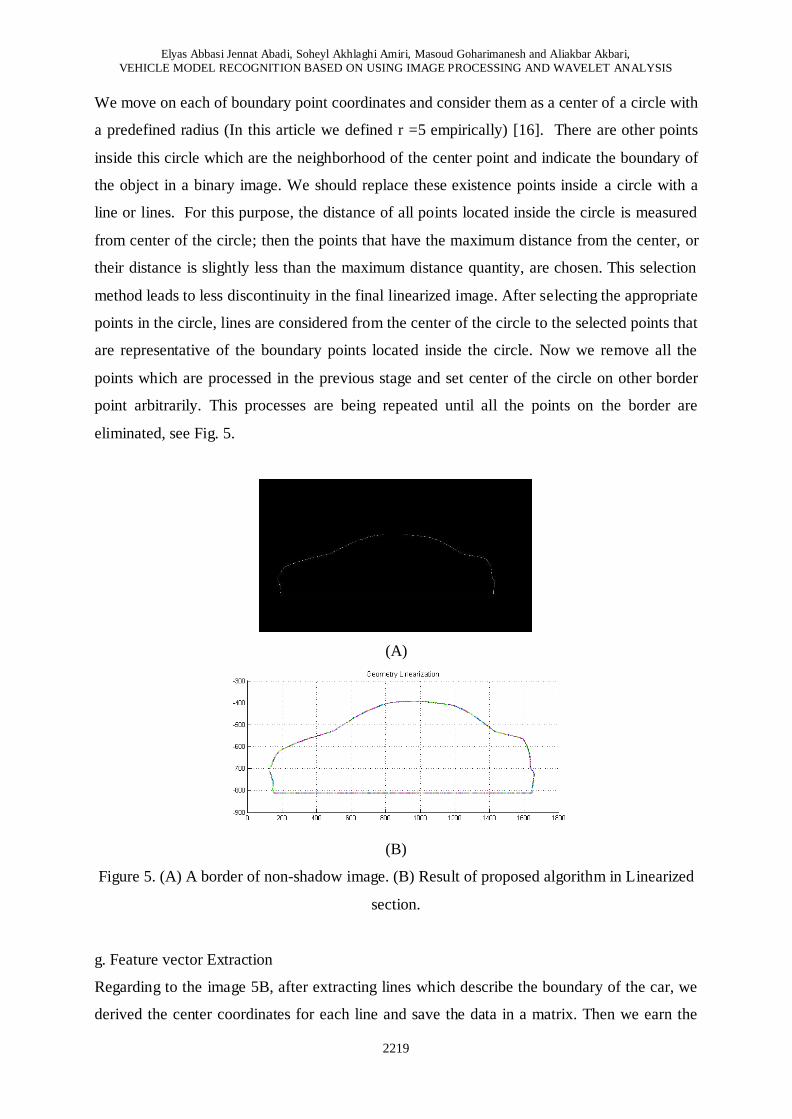
f. Linearized boundary operation
Actually our proposed algorithm is a method for describing a binary image in which the
binary edges available in image are replaced by lines which their slope is relevant with objects
boundary. In fact, lower points on boundary images will being processed by performing this
operation; also a geometric approximation is done on the boundary of objects that reduces the
margin noise. This algorithm was done on boundary image as express below:
Elyas Abbasi Jennat Abadi, Soheyl Akhlaghi Amiri, Masoud Goharimanesh and Aliakbar Akbari,
VEHICLE MODEL RECOGNITION BASED ON USING IMAGE PROCESSING AND WAVELET ANALYSIS
2219
We move on each of boundary point coordinates and consider them as a center of a circle with
a predefined radius (In this article we defined r =5 empirically) [16]. There are other points
inside this circle which are the neighborhood of the center point and indicate the boundary of
the object in a binary image. We should replace these existence points inside a circle with a
line or lines. For this purpose, the distance of all points located inside the circle is measured
from center of the circle; then the points that have the maximum distance from the center, or
their distance is slightly less than the maximum distance quantity, are chosen. This selection
method leads to less discontinuity in the final linearized image. After selecting the appropriate
points in the circle, lines are considered from the center of the circle to the selected points that
are representative of the boundary points located inside the circle. Now we remove all the
points which are processed in the previous stage and set center of the circle on other border
point arbitrarily. This processes are being repeated until all the points on the border are
eliminated, see Fig. 5.
(A)
(B)
Figure 5. (A) A border of non-shadow image. (B) Result of proposed algorithm in Linearized
section.
g. Feature vector Extraction
Regarding to the image 5B, after extracting lines which describe the boundary of the car, we
derived the center coordinates for each line and save the data in a matrix. Then we earn the

INTERNATIONAL JOURNAL ON SMART SENSING AND INTELLIGENT SYSTEMS VOL. 8, NO. 4, DECEMBER 2015
2220
centroid of the boundary image and transfer the image coordinates to that point. Finally we
divide the image into regions of equal angular from the new center coordinate and move from
the positive part of the axis in a clockwise direction and consider the average of the lines
slope which have been located in each region as one of the feature vector columns. According
to the values considered in this article the proposed feature vector has 14 (The number of
regions created in the image coordinate) members. Fig. 6 illustrates feature vector of sample
car.
Figure 6. Feature vector for linearized image.
IV. WAVELET ANALYSIS
a. Introduction
Wavelet analysis is one of the relatively new and exciting achievements in pure mathematics
which is based on several decades' research in harmonic analysis. Today this application
becomes important in many fields of science and engineering; as new possibilities for
understanding its mathematical aspects and improving its manipulation are provided.
From a historical point of view, the first reference to the wavelet was in Haar’s dissertation
[17]. The properties of the Haar wavelets are range compression, non-differentiable and
continuous form. After that, in 1970, a Frenchman geo-physicist named John Morlet found
that Fourier bases aren’t the best possible tool for the underground explorations, this issue led
to introducing of wavelets by Grossman and Morlet. Actually they developed the technique of
scaling and shifting of the analysis window functions in analysing acoustic echoes [18]. After
the scientific formation of the wavelet transform which was first proposed by Grossmann
[18], Malta created wavelets analysis and reconstruction algorithms using multi-
differentiation analysis in 1985 [19].
Elyas Abbasi Jennat Abadi, Soheyl Akhlaghi Amiri, Masoud Goharimanesh and Aliakbar Akbari,
VEHICLE MODEL RECOGNITION BASED ON USING IMAGE PROCESSING AND WAVELET ANALYSIS
2221
In this paper we earn statistical characteristics of each vehicles boundary by employing 2D
Daubechies Wavelet Transform. The Daubechies wavelets are one of the most commonly
used set of discrete wavelet transformation and can be performed with using simple digital
filtering techniques; Belgian mathematician Ingrid Daubechies is the person who formulated
these Orthogonal wavelets in 1988 [20].
b. Wavelet Theory
In wavelet analysis like Fourier analysis, we deal with functions extension. Although the goal
of this conversion is similar to Fourier analysis which is signal transmission from one base to
another, we can achieve more accurate information from signal in comparison to the Fourier
transformation.
Wavelet is a specific function with zero mean and unit energy which in this function
extension is performed based on transitions and dilatations. As wavelets are studied in space
locally, thus closer relationship between some functions and their coefficients is possible and
greater numerical stability is provided in reconstruction and calculations. Regarding to these
features of wavelets, greater spatial information (or time local) can be gained by
reformulating any application that is based on fast Fourier transform. In general, this
advantage causes the calculation of the integral operators be done through fast numerical
algorithms and improves signal and image processing.
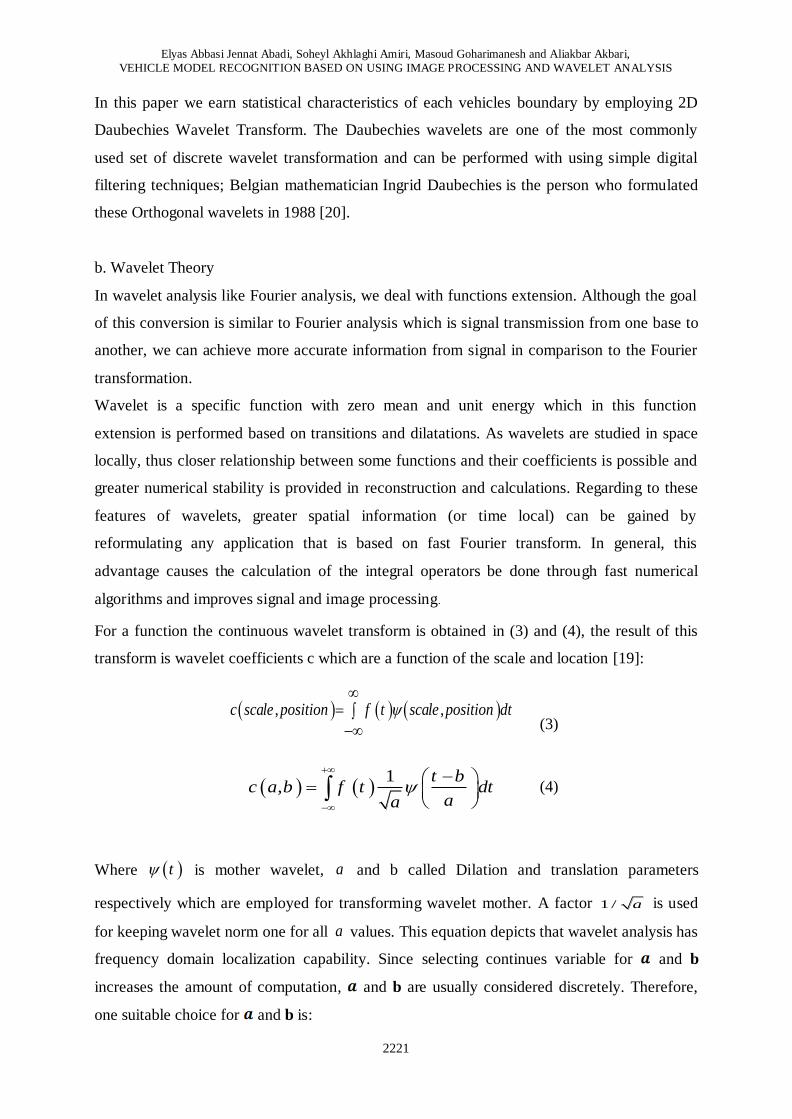
For a function the continuous wavelet transform is obtained in (3) and (4), the result of this
transform is wavelet coefficients c which are a function of the scale and location [19]:
, ,c scale position f t scale position dt
(3)
1
,t b
c a b f t dtaa
(4)
Where t is mother wavelet, a and b called Dilation and translation parameters
respectively which are employed for transforming wavelet mother. A factor 1/ a is used
for keeping wavelet norm one for all a values. This equation depicts that wavelet analysis has
frequency domain localization capability. Since selecting continues variable for and b
increases the amount of computation, and b are usually considered discretely. Therefore,
one suitable choice for and b is:

INTERNATIONAL JOURNAL ON SMART SENSING AND INTELLIGENT SYSTEMS VOL. 8, NO. 4, DECEMBER 2015
2222
2 ja , 2 jb k (k and j are integer values).
In this case, the relationship of the wavelet conversion which is known as dyadic conversion
has been a function of j and k. The following formulate shown in (5) describes this
relationship:
2 *, 2 2j j
fw j k f t t k dt
(5)
Regarding to the structure of the filter bank, discrete wavelet transform is implemented
according to (6) and (7) by scaling filter h (n) which is a low pass filter related to the scale
function t and wavelet filter g (n) which is a high-pass filter related to the wavelet
function t [19].
1
122 2j
j
j
k
t h k t k
(6)
1
122 2j
j
j
k
t g k t k
(7)
As we can see in Fig. 7, substantial step of wavelet analysis could be done in two different
direction; decomposition and Reconstruction. Regarding to this figure cA1 and cD1 are
known as sequence and detail coefficients respectively, these vector elements are obtained by
passing discrete signal f from low-pass (L) and high-pass (H) filters in the analysis phase.
Also, sign 2 indicates a decrease in the sampling rate with factor of 2 [21].
Figure 7. Basic stages of wavelet transformation: Decomposition and Reconstruction.
Elyas Abbasi Jennat Abadi, Soheyl Akhlaghi Amiri, Masoud Goharimanesh and Aliakbar Akbari,
VEHICLE MODEL RECOGNITION BASED ON USING IMAGE PROCESSING AND WAVELET ANALYSIS
2223
c. Wavelet Selection
As shown in continuous wavelet transform equation (3)-(4), many wavelet transforms can be
created by scale change and displacement in the mother wavelet time. For instance, we can
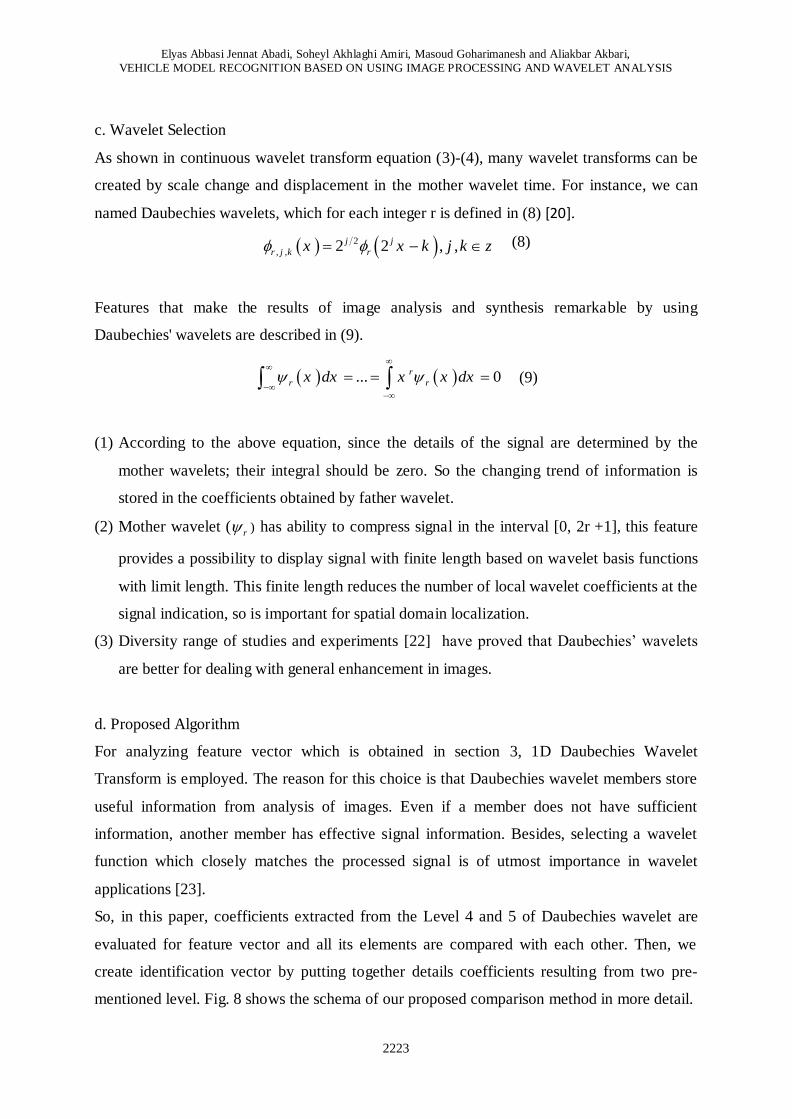
named Daubechies wavelets, which for each integer r is defined in (8) [20].
2
, , 2 2 , , j j
r j k rx x k j k z (8)
Features that make the results of image analysis and synthesis remarkable by using
Daubechies' wavelets are described in (9).
... 0r
r rx dx x x dx
(9)
(1) According to the above equation, since the details of the signal are determined by the
mother wavelets; their integral should be zero. So the changing trend of information is
stored in the coefficients obtained by father wavelet.
(2) Mother wavelet (r ) has ability to compress signal in the interval [0, 2r +1], this feature
provides a possibility to display signal with finite length based on wavelet basis functions
with limit length. This finite length reduces the number of local wavelet coefficients at the
signal indication, so is important for spatial domain localization.
(3) Diversity range of studies and experiments [22] have proved that Daubechies’ wavelets
are better for dealing with general enhancement in images.
d. Proposed Algorithm
For analyzing feature vector which is obtained in section 3, 1D Daubechies Wavelet
Transform is employed. The reason for this choice is that Daubechies wavelet members store
useful information from analysis of images. Even if a member does not have sufficient
information, another member has effective signal information. Besides, selecting a wavelet
function which closely matches the processed signal is of utmost importance in wavelet
applications [23].
So, in this paper, coefficients extracted from the Level 4 and 5 of Daubechies wavelet are
evaluated for feature vector and all its elements are compared with each other. Then, we
create identification vector by putting together details coefficients resulting from two pre-
mentioned level. Fig. 8 shows the schema of our proposed comparison method in more detail.

INTERNATIONAL JOURNAL ON SMART SENSING AND INTELLIGENT SYSTEMS VOL. 8, NO. 4, DECEMBER 2015
2224
Figure 8. Schema of Proposed Comparison Algorithm.
V. STATISTICAL CRITERIONS AND SIMILARITY FACTOR
a. Statistical features Selection
In this paper, three statistical criteria: norm-1, norm-2, Variance; have been used
experimentally to analyze coefficients resulting from Daubechies wavelet transform. We
explain these three criteria on the following.
1) P-norm: P-norm defined in (10).
(10)
In this equation 1≤ p < ∞ and if we set P=1 and P=2 we acquire norm-1 and norm-2
respectively.
2) Variance: Variance is a measure type of dispersion and its value is calculated by
averaging the squared differences from the mean .Moreover, variance is a measure that
shows how the data have been spread around the mean. If μ = E (X) be an average of
random variable x, the variance of x is equal to (11).
2Var E X
(11)
The dominant distribution on data is not known in most cases. In this case, the variance is
estimated as (12):
1
1 ...p
pp
npx x x

Elyas Abbasi Jennat Abadi, Soheyl Akhlaghi Amiri, Masoud Goharimanesh and Aliakbar Akbari,
VEHICLE MODEL RECOGNITION BASED ON USING IMAGE PROCESSING AND WAVELET ANALYSIS
2225
212
1
NS x x
N iN i
(12)
Values that achieved by performing these statistical factors on wavelet coefficients along with
vector identification of each vehicle are shown in Table 1.
Table 1: Result of statistical factors and identification vector for 5 car model.
(A): Vehicle Model. (B): Identification vector. (C): Variance. (D): L1-norm. (E): L2-norm.
(A) (B) (C) (D) (E)
0 5 10 15 20 25
-10
-5
0
5
10
Wavelet Coefficients
Valu
e
8.32 46.30 13.02
0 5 10 15 20 25
-15
-10
-5
0
5
10
15
Wavelet Coefficients
Va
lue
15.91 69.33 17.84
0 5 10 15 20 25
-20
-10
0
10
20
Wavelet Coefficients
Va
lue
63.29 131.93 35.79
0 5 10 15 20 25
-20
-10
0
10
20
Wavelet Coefficients
Va
lue
46.48 104.52 30.73
0 5 10 15 20 25-15
-10
-5
0
5
10
15
Wavelet Coefficients
Va
lue
22.36 76.66 21.30

INTERNATIONAL JOURNAL ON SMART SENSING AND INTELLIGENT SYSTEMS VOL. 8, NO. 4, DECEMBER 2015
2226
b. Similarity Factor
The type of vehicles can be detected by using the proposed similarity factor defined in (13).
3 33
1 1
S abs DSF UIFi i
i i
(13)
In this equation DSF is the statistical factors of images which are available in the dataset and
UIF is statistical factors of unknown image which the camera captures in real time. According
to the proposed equation, the system calculates a similarity value for each image in a dataset
in which the minimum value of S shows the type of unknown vehicle.
c. Experimental Results
In this paper all the simulation is performed by using a personal computer with an Intel (R)
Core (TM) i7 processor and 6GB of memory. For evaluating the performance of the proposed
algorithm we have used 8 car models in the dataset and the system identified 5 unknown car
models through these datasets correctly. Our dataset was filled by the most popular vehicles
used in many cities of Iran.
Table 2(A-E) shows experimental results of the similarity value of 5 unknown vehicles which
indicts in columns by A-E. These cells show lower similarity value for unknown image that
similar to our vehicle library. As table2 shows all of unknown images could be matched to the
known vehicle model in dataset where the similarity value for these unknown vehicles are
calculated 5.0881, 0.6094, 4.0405, 2.5605 and 6.0683, respectively.
In fact, by extracting three statistical characteristics of the unknown vehicle and doing a
comparison process based on defined similarity factors, among vehicles which exist in the
dataset, the lowest values of similarity factor indicate the type of vehicle. The final results
show high and acceptable performance of the proposed algorithm in spite of some minor
errors in the border of images.

Elyas Abbasi Jennat Abadi, Soheyl Akhlaghi Amiri, Masoud Goharimanesh and Aliakbar Akbari,
VEHICLE MODEL RECOGNITION BASED ON USING IMAGE PROCESSING AND WAVELET ANALYSIS
2227
Table 2: similarity value for unknown car type
vehicle Library
A B C D E
43.1176 0.6094 7.7712 57.0133 23.6279
31.3060 11.0223 4.0405 45.2016 11.8163
11.3352 53.8434 46.6816 2.5605 30.8249
5.0881 37.4201 30.2583 18.9838 14.4015
25.5580 16.9503 9.7885 39.4536 6.0683
25.9502 68.4584 61.2966 12.0545 45.4399
29.5843 12.9239 5.7622 43.4799 10.0946
26.4288 16.0795 8.9177 40.3244 6.9391
INTERNATIONAL JOURNAL ON SMART SENSING AND INTELLIGENT SYSTEMS VOL. 8, NO. 4, DECEMBER 2015
2228
VI. CONCLUSION
In this article a similarity factor for detecting car model based on side view image has been
presented. In the proposed method, the characteristic of the vehicle boundary lines’ slope and
three statistical features from wavelet coefficients Daubechies are used to identify the type of
vehicle. Although the acquiring results indicate the great efficiency of the proposed method to
detect vehicle type, the final similarity factor will be closer to zero if the vehicle boundary is
extracted more precisely. Therefore, using better methods to detect changes in the picture and
identifying the vehicle mask like what in [24] has been expressed is recommended to increase
the performance of the presented system in this paper.
REFERENCES
[1] W. Xiaojun, Feng, P., & Eeihong, W., "Tracking of moving target based on video
motion nuclear algorithm " International Journal on Smart Sensing and Intelligent
Systems vol. vol. 8, no. 1, pp. 181 - 198, MARCH 2015.
[2] G. Q. Yiling Chen, "Video-based vehicle detection and classification in challenging
scenarios," International Journal on Smart Sensing and Intelligent Systems, vol. vol.
7, no. 3, pp. 1077- 1094, 2014.
[3] L. Janowski, P. Kozłowski, R. Baran, P. Romaniak, A. Glowacz, and T. Rusc,
"Quality assessment for a visual and automatic license plate recognition," Multimedia
Tools and Applications, vol. 68, pp. 23-40, 2014.
[4] T. Samatsu, K. Tachikawa, and Y. Shi, "Image processing for car shapes in the fuzzy
retrieval system," ICIC Express Letters B, vol. 1, pp. 1-7, 2010.
[5] M. Abbasgholipour, M. Omid, A. Keyhani, and S. Mohtasebi, "Color image
segmentation with genetic algorithm in a raisin sorting system based on machine
vision in variable conditions," Expert Systems with Applications, vol. 38, pp. 3671-
3678, 2011.
[6] H. Cevikalp, B. Triggs, and V. Franc, "Face and landmark detection by using cascade
of classifiers," in Automatic Face and Gesture Recognition (FG), 2013 10th IEEE
International Conference and Workshops on, 2013, pp. 1-7.
[7] D. Maltoni, D. Maio, A. K. Jain, and S. Prabhakar, Handbook of fingerprint
recognition: Springer Science & Business Media, 2009.
Elyas Abbasi Jennat Abadi, Soheyl Akhlaghi Amiri, Masoud Goharimanesh and Aliakbar Akbari,
VEHICLE MODEL RECOGNITION BASED ON USING IMAGE PROCESSING AND WAVELET ANALYSIS
2229
[8] N. Paragios and R. Deriche, "Geodesic active contours and level sets for the detection
and tracking of moving objects," Pattern Analysis and Machine Intelligence, IEEE
Transactions on, vol. 22, pp. 266-280, 2000.
[9] F. Mahmoudi, J. Shanbehzadeh, A.-M. Eftekhari-Moghadam, and H. Soltanian-Zadeh,
"Image retrieval based on shape similarity by edge orientation autocorrelogram,"
Pattern recognition, vol. 36, pp. 1725-1736, 2003.
[10] A. A. Ambardekar, Efficient vehicle tracking and classification for an automated
traffic surveillance system: ProQuest, 2007.
[11] G. Bradski, "Kaehler (2008) A Learning OpenCV. O’Reilly Media," ed: Inc.
[12] R. C. Gonzalez, R. E. Woods, and S. L. Eddins, Digital image processing using
MATLAB: Pearson Education India, 2004.
[13] R. Guo, Q. Dai, and D. Hoiem, "Single-image shadow detection and removal using
paired regions," in Computer Vision and Pattern Recognition (CVPR), 2011 IEEE
Conference on, 2011, pp. 2033-2040.
[14] D. Comaniciu and P. Meer, "Mean shift: A robust approach toward feature space
analysis," Pattern Analysis and Machine Intelligence, IEEE Transactions on, vol. 24,
pp. 603-619, 2002.
[15] J. Gall and V. Lempitsky, "Class-specific hough forests for object detection," in
Decision Forests for Computer Vision and Medical Image Analysis, ed: Springer,
2013, pp. 143-157.
[16] S. M. S. T. Akhlaghi Amiri, "A Novel Approach for Human and Computer Machine
Communication Based on Image Processing and Developing an Attractive Visual
Information System," presented at the Iranian Conference on Electrical Engineering,
2013.
[17] A. Haar, "Zur theorie der orthogonalen funktionensysteme," Mathematische Annalen,
vol. 69, pp. 331-371, 1910.
[18] A. Grossman, J. Morlet, and T. Paul, "Transforms associated to square integrable
group representations. ii: Examples," in Annales de l'IHP Physique théorique, 1986,
pp. 293-309.
[19] S. Mallat, A wavelet tour of signal processing: Academic press, 1999.
[20] I. Daubechies, Ten lectures on wavelets vol. 61: SIAM, 1992.
[21] J. D. Barros, J. J. d. Oliveira Júnior, S. G. d. Silva, and R. F. d. Farias,
"Characterization of bone Tissue by microwaves using wavelets and KNN," Journal

INTERNATIONAL JOURNAL ON SMART SENSING AND INTELLIGENT SYSTEMS VOL. 8, NO. 4, DECEMBER 2015
2230
of Microwaves, Optoelectronics and Electromagnetic Applications, vol. 10, pp. 217-
231, 2011.
[22] J. Z. Wang, G. Wiederhold, O. Firschein, and S. X. Wei, "Content-based image
indexing and searching using Daubechies' wavelets," International Journal on Digital
Libraries, vol. 1, pp. 311-328, 1998.
[23] A. Graps, "An introduction to wavelets," Computational Science & Engineering,
IEEE, vol. 2, pp. 50-61, 1995.
[24] M. Heikkila and M. Pietikainen, "A texture-based method for modeling the
background and detecting moving objects," IEEE transactions on pattern analysis and
machine intelligence, vol. 28, pp. 657-662, 2006.