Embed Size (px)
Citation preview

VEGETATION DYNAMICS AND TREE RADIAL GROWTH
RESPONSE IN HARVEST GAPS, NATURAL GAPS, AND CLOSED
CANOPY CONDITIONS IN MAINE’S ACADIAN FOREST
By
Darci A. Schofield
B.A. Boston University, 1997
A THESIS
Submitted in Partial Fulfillment of the
Requirements for the Degree of
Master of Science
(in Forestry)
The Graduate School
The University of Maine
Decmeber, 2003
Advisory Committee:
Robert G. Wagner, Professor of Forest Ecosystem Science, Advisor
Alan S. White, Professor of Forest Ecosystem Science
George L. Jacobson Jr., Professor of Botany and Quaternary Studies

LIBRARY RIGHTS STATEMENT
In presenting this thesis in partial fulfillment of the requirements for an advanced
degree at The University of Maine, I agree that the Library shall make it freely available
for inspection. I further agree that permission for “fair use” copying of this thesis for
scholarly purposes may be granted by the Librarian. It is understood that any copying or
publication of this thesis for financial gain shall not be allowed without my written
permission.
Signature:
Date:

VEGETATION DYNAMICS AND TREE RADIAL GROWTH
RESPONSE IN HARVEST GAPS, NATURAL GAPS, AND CLOSED
CANOPY CONDITIONS IN MAINE’S ACADIAN FOREST
By Darci A. Schofield
Thesis Advisor: Dr. Robert G. Wagner
An Abstract of the Thesis Presented in Partial Fulfillment of the Requirements for the
Degree of Master of Science (in Forestry)
December, 2003 The creation of natural canopy gaps is an important ecological process in the
Acadian forest. Designing harvest gaps that emulate natural gap dynamics may be
important for maintaining structural and biological diversity, as well as naturally
regenerating desired tree species. We used a controlled study to 1) compare vegetation
dynamics among and within harvested gaps, natural gaps, and under a closed canopy, and
2) examine the growth response of mature overstory edge trees of harvests gap and
saplings inside of gaps as possible methods for dating natural gaps in the Acadian forest.
For the vegetation dynamics study (objective 1), we compared plant abundance,
diversity, and composition in 45 harvested gaps (four growing seasons after harvest), 23
natural gaps, and 23 closed canopy transects. The percent cover of each species was
measured in 4 m2 plots located every 2 m along a north/south transect across each gap.
Total plant cover was greatest in harvested gaps (p < 0.001) and was highest in the center
of the larger harvested gaps (672 – 2,106 m2) (p < 0.003). Abies balsamea was the most
abundant species in all conditions. Diversity (i.e., number of species per sample area)

was greatest in harvested gaps and least under the closed canopy (p<0.001). Species
evenness (measured as the slope of dominance diversity curves) indicated that harvested
gaps had greater evenness than natural gaps and closed canopy conditions. One hundred
twelve of the 195 plant species identified occurred only in harvested gaps, and a
detrended correspondence analysis indicated that plant composition in harvest gaps was
different from natural gap and closed canopy plant composition.
Tree regeneration was abundant under all conditions but was not correlated to gap
origin (p = 0.15) or location within the gap. Seedlings (< 0.5 m tall) were the most
abundant form of regeneration, and saplings (0.5 – 2.0 m tall) were most abundant in
harvested gaps. A. balsamea was the most abundant tree species regenerating in natural
gaps and closed canopy conditions, while Acer rubrum was most abundant in harvested
gaps.
In the gap dating study (objective 2), we examined the growth response of Tsuga
canadensis, Acer rubrum, and Betula papyrifera at the edge of 20 harvested gaps as well
as A. balsamea and T. canadensis saplings at the center of the harvested gaps and 23
natural gaps. Radial growth increment after harvest and percent growth response were
assessed as release criteria in edge trees and saplings seven years before and after harvest.
For edge trees, a 50% growth response provided the best release criterion for dating gaps.
Gap size (χ2 = 7.560, p<0.006) and the interaction of gap size and species (χ2 = 4.39,
p<0.036) were the best variables predicting release using this criterion. For saplings, a
200% growth response provided the best release criterion for dating harvested gaps. Gap
size also was correlated with sapling growth response (χ2 = 8.187, p< 0.004). Using a

200% sapling growth response as a criterion underestimated the formation date of natural
gaps. A 100% or more growth response provided the best results for dating natural gaps.

ii
ACKNOWLEDGEMENTS
This project was conducted with the support from the National Research Initiative
in association with the Forest Ecosystem Research Program at the University of Maine,
Orono. I extend great appreciation to my advisor, Dr. Robert Wagner, for his consistent
invaluable advice, his unyielding support, and his good cheer throughout my whole
Master’s education and thesis journey. I am also very grateful to my advisory committee,
Dr. Alan White and Dr. George Jacobson, for sharing their extensive knowledge,
encouragement and moral support.
All the graduate students and faculty in the Forestry Departments have
contributed to the success of my education in so many ways, and I thank them all for their
assistance and their companionship. I particularly want to thank Mike Saunders, my
office mate, for all the support he has given me, both technical and personal. Laura
Kenefic provided great moral support and she is a great role model for women in the field
of forestry. I am grateful to Stephanie Phillips and Shawn Fraver for their statistical
advice and SAS programming expertise. Lori Mitchner, my fellow graduate student
“Mom”, I am so grateful to for sharing together the challenges of motherhood and
graduate school as well as the joys of our children. I extend my thanks to my field
assistant, Morgan Kelly, and to Lance Case for mapping the harvest gaps and sharing
laughs in the field.
I extend my deepest and greatest appreciation to my husband, Gabe Stirniman, for
always believing in me, encouraging me when sleep deprivation destroyed my
motivation, and being proud of my accomplishments. I truly could not have done it

iii
without him. My thanks also to my beautiful son, Alaric, for keeping my thesis in
perspective and reminding me why I wanted to do this in the first place. I am so grateful
to my mother, Paula Schofield, who drove 12 hours round trip to babysit my son every
other week so that I could work on my thesis without worry. I also would like to thank
my mother-in-law, Mary Betts, and Stephanie Phillips for their babysitting services as
well, usually at the last minute!

TABLE OF CONTENTS
ACKNOWLEDGEMENTS……………………………………………………..….……..ii
LIST OF TABLES………….…………………………………………………..…………x
LIST OF FIGURES……………………………………………………………..………..xi
Chapter 1 LITERATURE REVIEW…………………………………………………..…………1 1.1. Ecological Forestry and Biodiversity………………………………………...1
1.2. Disturbances and the Acadian Forest Structure……………………...………2
1.2.1. Disturbance Frequency…………………………………………….3
1.2.2. Stand Structure After Disturbance………………………..……..…4
1.2.3. Stand Susceptibility…………………………...…………………...5
1.3. Patterns of Natural Gap Regeneration………………………………….……6
1.3.1. Stand Regeneration…………………………………...……………6
1.3.2. Herb and Shrub Recruitment…………………………………..…..9
1.4. Patterns of Harvest Gap Regeneration ……………………………………..10
1.4.1. Stand Regeneration……………………………………..………...11
1.4.2. Herb and Shrub Recruitment…………….…………………….…13
1.5. Canopy Gaps and Plant Species Diversity……………………………….....16
1.5.1. Gap Partitioning Hypothesis………………………………...…....16
1.5.2. Density Hypothesis…………………………..…………………...17
1.5.3. Resource Allocation in Gaps………………..……………………18
1.5.4. Gap Size and Plant Diversity.……………….………………..…..19
1.5.5. Competitive Ability ………………………………...……………21

1.6. Natural Gap Dating Methodologies………………….…………………….22
1.7. Literature Cited……………………………………………….……………26 2. VEGETATION DYNAMICS IN HARVEST GAPS, NATURAL GAPS, AND
CLOSED CANOPY CONDITIONS IN MAINE’S ACADIAN FOREST…...…30
2.1. Abstract……………………………………………………………………..30
2.2. Introduction…………………………………………………………………31
2.3. Methods……………………………………………………………………..35
2.3.1. Study Area………………………………………………………..35
2.3.2. Experimental Design…………………………………………..…35
2.3.3. Plot Establishment………………………………………………..36
2.3.4. Independent Variables…………………………………….…..….38
2.3.4.1. Gap Origin…………………………………………...…38
2.3.4.2. Canopy Openness……………………………………….39
2.3.4.3. Location Within The Gap……………………………....41
2.3.4.4. Gap Age……………………………………………...…41
2.3.5. Dependent Variables and Analytical Approach………………..…42
2.3.5.1. Vascular Plant Abundance…………………………..….42
2.3.5.2. Vascular Plant Composition……………………………43
2.3.5.3. Tree Regeneration………………………………………44
2.3.5.4. Plant Species Diversity……..…………………………..45
2.3.5.5. Plant Species Evenness…………………………………47
2.4. Results….…………………………………………………………………...48
2.4.1. Canopy Openness…………………………………………………48

2.4.2. Vegetation Differences Among Gap Conditions…………………50
2.4.2.1. Plant Species Cover…….…………………….………...50
2.4.2.2. Species Diversity Among Gaps……………….………..54
2.4.2.3. Tree Regeneration and Stand Composition….….……...59
2.4.2.4. Plant Community Composition………………..….……62
2.4.3. Vegetation Differences Within Gaps………………………..……67
2.4.3.1. Abundance and Diversity……………………………….67
2.4.3.2. Tree Regeneration.………………………….…………..69
2.4.3.3. Plant Species Composition…..…………………………70
2.5. Discussion…………………………………………………………….…….71
2.5.1. Plant Abundance…..…………………………………….……..…71
2.5.2. Plant Diversity……………………………………………………73
2.5.3. Plant Composition………………………………………..….……76
2.5.3.1. Understory Composition……………………..…………77
2.5.3.2. Gap Specialists………………………………………….78
2.5.4. Tree Regeneration…………………………………………….…..79
2.5.4.1. Tree Abundance………………………………………...79
2.5.4.2. Tree Species Composition………………………….…..81
2.5.4.3. Predicting Canopy Status…………………………….…83
2.5.5. Conclusion………………………………………………………..84
2.6. Literature Cited…………………………………………………………..…86

3. RELEASE RESPONSE OF SAPLINGS AND EDGE TREES IN HARVEST GAPS AS A MEHTOD FOR DATING NATURAL TREE FALL GAPS IN MAINE’S ACADIAN FOREST……………………………………………………91
3.1. Abstract……………………………………………………………….…….91
3.2. Introduction……………………………………………………….….……..92
3.3. Methods………………………………………………………………..……97
3.3.1. Study Area………………………………………...……….…..…97 3.3.2. Harvest Gap Edge Tree Response………………………….…….99
3.3.3. Harvest Gap Sapling Tree Response…………………………….100
3.3.4. Natural Gap Sapling Response………………………………….101
3.3.5. Harvest Gap Release Response Criteria……………………...…101
3.3.6. Natural Gap Release Response Criteria…………………..…….103
3.4. Results…………………………………………………………………….103
3.4.1. Harvest Gap Tree Response……..…………………………..….103
3.4.1.1. Harvest Gap Edge Trees………………………………103
3.4.1.2. Harvest Gap Sapling Response……………..………..107
3.4.2. Formation Dates of Natural Gaps………………………….……109
3.5. Discussion…………………………………………………………….…...114
3.5.1. Release Response to Harvest Gaps…..………………………….114
3.5.1.1. Release Criteria………………………………………..114
3.5.1.2. Predictive Variables for Release………………………116
3.5.2. Release Response to Natural Gaps……………………………...118
3.5.3. Erroneous and Absent Releases……………………………..…..120
3.6. Literature Cited……………………………………………………………122

4. EPILOGUE…………………………………………………………………….…..125
4.1. Introduction………………………………………………………….…….125
4.2. Management Implications of Gap Harvesting……………………….……126
4.2.1. Gap Size………………………………………………….…….126
4.2.2. Desirable Species…………………………………………….…127
4.3. Improvements…………………………………………………….….……129
BIBLIOGRAPHY………………………...……………………………..…….…….….132
APPENDIX The mean cover and mean frequency of all species by gap origin.……...139
BIOGRAPHY OF THE AUTHOR………..……………………………………………146

LIST OF TABLES
Table 2.1. Mean cover for the 10 most abundant plant species in harvest gaps, natural
gaps, and closed canopy conditions………………….…….…………...……51
Table 2.2. Mean percent cover per gap of different plant types for harvest gaps, natural
gaps, and closed canopy conditions………………...………………………..52
Table 2.3. Density of tree regeneration by species and height class for all harvest gaps,
natural gaps, and closed canopy conditions……….………………...….……61
Table 2.4. Importance index, mean frequency, and mean cover for the 10 most important
species found in harvest gaps, natural gaps, and under closed canopy
conditions.……………………………………..……………………………..64
Table 3.1. The number of harvest-gap edge-trees indicating a release for the three release
criterion using 7 year pre-and post-harvest duration for percent growth
response and 7 year average gap growth ……………………………..……106
Table 3.2. The number of harvest gap saplings indicating a release for the three release
criterion using 7 year pre-and post-harvest duration for percent growth
response and 7 year average gap growth…………………………………...110
Table 3.3. Summary of natural gap formation dates using both the ≥ 100% and ≥ 200%
growth response.…………………………………………………….……...113

LIST OF FIGURES
Figure 2.1. An example of a plot layout within a gap…………………………......….…39
Figure 2.2. Relation between canopy openness measured by (a) basal area and (b)
canopy gap fraction (DIFN) and gap size for all harvest gaps, natural gaps,
and closed canopy conditions.….…….………………………………..……49
Figure 2.3. Mean plant cover for all natural gaps, harvest gaps, and closed canopy
conditions by gap area…………………………………………….….……..52
Figure 2.4. Species richness with increasing sample plot area for harvest gaps, natural
gaps, and closed canopy conditions…….……………………………….…..55
Figure 2.5. Mean dominance diversity curves truncated for the 10 most abundant plant
species for harvest gaps, natural gaps, and under the closed
canopy…………………………………………………………………….....56
Figure 2.6. Relation between Shannon-Weiner index (a) and Shannon Equitability index
(b) by gap size for harvest gaps, natural gaps, and closed canopy
conditions………………………………………………………………..…..58
Figure 2.7. Tree regeneration by height class for all harvest gaps, natural gaps, and
closed canopy conditions for all height classes……………………...……..60
Figure 2.8. DCA on the presence and absence of all species in all gaps and transects for
harvest gaps, natural gaps, and closed canopy conditions……………....….66
Figure 2.9. Mean cover of all plant species at various distances from the centers of the
four largest harvest gaps (1,170 – 2,106 m2)…………………………….…68

Figure 3.1. The distribution of response for harvest-gap edge-trees by (a) average stem
radial growth form 1995-2001 and (b) percent response using 7 years pre-
and post- disturbance average growth………………………………….....104
Figure 3.2. The distribution of response for harvest gap saplings by (a) mean radial
growth from 1995-2001 and (b) percent response using 7 years pre-and post-
harvest average growth.………………………………………………...…108
Figure 3.3. Example of release response for threes saplings in a natural gap (3-C4) where
three of four saplings had ≥ 200% release response……………………...112

1
Chapter 1
LITERATURE REVIEW
1.1. Ecological Forestry and Biodiversity
The concept of ecological forestry, which prescribes a harvesting design that
incorporates both timber and non-timber values, has been proposed for the management
of Maine’s managed forests (Seymour and Hunter1999; Seymour and Day 1997;
Seymour et al. 2002). Ecological forestry involves harvesting according to the common
natural disturbance regime within the spatial and temporal limits of Maine’s natural forest
structure. The goals of this management practice are to maintain the legacy of Maine’s
forests, defined as the presettlement forest structure, to maintain the presettlement forest
composition, and to enhance the biological diversity within the forest landscape. These
goals of ecological forestry are currently thought to be achieved by creating a range of
gap sizes up to 0.2 ha (as would be witnessed after a natural disturbance) within the
managed forest leaving large residual trees (both live and dead) throughout the harvesting
rotations (Seymour et al. 2002; Seymour and Hunter 1992). These gaps and residual
trees are proposed to achieve a presettlement structural diversity by creating an array of
tree ages and sizes as witnessed in natural forests as opposed to simplified single cohort
plantation forests in the industrial forest (Roberts and Gilliam 1995; Seymour and Hunter
1992). This landscape structural diversity in the Northeast promotes the most suitable
habitat for plants and wildlife where many types of organisms occupy the full sere of
young and old forest structures (Hansen et al. 1991). Furthermore, this forest
management design will ensure the regeneration of commercially valuable, late

2 succession species, since these species initially established under the natural disturbance
conditions in the Acadian forest (Seymour and Hunter 1999).
The concepts of ecological forestry are based on two hypotheses: 1) disturbance is
a natural process in forest ecosystems, and 2) the resulting canopy gaps create a diverse
forest stand structure that fosters not only wildlife habitat and diversity, but also plant
species diversity across a forested landscape. If canopy gaps are utilized in forest
management, the forester needs to emulate the complex interactions of several ecological
elements present in natural gaps. These ecological elements included not only a missing
canopy, but also the presence of downed woody material, standing snags, and
undergrowth vegetation including established trees, shrubs, and herbs (Lundquist and
Beatty 2002). The following sections review the dynamics governing these hypotheses in
northern forest ecosystems. We examine the natural disturbance regime of the Acadian
forest and how this process may influence stand regeneration and species diversity within
gaps and across landscapes.
1.2. Disturbances and the Acadian Forest Structure
Disturbance is a common occurrence in forest ecosystems, and often has crucial
implications in the development of stand structure, wildlife habitat, and species diversity.
Disturbances are often defined as events that provide available growing space for
regeneration within a forest landscape (Runkle 1985; Oliver and Larson 1996). They can
be classified as either stand-replacing disturbances that remove all the overstory and
existing trees in a landscape, or minor disturbances that impact a stand to varying degrees
leaving resistant trees within the disturbed area (Oliver and Larson 1996). Anthropogenic
disturbances including forest harvesting and land clearing for development often occur

3 more frequently than natural disturbances. Both anthropogenic and natural disturbances
have important implications for forest management and long-term productivity of forest
resources.
1.2.1 Disturbance Frequency
Stand-replacing disturbances in the Acadian forest do occur but with long
recurrence rates. For example, analysis of the presettlement forests of Maine indicate
three large-scale fires in the early 1800s, but the estimated return interval of such events
was 1000 years (Lorimer 1977). Other stand-replacing disturbances in this region
include catastrophic wind storms, like hurricanes or northeasters, but the return interval
for such fire and wind disturbances occur between 806 - 14,300 years (Seymour et al.
2002). More common are minor disturbances creating canopy gaps in northern forests
with a frequency of 1% per year (Runkle 1982). Tree mortality, windthrow, ice storms,
cyclic disease and insect infestation like the spruce-bud worm, and partial harvesting
comprise the frequent disturbance regime in the Acadian forest (Oliver and Larson 1996).
These disturbances have various effects on stands, and they may predetermine a
secondary disturbance event within the canopy structure (Lieberman et al. 1989).
However, Frelich and Lorimer (1991) argue a continuum of disturbance in a forest
landscape rather than differentiating between stand replacing or multiple disturbances
since both largely determine the stand structure over a landscape. Consequently,
frequency of disturbance can be viewed in terms of canopy turnover, or the rate in which
a canopy is replaced by a new stand.
Defining the natural rotation of forest canopies, or canopy turnover, in relation to
disturbance regimes is useful when prescribing ecological forest management for long-

4 term productivity. In a mixed hardwood-conifer old-growth forest in Maine, broad-scale
minor disturbances occurred every 60-70 years, but when a few minor disturbances, such
as single-treefall gaps are included in the disturbance history, the disturbance frequency
changes to every 30-40 years (Chokkalingam 1998). A study of the disturbance regimes
in a hemlock-hardwood forest of the Great Lakes region determined canopy turnover of
69 years for disturbances that removed ≥10% of the canopy and 1920 years recurrence
for ≥60% canopy removal (Frelich and Lorimer 1991). Disturbance frequency seems to
differ with different forest types, but understanding this frequency is important. For
example, if disturbance rates were too high, the tree life form would not be viable where
the stand is replaced only by shrubs and herbs (Runkle 1985). Therefore, disturbances
are important for the development of vertical and horizontal stand structure in the forest
landscape.
1.2.2. Stand Structure After Disturbance
Minor and stand-replacing disturbances in northeastern forests determine stand
regeneration. Both minor and stand-replacing disturbances have created a multiple
cohort stand structure in non-plantation Acadian forests. A multiple cohort stand refers
to component trees that arise after multiple disturbances including many age classes of
one year to several decades (Oliver and Larson 1996). A minor disturbance may only
replace one or two canopy trees within a canopy gap causing many age classes across a
stand (Hibbs 1982). Stand-replacing disturbances initially do not create multiple cohort
stands, but ultimately the regenerating stand becomes a multiple cohort structure since
the low frequency of such an event far exceeds tree mortality, and tree falls occur
continuously. The Acadian forest structure contains at least four canopy strata, each of

5 which may contain four different tree crown classes. Canopy emergents (A stratum), the
continuous canopy (B stratum), a non-continuous canopy underlying the continuous
canopy (C stratum), and the forest floor (D stratum) comprise a multiple cohort forest
structure. For example, in a northern hardwood forest, 10 different age classes were
present in the forest structure, and 60% of the canopy trees were the result of tree fall
gaps (Frelich and Lorimer 1991). Understanding these strata is important in predicting
stand development as well as protecting the biological integrity of the forest. Since
single cohort stand structures have no ecological significance in natural forests, managing
forests for multiple cohorts sustains the biological integrity as well as the historical
structural diversity of the Acadian forest.
1.2.3. Stand Susceptibility
Characteristics of a forest ecosystem, including stand age and stand composition
will predetermine the magnitude of impact by disturbance events. Young even-aged
stands that are not ecologically well adapted are often susceptible to disturbance
(Seymour and Hunter 1999) as well as old-growth stands with very old trees approaching
natural mortality. For example, a study on gap formation in a northern forest showed 40-
year-old stands had a greater gap formation rate and larger mean gap size than old-growth
hemlock forests, mature hardwood, and mature hemlock forests because of the infestation
of Dutch Elm Disease (Dahir and Lorimer 1996). Old growth forests, containing very
large trees, are also susceptible. Large trees tend to have proportionally greater
aboveground biomass than the root system can support and massive crowns rendering
them more susceptible to windthrow (Runkle 1985). The result is more frequent tree falls
and larger gap areas (Dahir and Lorimer 1996).

6
Particular species of trees are more susceptible to disturbance and will be more
frequent gap makers. A study in the Allegheny northern hardwood forests found that
American beech (Fagus grandifolia Ehrh.), which is susceptible to beech bark disease,
represented more than half of all the gap makers in the study. Red maple (Acer rubrum
L.) was the most important uprooting gap maker (Krasny and Whitmore 1992). The
species and frequency of gap makers may characterize the type of disturbance especially
when a particular species is directly related to elevation. For example, in a New
Hampshire spruce-fir forest, balsam fir (Abies balsamea (L.) P. Mill.), which is
susceptible to root and butt rot, was one of the most important gap makers at lower
elevations whereas, yellow birch was the most important gap maker at 885 m at the upper
limit of its elevation distribution where windthrow and stem decay were the causes of
mortality (Worrall and Harrington 1988).
1.3. Patterns of Natural Gap Regeneration
There are two common types of natural gaps in forest environments. A treefall
gap is one where a tree has fallen or uprooted; a snag gap is one where the stem has broke
or significant branch loss has occurred (Runkle 1992). The significance of the two gaps
is the amount of soil disturbance. A treefall gap will create exposed mineral soil,
whereas a snag gap will disturb the soil minimally if at all. The amount of exposed
mineral soil often accounts for the patterns of succession following a gap event.
1.3.1. Stand Regeneration
In both old-growth forests and second growth forests, the most dominant trend for
tree succession is the release of advance regeneration within the gap that develops into
the future canopy (Mladenoff 1990; Dahir and Lorimer 1996; Clinton et al. 1994;

7 Kimball et al. 1995). In many eastern forests, gap events are the only means by which
advance regeneration saplings are able to attain canopy status. For example, in a spruce-
fir forest of New Hampshire, spruce and fir grew 2-3 times faster in gaps than under
closed canopy (Battles and Fahey 2000). In an oak-pine forest of Maine, advance
regeneration was the most dominant vegetation in tree fall gaps (Schumann et al. 2003).
The stand composition surrounding the gap is often correlated to the sapling species or
advance regeneration composition in the understory. Hence, the surrounding canopy
often determines the future composition of the gap canopy. Furthermore, the differential
growth of individual species in advance regeneration may determine which species attain
canopy status in the future gap stand development (Runkle 1981; Canham 1988a). In a
study of gaps in a spruce-fir forest, Betula alleghaniensis Britt. , Betula papyrifera
Marsh., and Abies balsamea (L.) P. Mill. had the greatest growth in gap environments in
comparison to spruce growth rates in gaps (Battles and Fahey 2000). In a northern
hemlock-hardwood forest, Betula nigra L. in gaps had the greatest height growth after
disturbance followed by Acer rubrum L., B. alleghaniensis, Tsuga canadensis (L.) Carr.
and Quercus rubra L. (Hibbs 1982).
When advance regeneration is minimal or absent, natural gap tree succession
allows shade tolerant or intermediate tolerant species to colonize and succeed into the
canopy in some forests. In older forests, the death of individual trees is the only means
that allow shade tolerant species to perpetuate themselves through the process of gap
phase development (Pickett and White 1985). For example, in a mature oak forest with
gaps created by gypsy moth infestation tree succession in all the gaps tended to recruit
species with greater shade tolerance. A. rubrum, an intermediate shade tolerant species,

8 was the most important tree in large gaps; Fagus grandifolia Ehrh., a shade tolerant
species, was most important in small gaps 7 years after the gypsy moth disturbance, and
the greatest density of Fraxinus seedlings occurred in gap environments (Ehrenfeld
1980). In an eastern old-growth forest, Acer saccharum Marsh. and Ostrya virginiana (P.
Mill.) K. Koch, both shade tolerant species, were the only seedlings regenerating in
significant numbers in gaps (Mladenoff 1990).
Some gaps will recruit specialists, but this dynamic is highly dependent on gap
size. In a spruce-fir forest of New Hampshire, B. papyrifera, Acer spicatum Lam., and
Fraxinus americana L. were only present in gaps in the forest landscape (Battles and
Fahey 2000). In a study of gaps in a northern hardwood forest, B. alleghaniensis,
Fraxinus pennsylvanica Marsh., and Tilia americana L. were classified as gap-phase
species because their colonization and survival success were limited to gap areas (Dahir
and Lorimer 1996). However, according to several studies, trees require an area >10-50
m2 for tree recruitment in the gap before lateral extension closes the canopy (Kimball et
al. 1995, Runkle 1982, Mladenoff 1990). A study of gaps in a hemlock-hardwood forest
suggests that few or no new tree seedlings reached the canopy level in gaps with a radius
<5 m (i.e. area approximately 78.5 m2); the study further suggests that gaps with a 5 m
radius surrounded by Q. rubra will fully close in 19 years if maximum lateral growth
rates occur (Hibbs 1982).
Finally, as mentioned previously, the means by which the gap was created, by
either tree fall or stem break, may influence the species composition of tree succession.
In a spruce-fir forest of New Hampshire, tree fall gaps with significant exposed mineral
soil limited tree succession to paper birch (Battles and Fahey 2000). The amount of

9 woody material that decays after a gap event also has a significant impact on tree
succession. In a spruce-fir forest of New Hampshire, decaying wood was the most
preferred substrate for seedlings of all species in gaps (Battles and Fahey 2000).
1.3.2. Herb and Shrub Recruitment
Few studies mention a significant increase in herb diversity with the occurrence of
natural gaps. In a mature beech-maple forest, herb species richness was largely
unaffected by gap dynamics, but total herb cover increased with gap formation (Moore
and Vankat 1986). In snag gaps of a mature oak forest, there was no significant
difference in species richness among the gaps sizes that ranged from a single-canopy-tree
snag gap to a 5-canopy tree snag gap (Ehrenfeld 1980). Furthermore, in an old-growth
northern hardwood forest, a lack of annual opportunistic herbs, which contribute greatly
to natural gap diversity, was noted in the smaller gaps; however, this response may be
due to the lack of soil disturbance that opportunistic species favor (Mladenoff 1990).
Finally, any increase in herb diversity in natural gaps is mostly a result of seed dispersal
by vertebrates of fleshy-fruited seeds (Thompson 1980).
These studies mentioned illustrate the most significant trend in herb succession
for natural gaps: an increase in abundance in early succession and then a gradual decline.
For example, treefall gaps in a hemlock forest demonstrate a definitive trend in
succession for the most common understory species. Mitchella repens and Viola blanda
reached peak cover during first 2 years, Medeola virginiana and Dryopteris spinualosa
reached peak cover during 2nd and 3rd years, and Tiaraella cordifolia, D. noveboracensis,
and Rubus allegheniensis reached peak cover during 4th and 5th years of succession.
Total understory cover returned to pre-gap levels 11-14 years following gap formation

10 (Rankin and Tramer 2002). A study of previous natural gaps (i.e., mean age 47 years old
with a closed canopy) in a hemlock forest demonstrate a higher total percent cover of
understory herbs and shrubs in the previous natural gap then under the closed canopy
(Rankin and Tramer 2002). Increase in herb abundance in natural gaps may also be
dependent on gap size. In a mature oak forest, herbaceous communities in snag gaps
increased in abundance only if the gap opening was greater than the predisturbance
understory assemblage (Ehrenfeld 1980).
Some shrub species demonstrate a positive response to natural gap formation in
colonization and abundance. For example, in a Maine oak-pine forest, Vaccinium spp.
and Kalmia angustifolia dominated the species composition in treefall gaps (Kimball et
al. 1995). Viburnum lantinoides was also an abundant shrub in gaps in a spruce-fir forest
although its abundance declined with canopy closure (Battles and Fahey 2000). In an
old-growth northern hardwood forest, Sambucus spp., a gap colonizer, was very abundant
in treefall gaps with disturbed soil although this species was not very abundant
throughout the forest study area (Mladenoff 1990). However, natural gaps in a spruce-fir
forest of New Hampshire indicate that gap specialist shrubs like Rubus spp. and
Sambucus spp. were rare in natural gaps (Battles and Fahey 2000). In a northern
hardwood forest, Rubus spp. was present in the seed bank but failed to germinate after the
occurrence of a natural gap (Mladenoff 1990).
1.4. Patterns of Harvest Gap Regeneration
Little research has been performed on the succession of harvested gaps in eastern
forests. Some studies on silviculture based on natural disturbance processes have
predicted harvested gap regeneration, but these predictions are often based on natural gap

11 tree succession (Seymour and Hunter 1992.). However, the following section will
discuss the dynamics of harvested gap succession based on available studies.
1.4.1. Stand Regeneration
The greatest influences on tree succession for harvested gaps are the size of the
gap, the level of soil disturbance, and the method of tree regeneration. According to the
few studies available, the most significant trend in tree succession within harvested gap is
the regeneration of shade intolerant trees. Regeneration of shade intolerant tree species is
likely a combination of all the factors mentioned above. For example, a study of
harvested gaps in an oak-pine forest of Maine, the investigators suggests that logging
produced significantly greater soil disturbance than natural gaps and encouraged the
establishment of more ruderal species than natural gaps. This trend was especially true
for larger gaps. This data was collected 5 years after harvest (Kimball et al. 1995). A
study on harvested gaps in the Southern Appalachians concurs with this same process.
When advance regeneration was not present in the harvested gaps, shade intolerant
species were the most dominant form of regeneration in large gaps the first and second
growing season after harvest (i.e., 2.0 ha). Furthermore, stump and root sprouts were the
major mechanism of tree regeneration in all gap sizes. However, shade tolerant species
were present in the harvested gap regeneration; they were either more abundant in small
gaps (i.e., 0.016 ha – 0.4 ha) or distributed evenly throughout all gaps (Philips and Shure
1990). The regeneration of intolerants is not always undesirable. In the same oak-pine
forest of Maine, 10 years after harvest, harvested gaps effectively increased the white
pine component in the forest. Q. rubra also regenerated well in the harvested gaps but
was equally abundant in gaps and closed canopy (Schumann et al. 2003).

12 Schumann et al. (2003) suggests that this process of harvested gap succession where
shade intolerants dominate is fairly short-lived. In the same oak-pine forest of Maine, 10
years after harvest, harvest gaps did not create patches that were vastly different from the
forest in which they were embedded. B. papyrifera and Hamamelis virginiana both
shade intolerant species, were more abundant in harvested gaps than under closed
canopy, but their abundance decreased 10 years after harvest. A study by Philips and
Shure (1990) in the Southern Appalachians also agrees with this conclusion. The
investigators suggest that harvested gap succession involves the opportunistic growth of
sprouts or seedlings of primary tree (i.e. dominant species in the surrounding forest
overstory) species until canopy status is achieved. Then the gradual dieback of sprouts of
pioneer species occurs and creates localized gaps that allow canopy accession of shade
tolerant species. Gap size greatly influences this process where lateral growth of canopy
trees may prevent the pioneer species from dominating the gap at any particular time.
The studies on harvested gaps in this review have not extended past 10 years after
harvest. Most are performed a few growing seasons after harvest. Therefore, definitive
long-term patterns of vegetation succession in harvest gaps have not yet been
documented. A better understanding is important in determining the success of gap-
based silviculture.
Most studies agree that harvested gaps promote diversity, abundance, and growth
of plant species within a forested environment. This process is beneficial for advance
regeneration present in the gap. In the oak-pine forest of Maine, species diversity was
greater in harvested gaps than closed canopy for both 5 and 10 years after harvest
(Schumann et al. 2003). In the Southern Appalachians, increase in biomass production

13 was directly correlated with gap size and growing season after harvest. In the second
growing season after harvest, there was two-fold more productivity for all vegetation in
harvested gaps compared to preharvest conditions (Philips and Shure 1990). In a
temperate conifer forest, planted seedlings rapidly increased diameter growth in gaps
with an area of 10-2000 m2. There was little improvement in average diameter growth
rates after this gap size up to 5000 m2 (Coates 1999).
1.4.2. Herb and Shrub Recruitment
The most significant trends in herb succession following gap harvesting include
an increase in vegetation diversity and abundance, loss of some herb species, and a
correlation with gap size and consequential microenvironment changes with herb
composition in succession (Schumann et al. 2003). Patterns vary with forest type and
level of soil disturbance. Regardless, herbs respond positively to the harvested gap with
an increase in species diversity and abundance during early succession. The increase in
richness is mostly attributed to the recruitment of opportunistic species such as asters and
goldenrods. For example, in experimental canopy gaps of the Allegheny forest of
Pennsylvania, Aster acuminatus was present after the gaps were harvested but not before
(Collins and Pickett 1998a). In a Maine oak-pine forest, two species, Lysimachia
quadrifolia and Solidago rugosa, were only present in harvested gaps, and Anemone
quinquefolia increased in abundance in harvested gaps and decreased in abundance in
control areas over time. Furthermore, 5 species of ferns and fern allies were more
abundant in harvest gaps both 5 and 10 years after harvest (Schumann 1999). In the
Allegheny forest, after canopy removal creating large gaps, Lycopodium lucidulum,
Uvularia spp. and M. repens had the greatest increase in abundance (Collins and Pickett

14 1998b). In the oak-pine forest, common understory forest herbs, including Maianthemum
canadense, Gaultheria procumbens, and Mitchella repens, present before the harvest
significantly decreased in abundance after gap creation, but increased in abundance in
control areas (Schumann 1999).
Species diversity and abundance often decline with age of the harvest gaps. The
decline is mostly attributed to extensive lateral growth by canopy edge trees reducing
available sunlight, and extensive tree regeneration within the harvested gap out-
competing the opportunistic herbs (Philips and Shure 1990). In harvested gaps of the
Allegheny forest, the number of herbs per plot increased over the study area up to three
years after harvest, but after 3 years, no significant difference was found in the number of
herbs between gaps and control areas (Collins and Pickett 1998b). The two gap
specialists in a Maine oak-pine forest mentioned previously significantly declined in
abundance 10 years after harvest (Schumann 1999). However, species diversity and
abundance still increase in early succession. In a southern Appalachian forest, species
richness was greater the second year after harvest than the first year and the most
significant net primary productivity (NPP) was attributed to the increase in herb species
during this time (Philips and Shure 1990).
Opportunistic species are often recruited in harvest gaps. This process is the most
prominent for increasing herbaceous plant diversity in harvested gaps. However, some
studies suggest that the predisturbance communities have a greater influence on herb
succession in gaps than the recruitment of opportunistic species. In a study of various
levels of canopy disturbance through harvest in New Hampshire, pre-harvest herbaceous
communities were typical of the closed-canopy understory. After canopy removal, the

15 same species occurred in the gap through the survival of stems and expansion of existing
patches rather than by seedling development. The investigators further suggest that the
spatial pattern of herb communities in gaps will persist for many years unless a more
dramatic disturbance than harvesting occurs (Hughes and Fahey 1991). Alternatively,
Collins and Pickett (1988a) suggest a species-specific reaction to harvested gaps because
the herb layer response is directly correlated with the autecology of the herb and the
change in the physical environment. Other studies support this suggestion. In the oak-
pine forest, five species, including A. quinquefolia, L. quadrifolia, M. canadense, P.
paucifolia, and Viola cucullata, were significantly correlated with gap size both 5 and 10
years after harvest. Furthermore, six species were significantly correlated with measured
light levels (Schumann 1999). In the Allegheny forest, the presence Erythronium spp.
was significantly correlated with gap position where it occurred predominantly towards
the edge of the gap (Collins and Pickett 1988b).
The most significant trend for shrub succession in eastern forests is the
recruitment and abundance of Rubus spp. in harvested gaps. For example, in harvested
gaps in an oak-pine forest, R. allegheniensis and R. idaeus were both abundant in
harvested gaps 5 and 10 years after harvest. R. allegheniensis began to decline 10 years
after harvest, but R. idaeus continued to increase in abundance 10 years after harvest.
Furthermore, R. idaeus abundance was significantly different between harvested gaps and
controls (Schumann 1999). In harvested gaps of New Hampshire, R. idaeus was one of
the most common shrubs after overstory removal and remained abundant 3 years after
harvest whereas other shrubs showed a decline in abundance. Furthermore, R. idaeus
was not present in intact forest (i.e., control) or in the predisturbance communities

16 (Hughes and Fahey 1991). In gaps of the Allegheny forest, Rubus spp. was not present
before the harvest (Collins and Pickett 1998b). Several factors influence Rubus
recruitment and succession into harvested gaps. Highly viable, buried seeds are the most
prominent form of Rubus recruitment, and the level of soil disturbance also influences
their presence. Their increase in abundance through early to mid succession is dominated
by their prolific seeding (Hughes and Fahey 1991; Collins and Pickett 1988b). Other
shrubs are also associated with harvested gaps. In an oak-pine forest, Juniperus
communis and Spiraea latifolia was more abundant in harvested gaps than in controls
both 5 and 10 years after harvest; however, Kalmia angustifolia was more frequent in
controls after harvest (Schumann 1999). In New Hampshire, Viburnum lantanoides was
also a common shrub after canopy removal, but its abundance decreased 3 years after
harvest (Hughes and Fahey 1991).
1.5. Canopy Gaps and Plant Species Diversity
The importance of disturbance in the development of forest structure is widely
recognized and well documented. Studies have indicated that canopy gaps opened by
disturbance not only create a diverse stand structure, but also enhance plant species
diversity across a forest landscape. This section examines some of the major hypotheses
describing the processes of increased diversity in forest landscapes from canopy gap
formation.
1.5.1. Gap Partitioning Hypothesis
The gap-partitioning hypothesis, introduced by Ricklefs in 1977, states that
various microenvironments (microsites) exist in a canopy gap as a result of the changes in

17 the physical environment (e.g., downed woody material, bare soil, etc.) caused by a
disturbance. These microsites will determine the distribution of a species existence or
colonization not only along a gap gradient (e.g., from the center of the gap to the edge),
but also across a landscape. This hypothesis assumes that certain species are limited only
to a gap environment or to a position within a gap environment. A study of plant
diversity in the montane forests of western Canada verifies this assumption. Plots with
the most open canopy of the study area contained Arnica (Arnica angustifolia spp.
Tomentosum), an herbaceous species not located in plots with closed canopies (Pharo and
Vitt 2000). A study of plant diversity in harvested gaps in an oak-pine forest of Mid-coast
Maine also documents two annual herbaceous species, whorled loosestrife (Lysimachia
quadrifolia L.) and rough-stemmed goldenrod (Solidago rugosa P. Mill.), which occurred
only in gap environments (Schumann 1999). Gray and Spies (1997) confirm the gap-
partitioning hypothesis for seedling establishment of western hemlock (Tsuga
heterophylla (Rafn.) Sarg.) in the coniferous forests of the Pacific Northwest. Western
hemlock was sensitive to microsite heterogeneity within canopy gaps, requiring well-
decayed logs and shade from the understory or other logs to establish successfully in the
gap. Therefore, gap specialists contribute to forest landscape diversity as well as stand
diversity with the occurrence and regeneration of a gap area. However, a study
performed in the temperate forests of the Great Smoky Mountains demonstrated that
there were few gap plant specialists, and that there were no strong differences in species
composition along the gap gradients (Busing and White 1997).
1.5.2. Density Hypothesis

18
The density hypothesis describes species diversity within gaps as a function of
frequency and density of seedling establishment. According to Denslow (1995), who
suggested the hypothesis, gap interiors are important areas for species diversity where the
primary regeneration occurs (Connell 1989; Denslow 1995). High sapling density in a
gap is the primary cause of species diversity within a gap. In the Great Smoky
Mountains, Busing and White (1997) confirm the density hypothesis where stem density
and species richness increased in canopy gap openings as compared to closed canopy
shaded areas. In an essay on tree fall gaps and forest dynamics in 1989, Connell supports
this hypothesis as well, stating that the species composition of the canopy is a function of
the densest colonizing population within a canopy gap. However, a long-term study in an
eastern deciduous forest of Michigan discovered that the local environmental conditions
predicted diversity in the gap rather than the density of plant species increasing the total
diversity (Poulson and Platt 1989).
1.5.3. Resource Allocation in Gaps
As Poulson and Platt suggest (1989), plant species diversity will increase in gap
areas according to localized environmental conditions. Resources (i.e., light, soil, water,
nutrients) for plant establishment and growth become available after a disturbance. The
disturbance event offers space that would otherwise be utilized by plants acquiring soil
nutrients, water, and light. For example, after examining fine root hairs in gap species in
a temperate forest, Canham et al. (1990) suggest that an increase in soil resources was
more of a determining factor for regeneration than light availability. However, the light
resource is the most documented reason for increasing plant diversity in canopy
throughout canopy gap literature.

19
Some studies indicate conflicting results on the amount of photosynthetically
active radiation (PAR) that influences species composition and diversity in gaps. In a
study of temperate forest gaps by Canham et al. (1990), PAR in gaps and under a closed
canopy had an even distribution of diffuse and direct solar radiation. Gaps received only
brief periods of high light. However, a study of gaps in a northern hardwood forest in
Michigan demonstrate that species with intermediate shade tolerance were more
successful in tree fall gaps than shade tolerant trees, suggesting that PAR does increase in
canopy gaps (Dahir and Lorimer 1996). In northern forests, the location where a species
colonizes in a gap may be an important factor determining light availability and diversity.
Poulson and Pratt (1989) found rapid initial growth of saplings, herbs, and shrubs
occurring on the northern edge of a gap and a greater diversity of species in comparison
to species composition on the southern edge.
Several factors influence the amount of light reaching the forest floor after a
disturbance. Seasonality and the time of day the measurements are recorded often limit
methods for measuring light availability (Canham et al. 1990; Schumann 1999). Other
factors also influence PAR in gaps. A more developed understory within the gap forest
structure will significantly limit sunlight to the forest floor. A study of sapling density in
the Southern Appalachians indicated that high Rhododendron maximum density clearly
inhibited the establishment of new seedlings in intermediate size harvest gaps (Beckage
et al. 2000). Also, gap size and gap age will influence PAR for species regeneration.
1.5.4. Gap Size and Plant Diversity
The actual occurrence of a gap infers an influx of resource availability in both
harvested and natural gaps. The physical changes in the environment can substantially

20 influence gap succession by the amount of resources that become available. Plant species
that require a significant amount of sunlight and space (i.e., ruderal species) to establish
may be more prevalent in the early successional stages of gap regeneration. It seems
logical then to suggest that the greater the gap area, the more resources available. Larger
gaps have more available growing and colonization space, less competition for resources
because of downed trees providing resources otherwise utilized before the disturbance,
and more area to receive direct sunlight (Krasny and Whitmore 1992). The area of
disturbance by tree mortality varies in size according to forest stand age. An old-growth
forest with large trees and tree canopies will create much larger gaps than a younger
stand 60-80 years old. In eastern forests, small gaps have an area of 50-100 m2, and large
gaps in old growth forests can be larger than 2000 m2 (Runkle 1982).
As stated previously, frequent minor disturbances dominate the Acadian forest
dynamic; however, these disturbances are rarely a restricted to one event (Worrall and
Harrington 1988). Multiple disturbances create larger, expanding gap areas that increase
overall species diversity (Hansen et al. 1991). Several studies have indicated that larger
gaps allow pioneer tree species not only to establish but also to survive into canopy status
(Foster 1988; Poulson and Platt 1989). A study of gaps in the southern Appalachians
indicated that total tree net primary production (NPP) was greatest at the gap center,
particularly for larger gaps where lateral extension of edge trees had less of an influence
on succession than in smaller gaps (Philips and Shure 1990). Furthermore, large gaps
permit less common herbaceous species (i.e. to the forest landscape) to be dispersed and
established due to the increase in growing space and direct sunlight (Schumann 1999;
Poulson and Platt 1989) thereby increasing the diversity of the overall forest landscape.

21 Alternatively, intermediate size harvest gaps between 150 – 400 m2 did not effectively
increase species diversity in a Southern Appalachian forest landscape (Beckage et al.
2000) indicating a threshold of gap size for increasing species diversity.
1.5.5. Competitive Ability
Variation in seed dispersal efficiencies and seedling competitive abilities can
greatly influence the successional patterns in gaps (Denslow 1980). Survival and canopy
recruitment in gaps is a function of the density and frequency of colonizing species,
growth rate, heights, and germination success (Canham 1989). For example, basal
sprouts from hardwood trees after disturbance rapidly occupy space and utilize resources
within a disturbed environment. Also, rapid colonization of opportunistic herb species in
disturbed areas can create high nutrient sequestering, thus limiting the succession of other
non-opportunistic species (Muller 1990). However, species with viable buried seed can
have greater success establishing in a gap than species that colonize the gap. Buried seed
gap specialists are able to respond quicker to the canopy opening; their establishment
limits space and nutrients for later colonizers (Connell 1989).
The future canopy composition of a gap environment is also dependent on the
density and size of colonizing species and advance regeneration. Densely established
advance regeneration will respond with increased growth after a canopy disturbance
limiting the recruitment and/or establishment of pioneer tree species. Taller seedlings or
saplings established in the gap area before canopy disturbance have a greater advantage
depending on how fast the trees respond to the available light after suppression (Connell
1989). However, the advantage of advance regeneration is negated in gap tree succession
when slower growing species (i.e., that persist into the upper canopy) or species with

22 higher rates of mortality (i.e., creating space for more colonization) dominate the gap
environment. Established herbaceous communities that survive the disturbance have a
competitive advantage as well, particularly species that reproduce vegetatively (Muller
1990). Furthermore, the greater growth rate of the established community will preclude
the succession of other forest herbs. When less common species are able to colonize into
the established communities of trees and/or herbs, their abundance with the slower
growing species will approach equilibrium in the future stand composition (Connell
1989).
1.6. Natural Gap Dating Methodologies
Understanding the gap dynamics of the Acadian forest is vital to developing
silvicultural approaches that are based on patterns of natural disturbance (Seymour and
Day 1997). A major limitation to quantifying vegetation dynamics in natural gaps is a
lack of methods for accurately determining when a gap was created. Many studies
comparing plant diversity and/or stand regeneration in recent natural gaps utilize several
non-destructive techniques for dating the natural gaps. These methods include evaluation
of conditions of the treefall, soil and litter disturbance, damage to adjacent vegetation
(Mladenoff 1990), changes in the lateral growth of trees as indicated by the distance
between bud scale scars (Rankin and Tramer 2002), and aging seedlings growing on tip-
up mounds (Battles and Fahey 2000). These methods are often subjective and can be
inaccurate.
A study performed by Dynesius and Jonsson (1991) evaluated eight different
methods for obtaining the best date of natural gaps in a northern Sweden boreal forest.
According to their results, initial growth of surrounding canopy trees and the growth

23 release of suppressed saplings evaluated by radial growth of the stem provided the best
method for dating natural tree fall gaps. Trees form an abrupt and sustained increase in
height and/or radial growth when exposed to higher light intensities after being
suppressed by larger trees and/or branches (Frelich 2002; Lorimer 1985). The date of
formation of natural gaps in a forest landscape can be defined by the year in which the
tree indicates a release from suppression. However, assigning a formation date for
natural gaps is sometimes problematic since increases in stem radial growth are also
indicative of climate changes and/or tree vigor. Furthermore, radial growth responses to
increased light by canopy openings will vary by a tree’s position in the canopy, location
relative to the gap, species, shade tolerance, the magnitude of the disturbance (i.e. slow
gap formation over long period), and whether a tree was injured during the disturbance.
Many studies have shown that saplings within the gap have provided accurate
results in dating natural gaps. In the northern Sweden boreal forest, the growth release of
suppressed saplings measured by the cross-section at the base of the tree provided an
accurate age of the natural gap where 17 of 22 gaps supported the best obtainable results
for dating the gaps (Dynesius and Jonsson 1991). In spruce-fir forests of the Rocky
Mountains, suppressed saplings responded to partial overstory removal with a 4-fold
increase in growth, but growth was sometimes depressed 1-2 years following harvest
(McCaughey and Schmidt 1982). A study on recent natural gaps in a northern hardwood
forest indicated that trees within the gap demonstrated a greater response in radial
increment than trees at the gap edge. Not only was tree position important, but also
different species had greater responses than others. Sugar maple responded to a greater
degree than eastern hemlock, red maple, and yellow birch (Dahir and Lorimer 1996).

24 Northern hardwood gap capture in New Hampshire demonstrated that after gap
formation, sugar maple and red maple grew more rapidly than American beech (McClure
et al. 2000). However, in an old growth forest of Maine, smaller trees in natural gaps
showed the same likelihood of response irrespective of their location within the gap (i.e.
gap edge or center), and tree species response was only significantly different for a
moderate release criterion, the preferred criterion (Chokkalingam 1998).
Because different tree species, ages, and location within a stand influence radial
growth after disturbance, many different release criteria to indicate a disturbance event
have been established. The suitability of a release criterion often varies by with region,
species, site, and other environmental factors (Chokkalingam 1998). The majority of the
release criteria cited in the literature were reviewed and summarized by Chokkalingam
(1998). Although many studies often assign an arbitrary release criterion, most studies
use an increase in radial growth of between 50% and 100% during a specified growth
period before and after the disturbance to indicate a major release or a minor release
depending on the characteristics of the tree species (Frelich and Lorimer 1991; Frelich
and Graumlich 1994; Frelich 2002).
Not only are the magnitude of the release important, but also the duration of the
response. The duration of an abrupt and sustained release discriminates disturbances
from growth changes due to climatic variation (Frelich 2002; Canham et al. 1990).
Lorimer (1985) suggests a 15-year consecutive growth release from suppression screens
out growth releases that are climatically related. Some studies deviate from these
standards. For example, Dahir and Lorimer (1996) used an average of 40% radial growth
increase from eight years predisturbance and five years post-disturbance to estimate the

25 probable date of gap formation. This low value was selected because the canopy gaps
were < 50 m2 in size, and it was successful in this study only because the researchers had
data on the initial size and growth rate of all the trees studied. Hence, climatic responses
in radial growth could be excluded.
Chokkalingam (1998) compared three different release criteria in a disturbance
study in an old-growth forest of Maine. Her release criteria ranged from a moderate
release (≥ 100% increase in growth 10 years duration before disturbance and after
disturbance) to absolute release (three years of radial growth < 0.5 mm following four
years of > 0.5 mm radial growth). Although all the criteria produced similar numbers of
responses, the lenient criterion overestimated disturbance intensity. Frelich (2002)
suggests that percentage growth increase is a more valuable indicator of disturbance than
a fixed growth rate (i.e., 0.5 mm/yr) because many tree species have a high growth rates
before a disturbance event.
Because of the considerable variation in tree response to canopy disturbance due
to differences in species, shade tolerance, gap size, and other environmental conditions,
the best method for dating recent natural gaps in the Acadian forest is difficult to
determine. Furthermore, assigning an arbitrary release criterion for tree response in
natural gaps in the Acadian forest type may not determine the best formation date. Most
disturbance chronology studies usually identify a disturbance event within a ten-year
period (Lorimer 1985) because there are many factors that influence tree growth response
to release from suppression. Therefore, understanding how particular species in various
positions of a forest structure and in various gap sizes react to a known disturbance (i.e.,

26 both spatially and temporally) can benefit natural disturbance chronological studies
where the disturbance patterns of the forest structure are unknown.
1.7. Literature Cited
Battles, J.J. and Fahey, T.J. 2000. Gap dynamics following forest decline: a case study of red spruce forests. Ecol. App. 10 : 760-774
Beckage, B., Clark, J.S., Clinton, B.D., and Haines, B.L. 2000. A long-term study of tree seedling recruitment in southern Appalachian forests: The effects of
canopy gaps and shrub understories. Can. J. For. Res. 30: 1617-1631 Busing, R.T. and White, P.S. 1997. Species diversity and small-scale disturbance
in an old growth temperate forest: A consideration of gap partitioning. Oikos. 78: 562-568
Canham, C.D. 1989. Different responses to gaps among shade-tolerant tree
species. Ecol. 70 : 548-550 Canham, C.D., Denslow, J.S., Platt, W.J., Runkle, J.R., Spies, T.A., and White, P.S.
1990. Light regimes beneath closed canopies and tree-fall gaps in temperate and tropical forests. Can. J. For. Res. 20: 620-631
Chokkalingam, U. 1998. Measuring and estimating small-scale gap disturbance
parameters: a review and statistical comparison of prevalent methodology. In Spatial and Temporal Patterns and Dynamics in old-growth northern hardwood and mixed forests of northern Maine. Ph. D. dissertation, University of Maine, Orono, ME
Clinton, B. D., Boring, L.R., and Swank, W.T. 1994. Regeneration patterns in canopy
gaps of mixed-oak forests of the Southern Appalachians: Influences of topographic position. Am. Mid. Nat. 132: 308-319
Coates, K.D. 1999. Conifer seedling response to northern temperate forest gaps. For.
Ecol Man. 4820: 1-21 Collins, B.S. and Pickett, S.T.A. 1988a. Response to herb layer cover to
experimental canopy gaps. Am. Mid. Nat. 119: 282-290 Collins, B.S. and Pickett, S.T.A. 1988b. Demographic response of herb layer in
species to experimental canopy gaps in a northern hardwood forest. J. Ecol. 76: 437-450 Connell, J.H. 1989. Some processes affecting the species composition in forest
gaps. Ecol. 70: 560-561

27 Dahir, S. and Lorimer, C.G. 1996. Variation in canopy gap formation among
developmental stages of northern hardwood stands. Can. J. For. Res. 26: 1875-1892
Denslow, J.S. 1995. Disturbance and diversity in tropical rain forest: the density effect. Ecol. App. 5: 962-968
Dynesius, M. and Jonsson, B.G. 1991. Dating uprooted trees: comparison and
application of eight methods in a boreal forest. Can. J. For. Res. 21: 655-665 Ehrenfeld, J.G. 1980. Understory response to canopy gaps of varying sizes in a mature
oak forest. Bull. Torr. Bot. 107: 29-41 Foster, D.R. 1988. Disturbance history, community organization and vegetation
dynamics of the old-growth Pisgah forest, south-western New Hampshire, U.S.A. J. Ecol. 76: 105-134
Frelich, L.E. 2002. Forest dynamics and disturbance regimes. Studies from
temperate evergreen-deciduous forests. Cambridge University Press. New York, NY
Frelich, L.E. and Lorimer, C.G. 1991. Natural disturbance regimes in hemlock-
hardwood forests of the upper Great Lakes region. Ecol. Mon. 61: 145-164 Frelich, L.E. and Graumlich, L.J. 1994. Age class distribution and spatial patterns in
an old-growth hemlock-hardwood forest. Can. J. For. Res. 24: 99-120 Hansen, A. J., Spies, T.A., Swanson, F.J., and Ohmann, J.L. 1991. Conserving
biodiversity in managed forest; lessons from natural forest. BioScience. 41: 382-392
Hibbs, D.E. 1982. Gab dynamics in a hemlock-hardwood forest. Can. J. For. Res.
12: 522-527 Hughes, J.W. and Fahey, T.J. 1991. Colonization dynamics of herbs and shrubs in
a disturbed northern hardwood forest. J. Ecol. 79: 605-617 Kimball, A.J., Whitham, J.W., Rudnicky, J.L., White, A.S., and Hunter, M.L. 1995.
Harvest-created and natural gaps in an oak-pine forest in Maine, Bull. Torr. Bot. 122: 115-123
Krasny, M.E. and Whitmore, M.C. 1992. Gradual and sudden forest canopy gaps
in Alleghany northern hardwood forests. Can. J. For. Res. 22: 139-143 Lorimer, C.G. 1977. The presettlement forest and natural disturbance cycle of
northeastern Maine. Ecol. 58: 139-148

28 Lorimer, C.G. 1985. Methodological considerations in the analysis of forest
disturbance history. Can. J. For. Res. 15 :200-213 Lunquist, J.E. and Beatty, J.S. 2002. A method for characterizing and mimicking forest
canopy gaps caused by different disturbances. For Sci. 48: 582-594 McCaughey, W.W. and Schmidt, W.C. 1982. Understory tree release following harvest
cutting in spruce-fir forests of the Intermountain West. USDA Forest Service Research Paper InT-285.
McClure, J.W., Lee, T.D., and Leak, W.B. 2000. Gap capture in northern hardwoods:
patterns of establishment and height growth in four species. For. Ecol. Man. 127: 181-189
Mladenoff, D.J. 1990. The relationship of the soil seed bank and understory vegetation
in an old-growth northern hardwood-hemlock tree fall gaps. Can. J. Bot. 68: 2714-2721
Moore, M.R. and Vankat, J.L. 1986. Response of the herb layer to the gap
dynamics of a mature beech-maple forest. Am. Mid. Nat. 115: 336-347 Muller, R.N. 1990. Spatial interrelationships of deciduous forest herbs. Bull. Torr. Bot.
117: 101-105 Oliver, C.D. and Larson, B.C. 1996. Forest Stand Dynamics. John Wiley and Sons,
Inc., N.Y. Pharo, E.J. and Vitt, D.H. 2000. Local variation in bryophyte and macro-lichen cover
and diversity in montane forests of western Canada. Bryologist. 103: 455-466 Phillips, D.L. and Shure, D.J. 1990. Patch-size effects on early succession in Southern
Appalachian forests. Ecol. 71: 204-212 Poulson, T.L. and Platt, W.J. 1989. Gap light regimes influence canopy tree
diversity. Ecol. 70: 553-555 Rankin, W.T. and Tramer, E.J. 2002. Understory succession and the gap regeneration
cycle in a Tsuga canadensis forest. Can. J. For. Res. 32: 16-23 Ricklefs, R.E. 1977. Environmental heterogeneity and plant species diversity a
hypothesis. Am. Nat. 111: 376-381 Roberts, M.R. and Gilliam, F.S. 1995. Patterns and mechanisms of plant diversity in
forested ecosystems: implications for forest management. Ecol. App. 5: 969-977

29 Runkle, J.R. 1981. Gap regeneration in some old-growth forests of the eastern
United States. Ecol. 62: 1041-1051 Runkle, J.R. 1982. Patterns of disturbance in some old-growth mesic forests of
eastern North America. Ecol. 63: 1533-1546 Runkle, J.R. 1985. Disturbance regimes in temperate forests. In The ecology of
natural disturbance and patch dynamics. Academic Press, Inc., Orlando, FL. Runkle, J. R. 1992. Guidelines and Sample Protocol for Sampling Forest Gaps.
USDA Forest Service Paper PNW-GTR-283 Schumann, M.E. 1999. The effects of harvest-created gaps on plant species
diversity, composition, and abundance in a Maine Oak-Pine forest. MS thesis, University of Maine, Orono, ME
Schumann, M.E., White, A.S., and Witham, J.W. 2003. The effects of harvest-created
gaps on plant species diversity, composition, and abundance in a Maine oak-pine forest. For. Ecol. Man. 176: 532-561
Seymour, R.S., White, A.S., and deMaynadier, P.G. 2002. Natural disturbance
regimes in northeastern North America-evaluating systems using natural scales and frequencies. For. Ecol. Man. 155: 357-369
Seymour, R.S. and Hunter, M.L. 1999. Principles of ecological forestry In Maintaining biodiversity in forest ecosystems. Edited by M. L. Hunter. Cambridge University Press, NY.
Seymour, R.S. and Day, M.E. 1997. Ecologically based expanding-gap silvicultural
systems in the Acadian Forest. Understanding changed in managed and unmanaged forest. In Proc. First Biannual North American Forest Ecology Workshop. North Carolina State University, Raleigh, NC June 24-26, 1997
Seymour, R.S. and Hunter, M.L. 1992. New Forestry in eastern spruce-fir forests:
principles and applications to Maine. MAFES Misc. Pub. 716. Thompson, J.T. 1980. Tree falls and colonization patterns of temperate forest
herbs. Amer. Mid. Nat. 104: 176-184 Whitmore, T.C. 1989. Canopy gaps and the two major groups of forest trees.
Ecol. 70: 536-538 Worrall, J.J. and Harrington, T.C. 1988. Etiology of canopy gaps in spruce-fir
forests at Crawford Notch, New Hampshire. Can. J. For. Res. 18: 1463- 1469

30
Chapter 2
VEGEATATION DYNAMICS IN HARVEST GAPS, NATURAL GAPS, AND
CLOSED CANOPY CONDITIONS IN MAINE’S ACADIAN FOREST
2.1. Abstract
The creation of canopy gaps through natural disturbance is an important
ecological process in the Acadian forest. Designing harvest gaps that emulate natural gap
dynamics may be important for maintaining structural and biological diversity, as well as
the natural regeneration of desired tree species. To better understand this process, we
used a controlled study in central Maine to compare the abundance, diversity, and
composition of plants among and within harvested gaps, natural gaps, and under a closed
canopy in the Acadian forest. We evaluated 45 harvested gaps, 23 natural gaps, and 23
closed canopy transects. The percent cover of each species was recorded in 4 m2 plots
located at 2 m intervals along a north/south transect across each gap. Harvested gaps
were measured four growing seasons after harvest.
Total plant cover in all gaps (60.4% mean cover per gap) was 83% greater than
under the closed canopy (10.6%) (p < 0.001). Cover was 27% greater in harvested gaps
(34.9%) than in natural gaps (25.5%) (p < 0.005). Abies balsamea was the most
abundant species among harvested gaps, natural gaps, and closed canopy conditions.
Total cover was correlated with distance from the gap center of the largest harvest gaps
(1,170 – 2,106 m2) with the highest cover occurring in the gap centers (r2 = 0.27, p <
0.001). Species richness (# of plant species) per sample area was greater in harvest gaps
> natural gaps > closed canopy (p < 0.001), but species richness was not correlated with
location within the gap. Species evenness (measured as the slope of the dominance

31 diversity curves) indicated that 1) neither gaps nor closed canopy conditions had an even
distribution of plant species (p < 0.001) and 2) that plant cover was less evenly
distributed under the closed canopy than in both harvested and natural gaps.
One hundred ninety-five plant species were identified in all plots. One hundred
twelve species were found only in harvest gaps, and 35% of the 112 were classified as
early successional, shade-intolerant species. Detrended correspondence analysis on the
presence and absence of plant species indicated that the composition of natural gaps and
closed canopy conditions were more similar to each other than to that of harvested gaps.
Tree regeneration was abundant under all conditions but was not correlated to gap
origin (p = 0.15) or location within the gap. Seedlings (<0.5 m tall) were the most
abundant form of regeneration, and saplings (0.5 – 2.0 m tall) were most abundant in
harvested gaps. A. balsamea was the most abundant tree species regenerating in natural
gaps and closed canopy conditions, while Acer rubrum was most abundant in harvested
gaps.
2.2. Introduction
Maine is 90% forested, and 96% of the forest landscape is used in productive
timberland mostly owned by large landowners both industrial and non-industrial.
Although the current forest inventory in Maine remains stable, the Maine Forest Service
has found a slight decline in inventory that is projected to continue for the next 5 years
(Laustsen and Griffith 2002). Furthermore, harvesting practices and spruce-budworm
epidemics have changed the composition of the most abundant forest type in northern
Maine (i.e. where most of the managed forests are located) from a spruce-fir forest
typical of the presettlement forest structure (Lorimer 1977) to a maple/beech/birch forest

32 type (Laustsen and Griffith 2002). Maine’s forests are the largest contributor to Maine’s
economy with forest-based manufacturing and forest-related tourism contributing over
$6.5 billion (z NESFA 2001). In 1993, Maine wood products, lumber, and paper
industries produced goods and services totaling $4.7 billion (MCSFM 1996). Because of
great social concern and the multiple-use nature of the industrial and non-industrial
forest, managing forests for long-term productivity as well as non-timber values, such as
wildlife habitat, biodiversity, and recreation, is crucial.
The concept of ecological forestry, which prescribes a harvesting design that
incorporates both timber and non-timber values, has been proposed for the management
of Maine’s managed forests (Seymour and Hunter1999; Seymour and Day 1997;
Seymour et al. 2002). Ecological forestry involves harvesting according to the common
natural disturbance regime within the spatial and temporal limits of Maine’s natural forest
structure. The goals of this management practice are to maintain the legacy of Maine’s
forests, defined as the presettlement forest structure and composition, and to enhance the
biological and structural diversity within the forest landscape. These goals of ecological
forestry are currently thought to be achieved in Maine by creating a range of gap sizes up
to 0.2 ha (as would be witnessed after a natural disturbance) within the managed forest
leaving large residual trees (both live and dead) throughout the harvesting rotations
(Seymour et al. 2002; Seymour and Hunter 1992; Hansen et al. 1991). These gaps and
residual trees are proposed to achieve a presettlement structural diversity by creating an
array of tree ages and sizes as witnessed in natural forests as opposed to simplified single
cohort plantation forests in the industrial forest (Roberts and Gilliam 1995; Seymour and
Hunter 1992). This landscape structural diversity in the Northeast promotes the most

33 suitable habitat for plants and wildlife where many types of organisms occupy the full
sere of young and old forest structures (Hansen et al. 1991). Furthermore, this forest
management design can ensure the regeneration of commercially valuable, late
succession species. In Maine, commercially valuable tree species like Picea rubens
Sarg., Pinus strobus L., and Betula alleghaniensis Britt naturally initiated their
populations under the natural disturbance regime in this forest type (Seymour and Hunter
1999). Therefore, the regeneration of these species could be maintained through canopy
gap formation.
The concepts of ecological forestry are based on two hypotheses: 1) disturbance is
a natural process in forest ecosystems, and 2) canopy gaps create a diverse forest stand
structure that fosters not only wildlife habitat and diversity, but also plant species
diversity across a forested landscape (Seymour and Hunter 1999). If canopy gaps are
utilized in forest management, the forester needs to emulate the complex interactions of
several ecological elements present in natural gaps. These ecological elements included
not only a missing canopy, but also the presence of downed woody material, standing
snags, and undergrowth vegetation including established trees, shrubs, and herbs
(Lundquist and Beatty 2002).
Minor disturbances, including windthrow and tree mortality, are characteristic of
the Acadian forest, a sub-boreal transition zone forest, with a 0.5 - 1% annual frequency
(Runkle 1981; Seymour and Hunter 1992). This disturbance regime creates tree fall
canopy gaps and a multiple cohort stand structure with an uneven distribution tree ages
and sizes (Seymour and Hunter 1992; Oliver and Larson 1996). Several studies indicate
that natural disturbances creating canopy gaps are important to the structural and

34 biological diversity of a forest ecosystem (Busing and White 1997; Hansen et al. 1991;
Whitmore 1989). Location within a gap, available growing space, and the success of gap
capture by plant species can determine the level of vegetation diversity within a disturbed
area. Some species of herbaceous plants, shrubs and trees are limited primarily to gap
environments, and their establishment can enhance the overall diversity of the forest
stands with the frequent occurrence of canopy gaps (Poulson and Platt 1989; Runkle
1982). The development of commercially valuable tree species in forest stands may
depend on the occurrence of a canopy gap and the species response to increased available
light and other resources (Foster 1988; Runkle 1985; Seymour and Hunter 1992). Since
most of Maine’s forests are utilized for timber extraction, understanding vegetation
diversity and patterns of forest regeneration within canopy gaps in managed forests is
crucial.
In order to implement the principles of ecological forestry in Maine, we must
better understand the dynamics of canopy gaps in the Acadian forest. The Forest
Ecosystem Research Program (FERP) at the University of Maine is a long-term,
interdisciplinary research effort examining the ecological effects of an expanding-gap
silvicultural system. Harvests gaps created as part of this study provide an opportunity to
evaluate vegetation dynamics four years after harvest, and compare the results to the
vegetation dynamics in natural gaps and under the closed canopy. In this study, we
examine the following hypotheses:
1) There is no difference in plant abundance, diversity, and composition among
and within harvest gaps, natural gaps, and closed canopy conditions

35
2) Plant abundance, diversity, and composition are not correlated with the
following gap characteristics:
a. Gap origin
b. Gap age
c. Gap size
d. Canopy openness
e. Location within the gap
2.3. Methods
2.3.1. Study Area
The study area is located in the University of Maine’s Penobscot Experimental
Forest (PEF) in the towns of Bradley and Eddington, Penobscot County, Maine (44 50’N,
68 35’W). The PEF encompasses 1,600 hectares and is part of the Acadian forest type.
The dominant tree species in the PEF include Tsuga canadensis (L.) Carr., Acer rubrum
L., P. rubens, P. strobus, Thuja occidentalis L, Abies balsamea (L.) P. Mill, Populus
tremuloides Michx, and Betula papyrifera Marsh.. The PEF has a complex history of
repeated cuttings resulting in relatively even-aged stands dating from the late seventeenth
century. Forest soil structure is variable, but principally Aquic or Typic Haplorthods or
Podzols; slope is generally less than 8% (Brissette and Kenefic 1999).
2.3.2. Experimental Design
Using current information about natural disturbance regimes in the Acadian
Ecoregion (Runkle 1981; Seymour and Hunter 1992), an expanding-gap silvicultural
system with permanent reserve trees was developed (Seymour and Day 1997). Based
loosely on the German “Femelschlag” system (Seymour and Day 1996), the treatment

36 prescriptions include: 1) 20:10 treatment - 20% canopy removal on a 10-year cutting
cycle for 50 years (creating 0.2 ha openings) following 50 years regeneration with 10%
of the basal area remaining in permanent reserve trees for, and 2) 10:30 treatment - a 10%
canopy removal level on a 10-year cutting cycle for 100 years (creating 0.1 ha openings)
with 30% of the basal area remaining in permanent reserve trees. These treatments are
being compared to control areas that receive no harvesting.
Both harvest treatments are designed to provide a 1% annual disturbance rate in
100 years regeneration similar to that estimated for presettlement forests in Maine
(Lorimer 1977). The 20:10 treatment will hypothetically enhance the development of
mid-succession species and produce five different cohorts within the managed stand. The
10:30 treatment is intended to accelerate the development of late successional species and
produce ten cohorts within the managed stand. These treatments also were designed to
maintain the economic advantages of even aged methods, yet provide many of the
structural features found in uneven aged stands. The maintenance of permanent reserve
trees is intended to provide structural diversity and control species composition.
The treatment areas are approximately 10 ha in size, and replicated three times in
a randomized complete block design. The first harvest entry (i.e., gap creation) occurred
in 1995 for Block 1 (Research areas 1, 2, and 3), 1996 for Block 2 (Research areas 4, 5,
and 6) and 1997 for Block 3 (Research areas 7, 8, and 9). As a result of this initial
harvest, between seven and 10 gaps were produced in each of the six treated plots
creating approximately 52 gaps between 0.1 and 0.2 ha in size.
2.3.3. Plot Establishment

37
A subset of 45 harvest canopy gaps was selected for the study in order to establish
equal gap samples per treatment. In addition, 23 natural gaps were selected from the
three control areas. Gap boundaries of both natural gaps and harvest gaps were defined
using a line connecting the bole of each tree whose canopy contributes to the edge of the
gap (Runkle 1992). This approach provides a more meaningful assessment of the total
area affected by increased light intensity as a result of the canopy opening (Dahir and
Lorimer 1996). Natural gaps within the control plots were defined as follows: the area of
the canopy opening that is large enough to expose to the sky the crowns of stems that
would otherwise be in the understory and where those stems are no taller than 2 m. The
canopy gap must have been created by at least two tree falls or stem breaks of canopy
trees (gap maker) that are ≥25 cm at 1.4 m (Runkle 1992). Finally, natural canopy gaps
were considered only if they were at least 30 m away from a road to eliminate any
environmental factors caused by edge effects.
Gap Area
Gap center
2.0 m
4 m² quadrat
North

38 Figure 2.1: An example of the plot layout within a gap. Vegetation data were collected
at each quadrat lain on the north/south transect line within the gap. The same layout for
the transect and sample plots was used under the closed canopy.
Once all natural and harvested gaps were located, the length of the longest
north/south transect from the gap center was measured. The transect was permanently
marked with two lines of white paint where the transect intersects with the gap edge tree
or on the two closest trees. We used yellow flagging to mark the precise point of
intersection between the gap edge and the transect line. The gap center was located by
measuring the center of the north/south transect line, and the center was permanently
marked with a rebar. Square vegetation sample plots (2 m x 2 m in size) were established
at 4 m intervals along each transect beginning at the gap center and extending to the north
and south gap edge. For sample plots on the northern half of the gap, the southwest
corner to the plot was placed on the 4 m interval point, and for plots on the southern half
of the gap, the northeast corner of the plot was placed at the 4 m interval points along the
transect (Figure 2.1). Twenty-three closed canopy transects were established in the
control areas (7-10 plots in each of the three control research areas). Each transect
contained a total of four sample plots (two north and two south) placed two meters apart
creating a 16 m transect line. Closed canopy transects were placed under a continuous
closed upper canopy that was at least 30 m away from a canopy opening.
2.3.4. Independent Variables
The following independent variables were used to examine the relation between
gap characteristics and vegetation responses:
39
2.3.4.1. Gap Origin
Gap origin was determined by whether the gap was created by a harvest
treatment, naturally by the death of two or more canopy trees in the control area, or no
gap (i.e., by the continuous closed upper canopy).
2.3.4.2. Canopy Openness
The openness of a harvest gap, natural gap, and closed canopy was quantified
using three methods including 1) gap area, 2) overstory basal area, and 3) gap fraction.
Gap area was calculated by mapping each gap using both Trimble Pro XL™ and Trimble
GeoExplorer® 3 GPS units. Satellite data were processed and exported in NAD83 datum,
UTM Zone 19 coordinate system format using GPS Pathfinder Office v. 2.80 to ArcView
3.2 shapefiles. Harvest gap area was determined from these GIS maps and harvest gap
size ranged from 108 m2 to 2169 m2. Gap area for the natural gaps was determined using
the sampling protocol for estimating gap size described by Runkle (1992). Gap size was
estimated by calculating the area of an ellipsoidal shape within the gap. Using the already
established north/south transect line, a perpendicular east/west transect line was
established for producing the ellipsoidal shape. The area for each gap was calculated
from the length of these two transect lines using the formula for an ellipse:
[1] Area=πLW/4
where L is the length of the longer transect line and W is the length of the shorter transect
line (Runkle 1992). Natural gap size ranged from115 m2 to 511m2.

40
Overstory basal area was also measured at each sample plot using a 5 factor
wedge prism. Each tree considered as “in” using the prism measurement was identified
and counted. Gap fraction (DIFN) was measured at each sample plot using a Licor LAI
2000 plant canopy analyzer at 1.4 m (i.e. breast height). A 180° view restrictor (i.e.
covering half of the lens) was used to prevent the person recording from being in the
image. When leaves from trees or shrubs were close to the lens, the leaves were moved
away from the lens, but the trees remained in their original position. Each plot value was
compared against a gap fraction value measured simultaneously (i.e., within 5 seconds)
under open conditions. The LAI-2000 records the DIFN value from a hemispherical lens
in front of five concentric rings, but only the inner 4 concentric rings were used for the
analysis. The DIFN value indicates the fraction of sky that is not blocked by foliage
(Gendron et al. 1998). All measurements were taken under uniformly cloudy or
uniformly clear sky conditions.
Differences in canopy openness among harvest gaps, natural gaps, and closed
canopy conditions as measured by canopy gap fraction and overstory basal area were
analyzed using two different statistical tests. ANOVA with linear contrasts using PROC
GLM in SAS System for Windows, Version 8.1 was used to determine differences in
overstory basal area among harvest gaps, natural gaps, and closed canopy conditions.
The Kruskal-Wallis test with linear contrasts, a non-parametric statistical test, was used
to test the differences in canopy gap fraction among harvest gaps, natural gaps, and
closed canopy conditions using PROC RANK and PROC GLM in SAS. The Kruskall-
Wallis test assesses whether the observations in the sample population are all the same

41 across locations. All observations are ranked from smallest to largest. The sum of the
ranks for each sample is used to compute the test criterion and compare with tabulated
values. Because the Kruskal-Wallis test is able to perform linear contrasts, this test was
ideal for identifying differences among gaps and between natural conditions and harvest
conditions. Linear regression analyses using PROC REG in SAS were performed to
determine whether canopy openness measured by both overstory basal area and canopy
gap fraction were correlated to gap size. Normal distribution and equality of variance of
the data were tested using proc univariate and proc anova on the absolute value of the
residuals (i.e., Levine’s test) respectively in SAS.
2.3.4.3. Location Within the Gap
In a long-term study on vegetation responses to canopy gaps in Michigan,
Poulson and Platt (1989) discovered that growth, regeneration, and species diversity
differed between a northern gap edge and a southern gap edge. We hypothesized that
vegetation composition would differ by location within each gap in our study. In this
study, we used a distance along the north/ south transect to assess whether vegetation
responses were correlated with locations within each gap. Spacing of sample plots at 2 m
intervals along each transect was used as the measurement of distance from gap center.
3.4.4. Gap Age
Differing ages among gaps are likely to influence interpretations of vegetation
response patterns. Harvest gaps were sampled four years after harvest (i.e., in 1999 for
RA 1 and RA 2, in 2000 for RA 5 and RA 6, and in 2001 for RA 7 and RA 9). However,
the age of the natural gaps was unknown. Therefore, natural gaps were aged using

42 understory sapling tree ring analysis (See Chapter 3). Nine natural gaps were
approximately five years old, five of the natural gaps were approximately 10 years old,
and the remaining nine natural gaps could not be dated using this method for aging gaps.
2.3.5. Dependent Variables and Analytical Approach
The response variables used in the analysis included:
2.3.5.1. Vascular Plant Abundance
Vascular plants were identified to the species level using Haines and Vining
(1995) for all herbs, shrubs, trees, and ferns within each sample plot. An ocular
estimation of percent cover (to the nearest 1% for small species with low cover and to the
nearest 10% for larger species with greater cover) was recorded for each species in every
sample plot. These measurements were used to determine the species diversity, evenness
of distribution, and species richness for each gap and species location within the gap.
Overall percent cover estimate also was recorded by class for 1) dead wood; 2) rocks; 3)
leaf litter; 4) all conifer species; 5) all hardwood species; 6) all shrub species; 7) all
herbaceous species; 8) all fern species; 9) graminoids 10) mosses and 11) lichens.
Plant species abundance was evaluated as the average percent cover of each
species per gap and per closed canopy transect. Two non-parametric statistical tests were
used for testing differences in plant abundance because these data did not meet the
assumptions of parametric statistics. The Kruskal-Wallis test with linear contrasts was

43 used to test the differences in abundance among harvest gaps, natural gaps, and closed
canopy conditions using PROC RANK and PROC GLM in SAS. However, the Kruskal-
Wallis test is sensitive to normal distribution of data (Steele et al. 1997), and normality
was not achieved with rank transformations for abundance data by species category (i.e.,
ferns, grasses, lichens, mosses etc.) Hence, a Multiple Response Permutation Procedure
(MRPP) using PC-ord was used to detect differences abundance by plant type among
harvest gaps, natural gaps, and closed canopy. MRPP is a non-parametric procedure that
uses a weighting factor with a squared Euclidean distance to produce a statistical test
equivalent to an ANOVA F-test. MRPP uses a random permutation of all the
observations to perform the ANOVA equivalent test, and it is based on the assumption of
equal dispersion of the data (McCune and Mefford 1999). However, linear contrasts
cannot be used with this procedure. Multiple linear regression analysis was performed to
test whether abundance of vascular plant species was correlated to gap characteristics
(stand density, canopy openness, and location within the gap). This analysis was
performed using PROC REG in SAS, and SYSTAT Version 10 (2000). Plant cover data
were transformed using an inverse transformation.
2.3.5.2. Vascular Plant Composition
Composition of a gap was determined for tree regeneration and total species
composition. An importance index was created for each species by origin to determine
how important a species was in a given condition based on how frequently it occurred
and how much space the species occupies (i.e., its cover in the sample plot). Frequency
was calculated by the number of times a species occurred in a gap divided by the number
of sample plots in the gap (i.e., because sample are was proportional to gap size).

44 Average cover of a species was calculated by the total cover of the species in the gap
divided by the number of sample plots in the gap. Both mean cover and frequency were
averaged over each condition to create a mean frequency and a mean cover of the species
in harvest gaps, natural gaps, and closed canopy conditions. The importance index was
calculated by multiplying the mean frequency of the species by its mean cover in harvest
gaps, for example. Further, each species was categorized by its life history traits in
Maine, including shade tolerance, lifespan, phenology, and habitat to determine its
relative successional status in forest ecosystems.
A multivariate analysis was performed using overall community composition to
determine the patterns and trends in the variation of the vegetation response (McGarigal
et. al 2000). A detrended correspondence analysis (DCA) was used first to determine the
similarity of all the research areas based on their location within ordination space. This
test was performed to determine if differences in soil moisture were creating different
environments among the research areas. DCA is an eigenanalysis ordination technique
based on reciprocal averaging which ordinates both species and samples simultaneously
based on a chi-square distance measure (McCune and Mefford 1999). Second, DCA was
used to assess the compositional similarity among harvest gaps, natural gaps, and closed
canopy transects based on the presence and absence of plant species. This analysis was
performed to assess the similarity of harvest gaps to natural tree fall gaps based on the
compositional changes that occur by gap origin.
2.3.5.3. Tree Regeneration
The species, density, and height of all regenerating tree species were recorded
using stem counts by height class (≤ 0.5 m, > 0.5 - 1.0 m, > 1.0 - 2.0 m, and > 2.0 m) for

45 each tree species in each sample plot. Tree regeneration (i.e., stems categorized by height
class in each quadrat) was analyzed with chi-square test for independence using the SAS.
Non-linear regression using Sigma Plot 2000 Version 6 was performed to determine
whether tree regeneration was correlated to its location within the gap
2.3.5.4. Plant Species Diversity
Plant diversity was evaluated from the vascular plant assessment using species
richness and the Shannon-Weiner index of diversity. Because sample area was
proportional to gap size, and larger gaps had more opportunity to acquire plant species,
species area curves were used as indicators of species richness. Separate species area
curves were generated for harvest gaps, natural gaps, and closed canopy transects using
PC-ord (Version 4). PC-ord generates the species-area curve by randomly subsampling
all possible combinations of the maximum number of sample plots (500 at most as a
limitation of PC-ord) to determine the mean number of species identified as a function of
sample size (McCune and Mefford 1999).
To test whether the species area curves were derived from different populations
for the harvest gaps, natural gaps, and closed canopy conditions, non-linear regression
models were derived for each condition. The purpose of this test was to determine
whether species richness (indicated by the species area curves) was different among
harvest gaps, natural gaps, and closed canopy transects. Statistical differences among the
three models were tested using the method described by Wagner and Ter-Mikaelian
(1999). Using an a priori approach, the full model (i.e., the three separate species area

46 curves for harvest gaps, natural gaps, and closed canopy plots) was compared with three
reduced model forms that pooled the samples from gaps and closed canopy plots in
various combinations. We tested sequentially to determine whether the full model
accounted for more variation than 1) a reduced model of richness including all quadrats
regardless of origin 2) a reduced model of gap richness versus closed canopy richness,
and 3) a reduced model of natural gap and closed canopy richness versus harvest gap
richness.
An insignificant result at any step of the comparison (p > 0.05) terminated any
further model comparisons. Each model comparison was evaluated using an F-test. The
F-statistic was calculated using the ratio of the difference between the residual sum of
squares for the reduced and full models to the residual sum of squares for the full model
divided by the appropriate degrees of freedom. The P-value was calculated as a
percentile of the F-distribution with the respective degrees of freedom.
The Shannon-Weiner index of diversity (H), which measures the proportional
abundance and distribution of species, was calculated for each gap in all conditions:
[2] ∑=
−=s
iH
1pi ln pi
where s is the species richness, pi is the proportion of percent cover that belongs to
species i. Analysis of variance with linear contrasts was used to detect differences by gap
origin as measured by the Shannon-Weiner index using Proc GLM in SAS. T-tests were
performed to test differences in plant abundance and diversity between natural gaps and
harvest gaps within the same size range (~100-500 m2). Isolating gaps of a similar size
range allowed us to determine what variables were affecting abundance and diversity by

47 eliminating the large range of gap sizes. Multiple regression analysis using a linear
model was performed to test whether the Shannon-Weiner diversity was correlated to gap
characteristics (stand density, canopy openness, and location within the gap) using PROC
REG in SAS and SYSTAT Version 10 (2000).
2.3.5.5. Plant Species Evenness
Both species richness and the Shannon-Weiner diversity index do not differentiate
between rare species and dominant species. Therefore, Whittaker’s dominance-diversity
curves (1975), and the Shannon-Weiner Equitability index were calculated to determine
the evenness of plant diversity.
Based on Whittaker (1975), a dominance diversity curve was created for every
gap and every closed canopy transect as a measure of species evenness independent of
sample area. Each species in a gap were ranked from highest to lowest based on their
proportional abundance (i.e., percent cover of a given species divided by the total percent
cover in the gap). In each gap or transect, the species ranks were plotted against their
proportional abundance in that gap, and a non-linear regression was performed using the
log normal model y=e-ax. These analyses were performed separately for all gaps and
closed canopy transects. Hence, each gap and transect contained a separate curve and a
corresponding slope (‘a’ in the model). The slope of each line was used as an indicator of
the plant distribution in each gap or transect. For example, if the slope of the dominance
diversity curve for gap y was equal to zero, then all species were of equal importance and
were evenly distributed throughout the gap. The Kruskal-Wallis test with linear contrasts

48 was used to test the differences in plant evenness (i.e., differences among the slopes of
the dominance-diversity curves) among harvest gaps, natural gaps, and closed canopy
transects using SAS because this data did not meet the assumptions of parametric
statistics.
The Shannon-Weiner equitability index (E) was used to determine the extent of
which distribution contributes most to diversity (Magurran 1988) [3].
[3] E=H/Hmax = H’/ln(s)
Hmax indicates the maximum diversity of the given condition. Analysis of variance with
linear contrasts was used to detect differences in plant evenness by gap origin as
measured by the Shannon-Weiner equitability index using Proc GLM in SAS.
2.4. Results
2.4.1. Canopy Openness
Closed canopy plots had the highest stand density measured by basal area (mean
32 m2/ha) (p < 0.001), and mean basal area in natural gaps (24 m2/ha) was greater than
mean basal area in harvest gaps (13 m2/ha) (p < 0.001). Some natural gaps also had
basal area values equivalent to those of closed canopy transects as well as those of
harvest gaps (Figure 2.2a). The largest harvest gaps had the lowest basal area, and the
relationship between gap size and basal area was weak but significant (r2 = 0.17, p
<0.03). This was true for natural gaps as well where larger gaps had lower overstory
stand density (r2 = 0.47, p < 0.001). The relationship between closed canopy basal area
and gap size could not be tested because no gap size exists.

49
Using MRPP, canopy gap fraction measured by DIFN values was highest in
harvest gaps (0.57) indicating a more open canopy and mean DIFN was lowest under the
closed canopy (0.30) indicating a heavy upper canopy (p < 0.01). Mean DIFN for natural
gaps was 0.34. Although DIFN values increased with increasing gap size (Figure 2.2b),
the relationship between canopy openness and gap size was not significant for harvest
gaps (r2 = 0.03, p < 0.33) and natural gaps (r2 =0.08, p < 0.21).

50 a.)
b.)
Figure 2.2: Relation between canopy openness measured by (a) basal area and (b)
canopy gap fraction (DIFN) and gap size for all harvest gaps, natural gaps, and closed
canopy conditions.
Gap Size (m2)
0 500 1000 1500 2000 2500
Bas
al A
rea
m2 /
ha
0
10
20
30
40
50
Harvest GapNatural Gapccsize vs ccba Predicted Basal Area
Harvest Gap
Natural Gap
Gap S ize (m 2)
0 500 1000 1500 2000 2500
Mea
n D
IFN
0 .0
0.2
0.4
0.6
0.8
1.0
Harvest GapNatural GapClosed Canopy

51 2.4.2. Vegetation Differences Among Gap Conditions
2.4.2.1. Plant Species Cover
Total mean plant cover was 83% higher in both harvest gaps (34.8% mean cover
per gap) and natural gaps (25.5% mean cover per gap) combined than under the closed
canopy (10.8% mean cover per transect) (p < 0.001), and 14% higher in harvest gaps than
in natural gaps (p < 0.048). Total mean plant cover in natural gaps was 63% higher than
Figure 2.3: Mean total plant cover of all species for all natural gaps, harvest gaps, and
closed canopy conditions by gap area.
under the closed canopy. The species most abundant in harvest gaps included (in order of
abundance): A. balsamea, A. rubrum, Aralia nudicaulis L., T. canadensis, and Rubus
occidentalis L. (Table 2.1). Species most abundant in natural gaps included A. balsamea,
T. canadensis, Fraxinus americana L., A. nudicaulis and Osmunda claytoniana L. The
Gap Size (m2)
0 500 1000 1500 2000 2500
Mea
n %
Cov
er
0
20
40
60
80
100
Harvest GapNatural GapClosed Canopy

52 Table 2.1. Mean cover for the 10 most abundant plant species in harvest gaps, natural
gaps, and closed canopy conditions.
Plant Species Harvest gap (%) Natural gap (%) Closed Canopy (%) Abies balsamea 8.54 10.25 5.95 Acer rubrum 8.54 0.28 0.11* Acer saccharum -- -- 0.18 Aralia nudicaulis 3.24 1.43 0.17 Betula papyrifera 0.78 0.01* 0.01* Fraxinus americana 0.06* 1.86 0.22 Gymnocarpium dryopteris -- -- 0.13 Impatiens capensis -- 0.51 -- Osmunda claytoniana -- 0.45 0.27 Picea rubens -- 0.26 -- Pinus strobus -- -- 0.35 Polystichum acrostichoides -- -- 0.47 Populus tremuloides 0.99 0.03* 0.09* Pteridium aquilinum 0.86 0.01* 0.01* Rubus idaeus 0.66 0.01* 0.01* Rubus occidentalis 1.26 0.01* 0.01* Thuja occidentalis -- -- 0.16 Toxicodendron radicans -- 0.47 -- Trientalis borealis 0.54 -- -- Tsuga canadensis 2.20 6.64 1.71 “—“ indicates that the species is not present “*” indicates that the species is not among the10 most abundant

53 species most abundant under the closed canopy included A. balsamea, T. canadensis,
Polystichum acrostichoides (Michx.) Schott, P. strobus, and O. claytoniana.
Because gap size was confounded with gap origin, the relationship between
species abundance and gap size between harvest gaps and natural gaps were analyzed
separately. Although plant cover in gaps tends to increase with increasing gap size
(Figure 2.3), no relationship existed between plant cover and gap size for both harvest
gaps (r2 = 0.02, p = 0.38) and natural gaps (r2 = 0.01, p = 0.90). Furthermore, when we
restrict this analysis for harvest gaps and natural gaps of the same size range (~100 –
500m2), gap size was still not correlated to plant cover (r2 = 0.08, p < 0.14),
but there were significant differences in plant cover between natural gaps and harvest
gaps (p < 0.001) within this gap range. Closed canopy transects could not be analyzed
because gap size was zero for all conditions.
Overall, canopy openness was not an important variable in predicting plant
abundance. Cover in harvest gaps increased with increasing canopy openness (as
measured by canopy gap fraction), but the relationship was weak (r2 = 0.14, p = 0.02).
No relationship was found between plant cover and canopy openness measured by
canopy gap fraction in natural gaps (r2 = 0.03, p = 0.50) and closed canopy transects (r2 =
0.001, p = 0.88). Cover decreased with increasing stand density measured by basal area
for all harvest gaps, natural gaps, and closed canopy, but this relationship was only
significant for natural gaps (Harvest gaps r2 = 0.01, p = 0.61, natural gaps r2 = 0.05, p =
0.02, and closed canopy r2 = 0.14, p = 0.11 closed canopy,).

54 Table 2.2: Mean percent cover per gap of different plant types for harvest gaps, natural
gaps, and closed canopy conditions. The “*” indicates a significant difference (p < 0.05)
among the three gap origins.
Plant Type Harvest Gaps Natural Gaps Closed Canopy
Conifers 1.88 4.49* 1.72
Hardwoods 2.07* 0.82 0.17
Shrubs 0.40* 0.22 0.04
Herbs 0.52* 0.68 0.10
Ferns 0.22 0.33 0.24
Grasses 0.03 0.32 0.00
Sedges 0.06 0.08 0.01
Rushes 0.01 0.00 0.00
Mosses 0.44 3.57* 1.64
Lichens 0.06 0.29* 0.10

55
Using the MRPP test, herbaceous species (p < 0.001), hardwood trees (p < 0.001),
and shrubs (p < 0.001) were more abundant in harvest gaps than in natural gaps and
under the closed canopy (Table 2.2). Coniferous trees had the highest cover in natural
gaps (p < 0.01), and all herbaceous, hardwood, coniferous, and shrub species were least
abundant under the closed canopy. However, there was no difference in fern abundance
among harvest gaps, natural gaps, and closed canopy (p < 0.42).
Other vascular species not identified to the species, but included in the overall
percent cover estimation include: moss, lichens, grasses, sedges, and rushes. Natural
gaps had the greatest average abundance of moss (p < 0.01) and lichens (p < 0.00) (Table
2.2). Harvest gaps had the least abundance of moss species, and closed canopy transects
had the least abundance of lichen species. No differences occurred in mean cover of
grasses, sedges, and rushes among all gaps and closed canopy (p < 0.05).
2.4.2.2. Species Diversity Among Gaps
Comparison of the regression models for the species area curves for harvest gaps,
natural gaps, and closed canopy conditions indicated that the full model (i.e., accounting
for each gap origin separately) provided the best model (p < 0.001). The full model was
better than 1) pooling data from all three gap origins, 2) pooling both harvest and natural
gaps versus closed canopy conditions, and 3) pooling natural gap and closed canopy
conditions versus harvest gap. Since the full model best described the relation between
species richness and sample plot area, we concluded that species richness differed
significantly among gap origins. Therefore, species richness in harvest gaps > natural
gaps > under a closed canopy (Figure 2.4).

56
Figure 2.4: Species richness with increasing sample plot area for harvest gaps, natural
gaps, and closed canopy conditions. Richness was calculated using all possible
combinations of random subsampling of sample plots for each condition.
Plant evenness measured by the slope of the dominance diversity curves was
different among harvest gaps, natural gaps, and closed canopy conditions (p < 0.001).
Harvest gaps had the shallowest mean slope (a = 57), and the closed canopy had the
steepest mean slope (a = 23). The natural gap mean slope was somewhat greater to
closed canopy conditions (a=37) (Figure 2.5). Both gaps had a higher slope value than
under the closed canopy (p < 0.02), and harvest gaps had a higher slope value than
natural gaps (p <0.003). These results indicate 1) that neither gaps nor closed canopy
conditions had an even distribution of plant species (i.e., a=0), 2) that the cover was less
N um ber o f p lo ts
0 10 20 30 40 50
Num
ber o
f spe
cies
0
10
20
30
40
50
60
70
80
H arvest G apN atura l G apC losed C anopy

57
Figure 2.5: Mean dominance diversity curves truncated for the 10 most abundant plant
species for harvest gaps, natural gaps, and under the closed canopy. Slope of the curves
based on the model y= e –ax, were used as an indicator of plant evenness among gaps and
closed canopy conditions.
Plant Species Rank
0 2 4 6 8 10 12
Pla
nt P
ropo
rtion
al A
bund
ance
0.0
0.1
0.2
0.3
0.4
0.5
0.6
Harvest GapsNatural GapsClosed Canopy

58 evenly distributed among species under the closed canopy than in the gaps, and 3) that
the larger harvest gaps had greater evenness than the natural gaps. However, no relation
was found between the slope of the curves and gap area for both harvest gaps (r2 = 0.01, p
< 0.63) and natural gaps (r2 = 0.05, p < 0.30), nor was the slope of the curves correlated
with canopy openness as measured by overstory basal area or canopy gap fraction for all
harvest gaps, natural gas, and closed canopy conditions.
As stated before, the Shannon diversity indices (both diversity and evenness) are
sensitive to species richness. Although sample area in this study was proportional to gap
size, we may still evaluate these indices of diversity (albeit with caution), because we
found that species richness (as determined by the species area curves) was independent of
sample area (Figure 2.4). Nonetheless, to eliminate the large variation in sample area, we
restricted harvest gaps and natural gaps of the same size range (~100-500m2), and we
found that there was no difference in Shannon-Weiner diversity index between natural
gaps and harvest gaps (p < 0.15).
Differences in Shannon diversity for all gaps and closed canopy transects were
similar to the results for species richness. Using ANOVA with linear contrasts, the
Shannon-Weiner index was higher in gaps than under closed canopy conditions (p =
0.0087), and it was higher in harvest gaps than in natural gaps (p = 0.0027). Shannon-
Weiner diversity was not correlated with canopy openness measured by canopy gap
fraction in harvest gaps (r2 = 0.01, p = 0.31), natural gaps (r2 = 0.07, p = 0.24), and closed
canopy (r2 = 0.17, p = 0.06). Similarly, there was no relation between Shannon diversity
and basal area for harvest gaps (r2 = 0.01, p = 0.67), natural gaps (r2 = 0.12, p = 0.12) and

59 a.)
b.)
Figure 2.6: Relation between Shannon-Weiner index (a) and Shannon Equitability index
(b) by gap size for harvest gaps, natural gaps, and closed canopy conditions.
Gap Size (m2)
0 500 1000 1500 2000 2500
Sha
nnon
Wei
ner D
iver
sity
Inde
x
0
1
2
3
4
Harvest GapNatural GapClosed Canopy
Gap size (m2)
0 500 1000 1500 2000 2500
Sha
nnon
-Wei
ner E
venn
ess
inde
x
0.0
0.1
0.2
0.3
0.4
0.5
0.6
0.7
0.8
Harvest gapNatural gapClosed canopy

60 closed canopy transects (r2 = 0.01, p = 0.82). The Shannon-Weiner index was not
correlated to gap size for both harvest gaps (r2 = 0.03, p < 0.228) and natural gaps (r2 =
0.01, p < 0.71) (Figure 2.6a). Similarly, when harvest gaps and natural gaps were
isolated to the same size range, the Shannon diversity index showed no correlation to gap
size (r2 = 0.08, p < 0.14).
The closed canopy transects had the highest Shannon-Weiner evenness values
compared to harvest and natural gaps as well as a large range of evenness values. As a
result of the wide range of evenness values among the three conditions, there was no
statistical difference in the Shannon evenness index among harvest gaps, natural gaps,
and under the closed canopy (p < 0.74). When harvest gaps and natural gaps of the same
size range are isolated, there was no difference in Shannon evenness index (p < 0.36)
between harvest gaps, and natural gaps. Furthermore, no relationship between Shannon
Evenness and gap size was found for harvest gaps (r2 = 0.01, p < 0.71) and natural gaps
(r2 = 0.01, p < 0.73) (Figure 2.6b).
2.4.2.3. Tree Regeneration and Stand Composition
The average number of regenerating trees in each height class was independent of
gap origin or closed canopy (p < 0.15). The greatest number of stems in all gap and
closed canopy conditions were growing in the seedling (i.e., < 0.5 m) height class (Figure
2.7). Natural gaps had the greatest number of stems growing in this height class (57,961
stems / ha) and closed canopy transects had the least number of stems growing in this
height class (28,967 stems / ha). Tree abundance decreased with increasing stem height,
and the average number of stems > 0.5 m tall was less than 10,000 stems / ha.

61 Acer rubrum and A. balsamea had the greatest number of regenerating trees in the
< 0.5 m height class for both gaps and closed canopy conditions (Table 2.3)
Figure 2.7: Tree regeneration by height class for all harvest gaps, natural gaps, and
closed canopy conditions for all height classes.
B. papyrifera, P. strobus, and T. canadensis were also the most abundant species growing
< 0.5 m height class for harvest gaps. These species were also abundant under natural
conditions (i.e., natural gaps and closed canopy) with the exception B. papyrifera; instead
of B. papyrifera, the natural conditions are regenerating Ostrya virginiana (Mill.)K. Koch
(Table 2.3).
In natural gaps and closed canopy conditions, A. balsamea was the most abundant
tree in the > 0.5 m to 2.0 m height class, whereas in harvest gaps, A. rubrum was most
abundant tree species in this height class. After A. rubrum, the most abundant stems in
0
10
20
30
40
50
60
70
< 0.5 m > 0.5 - 2.0 m > 2.0 m
Height Class
1000
Ste
ms
/ ha
Harvest GapNatural GapClosed Canopy

Table 2.3: Density of tree regeneration by species and height class for all harvest gaps, natural gaps, and closed canopy conditions.
HG = harvest gaps, NG = natural gaps, and CC = closed canopy transects.
Tree Stems <0.5 m tall Tree Stems > 0.5 - 2.0 m tall Tree Stems > 2.0 m tall 1000 stems / ha 1000 stems / ha 1000 stems / ha
Species HG NG CC HG NG CC HG NG CC Abies balsamea 7.44 17.62 6.41 0.64 1.18 0.55 0.37 0.42 0.57 Acer rubrum 25.83 18.22 7.83 1.55 0.82 0.31 1.27 0.06 0.03 Acer saccharum ** 0.57 1.85 ** ** 0.05 ** 0.03 0.11 Betula allegheniensis ** ** ** 0.03 0.01 ** ** ** ** Betula papyrifera 5.12 ** 0.33 0.20 ** 0.00 0.06 ** ** Fagus grandifolia ** 0.41 ** ** 0.01 ** 0.02 0.03 ** Fraxinus americana ** 1.56 ** ** 0.07 0.02 ** 0.11 ** Fraxinus species 1.52 ** 4.40 0.10 ** ** ** ** ** Ostrya virginiana ** 2.11 0.84 ** ** ** ** 0.03 ** Picea rubens 0.59 ** ** 0.05 ** ** 0.05 ** ** Pinus strobus 4.53 11.46 2.36 0.15 0.39 0.10 0.02 0.02 0.05 Populus grandidentata ** ** 0.27 0.06 0.02 0.01 0.09 ** 0.03 Populus tremuloides 0.66 1.33 1.55 0.16 0.13 0.04 0.25 ** ** Prunus pennsylvanica 0.53 ** ** ** 0.02 ** ** 0.11 ** Quercus rubra 0.70 0.53 ** ** ** ** ** ** ** Thuja occidentalis ** ** ** ** ** 0.01 0.03 0.03 0.14 Tsuga canadensis 3.02 8.55 2.36 0.16 0.71 0.15 0.09 0.45 0.11
61

63
harvest gaps were A. balsamea, B. papyrifera, P. tremuloides, and T. canadensis. After
A. balsamea, natural gaps were regenerating (in order of abundance) T. canadensis, P.
strobus, and P. tremuloides. Under closed canopy conditions, only eight tree species were
found in the > 0.5 m to 2.0 m height class, and the most abundant species, after A.
balsamea, included A. rubrum, T. canadensis, P. strobus, and Acer saccharum L.
2.4.2.4. Plant Community Composition
One hundred ninety-five plant species were identified among all harvest gaps,
natural gaps, and closed canopy conditions. Among these species, 82 were rare (i.e.,
occurring only once or twice). All species were categorized based on their life history
characteristics in Maine such as habitat, shade tolerance, reproductive habits, and
successional status (USDA, NRCS 2002). Of the 195 species identified, the majority
(55) are classified as shade intolerant, and considered to be early successional species.
Forty-two of the species are classified as intermediate in shade tolerance and found in
both highly disturbed areas as well as mature forest, and 37 of the 195 species were
classified as tolerant, late successional species. Additionally, 10 were obligate wetland
indicator species, and 17 of these species were classified as exotic either nationally or in
Maine (USDA, NRCS 2002; Haines and Vining 1998). Finally, 34 of these species did
not have enough research available to be classified into categories or were identified only
to the genus.
More than half (112 species) of the 195 species identified were found only in
harvest gaps. Among the remaining species, 33 were common to all harvest gaps natural
gaps, and closed canopy conditions, 16 were found only in natural gaps, and 5 were
found only under the closed canopy. Finally, two species, Maianthemum racemosum (L.)

64
Link and Pyrola chlorantha Sw., were exclusive only to natural conditions (i.e., natural
gaps and closed canopy).
There were 140 species that could be considered ‘gap specialists’ (i.e., only occur
in gap environments). The two most important gap specialists were Rubus species.
Among the 10 most important gap specialists, 8 species were classed as ruderal or early
successional species, and four of these were Rubus species. Two exceptions, F.
grandifolia (i.e. the fourth most important) and Onoclea sensibilis L., were shade
tolerant, mid-to-late successional species.
Harvest and natural gaps of similar sizes (from 100 m2 to 550 m2) were examined
to determine whether gap origin was correlated with species composition by eliminating
gap size as a variable. One hundred twenty-one species were identified in natural gaps
and harvest gaps in this size range. Among these species, 49% were found only in
harvest gaps, 35% were found in both harvest and natural gaps, and 26% of the species
are found only in natural gaps.
Most plant species that were found exclusively in harvest gaps were classed as
early successional or shade intolerant species (35%). Eighteen percent of these species
were exclusive to harvest gaps and classified as intermediate in shade tolerance, and 11%
are considered shade tolerant or late successional species. Fourteen percent of these
species were exotics (i.e., introduced to Maine). The greatest numbers of species (31%)
exclusive to natural gaps were intermediate in tolerance (USDA, NRCS 2002; Burns and
Honkala 1990). Thirteen percent of the natural gap species were shade intolerant, early
successional, and thirteen percent were shade tolerant, late successional species. Twenty-

Table 2.4: Importance index, mean frequency, and mean cover for the ten most important species found in harvest gaps, natural gaps
and under closed canopy conditions. Importance index for a species was calculated by multiplying the mean frequency of a species by
its mean percent cover (i.e., cover (%) in table) in a gap. The symbol “**“ indicates that the species is not important.
Harvest Gaps Natural Gaps Closed Canopy Species Cover (%) Freq (%) Import Cover (%) Freq (%) Import Cover (%) Freq (%) Import Abies balsamea 8.42 77 648.17 10.25 91 932.78 5.95 73 434.43 Acer rubrum 8.93 95 848.35 0.28 80 22.06 0.11 65 6.99 Acer saccharum 0.13 2 0.26** 0.22 12 2.64** 0.18 20 3.50 Aralia nudicaulis 3.05 35 106.62 1.43 41 58.61 0.17 10 1.65 Betula papyrifera 0.75 46 34.5** 0.01 7 0.07** 0.01 9 0.09** Fraxinus americana 0.06 8 0.48** 1.86 30 55.78 0.22 8 1.73 Impatiens capensis 0.00 0 0** 0.51 9 4.62 0.00 0 0** Maianthemum canadense 0.44 65 28.43 0.23 60 14.00 0.08 30 2.28 Osmunda claytoniana 0.47 5 2.35** 0.45 3 1.35** 0.27 5 1.34 Pinus strobus 0.51 58 29.77 0.22 68 14.73 0.35 37 12.95 Polystichum acrostichoides 0.02 1 0.02** 0.11 10 1.10** 0.47 14 6.53 Populus tremuloides 0.97 28 27.27 0.03 14 0.42** 0.09 14 1.26** Rubus idaeus 0.66 27 17.88 0.00 0 0** 0.00 0 0** Toxicodendron radicans 0.14 3 0.42** 0.47 10 4.67 0.01 2 0.02** Trientalis borealis 0.56 57 31.80 0.21 48 10.24 0.06 17 1.02** Tsuga canadensis 2.20 48 105.56 6.64 67 445.04 1.71 52 89.13
64

65
five percent (4) of the species exclusive to natural gaps were wetland obligate species.
Of the five species exclusive to closed canopy transects, two species of the five were
wetland, obligate species, and the remaining three species were shade intolerant,
intermediate, and shade tolerant (USDA, NRCS 2002; Burns and Honkala 1990).
Abies balsamea was the most important species for all harvest gaps, natural gaps,
and closed canopy conditions. Five other species, A. rubrum, A. nudicaulis,
Maianthemum canadense Desf., P. strobus, and T. canadensis, were important across all
three conditions. Natural gaps and closed canopy conditions shared one other species
that was not important in harvest gaps, F. Americana. Harvest gaps and natural gaps
shared one important species, Trientalis borealis Raf., a common forest understory herb,
which was not important under the closed canopy.
In harvest gaps, both shade intolerant, ruderal species comprised the remaining
most important species. These species were (in order of importance): A. rubrum, B.
papyrifera, P. tremuloides, and Rubus idaeus L. (USDA, NRCS 2002; Burns and
Honkala 1990). In natural gaps, the remaining of the 10 most important species included
F. americana, an intermediate- to shade tolerant species, Impatiens capensis Meerb, a
species characteristic of moist conditions, and Toxicodendron radicans (L.) Kuntze, a
robust species that grows under a variety of environmental conditions (USDA NRCS
2002). Under the closed canopy, the remaining important species were adapted to more
shaded conditions with intermediate- to shade-tolerant. They included: (in order of
importance): P. acrostichoides, A. saccharum, F. americana, and O. claytoniana. O.
claytoniana and P. acrostichoides, are common forest understory ferns, and A.
saccharum is a shade tolerant tree (Burns and Honkala 1990).

66
a.)
b.)
Figure 2.8: DCA (Detrended Correspondence Analysis) on the presence and absence of
all species in all gaps and transects for harvest gaps, natural gaps, and closed canopy
conditions. Plots close in ordination space are more similar in composition. Figures a
and b represent two different viewpoints (i.e., axes in ordination space) of plot
orientation.
Axis 1
Axi
s 3
Axis 1
Axi
s 2
Harvest gaps
Natural Gaps Closed Canopy

67
Finally, because natural gaps and closed plots are the conditions for which we
evaluate the success of emulating natural gaps, we performed a DCA on the presence or
absence of plant species to examine the compositional similarity between harvest gaps
and natural conditions. Rare species were down-weighted because 87 of the 112 species
in harvest gaps occurred only once or twice, and the axes were rescaled. The large spread
of the plots in ordination space suggested a high range of variation in species composition
for all harvest gaps, natural gaps, and closed canopy conditions (Figure 2.8). More
importantly, the distinct separation between harvest gaps and natural conditions around
the second and third axes suggests that natural gaps and closed canopy transects were
more similar in composition to each other, and that harvest gaps were less similar in
composition than natural conditions.
2.4.3. Vegetation Differences Within Harvest Gaps
2.4.3.1. Abundance and Diversity
The objective of this analysis was to assess whether there were any patterns of
vegetation abundance and diversity in the north-south transects within the harvest gaps.
Because the number of sample plots or distance sampled within gaps was proportional to
gap size, we conducted this analysis in stages, starting first with the largest gaps and then
systematically examining within gap patterns for progressively smaller gaps. The
assumption with this approach was that any patterns of within gap vegetation, abundance,
and diversity would likely be most apparent in the largest gaps.
Due to the nature of this study, all gaps analyzed for this analysis were harvest
gaps since these were the largest gaps. The largest gaps with at least 4 replicates ranged
in size form 1,170 to 2,106 m2 and contained ± 30 m transect length. The next largest

68
gaps with sufficient replication (i.e., 10 replicates) ranged in size from 627 to 1,762 m2,
and contained ± 25 m transect length. The smallest gaps examined were 336 to 2,049 m2
in size and had a ± 20 m transect length.
For the largest gaps (± 30m transect length), total mean cover was 49% greater
within 10 m of the center of the gap than at the edge of the gap (p < 0.03), and species
abundance was positively correlated with the location within the gap (r2 = 0.27, p <
0.0001) (Figure 2.9). Furthermore, the north side of the gaps had higher cover than the
south side of the gaps (p < 0.02).
Figure 2.9: Mean cover of all plant species at various distances from the centers of the
four largest harvest gaps (1,170-2,106 m2). Negative distances denote southern plots, and
± 30 m indicate the ends of the transect. A four parameter Gaussian regression model
was used.
Distance from gap center(m)
-30 -20 -10 0 10 20 30
Tota
l % C
over
0
20
40
60
80
100
120
140
Predicted abundanceAbundance per quadrat

69
In the next largest gaps (627 to 1,762 m2), total mean cover was 52% greater in
the center than at the edge of the gap (p < 0.01), but no relationship was found between
species abundance and distance from the gap center (r2 = 0.60, p = 0.92). The smallest
gaps analyzed (336 to 2,049 m2) did not show any differences in abundance (p < 0.06)
between the center of the gap and the edge of the gap, and hence, further analysis of
smaller gaps was terminated. Further, there was no difference in species abundance
between the north side and the south side of the gap for these smaller gaps (p < 0.01).
There were no differences in species richness (p < 0.38), evenness (p < 1.00), and
Shannon-Weiner diversity index (p < 0.57) between the north and the south side of the
largest gaps (1,170 to 2,106 m2). There was also no difference in richness (p < 0.85),
evenness (p < 0.78), or Shannon-Weiner index (p < 1.00) between the center of the gap
and the edge of the gap. Similar results were found for gaps 627 to 1,762 m2 where there
was no difference in cover (p < 0.51), richness (p < 0.41), evenness (p < 0.31), or
Shannon-Weiner index (p < 0.35) between the north and south sides of the gap. Because
there was no relationship between diversity and 1) location within the gap and 2) canopy
openness for the largest gaps, we did not test these variables any further for the next
largest gap size, 627 to 1,762 m2
2.4.3.2. Tree Regeneration
Because we were looking for trends in tree species regeneration by their life
history characteristics (i.e., ruderal or late successional species) relative to their location
within the gap (i.e., gap center versus gap edge), we first restricted this analysis, again, to
the largest gaps (i.e., 1170 - 2106m2). We selected five tree species of various shade
tolerance, A. rubrum, P. tremuloides, P. rubens, T. canadensis, and P. strobus, to

70
determine if tree regeneration was correlated to the location within the gap. Although all
of the selected tree species were abundant and/or more frequent in the southern side of
the gap, there was no significant relationship between tree abundance of individual
species and location within the gap. Furthermore, for the largest harvest gaps, there was
no significant relationship between the numbers of seedlings (< 0.5 m tall), saplings (>
0.5 – 2.0 m tall), and trees (> 2.0 m tall) of all species and their location within the gap.
2.4.3.3. Plant Species Composition
In harvest gaps, the four most important species were A. balsamea, A. rubrum, T.
canadensis, and A. nudicaulis up to 14 m north and 14 m south of the gap center. In the
sample plots up to 18 m north and 14 m south of the gap center, the remaining most
important include (in order of importance) R. occidentalis, Rubus pubescens Raf.,
Pteridium aquilinum (L.) Kuhn ex Decken, P. tremuloides, P. rubens, B. papyrifera,
Corylus cornuta Marsh., Alnus incana (L.) Moench, and P. grandidentata. In natural
gaps, A. balsamea and T. canadensis were the two most important species. I. capensis, T.
radicans (L.) Kuntze, D. intermedia, and O. virginiana K. Koch. were important in
natural gaps, but they were either not important or did not exist in harvest gaps. Overall,
importance values for species in natural gaps were far less than importance values in
harvest gaps. Similarly, in closed canopy transects, A. balsamea and T. canadensis were
the two most important species in all quadrats. Other important species included were O.
claytoniana, P. acrostichoides, F. americana, P. strobus, A. saccharum, C. cornuta,
Gymnocarpium dryopteris (L.) Newman, P. rubens, P. grandidentata, and T.
occidentalis.

71
We selected the three most frequent ruderal, early successional species, P.
tremuloides, R. idaeus, and P. aquilinum (USDA NRCS 2002) within the largest gaps
(1170 -2106 m2) to determine if early successional species were more abundant in the
centers of the largest gaps. Although both P. tremuloides and R. idaeus were more
important on the south side of the gap, and P. aquilinum was more important in the north
side of the gap, the importance of these species was not correlated with their location
within the gap. Because no significant relationships existed, we terminated any further
analysis of species composition and location within the gap for gaps smaller than this size
range.
2.5. Discussion
2.5.1. Plant Abundance
Results from this study indicate that an expanding gap shelterwood harvest
creating gaps openings from 0.10 to 0.20 ha in size increased the mean cover of plants by
69% (i.e., absolute cover including all species) compared to closed canopy conditions.
Physical changes caused by gap harvesting may have substantially influenced gap
regeneration by altering the microenvironment in the gap, and as a result of those
physical changes, plant resources (light, soil moisture, and nutrients) become more
abundant for the growth of plants within the gap. Although plant cover tended to
increase with increasing gap size, the greater species abundance in harvest gaps was not
correlated with gap size or overstory density within the gap, and only weakly correlated
with canopy openness as measured by canopy gap fraction. Large permanent reserve
trees occupying the upper canopy, and basal sprouting of A. rubrum, comprise a large
amount of space both vertically and horizontally, and are likely to influence the canopy

72
gap fraction measurements creating a weak relationship between plant abundance and
canopy openness. Nonetheless, a biological relationship is apparent where the highest
DIFN occurred in the largest harvest gaps indicating a large amount of light reaching the
forest floor.
A study of harvest gaps in the Southern Appalachians indicated that plant biomass
production was doubled two seasons after harvest compared to preharvest plant
productivity (Philips and Shure 1990). Furthermore, a study in northeastern forests
suggest that the spatial location in which a species colonizes in a gap may be more
important than overall increase in light (Poulson and Pratt 1989). The size, shape,
abundance, and distribution of standing dead and live trees, downed woody material and
regenerating vegetation can influence humidity, light intensity, air temperature, and
nutrient availability (Lundquist and Beatty 2002). We found greater plant abundance in
the center of large (1,170 – 2,106 m2 area) harvest gaps than on the north and south edges
of the gaps. The presence of 39 shade intolerant or light-demanding species out of 141
species found only in the harvest gaps clearly suggests an overall increase in light as a
resource. Therefore, the greater species abundance in harvest gaps is more likely related
to changes in light, soil disturbance, and other microenvironmental factors.
There was little overlap between natural gap area and harvest gap area, but natural
gaps had only 19% difference in mean plant cover than harvest gaps, and 62% more
cover than closed canopy conditions. This result suggests that canopy openings alone,
regardless of gap size, provide an ample amount of light to greatly influence plant
growth, particularly since mean plant abundance was not related to gap size. Mean plant
cover was also not related to canopy openness, but natural gaps had higher mean DIFN

73
values than under the closed canopy suggesting, again, a biological significance between
light and plant growth. Because natural gap size is small, lateral extension of the upper
canopy can greatly influence the amount of light reaching the forest floor reducing plant
abundance, but lateral extension does not seem to be influencing plant abundance for
natural gaps in this study. Furthermore, natural gaps are rarely limited to a single event
where the death of a single canopy tree in one year, for example, can create the blow
down of several surrounding trees in the following years. This condition defines an
expanding gap (Runkle 1982). Hence, the continuous opening of the canopy by multiple
events may have allowed plants to sustain high growth rates.
Other studies on natural gap regeneration report an increase in species abundance
early in succession that gradually declines with the closing of surrounding overstory
canopy. Treefall gaps in an eastern hemlock forest demonstrate a definitive trend in
succession for the most common understory species up to five years after gap formation,
but total understory cover returned to pre-gap levels 11-14 years following gap formation
(Rankin and Tramer 2002). In a mature oak forest, herbaceous communities in natural
gaps increased in abundance only if the gap opening was greater than the predisturbance
understory assemblage (Ehrenfeld 1980). Some natural gaps in this study may still be in
early stages of succession where many were aged near 1995. These younger natural gaps
may be creating a higher mean of plant abundance where the older natural gaps are less
abundant.
2.5.2. Plant Diversity
Results of the species area curves analysis indicated that species richness in
canopy gaps, both harvest and natural, was higher under closed canopy conditions, and

74
that harvest gaps were more diverse than natural gaps. The differences in the slopes of
the dominance diversity curves indicate that the evenness of the plant diversity was not
equal among all harvest gaps, natural gaps, and closed canopy conditions. Harvest gaps
contained 112 new species that were not present in natural gaps or under the closed
canopy. Although species richness was higher in harvest gaps, 82 of these species
occurred only once or twice, indicating a low frequency and uneven distribution of these
new species.
In contrast, the Shannon-Weiner Equitability index indicated no difference among
plant evenness among harvest gaps, natural gaps, and closed canopy conditions. A wide
range of evenness values were found under closed canopy conditions indicating an even
distribution of abundance values for the small number of species found under relatively
homogenous conditions. Hence, as a result of large evenness values under the closed
canopy and large evenness values in harvest gaps (i.e., indicating a high diversity with an
even distribution), no difference was detected among the three conditions.
The Shannon-Weiner diversity index indicated similar results to species richness
where harvest gaps had the highest diversity. Because larger harvest gaps had more
opportunity to acquire plant species, we would expect higher Shannon diversity values
for harvest gaps with greater sample area. However, several natural gaps with smaller
sample area had very high Shannon diversity indices comparable to values found in
harvest gaps. In addition, our analysis using species area curves revealed that species
richness was higher in harvest gaps, less in natural gaps, and lowest under closed canopy
conditions. Therefore, despite the possible confounding between gap area and the

75
Shannon-Weiner index, our results indicate that the diversity index differences
demonstrated here are supported.
Thus, all diversity indices examined in this study indicated that the creation of
gaps, both harvest and natural, promoted the colonization of new species. High plant
diversity among gaps was due to a combination of both gap size and canopy openness
measured by canopy gap fraction, although these relationships were weak. Several
studies on natural gaps report that species diversity increases with gap size (Busing and
White 1997; Clinton et al. 1994; Phillips and Shure 1990; Runkle 1982), and many
studies have indicated that intermediate size gaps (~300 m2), both harvest and natural,
have not increased diversity in second-growth forests (Beckage et al. 2000; Collins and
Pickett 1988a; Hibbs 1982; Della-Bianca and Beck 1985). Therefore, the greater plant
diversity in gaps is likely due to the change in microenvironment as a result of the
disturbance creating enough light and temperature fluctuations to allow early
successional species to colonize the gap. For example, of the total number of species
found in both harvest gaps and natural gaps of the same size range (100 – 500 m2), half of
these species were present only in harvest gaps, suggesting that gap origin rather than gap
size had a greater influence on plant species composition. Natural gaps had a greater
species diversity than closed canopy transects but less than harvest gaps. This result
suggests that in some natural gaps, the occurrence of a treefall (i.e., rather than the slow
death of canopy trees) also created environmental conditions allowing the colonization of
few new plant species.

76
2.5.3. Plant Composition
Increasing stand structural diversity to promote the full sere of young and old
forest structure is a long-term goal for the expanding-gap treatments in this study.
Enhancing structural diversity suggests creating early successional habitat to allow the
colonization of new plant species. Four growing seasons after harvest, the forest
structure is such that many early successional species have been introduced in the harvest
gaps that were not present under the closed canopy, therefore increasing the overall plant
diversity of the harvested research areas. The differences in age between harvest gaps
and natural gaps likely account for the lower plant diversity in natural gaps. The majority
of the natural gaps were five to eleven years old, and although the natural canopy opening
allowed significant growth for plants present in the understory, lateral extension of the
upper canopy may have prohibited the colonization of a large number of new species in
the natural gaps.
Change in species composition as a result of increased diversity, however, may
have significant implications on gap regeneration, especially potential competition with
desired tree species and/or wildlife habitat. Although many studies indicate high plant
diversity as a result of the influx of early successional species in forest gaps, diversity and
abundance often decline as the these gaps get older. The decline is mostly attributed to
extensive lateral growth by canopy edge trees reducing available sunlight, and extensive
tree regeneration within the harvested gap outcompeting the opportunistic herbs (Philips
and Shure 1990; Collins and Pickett 1998b). Runkle (1982) found that in old-growth
mesic forests, edge trees responded to canopy disturbance with lateral extension rates of
8.3 cm / year for A. saccharum and 7.0 cm/ year for T. canadensis. Gap edge trees in a

77
hemlock and hardwood stand had lateral extension rates from 14.03 to 6.10 cm/year for
the following species (in descending order of extension rates) Q. rubra, B. papyrifera, B.
allegheniensis, T. canadensis, A. rubrum, and P. strobus (Hibbs 1982).
2.5.3.1. Understory Composition
Many studies have shown that gap harvesting has reduced or eliminated the
original forest understory. For example, a shelterwood harvest in an old-growth forest of
Ontario eliminated 14 species present in the understory and introduced 10 species not
present before harvest; four of these species were early successional and/or invasive
species (Quinby 2000). In an oak-pine forest of Maine, common understory forest herbs,
M. canadense, Gaultheria procumbens L., and Mitchella repens L., present before gap
harvesting decreased in abundance significantly after gap creation, but increased in
abundance in control areas. Furthermore, Clintonia borealis (Ait.) Raf. was recorded
only in the control areas that were 60-80 years old and was absent from neighboring
harvested gaps (Schumann et al. 2003). C. borealis is associated with late stages of forest
succession (Pitelka et al. 1985).
In this study, the plant composition obtained under natural conditions was used as
a comparison to evaluate the success of an expanding-gap harvest on emulating natural
conditions. Although the harvest introduced many new species, common forest
understory herbs with a higher shade tolerance such as M. canadense, G. procumbens, M.
repens, Cornus canadensis L., T. borealis, and C. borealis were more important in
harvest gaps than natural gaps and closed canopy, and M. canadense and A. nudicaulis
were two of the most important species in harvest gaps. Furthermore, G. procumbens
was absent under the closed canopy and C. borealis was absent in both natural gaps and

78
closed canopy. A study of harvest gaps in an eastern hemlock forest by Rankin and
Tamer (2002) demonstrated similar results. Of eight common forest understory species
examined, all responded to harvest gap formation with a significant positive response
except Medeola virginiana L., which reached its peak cover under the closed canopy.
Hence, the expanding-gap harvest not only maintained the populations of species
common in the forest understory, it also provided an environment for these species to
become more abundant.
2.5.3.2. Gap Specialists
Gap specialists are species that are exclusive to gap environments. Some studies
suggest that the predisturbance communities and/or the autecology of the predisturbance
species have a greater influence on gap herb succession than the recruitment of
opportunistic species (Hughes and Fahey 1991; Collins and Pickett 1988a). In this study,
141 species out of the 195 identified species are gap specialists including both harvest
and natural gaps suggesting that the creation of early successional habitat had a greater
influence on gap regeneration than the predisturbance plant communities.
Rubus idaeus, a gap specialist, was one of the most important species in harvest
gaps, and of the four Rubus species identified, only R. pubescens was present in natural
gaps. The dearth of Rubus species in natural gaps in this study is similar to natural
treefall gaps in New Hampshire, where the recruitment of Rubus species was relatively
rare (Battles and Fahey 2000). Although uncommon in natural gaps, several studies have
indicated that Rubus species are the most important shrub regenerating in harvest gaps.
In harvested gaps of an oak-pine forest of Maine, R. allegheniensis and R. idaeus were
both abundant in harvested gaps five and 10 years after harvest. R. allegheniensis began

79
to decline 10 years after harvest, but R. idaeus continued to increase in abundance 10
years after harvest. Furthermore, R. idaeus abundance was significantly different
between harvested gaps and controls (Schumann et al. 2003). In harvested gaps of New
Hampshire, R. idaeus was one of the most common shrubs after overstory removal and
remained abundant three years after harvest, whereas other shrubs showed a decline in
abundance. Furthermore, R. idaeus was not present in the intact forest (or unharvested
control) or in the predisturbance communities (Hughes and Fahey 1991). Several factors
influence Rubus recruitment and vegetation succession in harvested gaps. Highly viable,
buried seeds are the most prominent form of Rubus recruitment, and the level of soil
disturbance also influences their presence. Not only is it the most abundant species
regenerating after harvest, but also its abundance continues to increase throughout the
stages of early succession, often taking over a gap area. Many studies indicate that Rubus
spp. can stop the early succession of trees if management actions are not taken. For
example, a study on Rubus and spruce competition in Maine indicates that Rubus biomass
production was positively correlated with an increase in nutrients, light, moisture, and
growing space. Further, spruce seedling biomass production decreased with interspecific
competition mostly with Rubus species (Lautenschlager 1999).
2.5.4. Tree Regeneration
2.5.4.1. Tree Abundance
The greatest numbers of stems regenerating in all gaps and closed canopy are
seedlings (i.e., < 0.5 m tall), but natural gaps were regenerating more seedlings than
harvest gaps. Natural gap sizes range from 100 to 500m2 indicating that this range of gap
sizes is large enough to generate a new cohort. Harvest gap sizes in this study ranged

80
from 100 to 2,100m2, and have introduced many new species that may be competing for
resources with establishing tree seedlings. The differences in gap environment caused by
the different disturbance regimes (i.e., harvesting vs. treefall) that allowed the
introduction of ruderal species (i.e., the abundance of Rubus species in harvest gaps) may
account for the deficit of seedling regeneration in harvest gaps. Some studies have
demonstrated that regenerating seedling densities are low with dense understories in gaps
(Ehrenfeld 1980; Huenneke 1983) because of light attenuation by the dense shrub
understory (Beckage et al.2000). Nonetheless, harvest gaps are regenerating more
seedlings than the closed canopy, and sapling abundance is greatest in harvest gaps
indicating that the harvest is creating a new cohort within these stands.
Differences in tree regeneration among harvest gaps, natural gaps, and closed
canopy is likely due to several factors. First, trees within the same height class among
gaps and closed canopy may contain different age classes. For example, seedlings (i.e.
trees < 0.5m tall) in the closed canopy could be significantly older than those in harvest
gaps since their existence in this height class could be caused by the suppression of the
heavy upper canopy. Second, between harvest gaps and natural gaps, gap age could be a
significant source of variation between seedling and sapling abundance where natural
gaps were between one to seven years older than harvest gaps. A study of tree
regeneration in harvest gaps in a hemlock-hardwood forest found tree biomass production
was significantly greater in younger gaps where gap ages ranged from 1-55 years
(Webster and Lorimer 2002). Natural gaps were smaller than harvest gaps, and the
lateral extension of the gap edge trees may have suppressed the growth release of trees in
the understory reducing the number of stems in higher height classes. Further, seedlings

81
in harvest gaps may have advanced to the sapling stage faster. Third, differential growth
of species by gap capture as well as shade tolerance would account for differences in
species abundance in each height class. Abundant saplings in harvest gaps, A. rubrum, P.
tremuloides, B. papyrifera, P. strobus, and Q. rubra may have advanced into the sapling
height class faster because of available light and space more limited in natural gaps.
2.5.4.2. Tree Species Composition
The tree species, particularly seedlings, in gaps most abundantly regenerating
were A. rubrum and A. balsamea. The abundance of these two species is likely a result of
several factors. First, some of the harvest gaps were established on previous treefall gaps
where natural gap regeneration was already established before harvest, thus confounding
interpretations about regeneration in the harvest gaps. Second, advance regeneration,
comprised mostly of A. balsamea, in the harvest gaps also would contribute to the
abundance of this regenerating tree. Third, both A. balsamea and is a prolific seeder, and
A. balsamea and A. rubrum seedlings have few germination requirements allowing their
germination with very little light and some moisture. Finally, A. rubrum also is a
vigorous stump sprouter (Burns and Honkala 1990) producing several stems per stump
accounting for its greater stem abundance in gaps.
T. canadensis, A. balsamea, A. rubrum, P. strobus, and P. rubens, and T.
occidentalis (i.e., only under the closed canopy) were the most dominant trees in the
overstory as measured by basal area for all gaps and closed canopy. The abundance of
these species found in all height class in all harvest gaps, natural gaps, and closed canopy
illustrate the importance of the upper canopy in providing a seed source for natural

82
regeneration, as well as dominating regeneration that will become the composition of the
future canopy. Tree species most abundant in natural gaps and closed canopy for all
height classes included more shade to mid-tolerant species such as A. balsamea, T.
canadensis, A. rubrum, and P. strobus. However, in all height classes, harvest gaps were
regenerating in great numbers (i.e., excluding A. rubrum, A. balsamea, and T.
canadensis) two early successional species, P. tremuloides and B. papyrifera, that are
scarce in natural gaps and closed canopy. The difference in tree species regeneration
between natural gaps and closed canopy are the abundance of P. tremuloides in natural
gaps and A. saccharum in closed canopy.
Seymour and Hunter (1992) suggest that clearcut and high-grade harvesting have
reduced economically important tree species such as P. strobus, P. rubens, and B.
alleghaniensis. This statement provides the rationale for gap harvesting since canopy
gaps are the conditions in which these species originally established. Furthermore, a
study on canopy structure and development of a multi-cohort stand in Maine indicated
that partial disturbances are important mechanisms for shade tolerant species to dominate
the canopy (Favjan and Seymour 1993). Although this data represents growth four years
after harvest, A. rubrum and A. balsamea were the most abundant regenerating tree
species. More desired species, such as P. strobus and P. rubens are regenerating in
greater numbers in harvest gaps in both seedling and sapling height classes, and these
species are producing more stems per hectare in harvest gaps than in natural gaps. In
natural gaps, P. rubens saplings are regenerating 50 stems/ha whereas P. rubens saplings
in harvest gaps are regenerating 590 stems/ha. Under the closed canopy P. rubens is not
an abundant species. These results indicate the preliminary success of natural

83
regenerating economically valuable tree species by harvesting in an expanded gaps
shelterwood harvest four years after harvest. However, one interesting result is the
scarcity A. saccharum and B. alleghaniensis regeneration in harvest gap and natural gaps.
Both species are of equal shade tolerance and are considered gap phase species
(Mladenoff 1990). Their lack of regeneration may be accounted by their lack of
representation in the stand measured by basal area in the gaps.
2.5.4.3. Predicting Canopy Status
Although many studies on harvest gap regeneration have not exceeded 10 years,
many studies indicate that shade intolerant species often dominates harvest gap tree
regeneration in the early stages of succession (McClure 2000; Kimball et al. 1995;
Schumann 1999; Philips and Shure 1990). This dominance may be short-lived. The
opportunistic growth of sprouts and seedlings after gap formation produces localized
gaps from their gradual dieback allowing canopy accession of shade tolerant species
(Philips and Shure 1990). Both A. balsamea seedlings and A. rubrum basal sprouts were
the most abundant species regenerating in gaps, but these species are highly susceptible
to competition. A. balsamea growth is directly related to site index, and in the PEF, its
periodic annual volume in growth greatly exceeds its representation in the original stands
before shelterwood harvest. However volume mortality of balsam fir also greatly
exceeds its original representation in the PEF stands (Frank and Blum 1978). As a result
of their inability to outcompete other species, A. rubrum and A. balsamea may attain
canopy statues, but their abundance in the future canopy is likely to be diminished.

84
Other seedlings that are regenerating in high numbers that are more shade tolerant
and economically valuable include P. strobus, Q. rubra, and P. rubens. This result is
important for predicting the future canopy structure within harvest gaps where a study on
natural gaps in New Hampshire indicated that all tree species that reached the 44 to 48
year old gap canopy established within 4 years after gap formation (McClure et al. 2000).
These species, particularly P. strobus and P. rubens are also likely to be well represented
in the future canopy because of their tolerance levels and competitive advantage. Canopy
stratification patterns in a multi-cohort stand in Maine (i.e., as a result of partial
disturbances) indicate that P. rubens dominate the intermediate crown class, and P.
strobus as well as P. rubens were the species that comprised the dominant canopy class
present. Furthermore, P. strobus was the only species present as an emergent (Favjan
and Seymour 1993). A gap dynamics study in a spruce-fir forest in New Hampshire
indicated that both P. rubens and A. balsamea grew 2-3 times faster in gaps than under
closed canopy (Battles and Fahey 2000). Therefore, based on the presence of
regenerating stems in harvest gaps and the species stratification of stand development in
gaps based on studies of similar forest types, we can predict the dominant species
composition of the future gap canopy to be (i.e., not in any order of importance) A.
rubrum, A. balsamea, P. rubens, and P. strobus.
2.5.5. Conclusion
The primary objective of the expanding-gap harvest strategy is managing the
Acadian forest in a manner that is more consistent with the natural disturbance regime of
this region. The expanding-gap strategy strives to 1) increase species diversity, 2.)

85
diversify the forest structure, 3) naturally regenerate commercially valuable tree species,
and 4) promote the presettlement forest structure and composition. Several of these
objectives have been accomplished within four years after harvest. Gap harvesting
successfully increased the abundance and diversity of plant species, regenerated more
tree saplings than any other condition indicating the addition of a new cohort, and
regenerated in significant abundance commercially valuable tree species such as P.
rubens and P. strobus.
Natural gap canopy openings effectively allowed enough light for high plant
abundance values similar to harvest gap plant abundance values, but canopy openings
were not large enough to introduce a large number of new species as witnessed in harvest
gaps. The dissimilarity in composition between the composition of harvest gaps and
natural gaps as well as the large number of species only occurring in harvest gaps
indicated that the expanding gap harvesting system is initiating a different pattern of
vegetation dynamics than the natural gaps. There are three possible explanations for this
result. First, many natural gaps are formed by the slow death of a canopy tree producing
a standing snag with minimal disturbance to the forest floor and/or the upper canopy.
The slow forming natural nature of these gaps did not create an abrupt change in habitat
to introduce many early successional species. Second, the lateral extension of the natural
gap canopy trees quickly reduces the opportunity for early successional species to exist.
Third, the older age of the natural gaps, five to eleven years and possibly older, may be
exhibiting vegetation conditions that have had more time to develop than the harvest
gaps. Therefore, the greatest differences between natural gaps and harvest gaps were the
magnitude of the disturbance.

86
2.6. Literature Cited
Battles, J.J. and Fahey, T.J. 2000. Gap dynamics following forest decline: a case study of red spruce forests. Ecol. App. 10: 760-774 Beckage, B., Clark, J.S., Clinton, B.D., and Haines, B.L. 2000. A long-term study of tree seedling recruitment in southern Appalachian forests: The effects of canopy gaps and shrub understories. Can. J. For. Res. 30: 1617-1631 Brissette, J.C. and Kenefic, L.S. 1999. Eastern hemlock response to even- and uneven-
age management in the Acadian forest: results from the Penobscot Experimental Forest Long-term silvicultural study. Pp. 23-33 in K.A. McManus, K.S. Shields, and D.R. Soutso, eds. Proceedings: Symposium on sustainable management of hemlock ecosystems in eastern North America; 1999 June 22-24, USDA Forest Service Gen Tech. Report NE-267
Burns, R. M. and Honkala, B.H. 1990. Silvics of North America: 1. Conifers; 2.
Hardwoods. Agriculture Handbook 654. U.S. Departmemt of Agriculture, Forest Service, Washington, DC
Busing, R.T. and White, P.S. 1997. Species diversity and small-scale disturbance
in an old growth temperate forest: A consideration of gap partitioning. Oikos. 78: 562-568
Canham, C.D., Denslow, J.S., Platt W.J., Runkle J.R., Spies T.A., and White, P.S.
1990. Light regimes beneath closed canopies and tree-fall gaps in temperate and tropical forests. Can. J. For. Res. 20: 620-631
Canham, C.D. 1988. Growth and canopy architecture of shade-tolerant trees response to
canopy gaps. Ecol. 69: 786-795 Clinton, B.D., Boring, L.R., and Swank, W.T. 1994. Regeneration patterns in canopy
gaps of mixed-oak forests of the Southern Appalachians: Influences of topographic position and evergreen understory. Am. Mid. Nat. 132: 308-319
Collins, B.S. and Pickett, S.T.A. 1988a. Response to herb layer cover to
experimental canopy gaps. Am. Mid. Nat. 119: 282-290 Collins, B.S. and Pickett, S.T.A. 1988b. Demographic response of herb layer in
species to experimental canopy gaps in a northern hardwood forest. J. Ecol. 76: 437-450 Dahir, S. and Lorimer, C.G. 1996. Variation in canopy gap formation among
developmental stages of northern hardwood stands. Can. J. For. Res. 26: 1875-1892

87
Della-Bianca, L. and Beck, D.E. 1985. Selection management in southern Appalachian hardwoods. S. J. App. For. 9: 161-196 Ehrenfeld, J.G. 1980. Understory response to canopy gaps of varying size in a mature oak forest. Bull Torr Bot. 107: 29-41 Fajvan, M.A. and Seymour. R.S. 1993. Canopy stratification, age structure, and
development of multicohort stands of eastern white pine, eastern hemlock, and red spruce. Can. J. For. Res. 23: 1799-1809
Foster, D.R. 1988. Disturbance history, community organization and vegetation
dynamics of the old-growth Pisgah forest, south-western New Hampshire, U.S.A. J. Ecol. 76: 105-134
Haines, A. and Vining, T.F. 1998. Flora of Maine: A manual for identification of native and naturalized vascular plants of Maine. V.F. Thomas Co. Bar Harbor, ME
Hansen, A. J., Spies, T.A., Swanson, F.J., and Ohmann, J.L. 1991. Conserving
biodiversity in managed forest; lessons from natural forest. BioScience. 41: 382-392
Hibbs, D.E. 1982. Gab dynamics in a hemlock-hardwood forest. Can. J. For. Res. 12: 522-527
Huenneke, L.F. 1983. Understory response to gaps caused by the death of Ulmus americana in Central New York, USA. Bull. Torr. Bot. 110: 170-175 Hughes, J.W. and Fahey, T.J. 1991. Colonization dynamics of herbs and shrubs in
a disturbed northern hardwood forest. J. Ecol. 79: 605-617 Kimball, A.J., Witham, J.W., Rudnicky, J.L., White, A.S., and Hunter, M.L. 1995.
Harvest-created and natural canopy gaps in an oak-pine forest in Maine. Bull. Torr. Bot. 122: 115-123
Laustsen, K.M. and Griffith, D.M. 2002. Third Annual Inventory Report on Maine’s
Forests. USDA Forest Service, Northeastern Research Station. Appropriation no. 010 04A 666 022
Lautenschlager, R.A. 1999. Environmental resource interactions affect red raspberry
growth and its competition with white spruce. Can. J. For. Res. 29: 906-916 Lorimer, C.G. 1977. The presettlement forest and natural disturbance cycle of
northeastern Maine. Ecol. 58: 139-148

88
Lunquist, J.E. and Beatty, J.S. 2002. A method for characterizing and mimicking forest canopy gaps caused by different disturbances. For. Sci. 48: 582-594
Magurran, A.E. 1988. Ecological diversity and its measurement. Princeton
University Press, Princeton, NJ Maine Council on Sustainable Forest Management (MCSFM). 1996. Sustaining
Maine’s Forests: Criteria, Goals, and Benchmarks for Sustainable Forest Management. Maine Department of Conservation, Augusta, ME
McClure, J.W., Lee, T.D., and Leak, W.B. 2000. Gap capture in northern hardwoods:
patterns of establishment and height growth in four species. For. Ecol. Man. 127: 181-189
McCune, B. and Mefford, M.J. 1999. PC-ORD. Multivariate analysis of
ecological data, Version 4. MjM Software Design, Glaneden Beach, Oregon, USA.
McGarigal, K., Cushman, S., and Stafford, S. 2000. Multivariate Statistics
for Wildlife and Ecology Research. Springer-Verlag, NY Inc. New York, NY.
Mladenoff, D.J. 1990. The relationship of the soil seed bank and understory vegetation
in an old-growth northern hardwood-hemlock treefall gaps. Can J. Bot. 68: 2714-2721
NESFA. 2001. The economic importance of Maine’s Forests. North East State Foresters
Association. Concord, NH Oliver, C.D. and Larson, B.C. 1996. Forest Stand Dynamics. John Wiley and Sons,
Inc., NY Phillips, D.L. and Shure, D.J. 1990. Patch-size effects on early succession in southern
Appalachian forest. Ecol. 71: 204-212 Poulson, T.L and Platt, W.J. 1989. Gap light regimes influence canopy tree
diversity. Ecol. 70: 553-555 Quinby, P.A. 2000. First year impacts of shelterwood logging on understory vegetation
in an old-growth pine stand in central Ontario, Canada. Env. Cons. 27: 229-241 Rankin, W.T. and Tramer, E.J. 2002. Understory succession and the gap regeneration
cycle in a Tsuga canadensis forest. Can. J. For. Res. 32: 16-23

89
Roberts, M.R. and Gilliam, F.S. 1995. Patterns and mechanisms of plant diversity in forested ecosystems: implications for forest management. Ecol. Appl. 5: 969-
977 Runkle, J.R. 1981. Gap regeneration in some old-growth forests of the eastern
United States. Ecol. 62: 1041-1051 Runkle, J.R. 1982. Patterns of disturbance in some old-growth mesic forests of
eastern North America. Ecol. 63: 1533-1546 Runkle, J.R. 1985. Disturbance regimes in temperate forests. In The ecology of
natural disturbance and patch dynamics. Academic Press, Inc., Orlando, FL Runkle, J. R. 1992. Guidelines and Sample Protocol for Sampling Forest Gaps.
USDA For. Serv. Pap. PNW-GTR-283 Schumann, M.E. 1999. The effects of harvest-created gaps on plant species
diversity, composition, and abundance in a Maine Oak-Pine forest. MS thesis, University of Maine, Orono, ME
Schumann, M.E., White, A.S., and Witham, J.W. 2003. The effects of harvest-created
gaps on plant species diversity, composition, and abundance in a Maine oak-pine forest. For. Ecol. Man. 176: 532-561
Seymour, R.S., White, A.S., and deMaynadier, P.G. 2002. Natural disturbance
regimes in northeastern North America-evaluating systems using natural scales and frequencies. For. Ecol. Man. 155: 359-367
Seymour, R.S. and Hunter, M.L. 1999. Principles of ecological forestry In
Maintaining biodiversity in forest ecosystems. Edited by M. L. Hunter. Cambridge University Press, NY.
Seymour, R.S. and Day, M.E. 1997. Ecologically based expanding-gap silvicultural
systems in the Acadian Forest: Understanding changed in managed and unmanaged forest. In Proc. First Biannual North American Forest Ecology Workshop. North Carolina State University, Raleigh, NC June 24-26, 1997
Seymour, R.S. and Day, M.E. 1996. Application of ecologically based expanding-gap
silviculture systems in the Acadian Forest (Poster Presentation). 14 North American Forest Biology Workshop. June 16-20, Université Laval, Quebec, P.Q. Canada.
Seymour, R.S. and Hunter, M.L. 1992. New Forestry in eastern spruce-fir forests:
principles and applications to Maine. Maine Agricultural and Forestry Experiment Station Miscellaneous Publication 716.

90
Steel, R.G., Torrie, J.H., and Dickey, D.A. 1997. Principles and procedures of statistics: A biometrical approach. Third Edition. WCB/ McGraw-Hill, Boston, MA.
USDA, NRCS. 2002. The PLANTS Database, Version 3.5 (http://plants.usda.gov).
National Plant Data Center, Baton Rouge, LA 70874-4490 USA Wagner, R.G., Bowling, E.H., and Seymour, R.S. 2003. Assessing silviculture research
priorities for Maine using wood supply analysis. Maine Agricultural and Forest Experiment Station Technical Bulletin 186.
Wagner, R.G. and Ter-Mikaelian, M.T. 1999. Comparison of biomass component
equations for four species of northern coniferous tree seedlings. Ann. For. Sci. 56: 193-199
Webster, C.R. and Lorimer, C.G. 2002. Single-tree versus group selection in hemlock- hardwood forests: Are smaller openings less productive? Can. J. For. Res. 32: 591-604 Whitmore, T.C. 1989. Canopy gaps and the two major groups of forest trees.
Ecol. 70: 536-538 Whittaker, R.H. 1975. Communities and Ecosystems. Macmillan Publishing Co., Inc.,
New York, NY.

91
Chapter 3
RELEASE RESPONSE OF SAPLINGS AND EDGE TREES IN HARVEST GAPS
AS A METHOD FOR DATING NATURAL TREEFALL GAPS IN MAINE’S
ACADIAN FOREST
3.1. Abstract
Understanding the dynamics of natural gaps in the Acadian forest is crucial for
developing forest management practices that are based on patterns of ecological
disturbance. A major limitation to quantifying vegetation dynamics in natural gaps is a
lack of methods for accurately determining when a gap was created. Tree radial growth
response has been a successful means for dating natural tree fall gaps in disturbance
chronological studies. Because different tree species, ages, and location within a stand
structure influence radial growth after disturbance, many different release criteria to
indicate a canopy disturbance event have been established. We examined the growth
response of saplings and edge trees to harvest gaps of a known age and compared the
release response patterns of several tree species, gap sizes, and tree sizes. The relative
response patterns were used to determine the best release criteria for dating natural gaps
in the Acadian forest of Maine.
We examined the radial growth response of Acer rubrum L., Tsuga canadensis
(L.) Carr., and Betula papyrifera Marsh. overstory trees at the edge of 20 various-sized
harvest gaps as well as Abies balsamea (L.) P. Mill and T. canadensis saplings in these
harvest gaps. A. balsamea and T. canadensis saplings were also sampled in 23 natural
gaps as a test of the best release criteria determined in harvest gap trees. All overstory
trees were cored at breast height, and sapling cross-sections were made at the base of the

92
tree. Both average gap growth after harvest and percent growth response were examined
in harvest gap trees to determine the best method for dating natural gaps using a duration
of 7 years pre- and post-harvest (i.e., harvest gaps were 7 years old).
For overstory trees at the edge of harvest gaps, a 50% growth response provided
the most accurate date of gap formation. Gap size (χ2 = 7.560, p<0.006) and the
interaction of gap size and species (χ2 = 4.39, p<0.036) where T. canadensis indicated the
most frequent response were the best variables predicting a response using this criterion.
In saplings from the harvest gaps, a 200% growth response provided the most accurate
date of gap formation. Only gap size (χ2 = 8.187, p< 0.004) was a significant variable
predicting a sapling response to canopy disturbance. Based on the results from the
harvest gaps, a 200% growth response as a criterion was selected for dating natural gaps.
We found, however, that this criterion underestimated gap formation dates since the
harvest created a more abrupt disturbance than the slow-forming natural gaps. A more
conservative release criterion, 100% growth response, provided more natural gap
formation dates than the 200% growth response, and it was the best release criteria for
dating natural gaps in this study.
3.2. Introduction
Understanding the gap dynamics of the Acadian forest is vital to developing
silvicultural approaches that are based on patterns of natural disturbance (Seymour and
Day 1997). A major limitation to quantifying vegetation dynamics in natural gaps is a
lack of methods for accurately determining when a gap was created. Many studies
comparing plant diversity and/or stand regeneration in recent natural gaps utilize several
non-destructive techniques for determining the date of gaps. These methods include

93
evaluation of conditions of the treefall, soil and litter disturbance, damage to adjacent
vegetation (Mladenoff 1990), changes in the lateral growth of trees as indicated by the
distance between bud scale scars (Rankin and Tramer 2002), and aging seedlings
growing on tip-up mounds (Battles and Fahey 2000). These methods are often subjective
and can be inaccurate.
A study performed by Dynesius and Jonsson (1991) evaluated eight different
methods for obtaining the best date of natural gaps in a northern Sweden boreal forest.
According to their results, initial growth of surrounding canopy trees and the growth
release of suppressed saplings evaluated by radial growth of the stem provided the best
method for dating natural tree fall gaps. Trees form an abrupt and sustained increase in
height and/or radial growth when exposed to higher light intensities after being
suppressed by larger trees and/or branches (Frelich 2002; Lorimer 1985). The date of
formation of natural gaps in a forest landscape can be defined by the year in which the
tree indicates a release from suppression. However, assigning a formation date for
natural gaps is sometimes problematic since increases in stem radial growth are also
indicative of climate changes and/or tree vigor. Radial growth responses to increased
light by canopy openings will vary by a tree’s position in the canopy, location relative to
the gap, species, shade tolerance, the magnitude of the disturbance (i.e., slow gap
formation over long period), and whether a tree was injured during the disturbance.
Further, natural gaps are rarely formed by one event, often making the spatial and
temporal boundary of the natural gap indiscernible, especially in radial growth patterns.
Hence, assigning a single year to natural gap formation does not accurately characterize
when the gap was created.

94
Many studies have shown that saplings within the gap have provided accurate
results in dating natural gaps. In the northern Sweden boreal forest, the growth release of
suppressed saplings measured by the cross-section at the base of the tree provided an
accurate age of formation for the natural gaps where 17 of 22 gaps were dated using this
method (Dynesius and Jonsson 1991). In spruce-fir forests of the Rocky Mountains,
suppressed saplings responded to partial overstory removal with a 4-fold increase in
growth, but growth was sometimes depressed 1-2 years following harvest (McCaughey
and Schmidt 1982). A study on recent natural gaps in a northern hardwood forest
indicated that trees within the gap demonstrated a greater response in radial increment
than trees at the gap edge. Not only was tree position important, but also different
species had greater responses than others. Sugar maple responded to a greater degree
than eastern hemlock, red maple, and yellow birch (Dahir and Lorimer 1996). Gap
capture in a northern hardwood forest of New Hampshire indicated that after gap
formation, sugar maple and red maple grew more rapidly than American beech (McClure
et al. 2000). However, in an old growth forest of Maine, smaller trees in natural gaps
showed the same likelihood of response irrespective of their location within the gap (i.e.
gap edge or center), and tree species response was only significantly different for a
moderate release criterion, the preferred criterion (Chokkalingam 1998).
Because different tree species, ages, and location within a stand influence radial
growth after disturbance, many different release criteria to indicate a disturbance event
have been established. The suitability of a release criterion often varies by with region,
species, site, and other environmental factors (Chokkalingam 1998). The majority of the
release criteria cited in the literature were reviewed and summarized by Chokkalingam
95
(1998). Although many studies often assign an arbitrary release criterion, most studies
use an increase in radial growth of between 50% and 100% during a specified growth
period before and after the disturbance to indicate a major release or a minor release
depending on the characteristics of the tree species (Frelich and Lorimer 1991; Frelich
and Graumlich 1994; Frelich 2002).
Not only are the magnitude of the release important, but also the duration of the
response. The duration of an abrupt and sustained release discriminates radial growth
changes due to disturbance events from changes due to climatic variation (Frelich 2002;
Canham et al. 1990). Lorimer (1985) suggested a 15-year consecutive growth release
from suppression screens out growth releases that are climatically related. Some studies
deviate from these standards. For example, Dahir and Lorimer (1996) used an average of
40% radial growth increase from eight years predisturbance and five years post-
disturbance to estimate the probable date of gap formation. This low value was selected
because the canopy gaps were < 50 m2 in size, and it was successful in this study only
because the researchers had data on the initial size and growth rate of all the trees studied.
Hence, climatic responses in radial growth could be excluded.
Chokkalingam (1998) compared three different release criteria in a disturbance
study in an old-growth forest of Maine. Her release criteria ranged from a moderate
criterion (≥ 100% increase in growth from 10 years prior to disturbance and sustained 10
years) to lenient criterion (≥ 100% mean increase in growth from 5 years prior to
disturbance and sustained for 5 years), and absolute criterion (three years of radial growth
< 0.5 mm following four years of > 0.5 mm radial growth). Although all the criteria
produced similar numbers of responses, the lenient criterion overestimated disturbance

96
intensity. Frelich (2002) suggests that percentage growth increase is a more valuable
indicator of disturbance than a fixed growth rate (e.g., 0.5 mm/yr) because many tree
species have a high growth rates before a disturbance event.
Because of the considerable variation in tree response to canopy disturbance due
to differences in species, shade tolerance, gap size, and other environmental conditions,
the best method for dating recent natural gaps in the Acadian forest is difficult to
determine. Furthermore, assigning an arbitrary release criterion for tree response in
natural gaps in the Acadian forest type may not determine the most accurate formation
date. Most disturbance chronology studies usually identify a disturbance event within a
ten-year period (Lorimer 1985) because there are many factors that influence tree growth
response to release from suppression. Therefore, understanding how particular species in
various positions of a forest structure and in various gap sizes react to a known
disturbance (i.e., both spatially and temporally) can benefit natural disturbance
chronological studies where the disturbance patterns of the forest structure are unknown.
We examined the growth response of saplings and edge trees to harvest gaps of a
known age and compared the release response patterns of several tree species, gap sizes,
and tree sizes. The relative response patterns were used to determine the best release
criteria for dating natural gaps in the Acadian forest of Maine. Hence, we examined the
following hypotheses: 1) there is no difference in growth response to canopy disturbance
between gap overstory edge trees and gap saplings, 2) there is no difference in the growth
response to canopy disturbance for gap overstory edge trees in relation to their position in
the canopy, and 3) there is no difference in the growth response to canopy disturbance by
trees species for both gap overstory edge trees and gap saplings.

97
3.3. Methods
3.3.1. Study Area
The study area is located in the University of Maine’s Penobscot Experimental
Forest (PEF) on the Forest Ecosystem Research Project (FERP) lands in the towns of
Bradley and Eddington, Penobscot County, Maine (44 50’N, 68 35’W). The PEF
encompasses 1,600 hectares and is part of the Acadian forest type. The dominant tree
species in the PEF include eastern hemlock (Tsuga canadensis (L.) Carr.), red maple
(Acer rubrum L.), red spruce (Picea rubens Sarg.), eastern white pine (Pinus strobus L.),
northern white cedar (Thuja occidentalis L.), balsam fir (Abies balsamea (L.) P. Mill),
trembling aspen (Populus tremuloides Michx.), and paper birch (Betula papyrifera
Marsh.). This forest has a complex history of repeated cuttings resulting in relatively
even-aged stands dating from the late seventeenth century. Forest soil structure is
variable, but principally Aquic or Typic Haplorthods or Podzols; slope is generally less
than 8% (Brissette and Kenefic 1999).
Using current information about natural disturbance regimes in the Acadian
Ecoregion (Runkle 1981; Seymour and Hunter 1992), an expanding-gap silvicultural
system with permanent reserve trees was developed (Seymour and Day 1997). Based
loosely on the German “Femelschlag” system, the treatment prescriptions include: 1)
20:10 treatment - 20% canopy removal on a 10-year cutting cycle for 50 years and 50
years regeneration (creating 0.2 ha openings) with 10% of the basal area remaining in
permanent reserve trees, and 2) 10:30 treatment - a 10% canopy removal level on a 10-
year cutting cycle for 100 years (creating 0.1 ha openings) with 30% of the basal area

98
remaining in permanent reserve trees. These treatments are being compared to control
areas that receive no harvesting.
Both harvest treatments were designed to provide a 1% annual disturbance rate
over 100 years of regeneration similar to that estimated for presettlement forests in Maine
(Lorimer 1977). The 20:10 treatment will hypothetically enhance the development of
mid-succession species and produce five different cohorts within the managed stand. The
10:30 treatment is intended to accelerate the development of late successional species and
produce ten cohorts within the managed stand. These treatments also were designed to
maintain the economic advantages of even-aged methods, yet provide many of the
structural features found in uneven-aged stands. The maintenance of permanent reserve
trees is intended to provide structural diversity and control species.
Using the gaps created in this study, the response of stem radial growth was
examined in two of the FERP plots. Research Area one (RA1) contains the 20:10
treatment providing large gaps with a size range of 940 m2 – 2,169 m2and RA2 contains
the 10:30 treatment providing small gaps with a size range of 108 m2 - 472 m2. The
harvest gaps were created in the winter of 1994 / 1995 providing seven growing seasons
for saplings and mature edge trees to respond to the creation of the harvest gap (i.e., data
collected at the end of the growing season 2001). RA 3 is the untreated control, and trees
in this plot were sampled to provide a climatic baseline for comparison with trees in the
harvested gaps. All tree samples were collected during October and November of 2001.
The most frequently occurring tree species in the forest overstory and understory (i.e.,
saplings) in RA 1-3 were selected based on data collected from sample plots before the
site was harvested in 1995.

99
3.3.2. Harvest Gap Edge Tree Response
The three most abundant species in the overstory were T. canadensis, A. rubrum,
and B. papyrifera. Gap edge trees that had between 50% and 75% of their crown
circumference exposed to the harvest gap were cored at breast height (1.4 m). Cores
were extracted to indicate at least 20 years of growth and taken on the side of the stem
exposed to the gap opening. The following measurements were collected from each
cored tree: total height, live crown height, diameter, crown exposure, and azimuth to the
harvest gap center. Total height and live crown height were measured using a Haglöf
hypsometer and crown exposure was measured using an ocular estimation of percent
crown circumference exposed to the gap opening. Ten cores of each of the three species
were collected from trees in the A/B and the C canopy stratum, in the 20:10 treatment
and 10:30 treatment, and under the closed canopy conditions in the control plot providing
a total of approximately 180 cores. The A/B stratum includes trees both above the
highest continuous canopy and within the upper continuous canopy, and the C stratum
includes trees within the lower canopy strata below the B strata (Oliver and Larson
1996). It was not always possible to collect all replications for the conditions for a tree
core (e.g., B. papyrifera in the A/B strata under the closed canopy).
All tree cores were mounted and sanded using a radial sander beginning with 100
grit and finishing with 600 grit using 100 grit increments. Both A. rubrum and B.
papyrifera cores were finished up to 1000 grit in order to make the growth rings were
more visible. All cores were scanned into a computer and the tree rings were measured
using WINDendro version 2001 up to at least 20 years of growth from the last growing

100
season. Because trees were not cored to the pith, there were an inadequate number of
growth rings to perform cross dating.
3.3.3. Harvest Gap Sapling Tree Response
The most abundant understory tree species (i.e., saplings less < 10 cm DBH) were
A. balsamea and T. canadensis. Twenty saplings (10 A. balsamea and 10 T. canadensis)
were selected within the gaps of each treatment including under the closed canopy in the
control plot providing a total of 60 saplings. Saplings were chosen if they 1) were at least
14 years old (i.e., 7 years post- and pre-harvest) determined by counting yearly nodal
growth, 2) were dominant among saplings in the gap to reduce the confounding effects of
competition with neighboring saplings, 3) had 100% of their crown exposed to the gap
opening, and 4) were no farther from the gap center than one half of the gap radius.
Sapling growth response was measured using ring width analysis of stem cross-
sections. Because we were unable to precisely determine specific years of nodal growth
before the harvest treatment due to the suppressed nature of the balsam fir saplings, we
could not examine nodal growth, both from crown release and the ratio of lateral to
vertical nodal growth as done by Duchesneau et al. (2001). Saplings were cut 10 cm
from the base of the tree and a cross-section removed for analysis. Tree height and
diameter at breast height (i.e., 1.4 m) were also recorded for each sapling. All sapling
cross-sections were prepared and analyzed as the cores described above. Four equidistant
radii were marked on all sapling cross-sections, and all radii were analyzed to determine
an average yearly growth.

101
3.3.4. Natural Gap Sapling Response
A total of 23 natural gaps were identified in the control plot. A natural gap was
chosen if it 1) was caused by the death of at least two canopy trees with ≥ 25 cm diameter
(Runkle 1992), 2) had a maximum of 2 m understory height within the gap (i.e.,
regeneration), and 3) was at least 30-40 m away from other canopy openings to minimize
edge effects. Area of each natural gap was estimated by the expanded gap area of an
ellipse based on the method defined by Runkle (1992). Gap area ranged from 110-510
m2. In every natural gap, five dominant saplings (or at least three dominant saplings if
five were not found) located no farther than from the gap center than one half the gap
radius were selected providing a total of 105 saplings. Due to the restrictions of sapling
frequency in natural gaps, all conifer species including A. balsamea, T. canadensis, P.
strobus, and P. rubens were used for the analysis. However, only four P. strobus
saplings and two P. rubens saplings were collected. Each sapling was cut 10 cm from the
base to collect a stem cross section for tree growth analysis. Height, diameter (either at
breast height or basal diameter depending on height of the sapling), and distance from the
gap maker(s) were noted for each sapling. Cross-sections were prepared and analyzed as
described above for harvest gap saplings.
3.3.5. Harvest Gap Release Response Criteria
In order to establish the best criteria for determining release response in harvest
gaps, we evaluated stem growth of harvest gap saplings and edge trees in three ways: 1)
mean ring width from 1995-2001, 2) percent growth response based on the release
criteria created by Lorimer (1980) using 7-year growth pre-harvest and 7-year growth
post-harvest [1], and 3) both mean ring width and percent release.

102
[1] % Response = [Ave. post growth - Ave. pre growth] / [Ave. pre growth] x 100
The mean ring width from 1995-2001 (i.e., post harvest) release criterion was
used to differentiate growth patterns under the closed canopy from the growth patterns of
trees in canopy openings. For example, Acer saccharum Marsh. saplings in the
understory of a northern hardwood forest average 0.22 mm/ year, whereas A. saccharum
saplings in even the smallest canopy openings average 0.69 mm/year (Canham 1985).
The justification for using both percent growth response and mean radial growth after gap
formation (i.e., number three above) is the radial growth patterns of highly suppressed
trees. Because of small radial growth patterns, highly suppressed trees might have
indicated a large percent growth response that may not have been attributed to canopy
gap formation producing a false release. Hence this release criterion is very strict.
Thresholds for release were determined by the maximum number of harvest gap trees that
met the specified criterion and by the exclusion of closed canopy trees that produced a
false positive release to the specified criterion.
Logistic regression was used to investigate what predictive variables (i.e., tree
species, gap size, and diameter) accounted for the probability of harvest gap edge trees
and harvest gap saplings to indicate a release. Dummy indicator variables were used for
tree species within the logistic model. Using the maximum likelihood estimation, logistic
regression is appropriate for estimating parameters with both categorical and continuous
variables with binary response indicator variables (i.e., release or no release in this study)
(Neter et. al 1996). Using backward elimination in proc logistic (SAS system for

103
Windows v. 8.01 2000), the fit of a full model with both main effects and interactions
was tested for the release criteria that produced the best obtainable formation date results.
The backward-elimination calculates the statistics for the full model including all
independent variables; variables from the model are eliminated until all remaining
variables and interactions produce a significant (i.e., p < 0.05) statistic.
3.3.6. Natural Gap Release Response Criteria
The three release criteria for each harvest-gap edge-tree and sapling were
analyzed to determine the best release criterion for dating natural gaps in the untreated
control plots. After choosing the best release criterion for natural gaps, the first year
where the natural gap sapling reached a determined growth response indicated the time
when the natural gap formed, and at least 3 saplings with corresponding release years
(i.e., within 3-5 years) in a given natural gap were needed to date the gap. All releases in
natural gaps were categorized into periods of 3-5 years to account for potential lag in
sapling response.
3.4. Results
3.4.1. Harvest Gap Tree Response
3.4.1.1. Harvest Gap Edge Trees
Based on the distribution of growth patterns for trees under the closed canopy, the
minimum release threshold for harvest gap edge trees was positioned at 50% growth
response (Figure 3.1b) and 1.0 mm average growth after harvest (Figure 3.1a). These
thresholds were chosen based on the growth patterns of the closed canopy trees. The
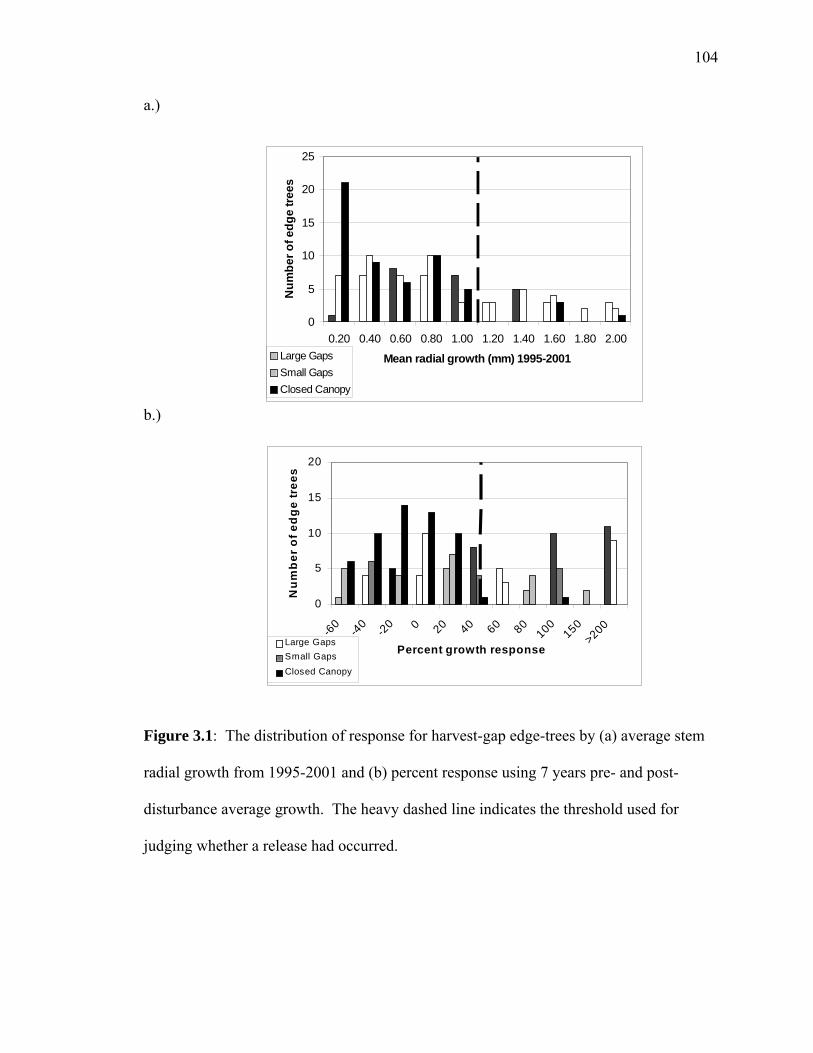
104
a.)
b.)
Figure 3.1: The distribution of response for harvest-gap edge-trees by (a) average stem
radial growth from 1995-2001 and (b) percent response using 7 years pre- and post-
disturbance average growth. The heavy dashed line indicates the threshold used for
judging whether a release had occurred.
0
5
10
15
20
25
0.20 0.40 0.60 0.80 1.00 1.20 1.40 1.60 1.80 2.00
Mean radial growth (mm) 1995-2001
Num
ber o
f edg
e tre
es
Large GapsSmall GapsClosed Canopy
0
5
10
15
20
-60
-40
-20 0 20 40 60 80
100150
>200
Percent growth response
Nu
mb
er o
f ed
ge
tree
s
Large GapsSmall GapsClosed Canopy

105
closed canopy radial growth patterns illustrate the typical growth rates of trees in the
closed canopy. Although these thresholds exclude some harvest gap edge trees (i.e.,
individuals showing no response according to our criterion), these thresholds reduce the
possibility of identifying false positive releases in closed canopy trees.
Only 31% of harvest gap edge trees demonstrated a release of ≥ 50% growth
response after harvest. Of the edge trees that responded by percent release, 54% were in
large gaps, 44% were in small gaps, and 2% were under the closed canopy. T.
canadensis responded most frequently (42%), and B. papyrifera responded the least
frequently (23%). A. rubrum responded 35% of the time. Similarly, 32% of harvest gap
edge trees showed a release of ≥ 1.0 mm average gap growth from 1995-2001. Of the
trees that demonstrated a response by this criterion, 52% were in large gaps, 41% percent
were in small gaps, and 7% were under the closed canopy.
For the ≥ 1.0 mm mean gap growth, T. canadensis responded most frequently
(48%) and B. papyrifera responded least frequently (15%); A. rubrum responded 37% of
the time. Using both 50% response and ≥1.0 mm average gap growth (1995-2001)
release criterion, only 19% of harvest gap edge trees demonstrate a release. Of these
release trees, 53% percent were in large gaps, 47% percent were in small gaps, and none
were under the closed canopy. Thirty-four percent of the release trees were A. rubrum,
16% were B. papyrifera, and 50% percent were T. canadensis. Table 3.1 summarizes the
number of harvest gap edge trees indicating a release for each release criteria.
Logistic regression indicated that for the ≥ 50% response release criteria, B.
papyrifera (χ2 = 7.560, p < 0.006) showed the lowest rate of response among the three

Table 3.1: The number of harvest-gap edge-trees indicating a release for the three release criterion using 7 year pre-and post-harvest
duration for percent growth response and 7 year average gap growth
Acer rubrum Betula papyrifera Tsuga canadensis
Release Criteria Gap Type Released Total Sampled Released Total
Sampled Released Total Sampled
Large Gaps 8 20 10 18 10 18
≥50% Growth response Small Gaps 10 18 2 18 11 19
Closed Canopy 0 20 0 21 1 18
Large Gaps 9 20 8 18 13 18
1.0 mm+ mean gap growth Small Gaps 11 18 1 18 10 19
Closed Canopy 0 20 1 21 3 18
Large Gaps 5 20 4 18 9 18
≥50% and 1.0 mm+ response Small Gaps 6 18 2 18 8 19
Closed Canopy 0 20 0 21 0 18
106

107
species. Gap size (χ2 = 5.024, p < 0.025) and the interaction of gap size and tree species
(B papyrifera) provided the best model for predicting a harvest gap edge tree response (χ2
= 4.39, p < 0.036). Hence, A. rubrum and T. canadensis in the large harvest gaps
provided the strongest release response among edge trees in the harvest gaps.
3.4.1.2. Harvest Gap Sapling Response
Based on the distribution of closed canopy tree growth patterns, the maximum release
threshold for saplings in the harvest gaps was positioned at 200% response (Figure 3.2b)
and 1.0 mm mean radial growth after harvest (Figure 3.2a). The 1.0 mm radial growth
criteria excluded many of the small gap saplings, suggesting that saplings in small gaps
produced less of a release response than saplings in large gaps. This threshold, however,
minimizes the number of closed canopy trees producing a false positive release response.
The 200% release threshold maximizes the number of large and small gap saplings
indicating a response and minimizes the number of closed canopy saplings showing a
false positive response.
Overall, saplings in harvest gaps had a greater growth response to gap harvesting
than did the mature trees at the edge of the gaps (i.e., 200% growth response versus 50%
growth response). Fifty-one percent of harvest gap saplings demonstrated ≥ 200%
growth response. Among the gap saplings that responded by ≥200% release, 48%
occurred in large gaps and 42% were in small gaps. Fifty-five percent of saplings
showing ≥ 200% release were A. balsamea and 45% were T. canadensis. For the ≥ 1.0
mm mean radial growth release criteria, 57% of saplings indicated a release. Of the
saplings that showed a release, 57% were in large gaps, 25% were in small gaps, and

108
a.)
b.)
Figure 3.2: The distribution of response for harvest gap saplings by (a) mean radial
growth from 1995-2001 and (b) percent response using 7 years pre- and post-harvest
average growth. The heavy dotted line indicates the threshold for release criterion.
0123456789
-20 20 40 60 80
100200
300400
> 500
Percent Growth Response
Num
ber
of s
aplin
gs
Large Gaps
Small Gaps
Closed Canopy
0
1
2
3
4
5
6
7
0.2 0.4 0.6 0.8 1 1.5 2 2.5 3 3.5
Mean radial growth (mm) 1995-2001
Nu
mb
er o
f sap
ling
s
Large Gaps
Small Gaps
Closed Canopy

109
17% were under the closed canopy. T. canadensis responded more frequently (65%) than
A. balsamea (35%).
Using both ≥ 200% release and ≥ 1.0 mm average gap growth as an absolute
indicator of release, only 37% of harvest gap saplings showed a release. Among these
released saplings, 68% were from large gaps, 27% from small gaps, and 5% from under
the closed canopy. Forty-five percent of the released saplings were A. balsamea, and
55% percent were T. canadensis. Table 3.2 summarizes the number of harvest gap
saplings indicating a response for each criterion.
Finally, logistic regression indicated that gap size (χ2 = 8.187, p < 0.004) was the
only variable predicting ≥ 200% release. This result indicates that the saplings in the
large gaps had a higher probability of release than saplings in the small gaps, and species
(A. balsamea and T. Canadensis) was not an important variable predicting the likelihood
of release.
3.4.2. Formation Dates of Natural Gaps
Radial growth response of saplings in harvest gaps was found to be a better
indicator of harvest gap creation than using mature trees at the edge of harvest gaps. In
addition, the ≥ 200% release response criterion provided the most sensitive indicator of
sapling release. Fifty-one percent of sapling population in harvest gaps showed a ≥ 200%
release response. Although 57% of the harvest gap saplings demonstrated a release with
a response ≥1.0 mm mean gap growth, this criterion had a higher number of closed
canopy saplings than the ≥ 200% response (i.e., 17% versus 10%). Based on the growth
response results obtained with the harvest gap saplings, the 7 year pre-growth and 7 year

Table 3.2: The number of harvest gap saplings indicating a release for the three release criterion using 7 years pre- and post-harvest
duration for percent growth response and 7 years average gap growth.
Abies balsamea Tsuga canadensis
Release Criteria Gap Type Released
Total Sampled Released
Total Sampled
Large Gaps 9 10 6 10
200% Growth Response Small Gaps 7 10 2 11
Closed Canopy 1 10 2 10
Large Gaps 10 10 10 10
1.0 mm+ Mean Gap Growth Small Gaps 1 10 8 11
Closed Canopy 1 10 5 10
Large Gaps 9 10 6 10
200% and 1.0mm+ Response Small Gaps 1 10 5 11
Closed Canopy 0 10 1 10
110

111
post-growth ≥ 200% percent response was used in determining release for saplings in
natural gaps. Only 16 out of 105 (15%) natural gap saplings demonstrated a ≥200%
response, and only five natural gaps had more than one sapling meeting this release
criterion. Of these five natural gaps, only four had saplings with corresponding release
periods, and all showed a response at 1995 ± 3 years (Table 3.3). However, because a
minimum of three release saplings of the same period were required to confirm a date of
natural gap formation, only one natural gap could be dated using this absolute criteria
(Figure 3.3). The formation date of the gap was determined to be between 1993 and 1996
to account for variation in growth response by species and tree size.
Because only one natural gap could be dated using the ≥ 200% growth response
release criterion, we applied a more conservative release criterion, ≥ 100% growth
response for 7 years pre-and post-disturbance. The justification for applying a more
conservative criterion is 1) that gap harvesting created a more abrupt disturbance than the
formation of natural gaps by the death of a canopy tree and 2) that the natural gap is
known to exist because we chose a natural gap with an open canopy caused by the death
of at least two canopy trees. Therefore, saplings in natural gaps that demonstrated a
release response of at least 100% at the year where the sapling first reach this threshold
were considered to be gap creation events.
Sixty-three saplings (60%) indicated a release of ≥100% growth response at least
once in a core sequence. Fourteen of the 22 natural gaps (63%) were dated using this
moderate release criterion. Nine of the natural gaps had a formation date of 1995 ± 3
years (Table 3.3). Three of the natural gaps contained saplings with growth response, but

112
Figure 3.3: Example of release response for three saplings in a natural gap (3-C4) where
three of four saplings had ≥ 200% release response. This was the only natural gap
measured where a creation date was established using an absolute release criterion. The
formation date of the gap was determined to be between 1993 and 1996 to account for
variation in growth response by species and tree size.
0
50
100
150
200
250
300
2002 2001 2000 1999 1998 1997 1996 1995 1994 1993 1992 1991 1990 1989 1988 1987 1986
Year
% R
espo
nse
NGS25 NGS26 NGS27 NGS29

113
Table 3.3: Summary of natural gap formation dates using both the ≥ 100% growth
response and ≥ 200% growth response. “None” indicates that no saplings in the gap had a
growth response, and “**” indicates no corresponding release period.
Formation Date
Natural Gap Gap Size (m2) ≥ 100% growth response ≥ 200% growth response
3-A3 350.7 1993-1995 None
3-C4 280.1 1993-1994 1994-1996
3-D4 191.1 1981-1986 &1993-1995 **
3-E3 152.6 1990-1993 **
3-E4 163.3 1996-1997 None
3-J2 246.9 1978-1982 None
3-J4 511.9 None None
4-A7 128.6 1994-1996 None
4-C3 88.1 None None
4-C4 157.8 1989-1994 None
4-C5 88.9 ** None
4-D3 227.7 None None
4-D4 114.1 ** None
8-B8 418.3 1992-1996 None
8-C1 261.5 1992-1993 **
8-C2 139.1 None None
8-D4 185.7 None None
8-D5 475.6 1992-1995 None
8-E3 184.5 1992-1995 None
8-E6 231.5 ** None
8-H7 203.6 1994-1997 None

114
the year of the growth response did not correspond. Five of the natural gaps had no
growth response at all.
3.5. Discussion
3.5.1. Release Response To Harvest Gaps
3.5.1.1. Release Criteria
For harvest gaps created in this study, the best criterion for determining the
date of gap creation was the percent growth response from a given period pre- and
post-disturbance (i.e., Equation 1). The percent growth response release criteria
produced the best results for both harvest gap edge trees and saplings with the least
number of closed canopy trees demonstrating an erroneous release. However, the
magnitude of percent response as a release criterion differs between harvest gap edge
trees and harvest gap saplings because of the differences in growth rates of the trees.
As a result, saplings in harvested gaps provided more reliable measure of release
response than did mature trees at the edge of harvest gaps.
This result is consistent with the release of trees of an old-growth forest of
Maine where smaller trees (≤ 11 cm DBH) appeared to respond more to natural gap
disturbances, and there was little change in radial growth patterns of larger trees in
response to recent natural gaps (Chokkalingam 1998). In oak forests of Pennsylvania,
understory trees responded more to thinning (50-100% radial growth increase) than
mature canopy oaks (25% radial growth increase) (Nowak and Abrams 1997). The
harvest gap saplings in this study were chosen if they were dominants in an area of
“clumped” regeneration and hence, had maximum exposure to the new growing space
created by the gap. In contrast, mature trees at the edge of the gaps had only a portion

115
of their crowns exposed to the new gap, with significant portions of their crowns still
competing with neighboring trees, thus possibly reducing any potential release
response relative to saplings. Tree growth increases in proportion to the amount of
growing space available to each tree; when growing space is fully occupied, then tree
growth resumes to its original rate of growth (Oliver and Larson 1996). In addition,
saplings must maximize their growth for successful accession into the canopy, which
they achieve by their ability to capture belowground resources and maintaining
foliage. Whereas, overstory trees, who have successfully established in the canopy,
do not need to maximize their growth but maintain resistance to biotic stresses,
reproductive output, and conservation of mineral resources (Day et al. 2002).
Many studies in natural disturbance history use the release criteria established
by Lorimer and Frelich (1989) of a major growth response of 100% and a moderate
growth response of 50% for 15 years pre- and post-disturbance (Chokkalingam 1998).
This criterion was also applied to a study on the radial growth response of trees in a
selectively logged old-growth forest in the Allegheny plateau, where the majority of
the sample trees in the study showed a moderate release of 50% with 15 years pre-
and post-disturbance rather than a major release (100%). The dominant trees in this
forest included Fagus grandifolia Ehrh., T. canadensis, A. rubrum, and Quercus
species (Orwig and Abrams 1999). The results of our study indicate that 50% growth
response with seven years pre- and post-disturbance in overstory gap edge trees
provided the best indicator of gap creation in our study. The duration of the growth
response in this study was limited to seven growing seasons after harvest, but many
of the trees indicated a decrease in growth in the last two growing seasons. Hence, a

116
seven-year duration of growth response was an adequate time period for identifying a
release response to a gap creation event.
However, a study of the radial growth response of Picea abies (L.) Karst. to
different thinning intensities utilized a ring-area series as a release criterion rather
than annual ring increment (Misson et al. 2003); this criterion was used to
differentiate the effects of climate and the tree physiological response to
environmental variation from a growth release due to thinning. Their results indicate
that the duration of growth increases due to thinning (4 to 15 years) was related to
structural adaptation of the tree (such as crown enlargement) and the physiological
acclimation (such as respiration) of the tree to the open canopy area (Misson et al.
2003).
3.5.1.2. Predictive Variables for Release
T. canadensis responded most frequently for both harvest gap edge trees and
saplings for all release response criteria, except for the ≥200% response in harvest
gap saplings, but this species was not a statistically significant variable in predicting
the probability of release. B. papyrifera provided the least number of releases in
harvest gap edge trees, and logistic regression indicates that B. papyrifera was a
significant variable in not producing a release. Hence, T. canadensis and A. rubrum
were more likely to indicate a canopy disturbance in harvest gap edge trees, because
both A. rubrum and T. canadensis respond well to canopy thinning after a period of
suppression (Burns and Honkala 1990). Because B. papyrifera is a shade-intolerant
tree and establishes dominance early in the life of a stand (Burns and Honkala 1990),
the B. papyrifera in this study may not have been able to release because of a long

117
period of suppression prior to gap harvesting. Furthermore, allocation of
photosynthates to leaf and root production may have inhibited an increase in stem
growth after release (Pothier and Maroglis 1990). A study on growth rates in B.
papyrifera after commercial thinning (although not producing true gaps) support
these results where B. papyrifera responded to the harvest in the first growing season,
but the release was not sustained in the second growing season (Pothier and Margolis
1990). Harvest gap T. canadensis saplings responded more frequently than A.
balsamea saplings, but tree species was not a significant variable in predicting a
release in saplings. Both T. canadensis and A. balsamea are very shade-tolerant, and
respond well with an increase in stem growth after new canopy openings (Pothier and
Margolis 1990; Burns and Honkala 1990).
Edge trees and saplings in large harvest gaps (941 m2 – 2,169 m2) responded more
frequently than edge trees and saplings in small gaps (108 m2 – 472 m2), and logistic
regression indicated that trees in larger gaps were an important variable in predicting
a release than trees in smaller gaps. This result was statistically significant for all
release response criteria. Because of the high number of saplings not showing
releases in small harvest gaps, perhaps the release threshold criterion used for larger
gaps was too high for detecting a release response in small gaps. The number of
closed canopy trees not showing a release determined the threshold for the release
criteria. However, as mentioned previously, many closed canopy trees exhibited an
erroneous release due to high growth rates after 1995. Therefore, the release response
threshold we used was biased towards large harvest gaps since the trees in small

118
harvest gaps and under the closed canopy were demonstrating similar growth results
for the period 1995-2001. This pattern is discussed in more detail in section 3.4.3.
Harvest gap saplings responded more frequently for all three release criteria than
harvest gap edge trees, indicating that sapling radial growth is a better indicator of
gap formation dates than edge tree radial growth. However, the size of the saplings
and edge trees in harvest gaps did not predict the probability of response. This result
is inconsistent with Dahir and Lorimer (1996). In their study of canopy gap
formation in northern hardwood forests, they collected some cores in large trees (i.e.,
40 to 60 cm dbh), but they assumed that smaller trees (i.e., < 40 cm dbh) would
provide a better indication of canopy disturbance. Hence, the probability of a tree
responding to the harvest gap is likely due to 1) the species ability to respond to a
canopy disturbance, 2) the competitive position to acquire available growing space,
and 3) the amount of damage both belowground and aboveground caused by the
harvest or the falling of a canopy tree in the gap.
3.5.2. Release Response to Natural Gaps
The best release criterion for dating natural gaps was a 100% growth response
(i.e., Equation 1). The 200% growth response only dated one natural gap where at
least three saplings indicated a corresponding release. These gaps were known to
exist because they were selected for this study only if at least two canopy trees were
downed or standing dead, and the≥ 200% growth response release criteria did not
adequately detect natural gap formation. Nonetheless, other studies in other forest
types have shown that ≥ 200% growth response was adequate for detecting natural
gap formation dates. In a study with T. canadensis, current and former natural gaps

119
were identified in overstory trees by a four-fold increase in radial growth (i.e., 200%
growth response) for three or more years from the mean radial growth three years
prior to disturbance (Rankin and Tramer 2002). The area of the gaps ranged form 8
to 632 m2, but the mean gap size was 162 m2. Similarly, in a northern hardwood
forest, a 250% growth response identified natural gap formation (Henry and Swan
1974). The success of these release criteria in their study suggests that the duration
for release in this study (i.e., seven years pre- and post-disturbance) may have been
too large to detect a date of natural gap formation.
Regardless of other studies’ success with the ≥ 200% growth response, a
100% growth response release criteria is a well-accepted and successful means for
dating natural gaps, especially in the Acadian forest. Typically, in the literature for
disturbance history studies, a conservative release has been defined as ≥100% growth
increase for 15 years pre- and post-disturbance and a moderate release has been
defined as ≥ 50% release for 15 years pre- and 10-15 years post-disturbance (Lorimer
and Frelich 1989; Frelich and Lorimer 1991; Frelich and Graumlich 1994). Dahir and
Lorimer (1996) found that 40% growth response for eight years pre-disturbance and
five years post-disturbance was sufficient to indicate the probable date of natural gap
formation, particularly because the gaps in this study were <50 m2 and were formed
in the last 11 years before the study. These criteria have allowed an accurate
estimation of canopy accession for a tree within a natural gap.
The differences in the growth response between harvest gaps saplings and
natural gap saplings also can be explained by differences in the origin of the
disturbance. There are two common types of natural gaps, defined as the death of at
120
least two canopy trees, in this study. A tree fall gap is one where a tree has fallen or
uprooted; a snag gap is one where the stem has broke or the tree slowly died standing
due to natural mortality. The significance of the two types of natural gaps is the
magnitude of the disturbance and the area of canopy opening caused by the mortality.
Furthermore, a gap is rarely limited to one event, because multiple disturbance agents
may occur in the same gap and/or on the same tree (Worrall and Harrington 1988).
Therefore, the slow, natural death of the canopy trees produced a much smaller
growth response in natural gap saplings than the harvest gap saplings. Our gap
harvesting of more than two canopy trees created a more abrupt disturbance and
generally a larger canopy opening than occurred with the natural gaps.
3.5.3. Erroneous and Absent Releases
The majority of erroneous releases in closed canopy trees were found using an
average gap radial growth release threshold (≥ 1.0 mm average radial growth 1995-
2001). Forty-six percent of the closed canopy saplings and 32% of closed canopy
overstory trees had ≥ 1.0 mm radial growth during the same growing period as the
post-harvest growing period in harvest gaps (1995-2001). Although the number of
closed canopy overstory trees demonstrating a response with this criterion was
relatively low, 32% of large harvest gap edge trees also indicated a release using this
criterion. This result creates some difficulty in differentiating what is a release
response from a gap creation and what is an increase in growth due to a shift to more
favorable climatic conditions.
The short duration for defining a release (seven years pre- and post-harvest)
may account for this discrepancy. Having a long period of sustained increase in

121
radial growth would screen out patterns caused by short-term climatic fluctuations
(Frelich 2002; Lorimer et al. 1988). Although mean temperatures for the growing
season from 1996-1998 in Maine were below average, mean precipitation for the
growing season for this period in Maine was above average (NCDC 2003; NADP
2003). The cool, moist growing seasons may account for the high growth rates for
closed canopy trees during this period. Furthermore, below average mean
precipitation for the year of 1995 following above average mean precipitation from
1996-1998 may indicate a growth response following a drought in the closed canopy
trees.
Many harvest gap saplings and edge trees did not indicate any release
response, especially saplings in small harvest gaps. More than half of the saplings did
not show a release using all three release criteria. There are several possible reasons
to account for these absent releases. First, gap size was a significant variable in
predicting whether a tree showed a release for all harvest gap saplings and edge trees
for all release criteria. Second, logging damage to the saplings (e.g., root or crown
damage), which was no longer apparent at time of data collection, may account for
the absence of release. Finally, trees that were in the canopy at the time of coring
may have been in a poor competitive position and unable to allocate photosynthate to
the growth of stemwood (Frelich 2002).
The greatest number of trees in harvest gaps not showing releases were found
using both percent response and average post-disturbance growth (i.e., gap growth)
release criterion, where only 19% of harvest gap edge trees and 37% of harvest gap
saplings indicated a release at the time of harvest. Although it effectively eliminated

122
erroneous releases by closed canopy trees, this criterion appears to be too strict, since
it excludes many trees known to have shown a growth response in harvest gaps.
Since the formation date and origin of the disturbance is known for the trees in
harvest gaps, using this criterion would provide misleading results by underestimating
the formation dates of natural gaps.
3.6. Literature cited
Abrams, M.C. and Copenheaver, C.A. 1999. Temporal variation in species recruitment and dendroecology of an old-growth white oak forest in the Virginia Piedmont, USA. For. Ecol. Man. 124: 275-284
Battles, J.J. and Fahey, T.J. 2000. Gap dynamics following forest decline: a case
study of red spruce forests. Ecol. Appl. 10: 760-774 Brissette, J.C. and Kenefic, L.S. 1999. Eastern hemlock response to even- and
uneven-age management in the Acadian forest: results from the Penobscot Experimental Forest Long-term Silvicultural Study. Pp. 23-33 in K.A. McManus, K.S. Shields, and D.R. Soutso, eds. Proceedings: Symposium on sustainable management of hemlock ecosystems in eastern North America; 1999 June 22-24, USDA Forest Service Gen Tech. Report NE-267
Burns, R.M. and Honkala, B.H. tech.cords. 1990. Silvics of North America: 1.
Conifers; 2. Hardwoods. Agriculture Handbook 654. USDA Forest Service, Washington, D.C.
Canham, C.D. 1989. Different responses to gaps among shade-tolerant tree
species. Ecol. 70: 548-550 Canham, C.D., Denslow, J.S., Platt, W.J., Runkle, J.R., Spies, T.A., and White, P.S.
1990. Light regimes beneath closed canopies and tree-fall gaps in temperate and tropical forests. Can. J. For. Res. 20: 620-631
Chokkalingam, U. 1998. Measuring and estimating small-scale gap disturbance
parameters: a review and statistical comparison of prevalent methodolgy. In Spatial and Temporal Patterns and Dynamics in old-growth northern hardwood and mixed forests of northern Maine. Ph. D. dissertation, University of Maine, Orono, ME
Dahir, S. and Lorimer, C.G. 1996. Variation in canopy gap formation among
developmental stages of northern hardwood stands. Can. J. For. Res. 26: 1875-1892

123
Day, M.E., Greenwood, M.S., and Diaz-Sala, C. 2002. Age- and size-related trends
in woody plant shoot development: regulatory pathways and evidence of genetic control. Tree Phys. 22: 507-513
Duchesneau, R., Lesage, E., Messier, C., and Morin, H. 2001. Effects of light and
intraspecific competition on growth and crown morphology of two size classes of understory balsam fir saplings. For. Ecol Man. 140: 215-225
Frelich, L.E. 2002. Forest dynamics and disturbance regimes. Studies from
temperate evergreen-deciduous forests. Cambridge University Press. New York, NY
Frelich, L.E. and Lorimer, C.G. 1991. Natural disturbance regimes in hemlock-
hardwood forests of the upper Great Lakes region. Ecol. Mon. 61: 145-164
Frelich, L.E. and Graumlich, L.J. 1994. Age class distribution and spatial patterns in
an old-growth hemlock-hardwood forest. Can. J. For. Res. 24: 99-120 Henry, J.D. and Swan, J.M.A. 1974. Reconstructing forest history from live and
dead plant material-an approach to the study of forest succession in southwest New Hampshire. Ecol. 55: 772-783
Hibbs, D.E. 1982. Gab dynamics in a hemlock-hardwood forest. Can. J. For. Res.
12: 522-527 Lorimer, C.G. 1980. Age structure and disturbance history of a southern
Appalachian virgin forest. Ecol. 61: 1169-1184 Lorimer, C.G. 1985. Methodological considerations in the analysis of forest
disturbance history. Can. J. For. Res. 15: 200-213 Lorimer, C.G. and Frelich, L.E. 1989. A methodology for estimating canopy
disturbance frequency and intensity in dense temperate forests. Can J. For. Res. 19: 651-663
McCaughey, W.W., and Schmidt, W.C.. 1982. Understory tree release following
harvest cutting in spruce-fir forests of the Intermountain West. USDA For. Serv. Res. Pap. InT-285.
McClure, J.W., Lee, T.D., and Leak, W.B. 2000. Gap capture in northern
hardwoods: patterns of establishment and height growth in four species. For. Ecol. Man. 127: 181-189

124
Misson, L., Vincke, C., and Devillez, F. 2003. Frequency responses of radial growth series after different thinning intensities in Norway spruce (Picea abies (L.) Karst.) stands. For. Ecol Man. 177: 51-63
Mladenoff, D.J. 1990. The relationship of the soil seed bank and understory
vegetation in an old-growth northern hardwood-hemlock treefall gaps. Can J. Bot. 68: 2714-2721
National Climate Data Center (NCDC). 2003.
http://lwf.ncdc.noaa.gov/oa/climate/research/cag3/ME.html Neter, J., Kutner, M.H., Nachtsheim, C.J., and Wasserman, W. 1996. Applied Linear
Statistical Models. Fourth Edition. McGraw-Hill Companies, Inc. Boston, MA Nowacki, G.J. and Abrams, M.D. 1997. Radial-growth averaging criteria for
reconstructing disturbance histories from presettlement-origin oaks. Ecol. Mon. 67: 225-249
Oliver, C.D. and Larson, B.C. 1996. Forest Stand Dynamics. John Wiley and Sons,
Inc., N.Y. Oriwg, D. A. and Abrams, M.D. 1999. Impacts of early selective logging on the
dendroecology of an old-growth, bottomland hemlock-white pine-northern hardwood forest on the Allegheny Plateau. J. Tor. Bot. Soc. 126: 234-244
Pothier, D. and Margolis, A. 1991. Analysis of growth and light interception of
balsam fir and white birch sapling following precommercial thinning. Ann. Sci. For. 48: 123-132
Rankin, W.T. and Tramer, E.J. 2002. Understory succession and the gap
regeneration cycle in a Tsuga canadensis forest. Can. J. For. Res. 32: 16-23 Runkle, J. R. 1992. Guidelines and Sample Protocol for Sampling Forest Gaps.
USDA For. Serv. Pap. PNW-GTR-283 Seymour, R.S. and Day, M.E. 1997. Ecologically based expanding-gap silvicultural
systems in the Acadian Forest. Understanding changed in managed and unmanaged forest. In Proc. First Biannual North American Forest Ecology Workshop. North Carolina State University, Raleigh, NC June 24-26, 1997
Worrall, J.J. and Harrington, T.C. 1988. Etiology of canopy gaps in spruce-fir forests at Crawford Notch, New Hampshire. Can. J. For. Res. 18: 1463- 1469

125
Chapter 4
EPILOGUE
4.1. Introduction
Gap harvesting as a means of forest management that strives to emulate the
natural disturbance patterns of the Acadian forest achieves several goals in the forest
landscape. The Forest Ecosystem Research Program (FERP) strives to manage the
Acadian forest in a manner that is more like the natural disturbance regime by
harvesting in an expanding gap shelterwood harvest with reserve trees. The
objectives of the expanding-gap harvest treatments include 1) increasing species
diversity, 2) diversifying the forest structure, 3) naturally regenerating commercially
valuable tree species, and 4) maintaining the presettlement forest structure. These
objectives were effectively accomplished four years after harvest based on the study
of vegetation dynamics presented here. In our study, expanded-gap shelterwood
harvesting 1) increased stand structural diversity by introducing a significant number
of new seedlings and saplings in harvest gaps, 2) increased plant diversity by
introducing 112 species found only in harvest gaps, 3) encouraged the regeneration of
commercially valuable tree species such as Picea rubens and Pinus strobus, and 4)
maintained common forest understory plant species, such as Maianthemum
canadense and Trientalis borealis, after the harvest. Nonetheless, several ruderal,
highly competitive species were introduced after the harvest possibly compromising
the successful regeneration of commercially valuable tree species.

126
4.2. Management Implications of Gap Harvesting
Given the results of the effects of expanding gap shelterwood harvest on
vegetation dynamics and tree regeneration, a forester interested in forest management
based on natural disturbanceshould consider two important objectives and their
management implications, the size of the harvest gap and the regeneration of desired
species.
4.2.1. Gap Size
Harvest gaps in the vegetation dynamics study ranged in size from 100 m2-
2100 m 2, whereas natural gaps ranged in size from 115 m2 – 518 m2. The differences
in gap size suggest that the harvest treatments created larger gaps than are found in
natural gaps in this forest type. Because the harvest treatment was designed
according to old-growth gap dynamics, the differences between harvest gap and
natural gap size are likely due to the size of trees. Younger forests generally contain
smaller trees with smaller crowns in comparison to old-growth forests, and the natural
mortality of these trees in younger forests create smaller canopy openings. Although
a more precise harvest history of the Penobscot Experimental Forest (PEF) does not
exist in the areas of this study, the PEF has a history of repeated cuttings beginning in
the late 17th century indicating that this forest is a mature, secondary forest.
According to the literature, old-growth natural tree fall gaps in eastern forests range in
size from 37 m2- 2000 m2 (Dahir and Lorimer 1996; Runkle 1982; Battles and Fahey
200), whereas natural tree fall gaps in mature stands (i.e., about 60 years old) range
from 9 – 209m2 (Dahir and Lorimer 1996; Krasny and Whitmore 1992; Kimball et al.

127
1995). Furthermore, a study of natural gaps in a northern hardwood forest suggested
that harvested gaps > 200 m2 in this forest type rarely emulate natural treefall gap
size, but gaps in this study were large enough to regeneration economically valuable
shade tolerant tree species (Dahir and Lorimer 1996). Therefore, if the forester’s goal
is to create harvest gaps that are most similar to natural tree fall gaps, then the size of
the harvested gap should be considered given the surrounding forest matrix. The
design of the harvest gaps should be based on the species composition of the forest
landscape to determine the type of species creating the natural gaps, the size of the
largest trees to determine the average size of a gap if several were to fall naturally,
and the frequency of gap occurrence in natural systems to determine how frequently
harvest gaps should be formed on a yearly basis.
4.2.2. Desirable Species
If particular species are desired for regeneration in harvest gaps, both
economically valuable tree species as well as any possible endangered forest plants,
then gap size, again, is important to consider. Overall, in this study, the magnitude of
the disturbance played a significant role in creating differences in the species
composition between harvest gaps and natural gaps. Natural gap canopy openings
effectively allowed enough light for high plant abundance values similar to harvest
gap plant abundance, but canopy openings were not large enough to introduce a large
number of new species as witnessed in harvest gaps (i.e., 112 species out of 195
identified species only in harvest gaps). Furthermore, three Rubus species, a highly
competitive and robust plant, were of the 10 most important species in harvest gaps

128
whereas, natural gaps had one Rubus species present, R. pubescens, and it was of little
importance to natural gap regeneration.
There two possible explanations for this result. First, many natural gaps are
formed by the slow death of a canopy tree producing a standing snag with minimal
disturbance to the forest floor and/or the upper canopy. The slow forming natural
nature of these gaps did not create an abrupt change in the microenvironment (i.e.,
influx of resources and soil disturbance) to introduce many early successional species.
Harvest gaps in this study were significantly larger than natural gaps, and they were
formed by an abrupt single disturbance causing a significant influx of resources.
Second, the lateral extension of the natural gap canopy trees quickly reduces the
opportunity for early successional species to exist. Therefore, the combination of
large gap area as well as the magnitude of the harvest certainly contributed to the
differences in species composition between harvest and natural gaps, and the presence
of many early successional, ruderal species could potentially inhibit the growth of
commercially valuable tree species.
Large harvest gaps in this study effectively regenerated commercially
valuable tree species, but the success of these tree species accessing the canopy is yet
to be determined. Hence, if the forester wants to harvest in large gaps (i.e., > 500 m2)
(likely a simpler and more economically feasible option), then further management of
highly competitive species is likely to be required in order to ensure canopy accession
of valuable tree species. Nonetheless, large harvest gaps did effectively increase the
plant diversity of the forest landscape, and large canopy openings could be
129
maintained if plant diversity is the goal. However, smaller gaps (i.e. < 500 m 2) have
effectively regenerated valuable tree species in this study and others (Dahir and
Lorimer 2000; Pickett and White 1985; Mladenoff 1990; Runkle 1981), and little
management of the forest understory is required since most highly competitive
species were not able to colonize in smaller gaps. Nonetheless, the forester must
consider whether harvesting larger gaps and managing undesirable species as a result
of the larger gap area is economically viable when compared to the cost and benefits
managing smaller gaps with less further management. Finally, harvest during the
winter period with adequate snow cover minimizes soil disturbance in the harvest
gap, this method both reduces the colonization of ruderal, highly competitive species
that require highly disturbed soils and sustains the present composition of the forest
understory in the harvest gap.
4.3. Improvements
Based on the results and limitations encountered in this study, I suggest three
improvements to the future researcher. For examining the vegetation dynamics study
in the future, I suggest two changes in vegetation sampling. First, when estimating
plant percent cover in the sample plots, it would be helpful to differentiate height
classes for the species. For example, Cornus canadensis often forms large mats on
the ground encompassing a potential large percent cover in the data collection,
whereas Aralia nudicaulis, a much taller and larger bodied herbaceous species,
encompasses a potential large percent cover in the data collection for the same sample
plot. Differentiating between the height of these two species by collecting the percent

130
cover of a species in a given height class would allow better qualitative interpretation
on the importance of each species in the sample area. Second, I suggest sampling in a
method that creates equal sample area for every gap and transect. We now know that
plant diversity and composition was not correlated to the location within the gap, and
that plant abundance was greatest in the gap center for only the largest gaps.
Furthermore, the presence of reserve trees likely confounded any trend that may have
occurred. Equal sample size could be accomplished by establishing sample plots at
the two extreme environments of the gap, the center and the edge. Unequal sample
area provided a great deal of difficulty in assessing species diversity and evenness
and made interpretations of the data difficult.
In the tree growth response to harvest gaps (i.e., chapter three), I suggest two
improvements. First, tree cores that were collected should have been cored to the
pith. Because an incomplete core was taken, cross dating could not be performed
preventing more accurate results in establishing gap formation dates in the natural
gaps. Furthermore, tree age may be a factor in determining a growth response to
canopy openings, and this variable could have been easily addressed if trees were
cored to the pith. Second, when measuring tree core and cross-section growth rings, I
suggest using the Velmex microscope. Although WINDendro is a widely-used and
accepted means of measuring growth rings, much time was wasted correlating
measurement results from the Velmex to the measurement results in all the hardwood
trees, many of which were very difficult to discern. I used WINDendro because of its
familiarity, ease of use, and consistency with my other softwood cores and cross-

131
sections. The Velmex microscope is better at detecting the hard-to-see hardwood
growth rings.

BIBLIOGRAPHY Abrams, M.C. and Copenheaver, C.A. 1999. Temporal variation in species
recruitment and dendroecology of an old-growth white oak forest in the Virginia Piedmont, USA. For. Ecol. Man. 124: 275-284
Battles, J.J. and Fahey, T.J. 2000. Gap dynamics following forest decline: a case
study of red spruce forests. Ecol. App. 10: 760-774 Beckage, B., Clark, J.S., Clinton, B.D., and Haines, B.L. 2000. A long-term study of tree seedling recruitment in southern Appalachian forests: The effects of
canopy gaps and shrub understories. Can. J. For. Res. 30: 1617-1631 Brissette, J.C. and Kenefic, L.S. 1999. Eastern hemlock response to even- and
uneven-age management in the Acadian forest: results from the Penobscot Experimental Forest Long-term Silvicultural Study. Pp. 23-33 in K.A. McManus, K.S. Shields, and D.R. Soutso, eds. Proceedings: Symposium on sustainable management of hemlock ecosystems in eastern North America; 1999 June 22-24, USDA Forest Service Gen Tech. Report NE-267
Burns, R. M. and Honkala, B.H. 1990. Silvics of North America: 1. Conifers; 2.
Hardwoods. Agriculture Handbook 654. U.S. Departmemt of Agriculture, Forest Service, Washington, DC
Busing, R.T. and White P.S. 1997. Species diversity and small-scale disturbance
in an old growth temperate forest: A consideration of gap partitioning. Oikos. 78: 562-568
Canham, C.D. 1988. Growth and canopy architecture of shade-tolerant trees
response to canopy gaps. Ecol. 69: 786-795 Canham, C.D. 1989. Different responses to gaps among shade-tolerant tree
species. Ecol. 70: 548-550 Canham, C.D., Denslow, J.S., Platt, W.J., Runkle, J.R., Spies, T.A., and White, P.S.
1991. Light regimes beneath closed canopies and tree-fall gaps in temperate and tropical forests. Can. J. For. Res. 20: 620-631
Chokkalingam, U. 1998. Measuring and estimating small-scale gap disturbance
parameters: a review and statistical comparison of prevalent methodology. In Spatial and Temporal Patterns and Dynamics in old-growth northern hardwood and mixed forests of northern Maine. Ph. D. dissertation, University of Maine, Orono, ME

Clinton, B. D., Boring, L.R., and Swank, W.T. 1994. Regeneration patterns in
canopy gaps of mixed-oak forests of the Southern Appalachians: Influences of topographic position. Am. Mid. Nat. 132: 308-319
Coates, K.D. 1999. Conifer seedling response to northern temperate forest gaps.
For. Ecol Man. 4820: 1-21 Collins, B.S. and Pickett, S.T.A. 1988a. Response to herb layer cover to
experimental canopy gaps. Am. Mid. Nat. 119: 282-290 Collins, B.S. and Pickett, S.T.A. 1988b. Demographic response of herb layer in
species to experimental canopy gaps in a northern hardwood forest. J. Ecol. 76: 437-450 Connell, J.H. 1989. Some processes affecting the species composition in forest
gaps. Ecol. 70: 560-561 Dahir, S. and Lorimer, C.G. 1996. Variation in canopy gap formation among
developmental stages of northern hardwood stands. Can. J. For. Res. 26: 1875-1892
Day, M.E., Greenwood, M.S., and Diaz-Sala, C. 2002. Age- and size-related trends
in woody plant shoot development: regulatory pathways and evidence of genetic control. Tree Phys. 22: 507-513
Della-Bianca, L. and Beck, D.E. 1985. Selection management in southern Appalachian hardwoods. S. J. App. For. 9: 161-196 Denslow, J.S. 1995. Disturbance and diversity in tropical rain forest: the density
effect. Ecol. App. 5: 962-968 Duchesneau, R., Lesage, E., Messier, C. and Morin, H. 2001. Effects of light and
intraspecific competition on growth and crown morphology of two size classes of understory balsam fir saplings. For. Ecol. Man. 140: 215-225
Dynesius, M. and Jonsson, B.G. 1991. Dating uprooted trees: comparison and
application of eight methods in a boreal forest. Can. J. For. Res. 21: 655-665 Ehrenfeld, J.G. 1980. Understory response to canopy gaps of varying sizes in a
mature oak forest. Bull. Torr. Bot. 107: 29-41 Fajvan, M.A. and Seymour. R.S. 1993. Canopy stratification, age structure, and
development of multicohort stands of eastern white pine, eastern hemlock, and red spruce. Can. J. For. Res. 23: 1799-1809

Foster, D.R. 1988. Disturbance history, community organization and vegetation
dynamics of the old-growth Pisgah forest, south-western New Hampshire, U.S.A. J. Ecol. 76 : 105-134
Frelich, L.E. 2002. Forest dynamics and disturbance regimes. Studies from
temperate evergreen-deciduous forests. Cambridge University Press. New York, NY
Frelich, L.E. and Lorimer, C.G. 1991. Natural disturbance regimes in hemlock-
hardwood forests of the upper Great Lakes region. Ecol. Mon. 61: 145-164 Frelich, L.E. and Graumlich, L.J. 1994. Age class distribution and spatial patterns in
an old-growth hemlock-hardwood forest. Can. J. For. Res. 24: 99-120 41: 382-392
Haines, A. and Vining, T.F. 1998. Flora of Maine: A manual for identification of
native and naturalized vascular plants of Maine. V.F. Thomas Co. Bar Harbor, ME
Hansen, A. J., Spies, T.A., Swanson, F.J., and Ohmann, J.L. 1991. Conserving
biodiversity in managed forest; lessons form natural forest. BioScience. 41: 382-392
Henry, J.D. and Swan, J.M.A. 1974. Reconstructing forest history from live and
dead plant material-an approach to the study of forest succession in southwest New Hampshire. Ecol. 55: 772-783
Hibbs, D.E. 1982. Gab dynamics in a hemlock-hardwood forest. Can. J. For. Res.
12: 522-527 Huenneke, L.F. 1983. Understory response to gaps caused by the death of Ulmus americana in Central New York, USA. Bull. Torr. Bot.. 110: 170-175 Hughes, J.W. and Fahey, T.J. 1991. Colonization dynamics of herbs and shrubs in
a disturbed northern hardwood forest. J. Ecol. 79: 605-617 Kimball, A.J., Whitham, J.W., Rudnicky, J.L., White, A.S., and Hunter, M.L. 1995.
Harvest-created and natural gaps in an oak-pine forest in Maine, Bull. Torr. Bot.122: 115-123
Krasny, M.E. and Whitmore, M.C. 1992. Gradual and sudden forest canopy gaps
in Alleghany northern hardwood forests. Can. J. For. Res. 22: 139-143

Laustsen, K.M. and Griffith, D.M. 2002. Third Annual Inventory Report on Maine’s Forests. USDA Forest Service, Northeastern Research Station. Appropriation no. 010 04A 666 022
Lautenschlager, R.A. 1999. Environmental resource interactions affect red raspberry growth and its competition with white spruce. Can. J. For. Res. 29: 906-916
Lorimer, C.G. 1977. The presettlement forest and natural disturbance cycle of
northeastern Maine. Ecol. 58: 139-148 Lorimer, C.G. 1985. Methodological considerations in the analysis of forest
disturbance history. Can. J. For. Res. 15: 200-213 Lorimer, C.G. 1980. Age structure and disturbance history of a southern
Appalachian virgin forest. Ecol. 61: 1169-1184 Lorimer, C.G. and Frelich, L.E. 1989. A methodology for estimating canopy
disturbance frequency and intensity in dense temperate forests. Can J. For. Res. 19: 651-663
Lunquist, J.E. and Beatty, J.S. 2002. A method for characterizing and mimicking
forest canopy gaps caused by different disturbances. For. Sci. 48: 582-594 Magurran, A.E. 1988. Ecological diversity and its measurement. Princeton
University Press, Princeton, NJ Maine Council on Sustainable Forest Management (MCSFM). 1996. Sustaining
Maine’s Forests: Criteria, Goals, and Benchmarks for Sustainable Forest Management. Maine Department of Conservation, Augusta, ME.
McCaughey, W.W. and Schmidt, W.C. 1982. Understory tree release following
harvest cutting in spruce-fir forests of the Intermountain West. USDA Forest Service Research. Paper. InT-285.
McClure, J.W., Lee, T.D., and Leak, W.B. 2000. Gap capture in northern
hardwoods: patterns of establishment and height growth in four species. For. Ecol. Man. 127: 181-189
McCune, B. and Mefford, M.J. 1999. PC-ORD. Multivariate analysis of
ecological data, Version 4. MjM Software Design, Glaneden Beach, Oregon, USA
McGarigal, K., Cushman, S., and Stafford, S. 2000. Multivariate Statistics
for Wildlife and Ecology Research. Springer-Verlag, Inc. New York, NY.

Misson, L., Vincke, C., and Devillez, F. 2003. Frequency responses of radial growth series after different thinning intensities in Norway spruce (Picea abies (L.) Karst.) stands. For. Ecol Man. 177: 51-63
Mladenoff, D.J. 1990. The relationship of the soil seed bank and understory
vegetation in an old-growth northern hardwood-hemlock tree fall gaps. Can. J. Bot. 68: 2714-2721
Moore, M.R. and Vankat, J.L. 1986. Response of the herb layer to the gap
dynamics of a mature beech-maple forest. Am. Mid. Nat. 115: 336-347 Muller, R.N. 1990. Spatial interrelationships of deciduous forest herbs. Bull. Torr.
Bot.117: 101-105 National Climate Data Center (NCDC). 2003.
http://lwf.ncdc.noaa.gov/oa/climate/research/cag3/ME.html NESFA 2001. The economic importance of Maine’s Forests. North East State
Foresters Association. Concord, NH Neter, J., Kutner, M.H., Nachtsheim, C.J., and Wasserman, W. 1996. Applied Linear
Statistical Models. Fourth Edition. McGraw-Hill Companies, Inc. Boston, MA Nowacki, G.J. and Abrams, M.D. 1997. Radial-growth averaging criteria for
reconstructing disturbance histories from presettlement-origin oaks. Ecol. Mon. 67: 225-249
Oliver, C.D. and Larson, B.C. 1996. Forest Stand Dynamics. John Wiley and Sons,
Inc., N.Y. Oriwg, D. A. and Abrams, M.D. 1999. Impacts of early selective logging on the
dendroecology of an old-growth, bottomland hemlock-white pine-northern hardwood forest on the Allegheny Plateau. J. Tor. Bot. Soc. 126: 234-244
Pharo, E.J. and Vitt, D.H. 2000. Local variation in bryophyte and macro-lichen
cover and diversity in montane forests of western Canada. Bryologyist. 103: 455-466
Phillips, D.L. and Shure, D.J. 1990. Patch-size effects on early succession in
Southern Appalachian forests. Ecol. 71: 204-212 Pothier, D. and Margolis, A. 1991. Analysis of growth and light interception of
balsam fir and white birch sapling following precommercial thinning. Ann. Sci. For. 48: 123-132

Poulson, T.L. and Platt, W.J. 1989. Gap light regimes influence canopy tree
diversity. Ecol. 70: 553-555 Quinby, P.A. 2000. First year impacts of shelterwood logging on understory
vegetation in an old-growth pine stand in central Ontario, Canada. Env. Cons. 27: 229-241
Rankin, W.T. and Tramer, E.J. 2002. Understory succession and the gap
regeneration cycle in a Tsuga canadensis forest. Can. J. For. Res. 32: 16-23 Ricklefs, R.E. 1977. Environmental heterogeneity and plant species diversity a
hypothesis. Am. Nat. 111: 376-381 Roberts, M.R. and Gilliam, F.S. 1995. Patterns and mechanisms of plant diversity in
forested ecosystems: implications for forest management. Ecol. App. 5: 969-977
Runkle, J.R. 1981. Gap regeneration in some old-growth forests of the eastern
United States. Ecol. 62: 1041-1051 Runkle, J.R. 1982. Patterns of disturbance in some old-growth mesic forests of
eastern North America. Ecol. 63: 1533-1546 Runkle, J.R. 1985. Disturbance regimes in temperate forests. In The ecology of
natural disturbance and patch dynamics. Academic Press, Inc., Orlando, FL. Runkle, J. R. 1992. Guidelines and Sample Protocol for Sampling Forest Gaps.
USDA For. Serv. Pap. PNW-GTR-283 Schumann, M.E. 1999. The effects of harvest-created gaps on plant species
diversity, composition, and abundance in a Maine Oak-Pine forest. MS thesis, University of Maine, Orono, ME
Schumann, M.E., White, A.S., and Witham, J.W. 2003. The effects of harvest-
created gaps on plant species diversity, composition, and abundance in a Maine oak-pine forest. For. Ecol. Man. 176: 532-561
Seymour, R.S., White, A.S., and deMaynadier, P.G. 2002. Natural disturbance
regimes in northeastern North America-evaluating systems using natural scales and frequencies. For. Ecol. Man. 155: 357-369
Seymour, R.S. and Hunter, M.L. 1999. Principles of ecological forestry In Maintaining biodiversity in forest ecosystems. Edited by M. L. Hunter.

Cambridge University Press, NY. Seymour, R.S. and Day, M.E. 1997. Ecologically based expanding-gap silvicultural
systems in the Acadian Forest. Understanding changed in managed and unmanaged forest. In Proc. First Biannual North American Forest Ecology Workshop. North Carolina State University, Raleigh, NC June 24-26, 1997
Seymour, R.S. and Day, M.E. 1996. Application of ecologically based expanding-
gap silviculture systems in the Acadian Forest (Poster Presentation). 14 North American Forest Biology Workshop. June 16-20, Université Laval, Quebec, P.Q. Canada.
Seymour, R.S. and Hunter, M.L. 1992. New Forestry in eastern spruce-fir forests:
principles and applications to Maine. MAFES Misc. Pub. 716. Steel, R.G., Torrie, J.H., and Dickey, D.A. 1997. Principles and procedures of
statistics: A biometrical approach. Third Edition. WCB/ McGraw-Hill, Boston, MA. 666 pp.
Thompson, J.T. 1980. Tree falls and colonization patterns of temperate forest
herbs. Amer. Mid. Nat. 104: 176-184 USDA, NRCS. 2002. The PLANTS Database, Version 3.5 (http://plants.usda.gov).
National Plant Data Center, Baton Rouge, LA 70874-4490 USA Wagner, R.G., Bowling, E.H., and Seymour, R.S. 2003. Assessing silviculture
research priorities for Maine using wood supply analysis. Maine Agricultural and Forest Experiment Station Technical Bulletin 186.
Wagner, R.G. and Ter-Mikaelian, M.T. 1999. Comparison of biomass component
equations for four species of northern coniferous tree seedlings. Ann. For. Sci. 56: 193-199
Webster, C.R., and Lorimer, C.G. 2002. Single-tree versus group selection in
hemlock-hardwood forests: Are smaller openings less productive? Can. J. For. Res. 32: 591-604
Whitmore, T.C. 1989. Canopy gaps and the two major groups of forest trees.
Ecol. 70: 536-538 Whittaker, R.H. 1975. Communities and Ecosystems. Macmillan Publishing Co.,
Inc., New York, NY Worrall, J.J. and Harrington, T.C. 1988. Etiology of canopy gaps in spruce-fir

forests at Crawford Notch, New Hampshire. Can. J. For. Res. 18: 1463- 1469

Appendix: The mean cover and mean frequency of all species by gap origin. Mean cover is calculated by the mean percent cover in
a gap averaged over all harvest gaps, for example. Mean frequency is the frequency of a species in a gap (number of times a species
occurred in a gap divided by the number of sample plots) averaged over all harvest gaps, for example.
Harvest Gaps Natural Gaps Closed Canopy Species Mean % Cover Mean Frequency Mean % Cover Mean Frequency Mean % Cover Mean FrequencyAbies balsamea 8.418 0.772 10.250 0.908 5.951 0.728 Acer pennsylvanicum 0.001 0.001 0.002 0.007 0.009 0.022 Acer rubrum 8.936 0.953 0.276 0.801 0.108 0.652 Acer saccharum 0.125 0.019 0.222 0.123 0.175 0.196 Acer spicatum 0.002 0.002 0.000 0.000 0.000 0.000 Actaea rubra 0.000 0.000 0.000 0.000 0.018 0.022 Alnus incanca 0.288 0.049 0.000 0.000 0.000 0.000 Amelanchier laevis 0.000 0.002 0.000 0.000 0.000 0.000 Amelanchier species 0.002 0.014 0.002 0.022 0.002 0.022 Anapahlis margaritacea 0.006 0.005 0.000 0.000 0.000 0.000 Aralia hispida 0.029 0.018 0.000 0.000 0.000 0.000 Aralia nudicaulis 3.046 0.354 1.430 0.415 0.165 0.098 Aralia spinosa 0.005 0.012 0.000 0.000 0.000 0.000 Arisaema triphyllum 0.007 0.002 0.019 0.020 0.004 0.033 Asplenium species 0.000 0.004 0.000 0.000 0.000 0.000 Asplenium trichomanes 0.000 0.004 0.000 0.000 0.000 0.000 Aster radula 0.004 0.002 0.000 0.000 0.000 0.000 Aster species 0.001 0.010 0.000 0.000 0.000 0.000 Athyrium filix-femina 0.087 0.063 0.011 0.011 0.000 0.000 Betula alleghaniensis 0.026 0.042 0.000 0.000 0.000 0.000

Appendix cont’d
Harvest Gaps Natural Gaps Closed Canopy Species Mean % Cover Mean Frequency Mean % Cover Mean Frequency Mean % Cover Mean Frequency
Betula papyrifera 0.750 0.458 0.014 0.072 0.000 0.087 Betula populifolia 0.002 0.003 0.000 0.000 0.011 0.000 Betula species 0.005 0.017 0.000 0.000 0.000 0.000 Calystegia sepium 0.000 0.000 0.054 0.022 0.000 0.000 Circaea alpina 0.000 0.000 0.011 0.007 0.000 0.000 Clintonia borealis 0.014 0.032 0.000 0.000 0.000 0.000 Coptis trifolia 0.107 0.049 0.004 0.011 0.000 0.000 Cornus canadensis 0.402 0.116 0.004 0.022 0.000 0.033 Corylus americana 0.057 0.020 0.152 0.011 0.000 0.000 Corylus cornuta 0.119 0.025 0.135 0.087 0.007 0.022 Cypripedium acaule 0.001 0.002 0.000 0.000 0.122 0.000 Cystopteris species 0.000 0.004 0.000 0.000 0.000 0.000 Dennstaedtia punctilobula 0.006 0.018 0.000 0.000 0.000 0.000 Diervilla lonicera 0.007 0.012 0.000 0.000 0.000 0.000 Doellingeria umbellata 0.001 0.006 0.000 0.000 0.000 0.000 Doellingeria umbellata 0.004 0.002 0.000 0.000 0.000 0.000 Dryopteris cristata 0.000 0.002 0.201 0.071 0.000 0.000 Dryopteris intermedia 0.036 0.016 0.252 0.109 0.000 0.000 Dryopteris marginalis 0.004 0.006 0.000 0.000 0.000 0.000 Dryopteris species 0.008 0.049 0.048 0.038 0.000 0.043 Epilobium angustifolium 0.001 0.009 0.000 0.000 0.071 0.000 Epilobium ciliatum 0.000 0.004 0.000 0.000 0.000 0.000 Epilobium leptophyllum 0.001 0.002 0.000 0.000 0.000 0.000 Epipactis heeleborine 0.000 0.002 0.000 0.000 0.000 0.000 Equisetum arvense 0.002 0.006 0.000 0.000 0.000 0.000 Equisetum pratense 0.001 0.003 0.013 0.022 0.000 0.000

Appendix cont’d
Harvest Gaps Natural Gaps Closed Canopy Species Mean % Cover Mean Frequency Mean % Cover Mean Frequency Mean % Cover Mean FrequencyErechtites hieraciifolia 0.002 0.002 0.000 0.000 0.000 0.000 Erysimum cheiranthoides 0.000 0.002 0.000 0.000 0.000 0.000 Euphorbia species 0.000 0.002 0.000 0.000 0.000 0.000 Euthamia graminifolia 0.012 0.031 0.000 0.000 0.000 0.000 Euthamia tenuifolia 0.006 0.019 0.003 0.011 0.000 0.000 Fagus grandifolia 0.400 0.062 0.343 0.098 0.000 0.000 Fallopia convolvulus 0.001 0.001 0.000 0.000 0.000 0.000 Fallopia scandens 0.000 0.004 0.000 0.000 0.000 0.000 Fragaria virginiana 0.000 0.000 0.013 0.036 0.036 0.000 Fraxinus americana 0.060 0.079 1.859 0.304 0.000 0.076 Fraxinus nigra 0.036 0.012 0.000 0.000 0.216 0.000 Fraxinus species 0.141 0.123 0.000 0.000 0.000 0.217 Galium asprellum 0.004 0.009 0.000 0.000 0.000 0.000 Galium palustre 0.000 0.000 0.011 0.040 0.000 0.000 Galium trifidum 0.000 0.000 0.001 0.007 0.000 0.000 Gaultheria hispidula 0.001 0.004 0.000 0.000 0.000 0.000 Gaultheria procumbens 0.067 0.114 0.014 0.076 0.000 0.000 Geranium species 0.000 0.002 0.000 0.000 0.000 0.000 Gratiola neglecta 0.000 0.004 0.000 0.000 0.000 0.000 Gymnocarpium dryopteris 0.059 0.020 0.055 0.034 0.000 0.076 Hieracium aurantiacum 0.001 0.004 0.000 0.000 0.127 0.000 Hieracium caespitosum 0.002 0.003 0.000 0.000 0.000 0.000 Hieracium lachenalii 0.001 0.012 0.000 0.000 0.000 0.000 Hieracium pilosella 0.001 0.002 0.000 0.000 0.000 0.000 Hieracium piloselloides 0.000 0.001 0.000 0.000 0.000 0.000 Hieracium species 0.000 0.002 0.002 0.011 0.000 0.000 Hydrocotyle americana 0.000 0.000 0.002 0.007 0.000 0.000 Hypericum species 0.000 0.004 0.000 0.000 0.000 0.000 Ilex species 0.001 0.003 0.000 0.000 0.000 0.000 Ilex verticillata 0.001 0.002 0.000 0.000 0.000 0.000 Impatiens capensis 0.000 0.000 0.514 0.094 0.000 0.000

Appendix cont’d
Harvest Gaps Natural Gaps Closed Canopy Species Mean % Cover Mean Frequency Mean % Cover Mean Frequency Mean % Cover Mean FrequencyKalmia angustifolia 0.009 0.010 0.004 0.011 0.010 0.011 Krigia virginica 0.001 0.007 0.000 0.000 0.000 0.000 Lactuca canadensis 0.001 0.007 0.000 0.000 0.000 0.000 Lactuca sativa 0.002 0.002 0.000 0.000 0.000 0.000 Leontodon autumnalis 0.001 0.003 0.000 0.000 0.000 0.000 Linaria vulgaris 0.000 0.002 0.000 0.000 0.000 0.000 Linnaea borealis 0.129 0.024 0.002 0.011 0.000 0.000 Lobelia inflata 0.000 0.002 0.000 0.000 0.000 0.000 Lonicer morrowii 0.006 0.018 0.000 0.000 0.000 0.000 Lonicer species 0.000 0.001 0.000 0.000 0.000 0.000 Lonicera canadensis 0.088 0.078 0.013 0.069 0.005 0.033 Lycopodium clavatum 0.001 0.005 0.000 0.000 0.000 0.000 Lycopodium hickeyi 0.001 0.007 0.000 0.000 0.001 0.011 Lycopodium obscurum 0.010 0.047 0.029 0.076 0.009 0.033 Lycopus uniflorus 0.004 0.004 0.049 0.022 0.000 0.000 Lysimachia quadrifolia 0.001 0.002 0.000 0.000 0.000 0.000 Maianthemum canadense 0.437 0.645 0.233 0.603 0.076 0.304 Maianthemum racemosum 0.000 0.000 0.011 0.011 0.023 0.033 Medeola virginiana 0.016 0.043 0.013 0.054 0.002 0.011 Melampyrum lineare 0.001 0.003 0.000 0.000 0.000 0.000 Mitchella repens 0.013 0.065 0.075 0.167 0.009 0.054 Mitella nuda 0.000 0.002 0.000 0.000 0.000 0.000 Moneses uniflora 0.000 0.004 0.000 0.000 0.000 0.000 Nemopanthus mucronatus 0.003 0.009 0.000 0.000 0.000 0.000 Oclemena acuminata 0.044 0.073 0.005 0.011 0.000 0.000 Onclemena acuminata 0.018 0.014 0.000 0.000 0.000 0.000 Onoclea sensibilis 0.269 0.061 0.071 0.047 0.000 0.000 Orthilia secunda 0.002 0.002 0.000 0.000 0.000 0.000 Osmunda cinnamomea 0.121 0.019 0.027 0.011 0.009 0.011 Osmunda claytoniana 0.471 0.055 0.451 0.027 0.268 0.054 Ostrya virginiana 0.001 0.008 0.062 0.076 0.000 0.109

Appendix cont’d
Harvest Gaps Natural Gaps Closed Canopy Species Mean % Cover Mean Frequency Mean % Cover Mean Frequency Mean % Cover Mean FrequencyOxalis corniculata 0.000 0.004 0.000 0.000 0.000 0.000 Oxalis montana 0.002 0.007 0.000 0.000 0.000 0.011 Oxalis species 0.000 0.002 0.000 0.000 0.000 0.000 Oxalis stricta 0.020 0.009 0.000 0.000 0.000 0.000 Phegopteris connectilis 0.000 0.002 0.000 0.000 0.000 0.000 Photinia melanocarpa 0.010 0.020 0.000 0.000 0.000 0.000 Potentilla norvegica 0.038 0.028 0.000 0.000 0.000 0.000 Picea abies 0.000 0.000 0.005 0.011 0.000 0.000 Picea glauca 0.011 0.004 0.000 0.000 0.000 0.000 Picea rubens 0.530 0.207 0.256 0.114 0.122 0.033 Picea species 0.141 0.013 0.000 0.000 0.000 0.000 Pinus resinosa 0.030 0.019 0.000 0.000 0.000 0.000 Pinus strobus 0.513 0.576 0.217 0.683 0.350 0.370 Polygala species 0.000 0.004 0.000 0.000 0.000 0.000 Polygala viridescens 0.006 0.005 0.000 0.000 0.000 0.000 Polygonatum pubescens 0.000 0.000 0.028 0.065 0.000 0.000 Polystichum acrostichoides 0.017 0.006 0.109 0.098 0.466 0.141 Populus grandidentata 0.373 0.122 0.043 0.022 0.057 0.033 Populus species 0.000 0.004 0.002 0.007 0.001 0.011 Populus tremuloides 0.974 0.279 0.029 0.141 0.092 0.141 Potentilla simplex 0.007 0.003 0.000 0.000 0.000 0.000 Potentilla vorvegica 0.005 0.008 0.000 0.000 0.000 0.000 Prunella vulgaris 0.001 0.005 0.000 0.000 0.000 0.000 Prunus pennsylvanica 0.028 0.117 0.098 0.011 0.000 0.000 Prunus virginiana 0.002 0.002 0.000 0.000 0.000 0.000 Pteridium acquilinum 0.852 0.122 0.001 0.011 0.000 0.000 Pyrola americana 0.002 0.002 0.000 0.000 0.000 0.000 Pyrola chlorantha 0.000 0.000 0.002 0.007 0.001 0.011

Appendix cont’d
Harvest Gaps Natural Gaps Closed Canopy Species Mean % Cover Mean Frequency Mean % Cover Mean Frequency Mean % Cover Mean FrequencyPyrola elliptica 0.000 0.002 0.007 0.011 0.000 0.000 Quercus rubra 0.259 0.220 0.105 0.138 0.010 0.054 Ranunculus abortivus 0.000 0.000 0.006 0.018 0.000 0.000 Ranunculus acris 0.003 0.003 0.000 0.000 0.000 0.000 Ranunculus hispidus 0.001 0.004 0.000 0.000 0.000 0.000 Rhus hirta 0.106 0.047 0.000 0.000 0.000 0.000 Ribes lacustre 0.002 0.008 0.000 0.000 0.000 0.000 Ribes species 0.000 0.000 0.011 0.007 0.000 0.000 Rosa virginiana 0.006 0.004 0.000 0.000 0.000 0.000 Rubus allegheniensis 0.195 0.069 0.000 0.000 0.000 0.000 Rubus dalibarda 0.005 0.003 0.000 0.000 0.000 0.000 Rubus flagellaris 0.003 0.002 0.000 0.000 0.000 0.000 Rubus hispidus 0.171 0.013 0.000 0.000 0.000 0.000 Rubus ideaus 0.662 0.272 0.000 0.000 0.000 0.000 Rubus occidentalis 1.260 0.141 0.000 0.000 0.000 0.000 Rubus pubescens 0.456 0.051 0.029 0.007 0.000 0.000 Scutellaria lateriflora 0.000 0.000 0.037 0.022 0.000 0.000 Silene species 0.000 0.002 0.000 0.000 0.000 0.000 Smphyotrichum nvi-belgii 0.003 0.002 0.000 0.000 0.000 0.000 Solidaga altissima 0.003 0.008 0.000 0.000 0.000 0.000 Solidaga gigantea 0.015 0.005 0.000 0.000 0.000 0.000 Solidaga nemoralis 0.000 0.002 0.015 0.033 0.000 0.000 Solidaga puberula 0.000 0.001 0.000 0.000 0.000 0.000 Solidaga rugosa 0.013 0.038 0.000 0.000 0.000 0.000 Solidago hispida 0.000 0.003 0.000 0.000 0.000 0.000 Solidago species 0.005 0.006 0.000 0.000 0.000 0.000

Appendix cont’d
Harvest Gaps Natural Gaps Closed Canopy Species Mean % Cover Mean Frequency Mean % Cover Mean Frequency Mean % Cover Mean FrequencySolidao canadensis 0.004 0.012 0.000 0.000 0.000 0.000 Streptopus landeolatus 0.002 0.007 0.013 0.043 0.008 0.033 Symphyotrichum lateriflorum 0.000 0.000 0.001 0.011 0.000 0.000 Symphyotrichum novi-belgii 0.004 0.005 0.000 0.000 0.000 0.000 Symphyotrichum puniceum 0.006 0.012 0.000 0.000 0.000 0.000 Symphyotrichum racemosum 0.002 0.002 0.000 0.000 0.000 0.000 Taraxacum officinale 0.001 0.004 0.000 0.000 0.000 0.000 Thelypteris noveboracensis 0.018 0.021 0.013 0.043 0.017 0.043 Thelypteris simulata 0.000 0.000 0.000 0.000 0.003 0.011 Thelypteris species 0.000 0.000 0.000 0.000 0.014 0.011 Thuja occidentalis 0.037 0.062 0.184 0.042 0.163 0.043 Tilia americana 0.000 0.000 0.000 0.000 0.002 0.022 Toxicodendron radicans 0.001 0.001 0.000 0.000 0.000 0.000 Toxicodendron radicans 0.136 0.028 0.467 0.100 0.011 0.022 Trientalis borealis 0.558 0.567 0.213 0.482 0.064 0.174 Trifolium hybridum 0.001 0.003 0.000 0.000 0.000 0.000 Trifolium species 0.000 0.000 0.000 0.000 0.005 0.011 Trillium undulatum 0.006 0.002 0.000 0.000 0.018 0.033 Tsuga canadensis 2.199 0.484 6.642 0.668 1.714 0.500 Uvularia sessilifolia 0.000 0.000 0.008 0.011 0.000 0.000 Vaccinium angustifolium 0.089 0.056 0.000 0.000 0.012 0.033 Vaccinium myrtilloides 0.005 0.007 0.000 0.000 0.000 0.000 Vaccinium oxycoccos 0.001 0.008 0.000 0.000 0.000 0.000 Vaccinium species 0.133 0.044 0.000 0.000 0.000 0.000 Veronica officinalis 0.005 0.017 0.000 0.000 0.000 0.000 Viburnum nudum 0.008 0.008 0.009 0.022 0.000 0.000 Vicia tetrasperma 0.000 0.002 0.000 0.000 0.000 0.000 Viola species 0.000 0.159 0.000 0.011 0.000 0.000

147
BIOGRAPHY OF THE AUTHOR
Darci Schofield was born and raised in Sterling, Massachusetts on January 8,
1975. Following graduation from Notre Dame Academy High School, she attended
Boston University where she received a Bachelor’s degree in Environmental Science
and Geology. During her college career, Darci also studied abroad in Vancouver
Island, British Columbia where she studied temperate rain forest ecology and forest
economics.
Following her college education, Darci became a volunteer with the Non-
Government Organization, Operation Crossroads Africa, in Tanzania, Africa.
Working in a rural village, Darci performed agricultural services and helped establish
an irrigation system for the people in the village. After returning from Africa, Darci
enjoyed various jobs working in the outdoors including teaching rock climbing to
children, leading backpacking trips in the mountains of Maine and New Hampshire,
as well as teaching environmental education in an experiential setting in New
Hampshire. She was also the naturalist for Borestone Mountain Wildlife Sanctuary in
Elliotsville Plantation Maine. Here Darci also performed forestry research on their
(now defunct) Long-Term Ecological Research Plot. Darci entered graduate school
in the Department of Forest Ecosystem Science in January of 2001. She is a
candidate for the Master of Science degree in Forestry from The University of Maine
in December, 2003.


![Edinburgh Research Explorer · 2019. 3. 5. · vegetation parameters [4,5]. The main horizontal structural vegetation parameters collected in forest inventories are the tree diameter](https://img.dokumen.tips/doc/110x75/60a9e10cefbb5915fb2ce77f/edinburgh-research-explorer-2019-3-5-vegetation-parameters-45-the-main.jpg)