Embed Size (px)
Citation preview

VECTOR CONTROL INTEGRATED DATA ANALYTICS & VISUALIZATION BEST PRACTICES GUIDE

Recommended Citation: Burnett Sarah, Stillman Kate, Littrell Megan. 2020. Vector Control Integrated Data Analytics and Visualization: Best Practices Guide. Rockville, MD. PMI VectorLink, Abt Associates Inc.
Contract: AID-OAA-I-17-00008
Task Order: AID-OAA-TO-17-00027
Submitted to: United States Agency for International Development/PMI
Submission Date: December 30, 2020
Approved on: January 29, 2021
Abt Associates Inc. | 6130 Executive Boulevard | Rockville, MD 20852
T. 301.347.5000 | F. 301.913.9061 abtassociates.com

VECTOR CONTROL INTEGRATED DATA ANALYTICS &
VISUALIZATION
BEST PRACTICES GUIDE
DECEMBER 2020


iii
CONTENTS Acronyms ............................................................................................................................................... v
Introduction .............................................................................................................................................. 1
How to use this Guide ................................................................................................................................. 3
Use Cases .........................................................................................................................................................3 Key Indicators 3 Tips & Resources ....................................................................................................................................................3
Use Cases ................................................................................................................................................ 5
Stratification & Targeting of Interventions .............................................................................................................5 Optimizing Implementation & Coverage ..............................................................................................................10 Managing Insecticide Resistance ..........................................................................................................................16 Monitoring the relationship between vector control interventions, malaria burden, and vector populations ..22
Key Indicators ............................................................................................................................................ 27
1.1 Malaria Burden ..............................................................................................................................................28 1.2 IRS Program Coverage ...................................................................................................................................28 1.3 ITN Program Coverage ..................................................................................................................................29 1.4 Vector Density and Associated Indicators .....................................................................................................31 1.5 Insecticide Susceptibility ...............................................................................................................................31 1.6 IRS Insecticide Residual Efficacy ....................................................................................................................32 1.7 Climatological Indicators ...............................................................................................................................32
Tips & Resources ....................................................................................................................................... 33
Engaging decision-makers in the design process .................................................................................................33 Managing data ......................................................................................................................................................35 Reviewing data and assessing quality ..................................................................................................................36 Integrating datasets ..............................................................................................................................................37 Enhancing data use ...............................................................................................................................................38
Annex A: Bibliography .............................................................................................................................. 39
Annex B: Detailed Indicator Descriptions ................................................................................................ 41
1.1 Malaria Burden ...............................................................................................................................................41 1.2 IRS Program Coverage ....................................................................................................................................45 1.3 ITN Program Coverage ....................................................................................................................................49 1.4 Vector Density ................................................................................................................................................59 1.5 Insecticide Susceptibility ................................................................................................................................60 1.6 IRS Insecticide Residual Efficacy .....................................................................................................................63 1.7 Climatological Indicators ................................................................................................................................65


v
ACRONYMS ANC Antenatal Care
CHIRPS Climate Hazards Center Infrared Precipitation with Station
DHS Demographic and Health Survey
DHIS2 District Health Information Software 2
EPI Expanded program on immunization
HMIS Health management information system
IRS Indoor residual spray
IRMMP Insecticide Resistance Monitoring and Management Plan
ITN Insecticide treated net
M&E Monitoring and evaluation
MICS Multiple Indicator Cluster Survey
MIS Malaria Indicator Survey
NMCP National Malaria Control Program
NMEP National Malaria Elimination Programme
PBO Piperonyl butoxide
PMI U.S. President’s Malaria Initiative
PSC Pyrethrum spray catch
RDT Rapid diagnostic test
WHO World Health Organization


1
INTRODUCTION
Vector control interventions are critical to maintaining gains in malaria control and for continued progress towards elimination. Insightful use of data to inform vector control decisions can support the efficient use of resources, which can lead to high vector control coverage. The combination of various datasets is also key to developing strategies required for insecticide resistance adaptation and it can facilitate effective use of the expanded toolbox for malaria vector control as new indoor residual spraying (IRS), and insecticide treated net (ITN) products are introduced. Although evidence is critical for effective malaria vector control strategy, timely and relevant data are often not integrated and readily available to decision makers in easily accessible and actionable reports or data dashboards.
The PMI VectorLink Project has developed this vector control integrated data analytics and visualization best practices guide, based on the project’s experiences, with the goal of supporting users beyond the PMI VectorLink Project to better leverage routine data sources and guide national vector control decisions. This guide is designed to support national and sub-national malaria program managers, vector control officers, monitoring and evaluation (M&E) officers, and other health sector decision-makers to use existing data sources for the planning, implementation, and monitoring of malaria vector control interventions to assist in the journey to self-reliance.
The content was developed based on the PMI VectorLink Project’s experiences using data integration and visualization to compile, analyze, and visualize relevant, existing data into integrated dashboards that make data more easily accessible, digestible, timely, and action-oriented (Figure I). The dashboards are developed with the use of national program and implementing partner datasets, and integrate entomological, epidemiological, intervention coverage, and climatological data, to allow in-depth review and analysis.
The guide presents specific use cases where integrated data analytics and visualizations support important malaria control decisions, including:
1. Stratification and targeting for specific vector control interventions such as IRS and ITN campaigns.
2. Optimizing implementation and coverage of vector control interventions.
3. Managing insecticide resistance through insecticide rotation.
4. Monitoring the relationship between vector control interventions, malaria burden, and vector populations.
By documenting the project’s approach, we hope to inform and engage others who are integrating data sources to guide vector control decision-making. This living document will be updated throughout the PMI VectorLink Project to reflect the on-going development of best practices in the use and interpretation of integrated vector control visualizations.
Figure 1. Integrated Data Analytics & Visualization


3
HOW TO USE THIS GUIDE This document provides practical examples of each of the four use cases described above: stratification and targeting; optimizing implementation and coverage; managing insecticide resistance; and monitoring the relationship between vector control interventions, malaria burden, and vector populations. These example visualizations were originally designed to support decision-making processes in specific countries and are intended to be illustrative of the ways that stakeholders can visualize vector control data. This guide contains three main sections: Use Cases, Key Indicators, and Tips and Resources.
USE CASES The use cases provide an in-depth review of a specific decision-making process and how data was used. Each of the four use cases includes the following components:
• Request: Describes the specific decision that a national program wants to address with their data, with real-life contextual details.
• Key Questions: Describes the questions that the stakeholders were aiming to answer in the case study.
• Key Indicators: Describes the indicators used in the visualizations to help address the key questions, with a reference number that corresponds to the Key Indicators section and Annex B. Detailed Indicator Descriptions.
• Visualizations: Illustrative visualizations used guide the decision-making process, developed using three commonly used visualization tools: District Health Information Software 2 (DHIS2), Microsoft Excel, or Tableau.
• Explanatory Notes: The explanatory notes guide the visualization interpretation. The visualizations are marked with numbered boxes that correspond to the explanatory notes.
• Decision: Provides a brief description of the final decision that was made and how the data was used to support the decision.
Following each case study there are quick visualizations, alternative visualizations for each use case.
KEY INDICATORS The Key Indicators section provides brief descriptions of key malaria vector control indicators, many of which are referenced in the use cases. Where possible, these indicators were sourced from existing World Health Organization (WHO) and President’s Malaria Initiative (PMI) malaria guidance documents. Here they are combined into a single source, with practical calculation and interpretation guidance to support visualization development and use. Annex B: Detailed Indicator Descriptions provides detailed definitions, data sources, and strengths, limitations and considerations for the use and interpretation of each indicator.
TIPS & RESOURCES In the Tips & Resources section, we present practical recommendations for developing integrated vector control data analytics and visualizations, including how to:
• collect and manage the multiple data streams referenced in the use cases and indicators,
• integrate data sets for analyses and visualization, and
• engage a variety of stakeholders in data visualization design and use.
This section also offers high level guidance on the systems, tools and staffing that are recommended to develop visualizations like those presented in the use cases. Under additional resources, readers will also find links to other malaria and global health community guides that can be used to support the use of vector control data in decision-making.


5
USE CASES STRATIFICATION & TARGETING OF INTERVENTIONS
In the context of limited resources for malaria vector control, the WHO has identified stratification as one the key strategies for improving vector control implementation (WHO, 2015a). Stratification, often carried out using a combination of malaria burden, climate, and vector species indicators, helps programs to identify the populations most greatly impacted by malaria and their malaria risk determinants, and supports appropriate targeting of malaria interventions. With well-designed stratification efforts, national programs have the potential to accelerate progress in reducing malaria transmission. In this section we provide examples of how national programs are using available data to stratify and target areas for vector control interventions.
Case Study 1: Prioritizing Regions & Districts to Receive New Types of ITNs
Request: The National Malaria Control Program (NMCP) in Mali is receiving 900,000 Interceptor G2 ITNs for distribution. Since this is not enough nets to protect the entire population, the NMCP needs to know where they should prioritize distributing these nets, given the widespread high intensity insecticide resistance to pyrethroids throughout the country.
First, they want to prioritize a region with the highest malaria burden. Then within that region, they want to select districts with high burden, but that can also be completely covered by the incoming nets, with some left over for use during routine net distribution for the next three years. The NMCP is also planning to formally evaluate this intervention. To support this evaluation, they want to choose districts that have ongoing entomological data collection and that are close to the Burkina Faso border, so that the evaluation results can be compared with those from a similar evaluation being conducted in Burkina Faso.
Key Questions:
• What region and districts should we prioritize for the Interceptor G2 ITNs?
• After this prioritization, how many ITNs will we have left for routine distribution?
Key Indicators Used:
• 1.1.1 Malaria Parasite Prevalence
• 1.1.2 Malaria Case Incidence
• HMIS DHIS2 Estimated Population
• Estimated ITN Quantity, based on population

6
Visualization 1.1: Prioritizing Regions & Districts to Receive New ITNs
*Regions with no values were not included in the DHS 2018.
Software used: Tableau
Visualization 1.1 Explanatory Notes: 1. Malaria Case Incidence Heat Map (Indicator 1.1.2): This heat map shows the case incidence from the national HMIS for each region in 2018, ranked from highest to lowest. In this visualization the higher the case incidence the darker the color. At the time of regional decision-making this was the most recent data across both indicators. 2. Malaria Parasite Prevalence Heat Map (Indicator 1.1.1): This heat map shows the malaria parasite prevalence for children under 5 for the most recent 2018 Demographic and Health Survey (DHS). Two regions, Menaka and Taoudenit, did not have any data collected during the 2018 DHS. In this visualization the higher the parasite prevalence the darker the color. Looking at these values along with the malaria case incidence, we see a similar pattern with Sikasso and Segou having the highest malaria case incidence and the highest under 5 parasite prevalence for 2018. Other regions show diverging patterns. For example, Mopti has a lower malaria case incidence but a higher prevalence. This could be caused by low HMIS reporting rates, as such, additional investigations can be done to identify the reason for these divergences.
Decision: Given that Sikasso had the highest malaria case incidence and prevalence, the NMCP decided to target Sikasso for the Interceptor G2 ITNs. They then needed to choose the districts within Sikasso that would receive the ITNs.
1
2

7
Visualization 1.2: Prioritizing Regions & Districts to Receive New ITNs
Software used: Tableau
1
2
3

8
Visualization 1.2 Explanatory Notes: 1. Districts by Estimated ITN Quantity and Malaria Case Incidence (Indicator 1.1.2): This map shows the case incidence for each district for 2019, the most recent year of data at the time of district-decision-making. In this visualization the higher the case incidence the darker the color. Each district is labeled with the name of the district and the estimated number of ITNs required. The number of ITNs required was estimated as the total population in the HMIS divided by 1.8, per WHO estimation guidance, and multiplied by 1.10 to account for a 10% buffer stock (WHO, 2019). The districts where entomological data was already being collected were also added to the map. The NMCP wanted to be sure that IG2 ITNs were distributed in districts that already had entomological baseline data so they could monitor the impact of the IG2 ITNs on local vector populations. 2. Malaria Case Incidence, by district and year (Indicator 1.1.2): This line graph shows the malaria case incidence for each district from 2016-2019. This was added to the visualization because we wanted to observe the historical trends in case incidence. This would make sure that if we are choosing districts in part based on districts having the highest burden, that this trend in burden was consistent over time. 3. Malaria Case Incidence (Indicator 1.1.2), estimated population, and estimated ITN quantity. This heatmap shows the district malaria case incidence in table form, beside the estimated population from the HMIS, and the estimated quantity of ITNs required to protect the population. The final column provides a running sum of the total number of ITNs required. In this interactive visualization the NMCP staff were able to reorder the districts in the dashboard to pick their top priority districts. In this case the four priority districts selected were Kadiolo, Yorosso, Yanfolila and Selingue.
Decision: The NMCP selected four districts to receive IG2 ITNs:
• Kadiolo due to its high malaria burden, entomological site, and border with Burkina Faso, which
would be useful when comparing Mali and Burkina Faso IG2 ITN evaluation results.
• Yorosso due to its high burden and shared Burkina Faso border.
• Yanfolila because of its entomological site.
• Selingue because it was a small district that could easily be covered with the remaining IG2 ITNs
available and contiguous with Yanfolila, which would facilitate an easier distribution process.
An estimated 591,295 IG2 ITNs were required for these four districts, leaving the NMCP with roughly 300,000 IG2 ITNs for use during routine antenatal care (ANC) and expanded programme on immunization (EPI) distribution in these targeted districts in the coming years, to sustain high coverage with the new type of ITN.

9
Stratification & Targeting of Interventions: Quick Visualizations Quick Visualization 1. Malaria case incidence (Indicators 1.1.2) and vector control coverage, by intervention type (Indicators 1.2.1, 1.3.6, 1.3.9) and region, Mali
• A dashboard, like the one above, could be used to review the coverage of vector control interventions
alongside malaria case incidence (Indicator 1.1.2). This example includes three key vector control
intervention indicators, mass ITN campaign distribution coverage (Indicator 1.3.6), ANC and EPI ITN
population distribution coverage (Indicator 1.3.9) and IRS population protected (Indicator 1.2.1).
Dashboards like this can help to prioritize areas for future interventions. For example, one can see that
there has been no mass ITN campaign within the past three years in Segou, which has the second highest
malaria case incidence among all the regions. This region could be prioritized for a future mass campaign.
In each of the maps, as in the table, the darker color indicates a higher percentage coverage. Users could
also choose other indicators from this guide to include in a dashboard like this, such as ITN population
distribution coverage through all channels (Indicator 1.3.10).

10
OPTIMIZING IMPLEMENTATION & COVERAGE Vector control programs require the mobilization of a great number of staff, commodities, and funding for successful implementation. Using integrated visualizations before, during, and after program implementation can help ensure that these resources are optimized to improve implementation processes and program coverage. Visualizations can be used to plan across vector control interventions, monitor ongoing implementation to identify potential gaps and, and to review coverage post-campaign and support future strategy development. In this section we provide examples of national programs using integrated data to optimize vector control implementation and coverage.
Case Study 2: Monitoring ITN & IRS Campaign Coverage
Request: Request: The National Malaria Elimination Programme (NMEP) in Zambia continues to
implement universal vector control coverage with either ITNs or IRS within each health facility
catchment area. The NMEP wants to be able to track coverage of each intervention and to identify any
gaps in coverage.
Key Questions:
• What areas are being protected through the current vector control campaigns?
• Where are there still gaps in coverage?
Key Indicators Used:
• 1.2.1 IRS population protected
• 1.3.6 Mass ITN campaign distribution coverage
11
Case Study Visualization 2.1: Monitoring ITN & IRS Campaign Coverage
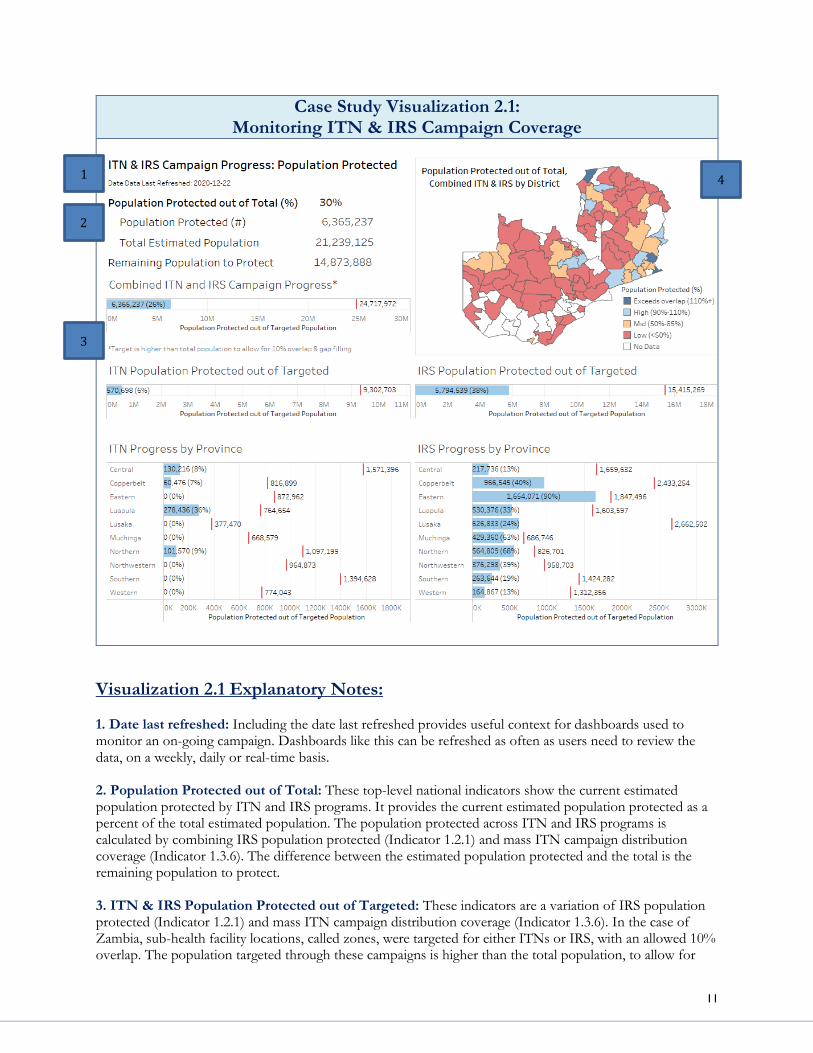
Visualization 2.1 Explanatory Notes: 1. Date last refreshed: Including the date last refreshed provides useful context for dashboards used to monitor an on-going campaign. Dashboards like this can be refreshed as often as users need to review the data, on a weekly, daily or real-time basis. 2. Population Protected out of Total: These top-level national indicators show the current estimated population protected by ITN and IRS programs. It provides the current estimated population protected as a percent of the total estimated population. The population protected across ITN and IRS programs is calculated by combining IRS population protected (Indicator 1.2.1) and mass ITN campaign distribution coverage (Indicator 1.3.6). The difference between the estimated population protected and the total is the remaining population to protect. 3. ITN & IRS Population Protected out of Targeted: These indicators are a variation of IRS population protected (Indicator 1.2.1) and mass ITN campaign distribution coverage (Indicator 1.3.6). In the case of Zambia, sub-health facility locations, called zones, were targeted for either ITNs or IRS, with an allowed 10% overlap. The population targeted through these campaigns is higher than the total population, to allow for
1
2
3
4

12
some overlap. Using these horizontal bar charts with embedded targets, national staff can quickly view progress at the national and province level by program. 4. Population Protected out of Total, by District: This map shows the combined ITN and IRS estimated population protected by district. The colors of each district indicate the districts’ progress towards the target, whether coverage exceeds the expected 10% overlap (exceeds overlap) is high (85%-100%), mid (50%-85%), low (<50%), or if there is no data. As the campaign progresses, we would expect the districts to move from white (no data) to red (low coverage) to light blue (high coverage). Including districts with no data can indicate where campaigns have yet to start, or where data has not yet been entered. This visualization provides useful information for following-up on progress at the district level.
Optimizing Implementation & Coverage: Quick Visualizations
Quick Visualization 2. Spray Progress (Structures Sprayed out of Targeted) (Indicator 1.2.3), by Country and Operational Site, Cote d’Ivoire
Software used: DHIS2
• This visualization shows the progress towards the targeted number of structures by operational site, which
is a sub-district unit used to coordinate the IRS campaign. It is useful to have spray progress coverage data
disaggregated by operational units and at the lowest geographic level possible, such as a health facility or a
sub-health facility level. This will support ensuring that each identifiable unit meets standards for IRS
coverage.
• Notice that some operational sites have spray coverage greater than 100%. Targeted structures are often
estimates based on calculations from population, geospatial estimates, or ground enumeration. It is not
uncommon to have values greater than 100%. However, if spray progress is much higher than 100% that
may cause you to question the accuracy of the estimation used. Sometimes it may be helpful to compare
spray progress using more than one data source for structure estimation. For example, one could compare
structure estimates from geospatial structure counts to structures estimates derived by dividing the
estimated population by an average number of people per structure.

13
Quick Visualization 3. Spray Coverage (Structures Sprayed out of Found) (Indicator 1.2.2) by Country and Operational Site, Cote d’Ivoire
Software used: DHIS2
• WHO recommends that IRS teams spray at least 80% of eligible houses, structures, or units within
targeted areas. Some programs may choose a target above the minimum recommendation of 80%, such
as in this example where the coverage target was set to 85%.
• A key indicator to monitor IRS coverage is spray coverage, structures sprayed out of the structures
found. Spray coverage tells you whether the spray operators sprayed most of the structures they found
and whether the coverage target was met. However, depending on the type of terrain of the area, there
may be structures that the spray operator does not find because they are in pockets of isolated structures
that may be difficult to access due to the terrain.
• In
• , overall spray coverage for all areas targeted for IRS is shown, alongside a breakdown by operational site.
This type of visualization offers important insights into an IRS campaign during its implementation. A
reference line for minimum coverage is included, which shows that at the time this chart was generated
all but one operational site met the target. This may prompt operational decisions to achieve the target in
this operational site before the end of the IRS campaign.

14
Quick Visualization 4. Combining Spray Coverage (Indicator 1.2.2) & Spray Progress (Indicator 1.2.3), by District and Health Facility, Bandiagara, Mopti
• Looking at spray coverage and spray progress together
and over time for a given area can also tell you more
about the program operations. In this visualization the
average spray coverage by district is the blue bar and
each red circle is a health facility.
• In this example, the spray coverage, structures sprayed
out of found, in Bandiagara was at or above 96% for
each year, and only one health facility catchment area
(red circle) fell below the 85% target. This indicates that
in the areas that the spray operators reached they were
successfully spraying structures.
• Spray progress, structures sprayed out of targeted, varied
from a low of 69% in 2018 to 107% in 2019. During the
2018 campaign, the spray team identified an increased
number of rooms eligible for spraying per house. The
gap between spray progress and the spray coverage
could indicate either that the estimate of the targeted
structures was too high or that not all structures were
reached. This should prompt additional discussion
among program staff and comparison of total structures
counts across years.
Software used: Tableau

15
Quick Visualization 5. ANC1 ITN distribution coverage (Indicator 1.3.7), October 2019-May 2020
Software used: Excel
• This graph shows distribution of ITNs during first antenatal (ANC1) visits within a country. The bars
show the number of ANC1 clients and the number of ITNs distributed through ANC, per month. The
data table below the graph provides a quick reference in case a user needs to know the precise number
of ITNs. A visualization like this can be used on a monthly basis to track to continuous ITN
distribution and identify if coverage falls below a pre-determined target.

16
MANAGING INSECTICIDE RESISTANCE Reductions in malaria cases and deaths over the past 20 years are under threat due to the spread of insecticide
resistance, rendering traditional vector control products less effective in the fight against malaria. To address
this growing risk, the global community is developing new insecticides and vector control products. WHO
has also provided updated guidance on the use and rotation of existing and new products to ensure that the
effects of insecticide resistance are mitigated. Visualizations can support programs to manage the increasing
complexity of multiple IRS and ITN product deployments across geographical areas and years. In this section
we provide examples of how national programs are using integrated visualizations to manage insecticide
resistance and appropriate use of new insecticides.
Case Study 3: IRS Product Choice in Zambia
Request: The Insecticide Resistance Monitoring and Management Plan (IRMMP) Technical Advisory Committee in Zambia was asked to make a recommendation to the NMEP on which insecticide to use for IRS in each district for the 2020 campaign.
Key Questions:
• What districts have documented resistance to each IRS active ingredient?
• What IRS product should we recommend for use in each district?
Key Indicators Used:
• IRS Product History
• 1.4.1 Vector Density
• 1.5.1 Insecticide susceptibility
• 1.6.2 IRS insecticide residual efficacy months

17
Visualization 3.1: Product History & Product Choice Conflicts
Visualization 3.1 Explanatory Notes 1. IRS Product History: The map shows the IRS products that have been used in the province in the
previous year. Based on the NMEP IRMMP, insecticides should be rotated every two years.
2. Product Choice Conflicts: The pink triangles on the map flag districts where the same product was used
for the previous two years and a change is recommended. The IRMMP also recommends discontinuing the
use of an insecticide if there is documented resistance within the previous two years. The yellow triangles
indicate districts where insecticide susceptibility samples have identified resistance to the current insecticide
being used.
1
2

18
Visualization 3.2: Insecticide Susceptibility, by District, Predominant Species,
Chemical Class, and Year
Visualization 3.2 Explanatory Notes 1. Choose filter settings: This visualization allows you to filter the table for the province, district, chemical
class and years of interest. When the province is chosen, the predominant species for the province is revealed. The NMEP defines the predominant species as the Anopheles vector that comprises 90% or greater of the vector density between Anopheles funestus s.l. and An. gambiae s.l. These filters allow users to focus their investigation on the districts and chemical classes they are interested in. In this example, multiple years were chosen.
2. Insecticide Susceptibility (Indicator 1.5.1) Detail: The insecticide susceptibility detail table shows all
the insecticide susceptibility test data that are available given the filter settings. For each province and
chemical class, the data is presented by chemical, district, site, and species (An. funestus s.l. and An. gambiae
s.l.). If there are more samples than can be shown in the window a grey bar appears on the right to scroll
through the available data.
3. Insecticide Susceptibility (Indicator 1.5.1) Map: There is one map for each chemical class with
available insecticide susceptibility data. In the each of the maps, the provinces are colored by the lowest
susceptibility percentage from the most recent sample with the filtered years obtained within each district.
The maps are useful complement to the table in that they show spatially where the insecticide
1
2
3

19
susceptibility data is available, and where there are gaps. There is also built-in interactivity so that when a
district is selected in the table, it is highlighted on the maps for each chemical class.
Decision: Based on the data review, the IRMMP Technical Advisory Committee recommended product changes in districts that had used the same product for the previous two years, and in districts which had documented resistance to the product within the district or within a neighboring district. The map, 2020 Recommendation, below, shows the committee’s final recommendation for the 2020 IRS campaign. The green triangles on select districts indicate the districts where a product change was recommended. This was used by the NMEP to inform their final IRS product choice decision.
2019 Implementation 2020 Recommendation

20
Managing Insecticide Resistance: Quick Visualizations
Quick Visualization 6. Percent mortality of An. gambiae s.l. tested against insecticides at 24 hours, WHO Tube Test (Insecticide susceptibility, Indicator 1.5.1)
Software used: DHIS2
• This graph, created in DHIS2, shows the insecticide susceptibility for four insecticides for a given site.
This visual includes reference lines for the susceptibility (≥ 98%) and confirmed resistance (< 90%), with
the area between them indicating possible resistance (90–97%).
Quick Visualization 7. Synergist Bottle Assay Results for An. gambiae s.l. (Insecticide susceptibility,
Indicator 1.5.1), Oyo State, Nigeria
Software used: Excel
• This graph shows the insecticide susceptibility for various pyrethroids and each pyrethroid when paired
with a piperonyl butoxide (PBO) synergist, by local government area. This information can be useful to

21
identify the pyrethroids active ingredient and location where the PBO synergist restores susceptibility.
This can inform recommendations on PBO ITNs procurement and distribution.
Quick Visualization 8. Insecticide Susceptibility (Indicator 1.5.1) and Resistance Intensity (Indicator
1.5.2), 8 sites, Cote d’Ivoire
Software used: Excel/Word
• This table presents a heat map combining insecticide susceptibility and insecticide resistance intensity
results. The table is color coded to easily identify which products remain effective against mosquito
populations within each site. The table also provides the number of mosquitoes collected as a measure of
quality, as WHO recommends that at least 100 mosquitoes are included in each sample. With the white
boxes filled with “X”s the table also highlights areas where information is missing. Based on this visual it
is easy to identify that there is widespread resistance with high intensity across pyrethroids and
bendiocarb. The vector’s susceptibility was not restored after pre-exposure to PBO, and this might
indicate that PBO nets are not an option to manage the intense and widespread pyrethroid resistance in
these areas. Pirimiphos-methyl is the one active ingredient that has maintained susceptibility at several
sites, however some sites are also showing resistance.

22
MONITORING THE RELATIONSHIP BETWEEN VECTOR CONTROL
INTERVENTIONS, MALARIA BURDEN, AND VECTOR POPULATIONS
The goal of any vector control intervention is to reduce the population of malaria vectors in order to ultimately reduce the malaria burden in human populations. While formal evaluations with statistical analyses are required to document the impact of vector control interventions, reviewing integrated data to monitor the relationship between vector control program and key epidemiological and entomological outcome measures can help programs to explore potential effects of vector control interventions and support the evaluation design. In this section we provide examples of how national programs are using integrated visualizations to monitor the relationship between vector control interventions, malaria burden, and vector populations. Case Study 4: Monitoring the Relationship between IRS and Malaria Case
Incidence in Mali, 2016-2018
Request: The NMCP in Mali wants to know how effective IRS in Mali has been since the switch from the Segou to the Mopti region in 2017.
Key Questions:
• What is the relationship between IRS implementation and malaria burden?
• What is the relationship between IRS implementation and vector density?
Key Indicators Used:
• 1.1.2 Malaria Case Incidence • 1.4.1 Vector Density
• 1.7.1 Precipitation
• IRS & ITN program implementation timing

23
Case Study Visualization 4.1: Monitoring the Relationship between IRS and Malaria Case Incidence in Mali, 2016-2018
2
1
3
4
5

24
Case Study Visualization 4.1 Explanatory Notes: 1. Transmission Year: In this dashboard the trends are observed based on the transmission year. In this case study, Mali’s transmission year is presented, which is from July to June the following year. The transmission year is defined by observed trends in case incidence and begins when cases first start to increase. In this example, the 2016 transmission year runs from July 2016 to June 2017. The transmission year is preferable to a calendar year because the impact of a vector control intervention such as IRS that targets a season may have an impact that spans two calendar years. In some cases, it may be appropriate to use the post-IRS period of IRS insecticide residual efficacy, rather than the full transmission year, when assessing the impact of IRS on malaria case incidence.
2. Mean Precipitation (Indicator 1.7.1): This line graph shows the mean precipitation for the entire Mopti region. This region is where IRS was implemented in Mali during the 2017 and 2018 transmission season. In this visualization we can see that mean precipitation, as measured in millimeters, was lowest in 2017 and highest in 2018.
3. Mean Vector Density (Indicator 1.4.1): This line graph shows the mean vector density from the four entomological monitoring sites in the region. In Mali, entomological monitoring is only done during the high transmission season. We were not able to compare mean vector density by IRS and non-IRS sites as all the entomological monitoring sites were located within the catchment areas of health facilities that received IRS. The mean vector density trends in 2017 and 2018 follow a similar pattern as is seen in the mean precipitation. There is lower vector density in 2017 when precipitation is lower, and higher vector density in 2018 when precipitation is higher.
4. IRS and ITN implementation period: These purple and orange reference lines show the time period in which IRS and ITN mass campaigns were implemented. In 2017 the IRS campaign started at the end of July and ended near the end of August. The ITN mass campaign took place during the IRS campaign in mid-August. In 2018, there was no ITN mass campaign and the IRS campaign took place later in the year, during September.
5. Malaria Case Incidence (Indicator 1.1.2): This graph shows the malaria case incidence by month for facilities in areas that received IRS (blue) and did not receive IRS (grey) during the 2017 and 2018 period. The difference between the two curves is shown in green. In months when there was lower case incidence in the areas that received IRS, the green area is the below the line. In months when there was higher case incidence in the areas that received IRS, the green area is the above the line.
This visualization only includes data from the subset of facilities with complete data for the three years of the evaluation period. This ensures that the data is comparable across the three years. The analysis of impact should include data only from those facilities that had complete data over the study period. Incomplete reporting will mean that case incidence is underestimated. Differences in the extent to which cases are underestimated over time and between IRS and non-IRS areas will produce evaluation results that are not accurate. There is a particular risk that reporting was more incomplete in earlier versus later years of interest (e.g. 2016 versus 2018). If this is the case but reporting rates are not taken into account in the analysis, then it may appear that cases were increasing in the absence of intervention and/or that cases did not decrease as expected with IRS due to more complete reporting over time.
In this descriptive analysis, both the areas that received IRS and those that did not had lower case incidence in 2017 than in the 2016. This could be due in part to the lower precipitation across all sites and the lower vector density observed in the IRS areas. It could also be due in part to the ITN mass campaign which covered the entire area. We also see that there seems to be an added impact of IRS, in that the areas that received IRS had lower case incidence during the peak transmission period than those that did not. When we look at 2018, there is a higher case incidence across all areas, which may be due in part to the higher precipitation and vector density than compared to 2017. In this visualization, we do not see much difference in malaria case incidence between the IRS and non-IRS areas. This may be because the IRS campaign was held later in the year. Further statistical analysis is required to better estimate the impact of the IRS
25
campaigns, by comparing the change before and after IRS campaigns in the health facilities that received IRS and those that did not.
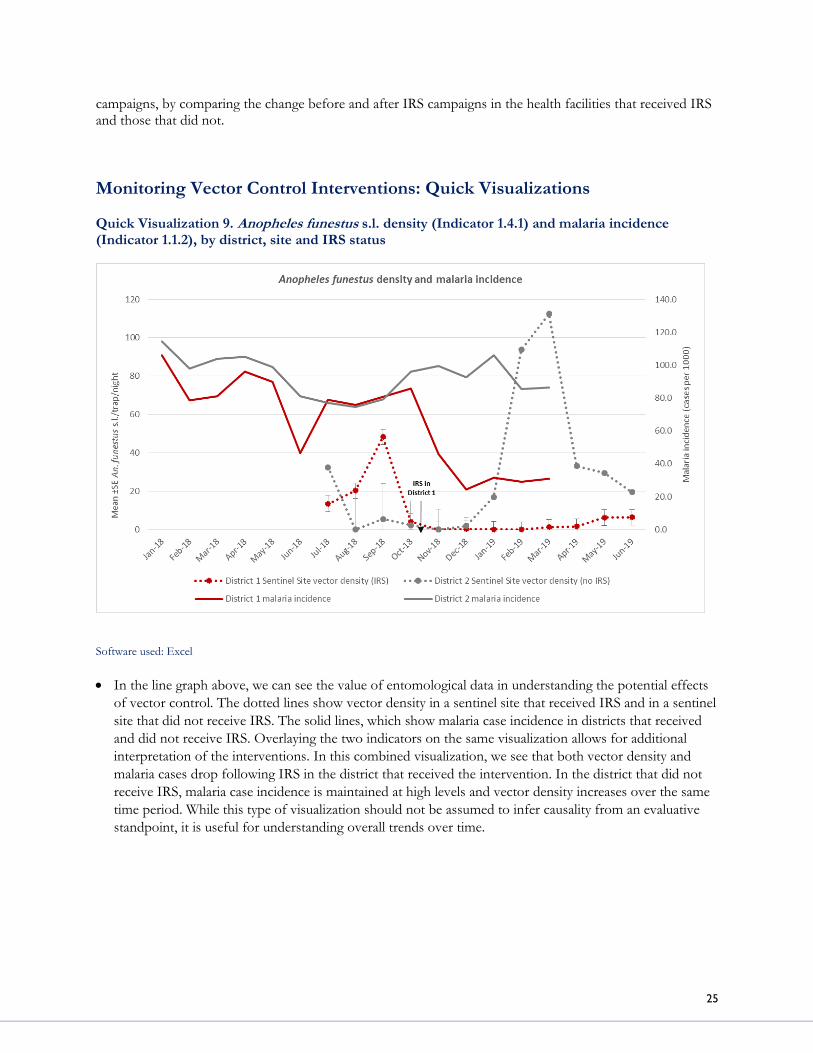
Monitoring Vector Control Interventions: Quick Visualizations Quick Visualization 9. Anopheles funestus s.l. density (Indicator 1.4.1) and malaria incidence (Indicator 1.1.2), by district, site and IRS status
Software used: Excel
• In the line graph above, we can see the value of entomological data in understanding the potential effects
of vector control. The dotted lines show vector density in a sentinel site that received IRS and in a sentinel
site that did not receive IRS. The solid lines, which show malaria case incidence in districts that received
and did not receive IRS. Overlaying the two indicators on the same visualization allows for additional
interpretation of the interventions. In this combined visualization, we see that both vector density and
malaria cases drop following IRS in the district that received the intervention. In the district that did not
receive IRS, malaria case incidence is maintained at high levels and vector density increases over the same
time period. While this type of visualization should not be assumed to infer causality from an evaluative
standpoint, it is useful for understanding overall trends over time.

26
Quick Visualization 10. Mean Anopheles vector density (Indicator 1.4.1) and rainfall (Indicator 1.7.1), by IRS status, Kenya
Software used: Excel
• The graphs above show the mean number of observed female Anopheles mosquitoes, with the standard
error, per trap-night per month in indoor CDC light trap and pyrethrum spray catch (PSC) before and
after IRS in sprayed and unsprayed areas, using the primary axis (Abong’o, 2020). The secondary axis
shows rainfall in milliliters. The grey shaded area indicates the months post-IRS when residual efficacy was
above 80% (Indicator 1.6.2). These graphs show a reduction in An. funestus s.l. densities after IRS. It is
more difficult to see a similar reduction in the already low densities of An. arabiensis. Statistical analyses
were then used to determine whether there was a significant difference in the vector densities based on
IRS status and collection method. The analyses found a significant reduction in the IRS sites compared to
the non-IRS sites for An. funestus populations, through both CDC light trap and PSC methods, and An.
arabiensis using PSC (Abong’o, 2020).

27
KEY INDICATORS
This section presents a set of key indicators that are important to inform malaria vector control decisions, along with a brief description and notes on interpretation and use. The indicators are separated into eight categories: malaria burden, IRS program coverage, ITN program coverage, , vector density, insecticide susceptibility, IRS insecticide residual efficacy, and climatological indicators. The indicators were sourced from WHO, PMI and, other officially recognized sources wherever possible, and constitute a pool of standard indicators that programs can use to guide decision-making for vector control programs. Indicators are marked as: 1) established, 2) adapted, or 3) newly developed or proposed (Table 1). Annex B includes more information on these indicators, detailed descriptions, along with strengths and limitations.
Table 1. Definition of Established, Adapted and Newly Developed or Proposed Indicators
Established An indicator that is already well recognized and widely used in the malaria community.
Adapted
A documented indicator that was adapted from descriptions in recognized source documents to enable its use or calculation.
Newly
Developed or Proposed
An indicator that was developed or proposed to meet NMCP visualizations requests.

28
1.1 MALARIA BURDEN
1.1. Malaria Burden
Purpose/Rationale: The purpose of the malaria burden indicators is to assess the burden of malaria within populations and provide a guide to the level of malaria transmission. Malaria burden indicators are also useful to determine the impact of vector control interventions.
Indicator Indicator
Status: Description Notes on Use & Interpretation
1.1.1 Malaria Parasite Prevalence Proportion of children aged 6-59 months with malaria infection
Established
Numerator: Number of children aged 6-59 months with malaria infection detected by rapid diagnostic test or microscopy Denominator: Total number of children aged 6-59 months tested for malaria parasites by rapid diagnostic test or microscopy
• Can be used to prioritize high burden areas for vector control intervention and to assess long-term changes in malaria burden;
• Not ideal for assessing the impact of vector control intervention on malaria burden.
1.1.2 Malaria Case Incidence Malaria cases per 1000 population over a specific period of time
Established
Numerator: Number of malaria cases, multiplied by 1000 Denominator: Total estimated population at risk of malaria
• Can be used to prioritize high burden areas for vector control intervention and to assess changes in malaria burden over short and longer term periods;
• Can be used to assess the impact of vector control intervention on malaria burden
1.2 IRS PROGRAM COVERAGE
1.2. IRS Program Coverage
Purpose/Rationale: The purpose of the IRS program coverage indicators is to assess programmatic coverage of IRS within targeted areas, as well population level coverage of IRS.
Indicator Indicator
Status: Definition Interpretation
1.2.1 IRS Population Protected Proportion of the population protected by IRS, based on IRS campaign data
Adapted
Numerator: Number of people living in structures that were sprayed during an IRS campaign. Denominator: Total estimated population
• Provides a population coverage estimate that can be used to track against national targets and compare to other vector control or malaria prevention interventions
1.2.2 Sprayed out of Found Structures (Spray Coverage) Proportion of the structures sprayed during IRS campaign out of the eligible structures found in the targeted area
Established
Numerator: Number of eligible structures within the targeted area sprayed with a residual insecticide during IRS campaign Denominator: Total eligible structures found in the targeted area
• Provides a good measure of program implementation – whether the spray operators sprayed the available, known structures. WHO recommends that IRS teams spray at least 80% of houses, structures, or units within targeted areas.

29
Indicator Indicator
Status: Definition Interpretation
1.2.3 Sprayed out of Estimated Targeted Structures (Spray Progress) Proportion of the structures sprayed during IRS campaign out of the estimated targeted structures in the targeted area
Established
Numerator: Number of structures sprayed during IRS campaign Denominator: Total targeted structures in targeted area
• Can be used to assess programmatic
coverage of the IRS program.
• May not be a measure of true coverage
in a given area, as only those structures
that are defined as targeted are
included in the denominator.
1.2.4 Sprayed out of Total Estimated Structures Proportion of the structures sprayed during IRS campaign out of the estimated total eligible structures
Newly
Developed or Proposed
Numerator: Number of structures sprayed during IRS campaign Denominator: Total estimated eligible structures
• Can be used to assess population coverage of the IRS program; providing a structure equivalent to population coverage estimate that can be used to track against national targets.
1.3 ITN PROGRAM COVERAGE 1.3 ITN Program Coverage
Purpose/Rationale: The purpose of the ITN program coverage indicators is to assess programmatic and population level coverage of ITN through distribution and ITN use.
Indicator Indicator
Status: Definition Interpretation
1.3.1 Population ITN access Proportion of population with access to an ITN in their household
Established
Numerator: Total number of individuals who could sleep under an ITN if each ITN in the household is used by two people Denominator: Total number of individuals who spent the previous night in surveyed households
• Can be used to assess population coverage of the ITN program, assuming that each ITN in a household can be used by two people in that household
• Can be directly compared with ITN use
to identify gaps.
1.3.2 Household ITN access Proportion of households with at least one ITN for every two people
Established
Numerator: Number of households with at least one ITN for every two people Denominator: Total number of households surveyed
• Can be used to assess household coverage of the ITN program, determining the proportion of households with a sufficient number of ITNs to protect all individuals in the household, assuming two people can sleep under one ITN
1.3.3 Household ITN ownership Proportion of households with at least one ITN
Established
Numerator: Number of households surveyed with at least one ITN Denominator: Total number of households surveyed
• Can be used to assess household coverage of the ITN program, determining the proportion of households with at least one ITN; Insufficient to determine universal ITN coverage according to WHO standards.
1.3.4 ITN use Proportion of the population that slept under an ITN the night before the survey
Established
Numerator: Number of individuals who slept under an ITN the previous night Denominator: Total number of individuals who spent the previous night in surveyed households
• Can be used to assess ITN usage within households. Indicator that best reflects the potential protective effect of ITNs.

30
Indicator Indicator
Status: Definition Interpretation
1.3.5 ITN Use to Access Ratio Proportion of the population that slept under an ITN the night before the survey divided by Proportion of population with access to an ITN in their household
Established
Numerator: ITN Use: Proportion of the population that slept under an ITN the night before the survey Denominator: ITN Access: Proportion of population with access to an ITN in their household
• Can be used to assess the behavioral gap for net use rather than a gap because not enough ITNs are available. This analysis is useful for informing ITN programs whether they need to focus on achieving higher ITN coverage, promoting ITN use or both. The closer the ratio is to 1 or 100%, the smaller the behavioral gap in net use (i.e. the fewer people in the population with access to an ITN but not using it).
1.3.6 Mass campaign ITN distribution coverage Proportion of the population protected by ITNs, based on mass ITN distribution
Adapted
Numerator: Number of ITNs distributed in past 3 years through mass campaigns, multiplied by 2 Denominator: Total estimated population
• Can be used to assess whether enough ITNs were distributed during a mass campaign to cover the population with 1 net for every 2 persons and can highlight gaps in the distribution.
1.3.7 ANC ITN distribution coverage Proportion of pregnant women attending first antenatal care (ANC1) visit who received an ITN during their ANC visit
Adapted
Numerator: Number of pregnant women who received an ITN during their first ANC visit Denominator: Total pregnant women attending first ANC visit
• Can be used to assess whether women who attended their first ANC visit received an ITN. Without additional information, such as ITN stock data, it cannot detail why the women did not receive an ITN.
1.3.8 EPI ITN distribution coverage Proportion of infants 0-11 months attending the expanded program on immunization (EPI) who received an ITN during their EPI visit
Adapted
Numerator: Number of infants 0-11 months attending EPI who received an ITN during their EPI visit Denominator: Total infants 0-11 months attending EPI visit
• Can be used to assess whether infants who attended their EPI visit received an ITN. Without additional information, such as ITN stock data, it cannot detail why infants did not receive an ITN.
1.3.9 ANC and EPI ITN population distribution coverage Proportion of estimated pregnant women and infants 0-11 months who received an ITN during their ANC or EPI visit
Adapted
Numerator: Number of pregnant women and infants 0-11 months who received an ITN during their ANC or EPI visit Denominator: Total estimated pregnant women and infants 0-11 months based on population projections
• Can be used to assess vulnerable population ITN distribution coverage against national targets and to compare population based coverage with other vector control interventions. Reviewed with ANC/EPI ITN distribution, this population-based estimate can help to determine whether individuals not receiving ITNs is due primarily to non-attendance at health facilities or not receiving ITNs when they do attend.
1.3.10 ITN Population distribution coverage through all channels Proportion of population at risk potentially covered by ITNs distributed
Adapted
Numerator: Number of ITNs distributed in past 3 years through all channels, including mass campaigns, ANC/EPI, school-based distribution and community-based campaigns, multiplied by 2 Denominator: Total estimated population at risk of malaria
• Can be used to assess total population ITN distribution coverage against national targets and to compare population based coverage with other vector control interventions.
• Since it totals the number of ITNs distributed over the past three years, is likely an overestimate of the true population protected. Over time, ITNs are lost, torn or no longer used.

31
1.4 VECTOR DENSITY
1.4 Vector Density
Purpose/Rationale: The purpose of the vector density indicator is to determine the seasonality of transmission, the optimal timing of interventions based on transmission season(s), and the impact of vector control interventions. Indicator Indicator
Status: Definition
Interpretation
1.4.1 Vector density Number of adult female Anopheles malaria vectors, disaggregated by species, collected per sample collection - collections and unit time
Established
Numerator: Number of adult female Anopheles malaria vectors collected, disaggregated by species Denominator: Number of sample collections
• Can be used to assess the impact of vector control interventions on reducing vector populations. It is typically an indicator that can be estimated in most endemic settings. While other key indicators, such as sporozoite rate and entomological inoculation rate (EIR) are more closely related to malaria transmission, they may require large sample sizes that may not be feasible to collect in some settings. In addition, these measures may not show enough variation to assess the impact of vector control interventions.
• Should always be disaggregated by method of collection and collection location (i.e. indoors and outdoors).
1.5 INSECTICIDE SUSCEPTIBILITY 1.5 Insecticide susceptibility
Purpose/Rationale: The purpose of the insecticide susceptibility indicators is to guide selection of tools or products that are effective against the wild vector populations. Indicator Indicator
Status: Definition
Interpretation
1.5.1 Insecticide susceptibility Proportion of adult female Anopheles malaria vectors dead after exposure to a discriminating concentration of insecticide ± synergist1
1With adjustment by Abbot’s formula (see Annex B 3.5.1)
Established
Numerator: Number of dead or incapacitated (i.e. unable to fly) adult female Anopheles malaria vectors Denominator: Total number of adult female Anopheles malaria vectors exposed to a discriminating concentration of insecticide in standard bioassays or insecticide plus synergist assay
• Can be used to support the selection of insecticides for IRS and ITNs.
• At least 100 mosquitoes per species should be exposed in a given sample. In lower transmission areas, it may be difficult to obtain adequate samples of mosquitoes for susceptibility testing. Results from smaller samples can be difficult to interpret.
• Insecticide susceptibility should be collected on the same vectors that rest and/or bite indoors, as these are the vectors being targeted by IRS or ITNs.
1.5.2 Insecticide susceptibility intensity Proportion of adult female Anopheles malaria vectors dead after exposure to 5x or 10x discriminating concentrations of an insecticide
Established
Numerator: Number of dead or incapacitated adult female Anopheles malaria vectors Denominator: Total number of adult female Anopheles malaria vectors exposed to 5x or 10x discriminating concentration of insecticide in standard bioassays
• Can be used to support the selection of insecticides for IRS and ITNs. This indicator is intended to measure the strength of expressions of resistance phenotypes to help assess the operational significance of the resistance where detected.
• At least 100 mosquitoes per species should be exposed in a given sample. In lower transmission areas, it may be difficult to obtain adequate samples of mosquitoes for susceptibility testing. Results from smaller samples can be difficult to interpret.

32
1.6 IRS INSECTICIDE RESIDUAL EFFICACY 1.6 IRS insecticide residual efficacy
Purpose/Rationale: The purpose of the IRS insecticide residual efficacy is to determine the period of time the IRS insecticide remains effective against malaria vectors.
Indicator Indicator
Status: Definition Interpretation
1.6.1 IRS insecticide residual efficacy Percent of adult female Anopheles malaria vectors who died after exposure to insecticide-treated surface in the field, by active ingredient, site, and wall type
Established
Numerator: Number of adult female Anopheles malaria vectors who died after exposure to insecticide-treated surface in field, by active ingredient, site, and wall type Denominator: Total number of adult female Anopheles malaria vectors exposed to insecticide-treated surface in the field, by active ingredient, site, and wall type
• Can be used to estimate the time period that the IRS product remains effective against the vectors. The WHO standard is to have above 80% mosquito mortality for the product to be considered effective. Samples are tested one week after spraying, and then every month until mosquito mortality drops below 80% for 2 consecutive months.1
• Can be used to help interpret the impact of IRS on malaria case incidence. However, residual efficacy results can vary widely across settings, years, and sprayable surfaces, sometimes making results difficult to interpret.
1.6.2 IRS insecticide residual efficacy months Average number of months for which IRS insecticide residual efficacy remains above 80% across site and wall type
Established
Average number of months for which IRS insecticide residual efficacy remains above 80% across site and wall type
• Can be used to estimate the time period that the IRS product remains effective against the vectors. This indicator uses the continuous IRS insecticide residual efficacy indicator and creates a binary indicator for each month, where the value is above or below the 80%. This makes it easier to interpret and compare across insecticides but may hide variation.
• Can be used to help inform IRS spray timing and frequency by identifying the point in time when IRS efficacy does not extend through the malaria transmission season.
1.7 CLIMATOLOGICAL INDICATORS 1.7 Climatological Indicators
Purpose/Rationale: The purpose of the climatological indicators is to better understand the vector control intervention context, and climate factors that may independently affect the malaria burden from year to year.
Indicator Indicator
Status: Definition Interpretation
1.7.1 Mean precipitation Average precipitation within a given area over a period of time
Newly
Developed or
Proposed
Average precipitation within a given area over a period of time
• Can be used to explain increases or decrease in vector density and malaria case incidence form year to year.
• Precipitation data is available as a spatial file. In order to effectively use precipitation data valid administrative boundaries must be available to match to the precipitation data. This makes it difficult to use at lower levels, such as the health facility catchment level, where documented administrative boundaries are not available.
1 World Health Organization. 2006. Guidelines for testing mosquito adulticides for indoor residual spraying and treatment of mosquito nets. Geneva: World Health Organization; https://apps.who.int/iris/bitstream/handle/10665/69296/WHO_CDS_NTD_WHOPES_GCDPP_2006.3_eng.pdf

33
TIPS & RESOURCES In this section, we present some practical recommendations for how stakeholders can achieve this integrated
approach to analysis and visualization, including how to:
• Engage stakeholders in integrated data analysis and data visualization design and use
• Manage vector control data
• Integrate datasets from multiple sources, and
• Proactively plan for improved data use for malaria control decisions.
ENGAGING DECISION-MAKERS IN THE DESIGN PROCESS • Engage decision-makers early and often, using user-centered design principles to ensure the decision-
support products (analyses and visualizations) meet stakeholder needs.
• Conduct interviews with a few national program staff and partners involved in vector control decision-
making to get a better understanding of the current decision-making processes, gaps, and user needs.
Figure 12 provides an example question guide developed as part of the PMI VectorLink Project that can
be used or adapted to support this stakeholder engagement process. Focus on:
o Determining the most critical vector control decisions that need to be made, and the processes and
timing of those decisions,
o Reviewing the current decision-making processes, pain points in this process, and how stakeholders
would like this process to be different; and,
o Identifying the guidance, data and other resources that currently exist to inform malaria vector
control decision-making.
• Document and formalize decision-making processes based on interview findings, if they are not
already documented.
• Mock-up your visualization designs using paper and pencil, or computer-based drawing programs
before working in visualization software. This facilitates quick sharing and feedback gathering among key
stakeholders, before working with actual data analysis and visualization tools.
Tips for Engaging Decision-Makers in the Design Process Data Tools & Systems
• N/A
Staffing Considerations:
• Data Analyst/Visualization Specialist with visualization development experience, background in user-
centered design and visualization design principles
• Program Leadership with commitment to using data for decision-making
Additional Resources:
• Entomological Surveillance Planning Tool
• Facilitating Surveillance, Monitoring, and Evaluation in Malaria-Endemic Countries: A Compendium for
National Malaria Programs. Chapters 4: The Role of Data in Decision-Making; Chapter 12: Data Presentation,
Interpretation, & Use

34
Figure 1. Vector Control Decision-Making Interview Guide
Step 1: Identify the decisions, timeline, and decision-makers
1. What types of decisions must be made for effective malaria vector control? For IRS, ITNs, other?
o Some examples may include location, product choice, timing, stratification/targeting?
2. What questions do you need to respond for vector control decision-making as part of your work?
3. When are these decisions about vector control made?
4. What are meetings/venues for making these decisions?
5. Who are the stakeholders and what are their roles in these decision-making processes?
o Who decides? Who influences decisions?
o Which level are these decisions made at? (national, provincial, district)
Step 2: Describe current decision-making processes
6. What data or resources do decision makers currently use to guide these decisions?
o Probe for specific guidance documents, reports, indicators. Obtain examples.
7. Can you describe the decision-making process to me step-by-step? What information do decision-makers
look at/consider first, second, third……?
8. Of the resources that we have discussed, which ones are the most useful to guide decisions and why? Can
you provide examples of these sources, including reports or visualizations?
9. What are the greatest challenges in reviewing evidence to guide vector control decision-making?
10. What suggestions do you have for improving the way vector control decisions are made?
o What if any additional information or resources would improve the processes for making the decisions
that you have described?
Step 3: Describe the future decision-making products
11. What questions do you wish you could answer but that you currently cannot? If you answer these
questions, what impact will it have?
12. Is there any evidence that you wish you had access to in order to guide decision-making? Please describe.
13. Do you have data now to answer this question? Do you think the data could be made available?
14. Do you have any sketches / models / drawings of visualizations you would like to see?
15. How often would you like to update the visualizations?
16. How would you like these decision-making products or visualizations be shared? (online interactive
dashboard, PPT, reports, others?)

35
MANAGING DATA
• Ensure data is collected for the key indicators that will help answer critical vector control
questions, at the necessary level of detail: A foundational element of any strong national malaria
surveillance, monitoring and evaluation (SME) plan is a clear articulation of the key indicators required
to support decisions. The selection of key indicators may be supported by the stakeholder engagement
process recommended above. If any of the identified priority indicators are not already part of a broader
SME or other strategic plan, it will be important for stakeholders to identify how to incorporate them.
Whenever possible, standardized data collection tools and forms should be used to ensure consistency of
data collection across dimensions (for instance, across locations, over time, and among partners). Given
the heterogeneity of malaria, and the increasing need for more localized decision-making, stakeholders
should also consider whether data on key indicators is being collected at the level of detail required for
decision-making, considering factors such as geographic level (national, regional, district levels), vector
control product, or vector species. Increasing granularity of the data can be more costly, but can result in
more accurate, evidence-based decision-making based on local conditions.
• Ensure strong data management practices are developed and supported: Once key malaria
indicators are selected and prioritized, stakeholders must ensure that robust data management tools and
processes are in place and supported. An effective and efficient data life cycle is supported by the
development and use of standardized data collection tools, as noted above, and the use of reliable
databases or data management systems.
• Where possible, manage and store vector control datasets in the same database: The incorporation
of vector control and entomological data into structured databases, and ideally into the same integrated
data systems already in use for other routine malaria data, will facilitate integrated analytics efforts2. For
example, in Mali, the government had malaria case data and ITN data within the same DHIS2 instance.
2 The WHO Global Malaria Program is developing a comprehensive set of DHIS2-based malaria vector control and entomological data standard data modules that country programs may adopt to incorporate these important data sets into existing HMIS. A link to additional information is provided in the Additional Resources box above.
Tips for Managing Data Data Tools & Systems
• Structured database software
Staffing Considerations:
• Data entry staff with experience in timely, accurate data entry
• Data entry supervisors with experience developing and implementing data quality protocols
• Database manager(s), with relevant database experience, who maintains and updates system metadata,
ensuring alignment of key characteristics that facilitate integration of datasets
Additional Resources:
• Facilitating Surveillance, Monitoring, and Evaluation in Malaria-Endemic Countries: A Compendium for
National Malaria Programs
• Entomological Surveillance Planning Tool
• WHO Global Malaria Program, DHIS2 DHIS2-based entomology and vector control data collection and
collation tools

36
REVIEWING DATA AND ASSESSING QUALITY
• Access required datasets: Guided by the stakeholder engagement interviews, identify the required datasets and essential variables. If there is no single managed database, develop a simple Excel-based template to share with partners to clarify the specific variables and preferred data format. Request the data from the owners. Official MOH or NMCP requests for data can improve response rates.
• Understand each dataset and its level of detail: Review the data, making sure it’s what you expect and that it has the right level of detail. The level of detail is “What makes each row in the dataset unique?” It usually includes a geographic hierarchy (district, health facility or entomological site), time period (day, month, year), and may also involve other variables, such as age group, intervention type or product used.
• Review individual datasets for data quality. Check the data received for completeness (what proportion of the expected data is missing?), internal consistency (i.e. is there any period where the number of structures sprayed is greater than the structures found?), and outliers (values outside of the expected range).
• Document key findings from the data quality review: After conducting the data quality review, prepare a series of data quality visualizations or a short report summarizing key indicators, how the findings may effect decision-making, and specific questions for stakeholders to elicit their preferences on how/whether data should be used based on the review.
• Share data quality review findings with stakeholders. During a data quality review meeting present the results to key stakeholders and pose the questions required to inform the vector control decision-making visualizations. Work with stakeholders to reach a consensus on how they would like to use the data and what constitutes “good enough” quality of data for their decision-making process. Use this as an opportunity to prioritize data quality improvements based on decision-makers’ needs.
• Plan how data quality measures will be incorporated into visualizations. Data quality can be incorporated into the final visualization product by a) including a separate set of visualizations that explore data quality, b) including indicators of data quality directly within the main visualizations, c) providing an introduction that notes data cleaning modifications already built into key indicators, or d) developing visualizations that allow users to dynamically choose the level of data quality they are willing to accept.
Tips for Reviewing Data & Assessing Quality
Data Tools/Systems
• Basic: Excel, Access, DHIS2
• Advanced: R, Python, PowerBI, PowerQuery, Stata, SAS, Tableau Prep, Alteryx
Staffing Considerations:
• Data managers or analysts who have familiarity with the datasets of interest and experience with
managing and cleaning datasets; who are also in close contact with data collectors and have time
availability to provide feedback
Additional Resources:
• Facilitating Surveillance, Monitoring, and Evaluation in Malaria-Endemic Countries: A Compendium for
National Malaria Programs. Chapter 11: Data Quality, Data Management and Analysis
• A Practical Guide to Using Routine Data in Evaluation

37
INTEGRATING DATASETS • Process & clean data: Building on the initial data quality review, review and clean each dataset
individually according to the feedback from stakeholders. Conduct additional data quality checks as
needed. The final product should be clean, machine-readable data in a tidy format. A tidy format
contains: one row of headers, each variable forms a column, and each observation forms a row.
• Join with standardized geographical area list: Join the dataset with a master geographical area list, for
example a master health facility list. If there are multiple “master lists” then you may need to first develop
a crosswalk to match the geographic levels to each other across datasets. Identify and resolve
geographical areas that do not match the master list.
• Transform to match the desired end product: Develop a list of variables, with standardized names,
that you would like to have in the final integrated dataset. In each individual dataset, rename and
transform variables to include standardized variables names that will match across datasets. Transform
the dataset so that it matches the required level of detail (i.e. health facility-month, household night) of
the final integrated dataset.
• Combine datasets of the same type: Combine multiple datasets of the same type, for example multiple
IRS datasets from different organizations. Check for any duplicates that may occur between two datasets
of the same type.
• Combine datasets of different types: Combine datasets of different types, for example the now
combined IRS dataset and the entomological datasets. Check that the resulting file contains the correct
level of detail, no missing data and no duplicates.
• Calculate indicators: Calculate cross-dataset indicators. For example, to calculate population protected
by IRS you will need both IRS population protected, from the IRS data and population, often available
from the central statistics office. Conduct additional data quality checks, as needed.
• Develop visualizations: Use your final integrated dataset to create your desired visualizations.
Tips for Integrating Datasets Data Tools/Systems
• Basic: Excel, Access, DHIS2
• Advanced: R, Python, PowerBI, PowerQuery, Stata, SAS, Tableau Prep, Alteryx, QGIS, ArcGIS
Staffing Considerations:
• Data Analyst who has experience with advanced data preparation and analysis software and the
integration of large, complex datasets; For use of climate datasets, skills in geospatial analysis are also
useful.
Additional Resources:
• Facilitating Surveillance, Monitoring, and Evaluation in Malaria-Endemic Countries: A Compendium for
National Malaria Programs. Chapter 11: Data Quality, Data Management and Analysis
• A Practical Guide to Using Routine Data in Evaluation

38
ENHANCING DATA USE • Engage decision-makers in design: Engaging the end users in the design of visualizations, and
designing products to meet their needs, increases the likelihood of data use.
• Develop products that are timely, digestible and action-oriented: o Timely: available in time for key decision-points. The timing of key decision-points can be mapped
out as part of the initial decision-maker interviews, data collection, processing and analysis plans can be developed to meet those timelines.
o Digestible: presented in a format that is easy to read and interpret. Visualizations should include only the necessary data elements required to answer the question of interest. All other information that is not immediately relevant should not be included.
o Action oriented: presented in format that elevates a clear sense of the decisions to be made and actions to take. Visualizations developers should think of the data as a story. Using information from the decision-maker interviews, the visualizations should walk users step-by-step through to the decision-making process.
• Support data use through data review meetings. Visualizations are often more effective when they
are integrated within established data review and decision-making processes (PATH, 2019). Well-
structured data review meetings facilitate the review and interpretation of data, employ a structured,
team-oriented approach to problem-solving, and draw from continuous quality improvement
methodologies. Visualizations to inform vector control decisions can be shared during vector control
steering committee meetings, routine data review meetings, or through special or ad hoc meetings or
workshops. Data review meetings should be used as an opportunity to review the developed
visualizations, to provide feedback on data quality issues, and to refine the documentation of the
decision-making criteria and process based on real-life decision-making experience. Each data review
meeting should end with an action plan with clearly define roles and responsible parties and deadlines for
implementation.
Tips for Enhancing Data Use Data Tools/Systems
• Basic: DHIS2, Excel
• Advanced: Tableau, PowerBI, R, R Shiny
Staffing Considerations:
• Data Analyst/Visualization Specialist with visualization development experience, background in user-
centered design and visualization design principles
• Program Leadership with commitment to using data for decision-making
Additional Resources:
• Facilitating Surveillance, Monitoring, and Evaluation in Malaria-Endemic Countries: A Compendium for
National Malaria Programs. Chapters 4: The Role of Data in Decision-Making; Chapter 12: Data
Presentation, Interpretation, & Use
• A Guide for Conducting Malaria Data Review Meetings
• Monitoring and evaluation of malaria-related routine data during the COVID-19 pandemic
• Analysis and use of Health Facility Data: Guidance for Malaria Programme Managers
• Immunization Data: Evidence for Action. A Realist Review of What Works to Improve Data Use for
Immunization, Evidence from Low- and Middle-Income Countries

39
ANNEX A: BIBLIOGRAPHY Abong'o B, Gimnig JE, Torr SJ, Longman B, Omoke D, Muchoki M, Ter Kuile F, Ochomo E, Munga S,
Samuels AM, Njagi K, Maas J, Perry RT, Fornadel C, Donnelly MJ, Oxborough RM. Impact of indoor residual spraying with pirimiphos-methyl (Actellic 300CS) on entomological indicators of transmission and malaria case burden in Migori County, western Kenya. Sci Rep. 2020 Mar 11;10(1):4518. doi: 10.1038/s41598-020-61350-2. PMID: 32161302; PMCID: PMC7066154. https://www.nature.com/articles/s41598-020-61350-2
Dengela, D., Seyoum, A., Lucas, B. et al. 2018. Multi-country assessment of residual bio-efficacy of insecticides used for
indoor residual spraying in malaria control on different surface types: results from program monitoring in 17 PMI/USAID-supported IRS countries. Parasites Vectors 11: 71. Accessed 29 May 2020. Available at: https://doi.org/10.1186/s13071-017-2608-4
Koenker, H., Arnold, F., Ba, F. et al. 2018. Assessing whether universal coverage with insecticide-treated nets has been
achieved: is the right indicator being used?. Malar J 17, 355 (2018). Accessed 29 May 2020. Available at: https://doi.org/10.1186/s12936-018-2505-0
Koenker H, Ricotta E, Olapeju B, Choiriyyah I. October 2018. Insecticide-Treated Nets (ITN) Access and Use
Report. Baltimore, MD. PMI VectorWorks Project, Johns Hopkins Center for Communication Programs. Accessed 29 May 2020. Available at: https://www.vector-works.org/resources/itn-access-and-use/
Measure Evaluation. (2019). Synthesis of Routine Health Information System Architecture Profiles of PMI Priority
Countries. September 2019. https://www.measureevaluation.org/resources/publications/tr-19-382 Measure Evaluation. (2020). Facilitating Surveillance, Monitoring, and Evaluation in Malaria-Endemic Countries: A Compendium for National Malaria Programs. Chapel Hill, NC, USA: MEASURE Evaluation, University of North Carolina. https://www.measuremalaria.org/wp-content/uploads/2020/02/ms-19-
181.pdf Malaria Elimination Initiative. (2019). Entomological Surveillance Planning Tool. San Francisco: The Global Health
Group, University of California, San Francisco. Accessed 29 May 2020. Available at: http://www.shrinkingthemalariamap.org/entomological-surveillance-planning-tool-espt
Moyes, C.L., Wiebe, A., Gleave, K. et al. Analysis-ready datasets for insecticide resistance phenotype and genotype
frequency in African malaria vectors. Sci Data 6, 121 (2019). https://doi.org/10.1038/s41597-019-0134-2 PATH. PAHO. (2019). Immunization Data: Evidence for Action. A Realist Review of What Works to Improve Data Use
for Immunization, Evidence from Low- and Middle Income Countries. Seattle: PATH; Washington, DC: PAHO; 2019. https://path.azureedge.net/media/documents/PATH_IDEA_WhitePaper_R6_pages_0JAQOBP.pdf
Rehman AM, Coleman M, Schwabe C, et al. How much does malaria vector control quality matter: the epidemiological
impact of holed nets and inadequate indoor residual spraying. PLoS One. 2011;6(4):e19205. Published 2011 Apr 29. Accessed 29 May 2020. Available at: doi:10.1371/journal.pone.0019205
Roll Back Malaria Monitoring and Evaluation Reference Group Survey and Indicator Task Force (2018).
Household Survey Indicators for Malaria Control. Accessed 29 May 2020. Available at: https://www.malariasurveys.org/documents/Household%20Survey%20Indicators%20for%20Malaria%20Control_FINAL.pdf

40
U. S. President’s Malaria Initiative. 2018. U. S. President’s Malaria Initiative technical guidance: 2018 revised for FY2019 planning. Washington DC, USA. Accessed 5 August 2020. Available at: https://stacks.cdc.gov/view/cdc/57228
Watt C, Dye C. 2000. Indicators to measure the impact of malaria control. Geneva, World Health Organization.
(WHO/CDS/RBM/2000.22). Accessed 29 May 2020. Available at: https://apps.who.int/iris/bitstream/handle/10665/66518/WHO_CDS_RBM_2000.22.pdf?sequence=1
World Health Organization. 2006. Guidelines for testing mosquito adulticides for indoor residual spraying and treatment of
mosquito nets. Geneva: World Health Organization; Accessed 29 May 2020. Available at: https://apps.who.int/iris/bitstream/handle/10665/69296/WHO_CDS_NTD_WHOPES_GCDPP_2006.3_eng.pdf
World Health Organization. 2013. Vector Control Technical Expert Group. Report to MPAC: Methods for maintaining
coverage with long-lasting insecticidal nets (LLINs). Geneva: World Health Organization. Accessed 29 May 2020. Available at: https://www.who.int/malaria/mpac/mpac_sp13_vcteg_universal_llin_coverage_report.pdf?ua=1
World Health Organization. 2015a. Global technical strategy for malaria 2016-2030. Accessed 26 December
2020. Geneva: World Health Organization. https://www.who.int/malaria/publications/atoz/9789241564991/en/
World Health Organization. 2015b. Indoor residual spraying: An operational manual for IRS for malaria transmission,
control and elimination. Geneva: World Health Organization. Accessed 29 May 2020. Available at: https://www.who.int/malaria/publications/atoz/9789241508940/en/
World Health Organization. 2016. Test procedures for insecticide resistance monitoring in malaria vector mosquitoes – 2nd
ed. Geneva: World Health Organization. Accessed 29 May 2020. Available at: https://www.who.int/malaria/publications/atoz/9789241511575/en/
World Health Organization. 2017. Achieving and maintaining universal coverage with long-lasting insecticidal
nets for malaria control. Pg. 1. Geneva: World Health Organization. Accessed 29 May 2020. Available at: https://apps.who.int/iris/bitstream/handle/10665/259478/WHO-HTM-GMP-2017.20-eng.pdf?sequence=1
World Health Organization. 2018. Malaria surveillance, monitoring & evaluation: a reference manual. Geneva: World
Health Organization. Licence: CC BY-NC-SA 3.0 IGO. Accessed 29 May 2020. Available at: https://www.who.int/malaria/publications/atoz/9789241565578/en/
World Health Organization. 2019. Guidelines for malaria vector control. Geneva: World Health Organization;
2019. Licence: CC BY-NC-SA 3.0 IGO. Accessed 15 December 2020. Available at: https://apps.who.int/iris/bitstream/handle/10665/310862/9789241550499-eng.pdf?ua=1
.

41
ANNEX B: DETAILED INDICATOR DESCRIPTIONS
1.1 MALARIA BURDEN Purpose/Rationale: The purpose of the malaria burden indicators is to assess the burden of malaria within populations and provide a guide to the level of malaria transmission. Malaria burden indicators are also useful to determine the impact of vector control interventions.
1.1.1 MALARIA PARASITE PREVALENCE Indicator: Malaria parasite prevalence (Proportion of children aged 6-59 months with malaria infection)
Numerator: Number of children aged 6-59 months with malaria infection detected by rapid diagnostic test or microscopy Denominator: Total number of children aged 6-59 months tested for malaria parasites by rapid diagnostic test or microscopy
Established
Indicator Source: Roll Back Malaria Monitoring and Evaluation Reference Group Survey and Indicator Task Force (2018). Household Survey Indicators for Malaria Control. Pgs. 30-34.
Data Source: Malaria parasite prevalence is obtained through household surveys. It is usually available through nationally representative household surveys, such as Demographic and Health Surveys (DHS) or Malaria Indicator Surveys (MIS).DHS and MIS data is available at: https://dhsprogram.com/Data/. It can also be collected as part of special evaluation studies. Considerations & Interpretations:
• “Parasite prevalence can fluctuate dramatically throughout the course of a year with the seasonality of
malaria, and thus values of the indicator may be influenced by the timing of a survey in relation to
peak transmission. Accordingly, parasite prevalence should not be used for tracking the short-term
impact of scaling up prevention efforts, because the prevalence rates may merely reflect differences
in the timing of surveys in relation to within-year variation in parasite prevalence. Parasite prevalence
is better suited to measuring changes in malaria burden over a longer term during which changes in
parasite prevalence are expected to be much greater and outweigh within-year variation. To
demonstrate a reliable trend, no more than four data points within a 10-year span are generally
needed.”3
3 Roll Back Malaria Monitoring and Evaluation Reference Group Survey and Indicator Task Force (2018). Household
Survey Indicators for Malaria Control. https://www.malariasurveys.org/documents/Household%20Survey% 20Indicators%20for%20Malaria% 20Control_FINAL.pdf

42
• In addition, given that nationally representative surveys are powered to present results at the regional
level, parasite prevalence is often not suitable for evaluating interventions conducted at the sub-
regional level.
Table 1.1.1. Strengths and Limitations
Strengths • Indicator is representative of the national and regional population.
• Comparable across countries if appropriate and consistent sampling procedures are
followed.
Limitations • Usually collected only every three to five years, as part of large nationally representative
surveys.
• Nationally representative surveys are powered to present results at the provincial or
regional level and cannot provide accurate estimates for lower levels (i.e. district,
county, health facility).
• The survey recall period may not coincide with the intervention period, leading to an
underestimate of impact. Error! Bookmark not defined.
• “Prevalence estimates for … malaria parasite prevalence may be biased by the
seasonality of survey data collection, because survey fieldwork for DHS and MIS is
sometimes done during the dry season when prevalence is likely at its lowest and
fieldwork for MIS is designed to be done during the high transmission season when net
use may be higher.”Error! Bookmark not defined.

43
1.1.2 MALARIA CASE INCIDENCE Indicator: Malaria case incidence (malaria cases per 1000 population over a specific period of time)
Numerator: Number of malaria cases, multiplied by 1000 Denominator: Total estimated population at risk of malaria
Established
Indicator Source: Adapted from: World Health Organization (2018). Malaria surveillance, monitoring & evaluation: a reference manual. Geneva: World Health Organization. Pg. 192.
Data Sources: The number of malaria cases can be obtained from national health information systems, such as the District Health Information Software 2 (DHIS2) available in many countries. Population estimates may either be available in DHIS2 or through national statistical sources such as projected census reports, or from household enumerations for specific interventions. Considerations & Interpretations:
• Inclusion or exclusion of unconfirmed cases: WHO defines malaria case incidence as confirmed
cases.Error! Bookmark not defined. It is preferable to only include malaria cases confirmed by a diagnostic test,
either a malaria rapid diagnostic test (RDT) or malaria microscopy. However, there may be cases where
the disaggregation of malaria cases by confirmatory status (confirmed or presumed) is not available or
where testing rates are very low. In these cases, it may be useful to consider all reported malaria cases,
rather than only the confirmed cases.
• Malaria case incidence as a reflection of true incidence: Malaria case incidence rates may not reflect the
true incidence of malaria in a population because:
o case data are typically exclusively or primarily from the public health sector and do not
include people diagnosed and treated by the private sector or those who were not diagnosed
via a diagnostic test;
o key indicators may differ by area and over time, such as: ▪ the proportion of patients with suspected malaria patients who attend public health
facilities and
▪ the proportion of patients attending public health facilities who receive a diagnostic
test; and
o health facility reporting rates may also differ by area and over time. Error! Bookmark not defined.
• “When areas with better access to health facilities report higher malaria case incidence than areas with
limited access, it is useful to assess overall health facility usage, percentage of people who receive a
diagnostic test, and completeness of health facility reporting in interpreting the data. It may also be
useful to examine other indicators, such as rates of diagnostic test positivity.”4 • Population estimates for the denominator are often projections from a census. Due to population
growth and human migration, whether permanent or seasonal, population estimates may not truly reflect
the population within a given area. Discussion with local stakeholders can help to determine the most
trusted source for population estimates.
• Malaria case incidence is usually presented by year. When assessing trends over time it is useful to use
the transmission year, rather than the calendar year. The transmission year is defined by observed trends
4 World Health Organization. 2018. Malaria surveillance, monitoring & evaluation: a reference manual. Geneva: World Health Organization. Licence: CC BY-NC-SA 3.0 IGO. https://www.who.int/malaria/publications/atoz/9789241565578/en/

44
in case incidence and begins when cases first start to increase. The transmission year is preferable to a
calendar year because the impact of a vector control intervention such as IRS that targets a season may
have an impact that spans two calendar years.
Table 1.1.2. Strengths and Limitations
Strengths • Usually collected per month and at the health facility level. In some countries available
at the weekly and community level.
Limitations • Biased by focus on public sector reporting, proportion seeking treatment at public
health facilities, diagnostic testing rates and health facility reporting rates.
• Limited by the accuracy of the population estimates.

45
1.2 IRS PROGRAM COVERAGE Purpose/Rationale: The purpose of the IRS program coverage indicators is to assess programmatic coverage of IRS within targeted areas, as well population level coverage of IRS.
1.2.1 IRS POPULATION PROTECTED Indicator: IRS population protected (Proportion of the population protected by IRS)
Numerator: Number of people living in structures that were sprayed during an IRS campaign. Denominator: Total estimated population
Adapted
Indicator Source: Adapted from: World Health Organization. 2015. Indoor residual spraying: An operational manual for IRS for malaria transmission, control and elimination. Pg. 58.
Data Sources: The number of people living in structures that were sprayed during an IRS campaign can usually be collected from the IRS implementing agency, whether government or an implementing partner. Population estimates may either be available in DHIS2 or through national statistical sources such as projected census reports, or from household enumerations for specific interventions. Considerations & Interpretations:
• Interpreting coverage based on population estimates: Population estimates are often projections from
census. Due to population growth and human migration, whether permanent or seasonal, population
estimates may not truly reflect the population within a given area during the time of the IRS campaign.
The variations can become more pronounced when assessing IRS population protected at the more
granular levels of health facility catchment area or community.
Table 1.2.1. Strengths and Limitations
Strengths • Provides a population coverage estimate that can be used to track against national
targets and compare to other vector control or malaria prevention interventions.
Limitations • Limited by the accuracy of the population estimates.

46
1.2.2 SPRAY COVERAGE: SPRAYED OUT OF ELIGIBLE, FOUND STRUCTURES Indicator: Spray coverage (Proportion of the structures sprayed during IRS campaign out of the eligible structures found in the targeted area)
Numerator: Number of eligible structures within the targeted area sprayed with a residual insecticide during IRS campaign Denominator: Total eligible structures found in the targeted area
Established Indicator Source: PMI VectorLink Monitoring and Evaluation Plan
Data Sources: Both the number of structures sprayed and the eligible structures found can usually be collected from the IRS implementing agency, whether government or an implementing partner.
Considerations & Interpretations:
• When at least 80% of structures in a community receive IRS it provides community protection against
malaria infection.5
• Spray coverage is a good measure of program effort but may not adequately assess true coverage of the
IRS intervention. Depending on the terrain of the area, there may be structures that the spray operator
does not find because they are in pockets of isolated structures.
• Including reasons why some eligible, found, structures were not sprayed as sub-indicators can help
programs determine the key barriers to IRS uptake, such as household refusal or structures locked due to
absence for seasonal work.
Table 1.2.2. Strengths and Limitations
Strengths • Provides a good measure of program implementation – whether the available, known
structures were sprayed by the spray operators. WHO recommends that IRS teams
spray at least 80% of houses, structures, or units within targeted areas.6
Limitations • It is not a measure of true coverage in a given area, as only those that are found by
spray operators are included in the denominator.
5 Rehman AM, Coleman M, Schwabe C, et al. How much does malaria vector control quality matter: the epidemiological impact of holed nets and inadequate indoor residual spraying. PLoS One. 2011;6(4):e19205. Published 2011 Apr 29. doi:10.1371/journal.pone.0019205 6 World Health Organization. 2015. Indoor residual spraying: An operational manual for IRS for malaria transmission, control and elimination. https://www.who.int/malaria/publications/atoz/9789241508940/en/

47
1.2.3 SPRAY PROGRESS: SPRAYED OUT OF TARGETED STRUCTURES Indicator: Spray Progress (Proportion of the structures sprayed during IRS campaign out of the estimated targeted structures in the targeted area)
Numerator: Number of structures sprayed during IRS campaign Denominator: Total targeted structures in targeted area
Established Indicator Source: PMI VectorLink Monitoring and Evaluation Plan
Data Sources: Both the number of structures sprayed and the targeted structures are usually available from the IRS implementing agency, whether government or an implementing partner. Governments and implementing partners may use a variety of data sources and methods to determine the number of targeted structures. This is further described under considerations below.
Considerations & Interpretations:
• Target estimates: Programs use several methods to set the targeted number of structures for the coming
year including the number of found structures from the previous year, structure estimates from geospatial
surveys, household enumeration, or estimates based on population. Program staff may set the targeted
number of structures as the total estimated eligible structures within an area or, due to resource
constraints, targeted structures may reflect a partial number of the estimated eligible structures in an area.
Table 1.2.3. Strengths and Limitations
Strengths • Provides an estimate of the status of program implementation – whether the number of
targeted structures that the program intended to spray were sprayed.
Limitations • Spray progress may vary based on the method used to define targeted structures.
• Quality of spray progress estimates may vary depending on the reliability of the data
source for estimating targeted structures.
• May not be a measure of true coverage in a given area, as only those structures that are
defined as targeted are included in the denominator.

48
1.2.4 SPRAYED OUT OF TOTAL ESTIMATED STRUCTURES Indicator: Sprayed out of total estimated structures (Proportion of the structures sprayed during IRS campaign out of the estimated total eligible structures)
Numerator: Number of structures sprayed during IRS campaign Denominator: Total estimated eligible structures
Newly
Developed or Proposed
Indicator Source: No previously documented indicator source.
Data Sources: The number of structures sprayed are usually available from the IRS implementing agency, whether government or an implementing partner. Governments and implementing partners may use a variety of methods to determine the total estimated eligible structures. Data sources from eligible structures comes from IRS program data and population source estimates. This is further described under considerations below.
Considerations & Interpretations:
• Total eligible structures estimates: While “found structures” relies on spray operators in the field to count
structures, programs use several methods to obtain a count of the total number of estimated eligible
structures within an area, including the number of found or targeted structures from the previous year,
structure estimates from geospatial surveys, household enumeration, or estimates based on population.
The number of total structures is designed to capture all estimated eligible structures in a given area,
including both the targeted and untargeted structures. Depending on the targeting strategy, the total
number of estimated eligible structures may be the same as the targeted structures.
Table 1.2.4. Strengths and Limitations
Strengths • Can provide an estimate of the total number of structures within a given area, which
may be separate from the subset of targeted or found structures.
• Provides a structure equivalent to population coverage estimate that can be used to
track against national targets.
Limitations • Quality of estimates may vary depending on the reliability of the data source for
estimating total eligible structures.

49
1.3 ITN PROGRAM COVERAGE Purpose/Rationale: The purpose of the ITN program coverage indicators is to assess programmatic and population level coverage of ITN through distribution and ITN use.
1.3.1 POPULATION ITN ACCESS
Indicator: Population ITN access (Proportion of population with access to an ITN in their household) Numerator: Total number of individuals who could sleep under an ITN if each ITN in the household is used by two people Denominator: Total number of individuals who spent the previous night in surveyed households
Established
Indicator Source: Roll Back Malaria Monitoring and Evaluation Reference Group Survey and Indicator Task Force (2018). Household Survey Indicators for Malaria Control. Pgs. 15-16.
Data Sources: This indicator is usually available through nationally representative household surveys, such as DHS or MIS. DHS and MIS data is available at: https://dhsprogram.com/Data/ . It can also be collected as part of special evaluation studies. Considerations & Interpretations:
• “This indicator estimates the proportion of the population that could potentially be covered by existing
ITNs, assuming that each ITN in a household can be used by two people in that household.”7
• It has been recommended that “when programs assess the success of ITN distribution activities,
population access to ITNs should be considered as the better indicator of ‘universal coverage,’ because it
is based on people as the unit of analysis.” This is because “under current ITN distribution strategies, the
global malaria community cannot expect countries to reach 80% of households owning 1 ITN for 2
people at a national level.”8
Table 1.3.1. Strengths and Limitations
Strengths • Accounts for all ITNs in households.
• Can be directly compared with ITN use to identify gaps.
• Indicator is representative of the national and regional population.
• Comparable across countries if appropriate and consistent sampling procedures are followed.
Limitations • Usually collected only every three to five years, as part of large nationally representative surveys.
• Nationally representative surveys are powered to present results at the provincial or regional level and cannot provide accurate estimates for lower levels (i.e. district, county, health facility).
7 Roll Back Malaria Monitoring and Evaluation Reference Group Survey and Indicator Task Force (2018). Household Survey Indicators for Malaria Control. https://www.malariasurveys.org/documents/Household%20Survey%20Indicators%20for%20Malaria%20Control_FINAL.pdf 8 Koenker, H., Arnold, F., Ba, F. et al. 2018. Assessing whether universal coverage with insecticide-treated nets has been achieved: is the right indicator being used?. Malar J 17, 355 (2018). Accessed 29 May 2020. Available at: https://doi.org/10.1186/s12936-018-2505-0

50
• The survey period may not coincide with the ITN distribution campaigns, causing ITN access to be underestimated.
1.3.2 HOUSEHOLD ITN ACCESS
Indicator: Household ITN access (Proportion of households with at least one ITN for every two people)
Numerator: Number of households with at least one ITN for every two people Denominator: Total number of households surveyed
Established
Indicator Source: Roll Back Malaria Monitoring and Evaluation Reference Group Survey and Indicator Task Force (2018). Household Survey Indicators for Malaria Control. Pg. 14.
Data Sources: This indicator is usually available through nationally representative household surveys, such as DHS or MIS. DHS and MIS data is available at: https://dhsprogram.com/Data/ . It can also be collected as part of special evaluation studies. Considerations & Interpretations:
• This indicator is used to determine the proportion of households with a sufficient number of ITNs
to protect all individuals in the household, assuming two people can sleep under one ITN.
• If the difference between this indicator and household ITN ownership is substantial, “programs need
to assess whether current ITN distribution strategies should be revised to address the gap – and
ensure households have an appropriate number of ITNs.”9
• When compared to population ITN access, this indicator underestimates coverage by ignoring
households with ITNs covering some but not all individuals within the household. To further explain
the difference: “This indicator produces a value of 1 or 0 for each household based on whether there
is full household coverage or enough nets in the household to cover all household members. Even
90 percent coverage in a household would lead to a value of 0 for the house. Thus, this indicator
often has fairly low values even in countries with high levels of ITN coverage.”Error! Bookmark not defined.
Table 1.3.2. Strengths and Limitations
Strengths • Correlates with WHO and country goals of providing 1 ITN for every 2 people.
• Easy to communicate to stakeholders
• Indicator is representative of the national and regional population.
• Comparable across countries if appropriate and consistent sampling procedures are
followed.
Limitations • Underestimates coverage by ignoring households with ITNs covering some but not all
individuals.
• Usually collected only every three to five years, as part of large nationally representative
surveys.
• Nationally representative surveys are powered to present results at the provincial or
regional level and cannot provide accurate estimates for lower levels (i.e. district,
county, health facility).
9 Roll Back Malaria Monitoring and Evaluation Reference Group Survey and Indicator Task Force (2018). Household Survey Indicators for Malaria Control. https://www.malariasurveys.org/documents/Household%20Survey%20Indicators %20for%20Malaria%20Control_FINAL.pdf

51
• The survey period may not coincide with the ITN distribution campaigns, causing their
access to be underestimated.
1.3.3 HOUSEHOLD ITN OWNERSHIP Indicator: Household ITN ownership (Proportion of households with at least one ITN)
Numerator: Number of households surveyed with at least one ITN Denominator: Total number of households surveyed
Established
Indicator Source: Roll Back Malaria Monitoring and Evaluation Reference Group Survey and Indicator Task Force (2018). Household Survey Indicators for Malaria Control. Pg. 13.
Data Sources: This indicator is usually available through nationally representative household surveys, such as DHS or MIS. DHS and MIS data is available at: https://dhsprogram.com/Data/ . It can also be collected as part of special evaluation studies.
Considerations & Interpretations:
• “This indicator provides a measure for household ownership of an ITN. It reflects the extent to
which ITN programs have reached all households or, conversely, the proportion of households not
yet reached.”10
Table 1.3.3. Strengths and Limitations
Strengths • Assesses minimum coverage of ITNs.
• Indicator is representative of the national and regional population.
• Comparable across countries if appropriate and consistent sampling procedures are
followed.
Limitations • Insufficient to determine universal ITN coverage according to WHO standards.
• Usually collected only every three to five years, as part of large nationally representative
surveys.
• Nationally representative surveys are powered to present results at the provincial or
regional level and cannot provide accurate estimates for lower levels (i.e. district,
county, health facility).
• The survey period may not coincide with the ITN distribution campaigns, causing ITN
ownership to be underestimated.
10 Roll Back Malaria Monitoring and Evaluation Reference Group Survey and Indicator Task Force (2018). Household Survey Indicators for Malaria Control. https://www.malariasurveys.org/documents/Household%20Survey%20Indicators%20for%20Malaria%20Control_FINAL.pdf

52
1.3.4 ITN USE Indicator: ITN use (Proportion of the population that slept under an ITN the night before the survey)
Numerator: Number of individuals who slept under an ITN the previous night Denominator: Total number of individuals who spent the previous night in surveyed households
Established
Indicator Source: Roll Back Malaria Monitoring and Evaluation Reference Group Survey and Indicator Task Force (2018). Household Survey Indicators for Malaria Control. Pg. 17.
Data Sources: This indicator is usually available through nationally representative household surveys, such as DHS or MIS. DHS and MIS data is available at: https://dhsprogram.com/Data/ . It can also be collected as part of special evaluation studies.
Considerations & Interpretations:
• “This indicator may be biased by the seasonality of survey data collection, since survey fieldwork for
DHS and MIS is most often done during the dry season when net use is likely at its lowest.” 11
• “This indicator provides a direct measure of ITN use by all age groups at the time of the survey. It
includes all individuals who spent the previous night in surveyed households, including visitors,
regardless of whether those individuals had access to an ITN in their own households.”Error! Bookmark
not defined. It can be broken down by five-year age brackets, gender, pregnancy status and other
demographic variables for programmatic analysis.
Table 1.3.4. Strengths and Limitations
Strengths • Assesses use of ITNs within the household
• Indicator is representative of the national and regional population.
• Comparable across countries if appropriate and consistent sampling procedures are
followed.
Limitations • Usually collected only every three to five years, as part of large nationally representative
surveys.
• The survey period may not coincide with the ITN distribution campaigns, causing ITN
use to be underestimated.
• Nationally representative surveys are powered to present results at the provincial or
regional level and cannot provide accurate estimates for lower levels (i.e. district,
county, health facility).
11 Roll Back Malaria Monitoring and Evaluation Reference Group Survey and Indicator Task Force (2018). Household Survey Indicators for Malaria Control. https://www.malariasurveys.org/documents/Household%20Survey%20Indicators%20for%20Malaria%20Control_FINAL.pdf

53
1.3.5 ITN USE TO ACCESS RATIO Indicator: ITN Use to Access Ratio
Numerator: ITN Use: Proportion of the population that slept under an ITN the night before the survey Denominator: ITN Access: Proportion of population with access to an ITN in their household
Established
Indicator Source: Koenker H, Ricotta E, Olapeju B, Choiriyyah I. October 2018. Insecticide-Treated Nets (ITN) Access and Use Report. Baltimore, MD. PMI VectorWorks Project, Johns Hopkins Center for Communication Programs.
Data Sources: This indicator is usually available through nationally representative household surveys, such as DHS or MIS. DHS and MIS data is available at: https://dhsprogram.com/Data/ . It can also be collected as part of special evaluation studies.
Considerations & Interpretations:
• This indicator is a ratio of two other indicators: ITN use and ITN access. While it is a ratio of two
indicators, it is often presented as a percentage.
• This indicator provides data on the behavioral gap for net use rather than a gap because not enough
ITNs are available. This analysis is useful for informing ITN programs whether they need to focus
on achieving higher ITN coverage, promoting ITN use or both. The closer the ratio is to 1 or 100%,
the smaller the behavioral gap in net use (i.e. the fewer people in the population with access to an
ITN but not using it).
Table 1.3.5. Strengths and Limitations
Strengths • Useful for information to focus programmatic efforts on behavior change to increase
ITN use, increasing ITN coverage or both.
• Indicator is representative of the national and regional population.
• Comparable across countries if appropriate and consistent sampling procedures are
followed.
Limitations • Usually collected only every three to five years, as part of large nationally representative
surveys.
• The survey period may not coincide with the ITN distribution campaigns, causing ITN
use to be underestimated.
• Nationally representative surveys are powered to present results at the provincial or
regional level and cannot provide accurate estimates for lower levels (i.e. district,
county, health facility).

54
1.3.6 MASS CAMPAIGN ITN DISTRIBUTION COVERAGE Indicator: Mass campaign ITN distribution coverage (Proportion of the population protected by ITNs, based on mass ITN distribution)
Numerator: Number of ITNs distributed in past 3 years through mass campaigns, multiplied by 2 Denominator: Total estimated population
Adapted
Indicator Source: Adapted from: World Health Organization. 2017. Achieving and maintaining universal coverage with long-lasting insecticidal nets for malaria control. Pg. 1. Indicator Source: Adapted from: World Health Organization (2018). Malaria surveillance, monitoring & evaluation: a reference manual. Geneva: World Health Organization. Pg. 186.
Data Sources: The number of ITNs distributed can be obtained from the NMCP staff or implementing partners supporting ITN distribution. Population estimates may either be available in DHIS2 or through national statistical sources such as projected census reports, or from household enumerations conducted prior to ITN distribution.
Considerations & Interpretations:
• The World Health Organization recommends that NMCPs distribute “one net for every two persons at risk of malaria.”12 The mass campaign ITN distribution indicator can show whether enough ITNs were distributed during a mass campaign to cover the population with 1 net for every 2 persons and can highlight any gaps in the distribution.
• This data is usually available down to the district level. However, unlike the ITN ownership, access and use indicators above, it does not provide detail on the availability and use of ITNs at the household level.
Table 1.3.6. Strengths and Limitations
Strengths • Usually available country-wide and to the district level.
• Can help to identify successes and gaps in ITN distribution.
Limitations • Only assesses the ITNs distributed, not the proportion of nets that are currently
available or in use.
12 World Health Organization. 2017. Achieving and maintaining universal coverage with long-lasting insecticidal nets for malaria control. Pg. 1. https://apps.who.int/iris/bitstream/handle/10665/259478/WHO-HTM-GMP-2017.20-eng.pdf?sequence=1

55
1.3.7 ANC ITN DISTRIBUTION COVERAGE Indicator: ANC ITN distribution coverage (Proportion of pregnant women attending first antenatal care (ANC1) visit who received an ITN during their ANC visit)
Numerator: Number of pregnant women who received an ITN during their first ANC visit Denominator: Total pregnant women attending first ANC visit
Adapted
Indicator Source: Adapted from: World Health Organization. 2013. Vector Control Technical Expert Group. Report to MPAC: Methods for maintaining coverage with long-lasting insecticidal nets (LLINs). Pg. 7.
Data Sources: The number of ITNs distributed through ANC and the number of ANC visits can be obtained from national health information systems, such as the DHIS2 available in many countries.
Considerations & Interpretations:
• This indicator assesses whether women who attended their first ANC visit received an ITN. Without
additional information, such as ITN stock data, it cannot detail why the women did not receive an
ITN. • ANC ITN distribution coverage does not reflect the true coverage of ITNs among pregnant women
in the population because:
o most reports are from the public health sector;
o the proportion of pregnant women who attend public health facilities for ANC (from which
most data are derived) may differ by area and over time;
o health facility reporting rates may differ by area.
Table 1.3.7. Strengths and Limitations
Strengths • Usually available country-wide, per month and at the health facility level. In some
countries available at the weekly and community level.
• Assesses ITN distribution through ANC.
Limitations • Only assesses whether ITNs were distributed through ANC, not the proportion of
ITNs that are currently available or in use.
• Cannot determine the reason why ITNs may not be distributed.
• Biased by proportion seeking treatment at public health facilities and health facility
reporting rates.

56
1.3.8 EPI ITN DISTRIBUTION COVERAGE Indicator: EPI ITN distribution coverage (Proportion of infants 0-11 months attending the expanded program on immunization (EPI) who received an ITN during their EPI visit)
Numerator: Number of infants 0-11 months attending EPI who received an ITN during their EPI visit Denominator: Total infants 0-11 months attending EPI visit
Adapted
Indicator Source: Adapted from: World Health Organization. 2013. Vector Control Technical Expert Group. Report to MPAC: Methods for maintaining coverage with long-lasting insecticidal nets (LLINs). Pg. 7.
Data Sources: The number of ITNs distributed through EPI and the number of EPI visits can be obtained from national health information systems, such as the DHIS2 available in many countries.
Considerations & Interpretations:
• This indicator assesses whether infants who attended their EPI visit received an ITN. Without
additional information, such as ITN stock data, it cannot detail why infants did not receive an ITN. • EPI ITN distribution coverage may not reflect the true coverage of ITNs among infants in the
population because:
o most reports are from the public health sector;
o the proportion of infants who attend public health facilities for EPI (from which most data
are derived) may differ by area and over time;
o health facility reporting rates may differ by area.
Table 1.3.8. Strengths and Limitations
Strengths • Usually available country-wide, per month and at the health facility level. In some
countries available at the weekly and community level.
• Assesses ITN distribution through EPI.
Limitations • Only assesses whether ITNs were distributed through EPI, not the proportion of nets
that are currently available or in use.
• Cannot determine the reason why ITNs may not be distributed.
• Biased by proportion seeking treatment at public health facilities and health facility
reporting rates.

57
1.3.9 ANC AND EPI ITN POPULATION DISTRIBUTION COVERAGE Indicator: ANC and EPI ITN population distribution coverage (Proportion of estimated pregnant women and infants 0-11 months who received an ITN during their ANC or EPI visit)
Numerator: Number of pregnant women and infants 0-11 months who received an ITN during their ANC or EPI visit Denominator: Total estimated pregnant women and infants 0-11 months based on population projections
Adapted
Indicator Source: Adapted from: World Health Organization. 2013. Vector Control Technical Expert Group. Report to MPAC: Methods for maintaining coverage with long-lasting insecticidal nets (LLINs). Pg. 7.
Data Sources: The number of ITNs distributed through ANC and EPI visits can be obtained from national health information systems, such as the DHIS2 available in many countries. Population estimates may either be available in DHIS2 or through national statistical sources such as projected census reports, or from household enumerations for specific interventions.
Considerations & Interpretations:
• This indicator uses population estimates to determine the total percentage of the vulnerable
populations of pregnant women and infants 0-11 months who received an ITN through a health
facility. Reviewed alongside the ANC and EPI ITN distribution coverage indicators, this population-
based estimate can help to determine whether individuals not receiving ITNs is due primarily to non-
attendance at health facilities or not receiving ITNs when they do attend.
• Interpreting coverage based on population estimates: Population estimates are often projections from
census. Due to population growth and human migration, whether permanent or seasonal, population
estimates may not truly reflect the population within a given area. The variations can become more
pronounced at the more granular levels of health facility or community. Thus, at lower levels it
becomes more likely that the estimates of the vulnerable population receiving an ITN during a health
facility visit are higher or lower than the true population receiving nets.
Table 1.3.9. Strengths and Limitations
Strengths • Usually available country-wide, per month and at the health facility level. In some
countries available at the weekly and community level.
• Provides a population coverage estimate that can be used to track against national
targets and compare to other vector control or malaria prevention interventions.
Limitations • Only assesses whether ITNs were distributed through ANC and EPI, not the
proportion of nets that are currently available or in use.
• Cannot determine the reason why ITNs may not be distributed.
• Biased by proportion seeking treatment at public health facilities and health facility
reporting rates.
• Limited by the accuracy of the population estimates.

58
1.3.10 ITN POPULATION DISTRIBUTION COVERAGE THROUGH ALL
CHANNELS Indicator: ITN Population distribution coverage through all channels (Proportion of population at risk potentially covered by ITNs distributed)
Numerator: Number of ITNs distributed in past 3 years through all channels, including mass campaigns, ANC/EPI, school-based distribution and community-based campaigns, multiplied by 2 Denominator: Total estimated population at risk of malaria
Adapted
Indicator Source: Adapted from: World Health Organization (2018). Malaria surveillance, monitoring & evaluation: a reference manual. Geneva: World Health Organization. Pg. 186.
Data Sources: The number of ITNs distributed through each channel can be obtained from various data sources. ITNs distributed through ANC and EPI visits can be obtained from national health information systems, such as the DHIS2 available in many countries. ITNs distributed through mass campaigns, school-based, or community-based distribution campaigns, can be obtained from the NMCP staff or implementing partners supporting the ITN distributions. In some cases, this information is also entered into the national DHIS2. Population estimates may either be available in DHIS2 or through national statistical sources such as projected census reports, or from household enumerations conducted prior to ITN distribution.
Considerations & Interpretations:
• The World Health Organization recommends that NMCPs distribute “one net for every two persons at risk of malaria.”13 This indicator can show whether enough ITNs were distributed through all channels (including mass campaigns, school-based or community-based distributions, and ANC and EPI facility-based distributions) to cover the population with 1 net for every 2 persons. This indicator can help highlight any locations that may have gaps in distribution. When interpreting this indicator, one would look for a percentage at or above 100% for each area at risk of malaria.
Table 1.3.10. Strengths and Limitations
Strengths • Provides an overview of whether the minimum number of required ITNs required to
protect the population are being distributed.
• Provides a population coverage estimate that can be used to track against national
targets and compare to other vector control or malaria prevention interventions.
Limitations • Only assesses the potential population coverage based on all ITNs distributed, not the
proportion of nets that are currently available or in use.
• Since it totals the number of ITNs distributed over the past three years, is likely an
overestimate of the true population protected. Over time, ITNs are lost, torn or no
longer used.
• Can only be summarized at the lowest level that data is available across all sources.
• Cannot determine the reason why ITNs may not be distributed at adequate levels to
cover the population.
13 World Health Organization. 2017. Achieving and maintaining universal coverage with long-lasting insecticidal nets for malaria control. Pg. 1. https://apps.who.int/iris/bitstream/handle/10665/259478/WHO-HTM-GMP-2017.20-eng.pdf?sequence=1

59
• Limited by the accuracy of the population estimates.
1.4 VECTOR DENSITY Purpose/Rationale: The purpose of the vector density indicator is to determine the seasonality of transmission, the optimal timing of interventions based on transmission season(s), and the impact of vector control interventions.
1.4.1 VECTOR DENSITY Indicator: Vector density (Number of adult female Anopheles malaria vectors, disaggregated by species, collected per sample collection - collections and unit time)
Numerator: Number of adult female Anopheles malaria vectors collected, disaggregated by species Denominator: Number of sample collections
Established
Indicator Source: World Health Organization. 2018. Malaria surveillance, monitoring & evaluation: a reference manual. Geneva: World Health Organization. Pg. 89.
Data Sources: This indicator is usually available through entomological surveillance studies. Considerations & Interpretations:
• Vector density is commonly collected where entomological monitoring is implemented and is often used
to examine impact of vector control interventions that are intended to reduce the vector population. It is
typically an indicator that can be estimated in most endemic settings. While other key indicators, such as
sporozoite rate and entomological inoculation rate (EIR) are more closely related to malaria transmission,
they may require large sample sizes that may not be feasible to collect in some settings. In addition, these
measures may not show enough variation to assess the impact of vector control interventions.
• Vector density can be thought of as a superindicator for assessing total vectors that includes several other
indicators, depending upon the data collection method. For example, vector density collected through
human landing catch produces human biting rates, biting time, and biting location. Vector density
collected through pyrethrums spray catches produces indoor resting density. Vector density can also be
used to calculate vector occurrence and species composition. While many different sample collection
methods can be used, each method should be presented separately as vector densities are not comparable
across methods.14
• Samples should be collected on a routine basis throughout the transmission season.
Table 1.4.1. Strengths and Limitations
Strengths • Allows the ability to determine the seasonality of vectors, and thus, transmission risk.
• Can be used to assess the impact of vector control interventions on vector populations.
Limitations • Not easily comparable across collection methods.
14 Malaria Elimination Initiative. (2020). Entomological Surveillance Planning Tool. San Francisco: The Global Health Group, University of California, San Francisco.

60
1.5 INSECTICIDE SUSCEPTIBILITY Purpose/Rationale: The purpose of the insecticide susceptibility indicators is to guide selection of tools or products that are effective against the wild vector populations.
1.5.1 INSECTICIDE SUSCEPTIBILITY Indicator: Insecticide susceptibility (Proportion of adult female Anopheles malaria vectors dead after exposure to a discriminating concentration of insecticide ± synergist)
Numerator: Number of dead or incapacitated adult female Anopheles malaria vectors Denominator: Total number of adult female Anopheles malaria vectors exposed to a discriminating concentration of insecticide in standard bioassays or insecticide plus synergist assay
Established
Indicator Source: World Health Organization. 2018. Malaria surveillance, monitoring & evaluation: a reference manual. Geneva: World Health Organization. Pg. 90.
Data Sources: This indicator is usually available through entomological surveillance studies using WHO tube tests or CDC bottle bioassays.15 Some of this data can be found online at IR Mapper (https://www.irmapper.com/) and through data collected by Moyes et al.16 and available online (https://doi.org/10.5061/dryad.dn4676s). Considerations & Interpretations:
• Per WHO standards, insecticide susceptibility is classified as:
o < 90% = confirmed resistance;
o 90–97% = possible resistance;
o ≥ 98% = susceptibility.19
• At least 100 mosquitoes per species should be exposed in a given sample per insecticide tested.19
• The results should be presented separately for each species.
• When calculating insecticide susceptibility, results may need to be adjusted for using Abbott’s
formula. Specifically, a set of control mosquitoes should be kept during the period of insecticide
susceptibility evaluation. “If 24-hr mortality in controls exceeds 20% using WHO tube assays, all
results from that day’s tests must be discarded. If mortality in the control is between 5-20%,
results must be corrected for control mortality using Abbott’s formula. Control mortality is
assessed at 2 hours using the CDC bottle assay. When control mortality is > 10%, test results
should be discarded; use Abbott’s formula to correct for control mortalities of 3 to 10%.”17
Abbot’s formula is calculated as [(% control living - % exposed living) /% control living] X
100%.
• In cases where it is difficult to obtain adequate samples of mosquitoes for susceptibility testing,
the insecticides that are currently in use or most likely to be used in the future should be
prioritized for testing.
15 World Health Organization. 2016. Test procedures for insecticide resistance monitoring in malaria vector mosquitoes – 2nd ed. Geneva: World Health Organization. https://www.who.int/malaria/publications/atoz/9789241511575/en/ 16 Moyes, C.L., Wiebe, A., Gleave, K. et al. Analysis-ready datasets for insecticide resistance phenotype and genotype frequency in African malaria vectors. Sci Data 6, 121 (2019). https://doi.org/10.1038/s41597-019-0134-2 17 U. S. President’s Malaria Initiative technical guidance: 2018 revised for FY2019 planning

61
Table 1.5.1. Strengths and Limitations
Strengths • Supports the selection of insecticides for IRS and ITNs.
Limitations • In lower transmission areas, it may be difficult to obtain adequate samples of
mosquitoes for susceptibility testing. Results from smaller samples can be difficult to
interpret.

62
1.5.2 INSECTICIDE SUSCEPTIBILITY INTENSITY Indicator: Insecticide susceptibility intensity (Proportion of adult female Anopheles malaria vectors dead after exposure to 5x or 10x discriminating concentrations of an insecticide)
Numerator: Number of dead or incapacitated adult female Anopheles malaria vectors Denominator: Total number of adult female Anopheles malaria vectors exposed to 5x or 10x discriminating concentration of insecticide in standard bioassays
Established
Indicator Source: World Health Organization. 2018. Malaria surveillance, monitoring & evaluation: a reference manual. Geneva: World Health Organization. Pg. 90.
Data Sources: This indicator is usually available through entomological surveillance studies using WHO tube tests or CDC bottle bioassays.18 Considerations:
• This indicator is intended to measure the strength of expressions of resistance phenotypes to
help assess the operational significance of the resistance where detected.
• Per WHO classifications
o < 98% after 10x exposure = high-intensity resistance;
o ≥ 98% after 10x exposure but < 98% after 5x exposure = moderate intensity resistance;
o ≥ 98% after 10x and 5x exposure but < 98% after 1x exposure = low-intensity resistance.14
• At least 100 mosquitoes per species should be exposed in a given sample.14
• The results should be presented separately for each species.
Table 1.5.2. Strengths and Limitations
Strengths • Supports the selection of insecticides for IRS and ITNs, particularly useful for
identifying locations for new types of nets.
Limitations • In lower transmission areas, it may be difficult to obtain adequate samples of
mosquitoes for susceptibility testing. Results from smaller samples can be difficult to
interpret.
18 World Health Organization. 2016. Test procedures for insecticide resistance monitoring in malaria vector mosquitoes – 2nd ed. Geneva: World Health Organization. https://www.who.int/malaria/publications/atoz/9789241511575/en/

63
1.6 IRS INSECTICIDE RESIDUAL EFFICACY Purpose/Rationale: The purpose of the IRS insecticide residual efficacy is to determine the period of time the IRS insecticide remains effective against malaria vectors.
1.6.1 IRS INSECTICIDE RESIDUAL EFFICACY Indicator: IRS insecticide residual efficacy (Percent of adult female Anopheles malaria vectors who died after exposure to insecticide on treated surface in the field.)
Numerator: Number of adult female Anopheles malaria vectors who died after exposure to insecticide on treated surface in field.
Denominator: Total number of adult female Anopheles malaria vectors exposed to treated surface in the field.
Established
Indicator Source: World Health Organization. 2006. Guidelines for testing mosquito adulticides for indoor residual spraying and treatment of mosquito nets. Geneva: World Health Organization. Pg. 13-14.
Data Sources: This indicator is usually available through entomological surveillance studies using cone wall bioassays.
Considerations & Interpretations:
• The purpose of this indicator is to estimate the time period that the IRS product remains effective against
the vectors. The WHO standard is to have above 80% mosquito mortality for the product to be
considered effective. Samples are tested one week after spraying, and then every month until mosquito
mortality drops below 80%.19
• Data can be disaggregated by the wall type (i.e. cement, mud, painted), or the lowest value across wall
types can be used to create a summary indicator. If the most common type of wall in the sprayed area is
known, this can help in the analysis and interpretation of results.
• The recommended exposure period for residual efficacy tests varies by chemical.
• Residual efficacy has a wide variance across settings, years, and sprayable surfaces.20
• When reporting residual efficacy, the mosquito source (locally collected vs. lab reared), should always be
noted, as the results and interpretation can differ according to the source.
Table 1.6.1. Strengths and Limitations
Strengths • Supports the selection of insecticides for IRS.
• Can help with the interpretation of impact of IRS on malaria case incidence.
Limitations • Presented as a continuous variable, can be difficult to summarize and interpret for
decision-makers.
19 World Health Organization. 2006. Guidelines for testing mosquito adulticides for indoor residual spraying and treatment of mosquito nets. Geneva: World Health Organization; https://apps.who.int/iris/bitstream/handle/10665/69296/WHO_CDS_NTD_WHOPES_GCDPP_2006.3_eng.pdf 20 Dengela, D., Seyoum, A., Lucas, B. et al. 2018. Multi-country assessment of residual bio-efficacy of insecticides used for indoor residual spraying in malaria control on different surface types: results from program monitoring in 17 PMI/USAID-supported IRS countries. Parasites Vectors (2018) 11: 71. https://doi.org/10.1186/s13071-017-2608-4

64
• Residual efficacy results can vary widely across settings, years, and sprayable surfaces,
making results more difficult to interpret.
1.6.2 IRS INSECTICIDE RESIDUAL EFFICACY MONTHS Indicator: IRS insecticide residual efficacy months (Number of months for which IRS insecticide residual efficacy remains above 80%)
Numerator: N/A Denominator: N/A
Established
Indicator Source: World Health Organization. 2006. Guidelines for testing mosquito adulticides for indoor residual spraying and treatment of mosquito nets. Geneva: World Health Organization. Pg. 13-14.
Data Sources: This indicator is usually available through entomological surveillance studies using cone bioassays.
Considerations & Interpretations:
• This indicator uses the continuous IRS insecticide residual efficacy indicator and creates a binary
indicator for each month, where the value is above or below the 80%.
• Data can be disaggregated by the wall type (i.e. cement, mud, painted), or the lowest value across wall
types can be used to create a summary indicator. If the most common type of wall in the sprayed area
is known, this can help in the analysis and interpretation of results.
• The recommended exposure period for residual efficacy tests varies by chemical.
• Residual efficacy has a wide variance across settings, years, and sprayable surfaces.21
• When reporting residual efficacy, the mosquito source (locally collected vs. lab reared), should always
be noted, as the results and interpretation can differ according to the source.
Table 1.6.2. Strengths and Limitations
Strengths • Easier to interpret and compare across insecticides.
• Supports the selection of insecticides for IRS.
• Can help with the interpretation of impact of IRS on malaria case incidence.
Limitations • Residual efficacy results can vary widely across settings, years, and sprayable surfaces,
making results more difficult to interpret.
21 Ibid.

65
1.7 CLIMATOLOGICAL INDICATORS Purpose/Rationale: The purpose of the climatological indicators is to better understand the vector control intervention context, and climate factors that may independently affect the malaria burden from year to year.
1.7.1 MEAN PRECIPITATION Indicator: Mean precipitation (Average precipitation within a given area over a period of time.)
Newly
Developed or Proposed
Indicator Source: No previously documented indicator source.
Data Sources: Precipitation data is freely available online from the Climate Hazards Group InfraRed Precipitation with Station Data (CHIRPS) ( https://www.chc.ucsb.edu/data/chirps/ ). Data from government meteorological departments may also be available. The specific precipitation sources can be chosen based on the level of detail required for the analyses. For example, CHIRPS data is available at 4 km spatial resolution and are composited in daily, 5-day, 10-day, and monthly units. Considerations & Interpretations:
• Precipitation data is available as a spatial file. In order to effectively use precipitation data valid
administrative boundaries must be available to match to the precipitation data.
Table 1.7.1. Strengths and Limitations
Strengths • Can help to explain increases or decrease in vector density and malaria case incidence
form year to year.
Limitations • Difficult to use at lower levels, such as the health facility catchment level, where
documented administrative boundaries are not available.