Embed Size (px)
Citation preview

Missing Venice:
Tracking the Global Movement of Venetian Art and the Evolution of Venetian Architecture and Infrastructure
AN INTERACTIVE QUALIFYING PROJECT REPORT
WORCESTER POLYTECHNIC INSTITUTE
Submitted to: Project Advisor: Fabio Carrera
Project Co-Advisor: Michael Aghajanian
Submitted by: Daniel Benson Andrea Boxell Grant Brining
Jonathan Leitschuh
https://sites.google.com/site/ve14miss/

i
ABSTRACT Changes in the government of Venice heavily influenced Venice’s art, architecture, and
infrastructure. After creating a specific research method, the team added to 25 years of WPI’s
research by documenting displaced artwork, demolished churches, and filled-in canals. A
platform, including an interactive website and timeline map web application, was created to
display not only our data, but data collected by future teams as well. Additionally, a smartphone
game to raise awareness about “Missing Venice” was designed.

ii
ACKNOWLEDGEMENTS We would like to extend our sincerest thanks to the following people, without whom this project
would not have been possible:
Dylan Kirby and Benny Lichtner - We would like to thank both Dylan and Benny for assisting us
in using the CK Console. Without their guidance we would not have been successful in accessing
past data or adding our research.
Tom Hohenstein - We would like to thank Tom Hohenstein for his research guidance. His
assistance was vital in determining the scope of our project and finding a starting point for our
research.
Worcester Art Museum Librarians - We would like to thank the librarians at the Worcester Art
Museum for teaching us about art history and the tracking of provenance. We are grateful for
their willingness to work with us during our preparation term.
Past Venice Project Center Teams - We would would like to extend our gratitude to the past
VPC teams for their thousands of hours of work over the past 25 years. Their research was
invaluable to our project.
Professor Robert Traver - We would like to extend our deepest thanks to Professor Traver for all
of his guidance during the preparation term. His writing and presentation guidance is greatly
appreciated. The critiques we received from him were essential to our development as writers,
researchers, and students.
Professor Michael Aghajanian - We would like to express our deepest gratitude to our advisor,
Professor Aghajanian, for the insightful direction he provided for our project and the multitude
of hours he worked to assist us. Professor Aghajanian helped us to develop our paper and
presentation. Without his guidance, we would not have attained the level of success that we did.
We greatly appreciate his support throughout our project.
Professor Fabio Carrera - We would especially like to thank Professor Carrera for the numerous
hours he put in to help our team. His organization of this project was vital to the execution of our
work. He provided essential knowledge and resources for our project. Without his efforts, none
of this would have been possible.

iii
AUTHORSHIP All members of the team contributed equally to the writing of this report.

iv
TABLE OF CONTENTS ABSTRACT ..................................................................................................................................... i
ACKNOWLEDGEMENTS ............................................................................................................ ii
AUTHORSHIP .............................................................................................................................. iii
TABLE OF FIGURES ................................................................................................................... vi
EXECUTIVE SUMMARY ............................................................................................................ 1
1. INTRODUCTION ...................................................................................................................... 3
2. ART............................................................................................................................................. 5
2.1 Tracking the Movement of Venetian Art .............................................................................. 6
2.1.1 Locating Displaced Artwork by Artist ........................................................................... 7
2.1.2 Locating Displaced Artwork Utilizing Museums .......................................................... 8
2.2 Gathering Other Necessary Art Data .................................................................................. 10
2.3 Results ................................................................................................................................. 11
3. CHURCHES AND CONVENTS ............................................................................................. 12
3.1 Verifying and Expanding Church Data............................................................................... 13
3.2 Photographing Demolished Church Locations ................................................................... 13
3.3 Results ................................................................................................................................. 14
4. RII TERÀ .................................................................................................................................. 16
4.1 Verifying and Photographing Rii Terà ............................................................................... 16
4.2 Results ................................................................................................................................. 16
5. CREATING INTERACTIVE DATA SOLUTIONS................................................................ 18
5.1 Managing and Collecting Data ........................................................................................... 18
5.1.1 Creating a Better CK Console Viewer ......................................................................... 18
5.1.2 Recording Data ............................................................................................................ 19
5.2 Deliverables ........................................................................................................................ 19
5.2.1 Developing a Website .................................................................................................. 20
5.2.2 Creating an Interactive Timeline Map ......................................................................... 23
5.2.3 Designing a Smartphone Game ................................................................................... 23
5.2.4 Updating the de’Barbari Explorer ................................................................................ 24
5.2.5 Creating Venipedia Templates ..................................................................................... 25
6. CONCLUSIONS....................................................................................................................... 26

v
7. FUTURE RECOMMENDATIONS ......................................................................................... 27
7.1 Continuation of Missing Item Research ............................................................................. 27
7.2 Creation of Advanced Data Interaction and Visualization Tools ....................................... 28
7.2.1 Development of Mobile Applications .......................................................................... 28
7.2.2 Creation of a Rendered 3D Missing Item Tour ........................................................... 29
7.2.3 Virtualizing the Canal Filling Process ......................................................................... 29
APPENDICES .............................................................................................................................. 30
A. Data Spreadsheets ................................................................................................................ 30
B. Website Mock-Ups ............................................................................................................... 34
C. Coding the Website .............................................................................................................. 37
D. Coding the Interactive Map .................................................................................................. 37
BIBLIOGRAPHY ......................................................................................................................... 39

vi
TABLE OF FIGURES
Figure 1: Project Data Flow Diagram ............................................................................................. 2
Figure 2: Changing Governments of Venice .................................................................................. 3
Figure 3: Decorative Venetian Wellhead ........................................................................................ 5
Figure 4: The Bronze Horses of Saint Mark's ................................................................................. 6
Figure 5: Worcester Art Museum ................................................................................................... 7
Figure 6: Museo Correr ................................................................................................................... 8
Figure 7: Art Research Process ....................................................................................................... 8
Figure 8: Museum Research Process .............................................................................................. 9
Figure 9: Web Gallery of Art ........................................................................................................ 10
Figure 10: Number of Art Pieces Relocated Over Time ............................................................... 11
Figure 11: Identifying Displaced Venetian Artwork .................................................................... 11
Figure 12: Demolished Church of Santa Lucia............................................................................. 12
Figure 13: Demolished Church Research Process ........................................................................ 13
Figure 14: Map of Locations to Photograph ................................................................................. 13
Figure 15: Replicating the Photo of a Demolished Church .......................................................... 14
Figure 16: Number of Churches Demolished Over Time ............................................................. 15
Figure 17: Rio Terà de le Colonne ................................................................................................ 16
Figure 18: Two Types of Rii Terà Photos .................................................................................... 17
Figure 19: Number of Rii Tera Over Time ................................................................................... 17
Figure 20: CK Console Viewer..................................................................................................... 18
Figure 21: Polish Lost Museum Website ...................................................................................... 20
Figure 22: Example Website Information Page ............................................................................ 21
Figure 23: Collage Style Template ............................................................................................... 21
Figure 24: Project Data Flow Diagram ......................................................................................... 22
Figure 25: Website Displayed on Smartphone ............................................................................. 22
Figure 26: Smartphone Game Home Screen ................................................................................ 23
Figure 27: The de'Barbari Explorer .............................................................................................. 25
Figure 28: Visualization Application Mock-up ............................................................................ 28

1
EXECUTIVE SUMMARY
The landscape of Venetian art, architecture, and infrastructure has undergone significant
changes throughout the last 500 years. Art pieces were globally dispersed as they were stolen,
lost, or moved for protection. Various governments of Venice demolished and repurposed
churches to suit their different needs. Additionally, canals were filled to create more pedestrian
walkways. The focus of this project was to document these changes. Information on “missing”
(lost, stolen or relocated) art, demolished churches, and Rii Terà (filled-in canals) was collected
and published in several different interactive ways.
There is little documentation of any research projects similar to this so it was necessary
to develop and put into practice a customized research method. In order to collect data on
missing art, a list of artists whose work was potentially on display in Venice was developed.
Using this list, paintings were found by examining the artists’ catalogue raisonnés, local
museums, and online art databases. When a potential missing piece was found it was researched
further to establish its current location and verify that it was once displayed in Venice. Beginning
with a list of artists, we looked at approximately 2500 paintings to discover 101 pieces of
missing Venetian artwork.
Our team also added to data collected by previous Venice Project Center (VPC) teams
regarding demolished churches and Rii Terà. These were photographed and added to our
website.
As depicted in Figure 1, our datasets were stored in the CK Console, an online database.
They were also utilized in our website, timeline map, smartphone game design, Venipedia pages,
and the de’Barbari Explorer. Our website, which has been optimized for both computers and
mobile phones, displays images of missing treasures in a collage format. This allows for intuitive
use and provides easily accessible information on missing items. The interactive timeline map
traces the journeys of missing historical artifacts to their current destinations around the world. A
timeline slider option allows the user to select a range of years to see which treasures left the city
during that period. A functioning mock-up for a smartphone game was created as a
recommendation for a future team to implement. All information we collected was published on
Venipedia and the de’Barbari Explorer. Venipedia is structured much like Wikipedia to provide

2
users with a wealth of information about the city of Venice. The de’Barbari Explorer is an online
interactive version of the famous map that allows users to view different aspects of the city.
Our research methods and data publication solutions provide a strong platform for future
teams to build upon. While we were unable to develop a comprehensive list of all missing
Venetian treasures, our research method proved to be effective. We recommend that future teams
utilize our procedure to expand the datasets and continue to provide this important information to
the public.
Figure 1: Project Data Flow Diagram

3
1. INTRODUCTION A city on the water, once at the center of the Renaissance movement, Venice is home to
some of the finest artwork ever created, over 100 breathtaking churches, and a labyrinth of
canals. Millions of tourists visit Venice
each year to experience its world renowned
art and architecture. While the Republic of
Venice may be a familiar name to many of
these visitors, a far fewer number of them
will be aware that Venice’s government
has changed hands several times in the
years following the Renaissance. From its
traditional founding in 421 until 1797, the
Republic of Venice was one of the most
powerful states in the Mediterranean. The
invasion of Napoleon in 1797 marked the beginning of foreign control. For the next 69 years, the
French and Austrians traded possession of Venice, until it became part of Italy in 1866.1
With so many governments coming in and out of power, the art, architecture, and
infrastructure of Venice underwent significant changes. The French and Austrians adapted
Venice to suit their needs and stripped away what did not. Art was stolen by the controlling
powers and brought back to their capitals to fill their museums and line the private collections of
wealthy citizens. Churches were destroyed to conform to the wave of secularization sweeping
across Europe and to make room for other buildings. Finally, canals were filled to make Venice
more like the traditional land-based cities the controlling powers were accustomed to. Austria in
particular sought to fill as many canals as possible to make a more traditional city. While these
changes permanently altered the landscape of Venice, they also added to the rich history of this
unique city.
Over the past 25 years of the Venice Project Center (VPC), previous Worcester
Polytechnic Institute (WPI) Interactive Qualifying Project (IQP) teams have documented some
of these changes in architecture and infrastructure. Although data had been collected, at the
1 “Venice History” (n.d.) Venice World
Figure 2: Changing Governments of Venice

4
beginning of our project, there was no way for the public to access this data in an easily
digestible format. The goal of our project was three-fold: to expand upon previously collected
data and create a platform to display it, establish a procedure for tracking displaced Venetian Art,
and use this new procedure to collect information on displaced artwork and incorporate our
findings into our new platform.

5
2. ART Venice solidified its reputation as a city of artists during the Italian Renaissance.
Giovanni Bellini, Veronese, Titian and Tintoretto are some of the famous artists who called
Venice home. The number of artists and their productivity ensured that great paintings and
sculptures adorned almost every public
building. Art was so popular that it often
extended beyond the canvas. Even utilitarian
objects such as wellheads, featured elaborate
decorations. Perhaps the greatest concentration
of art can be found in the more than 100
churches in Venice. Sculptures and paintings
cover the altar areas, floors, ceilings, and
walls.
While many of these pieces remain within the city, a significant number can no longer be
found in their original locations. For example, when Napoleon occupied Venice in 1797 his army
removed hundreds of works.2 Famous paintings and sculptures looted or sold from the city were
scattered all around the world. They ended up in both private collections and museums.
Similarly, famous Venetian works changed hands during the tumultuous years of World War II
and have been the subject of many thefts throughout history.3
Looting of priceless art is a well-known problem around the world. Many modern art
lootings and heists are well documented, but unfortunately in the past this was not the case. At
present, there is no public source that contains a consolidated list of Venetian artifacts that have
been lost, stolen, or transported away from the city. The majority of sources which document art
lootings do not include lists of individual pieces that may have been stolen, sold, or damaged.
Although it is well documented that Napoleon’s army took hundreds of works from the city,
specific pieces are rarely mentioned.
2 Blair, V. (2002, October 22). Venice: Napoleon's Italian Thorn. Research Subjects: Government & Politics, The
Napoleon Series 3 Charney, N. (2011, October 24). The Secret History of Art Noah Charney on Art Crimes and Art Historical
Mysteries. 5-Minute History of Napoleonic Art Looting
Figure 3: Decorative Venetian Wellhead

6
One of the most well known
pieces of art removed from Venice was
the Horses of Saint Mark’s Basilica.
Napoleon removed these bronze
sculptures and placed them atop his Arc
de Triomphe in Paris in 1797. These
horses are an excellent example of art
looting; not only were they removed from
Venice by Napoleon, the Venetians
themselves stole the horses from
Constantinople more than 500 years earlier in 1204. After Napoleon’s occupation, the horses
were returned to Venice in 1815 and placed back on the basilica. During the 1980’s these horses
underwent extensive restoration and now rest inside the basilica to protect them from the
elements. They are replaced on the balcony to be viewed by the public by exact replicas.
Fortunately, not all art displacement has happened due to war or greed. A significant
number of Venetian paintings were removed from their original locations for preservation. The
Gallerie dell’Accademia now houses many of the historical works that once adorned buildings
and churches around the city.
2.1 Tracking the Movement of Venetian Art
Provenance research is an essential part of any project that involves the movement of
valuable artifacts. “Provenance” is defined as, “The history of ownership of a valued object or
work of art or literature.”4 Provenance can be very difficult to establish and often remains
incomplete. Objects that have been looted often have much less documentation because they
were stolen or transferred into private collections. Records will usually resume when the painting
is sold back to a museum or public collection. Unfortunately, these provenance records are not
easily accessible to the public and remain tucked away in museum libraries.
One example of the difficulties encountered in tracing lost or stolen artwork can be seen
in the post World War II efforts to recover stolen Jewish artwork. As expected, the movement of
4 Provenance. (n.d.). Merriam-Webster Dictionary
Figure 4: The Bronze Horses of Saint Mark's

7
art stolen by the Nazis was not accurately recorded. The only way to track down pieces was
through first-hand accounts and memories. Nearly every European country, in addition to several
others around the world, was involved in this effort. Fortunately, over 700,000 pieces have been
made their way home, but many remain lost.5
Although the scope of displaced Venetian artwork is nowhere near that of stolen Jewish
art during World War II, the lack of a comprehensive list of missing artwork made our research
considerably more complicated. Before we could locate any artwork, it was necessary to
establish a research procedure. Our procedure consisted of two primary approaches: searching
for displaced artwork by its artist and searching through museum collections. This research
process proved to be effective; we believe that a similar method could be used in the future to
locate not only Venetian artwork, but other works as well.
2.1.1 Locating Displaced Artwork by Artist
Our first method to locate displaced art was by selecting a Venetian artist, or an artist that
had a significant body of work on display in Venice at some point in history. We then located
that artist’s catalogue
raisonné. A catalogue
raisonné is a comprehensive
listing of works over the
life of a particular artist.
These catalogues contain a
biography, pictures of
works, and, if available, a
short provenance of each
work. These publications are very expensive and are often only found in museum libraries. We
were able to find several catalogues in the Worcester Art Museum’s library. The catalogue
raisonnés we utilized were almost exclusively written in Italian. In order to efficiently obtain
information, we looked through the text for key words. Some examples of key words are,
“venezia” (Venice), “veneziano” (Venetian), and “chiesa” (church). Once we identified a piece
that was likely on display in Venice, we scanned its description and converted it to English using
5 Holocaust Restitution: Recovering Stolen Art. (2014, September 1). Recovering Stolen Art from the Holocaust
Figure 5: Worcester Art Museum

8
Google Translate. After we had a list of potential missing works, we researched each piece
individually to determine its current location. If the piece of art was no longer in its original
location, it was classified as missing and added to our dataset.
2.1.2 Locating Displaced Artwork Utilizing Museums
A large amount of displaced Venetian art
is housed in museums; therefore, searching
through museum collections was necessary. The
Gallerie dell’Accademia and Museo Correr in
Venice contributed a significant amount of
information for this project. In addition to
physical museums, online collections of artwork
were also heavily utilized.
2.1.2.1 Physical Museums
Fortunately, museums often research the
provenance for the works they acquire. This provenance will either be listed next to the painting
on display or in their library archives. The Gallerie dell’Accademia was an excellent resource
because the majority of its works were once on display elsewhere in Venice. The Gallerie was
established in 1750 and houses a comprehensive collection of pre-19th century artwork. Most of
its collection was taken directly from Venetian churches and other buildings for preservation and
protection.6
6 The Museum. (n.d.). Gallerie dell’Accademia
Figure 6: Museo Correr
Figure 7: Art Research Process

9
As we walked through the exhibits, we took note of specific paintings in each room that
could be of interest. We purchased a museum catalog for the Gallerie in order to continue our
research. A museum catalog contains a brief summary of the pieces in a museum’s collection. It
typically includes the artist, date of creation, and provenance. Unfortunately, this provenance
was often incomplete. The catalog primarily described only how the Accademia acquired the
pieces without a more detailed explanation of its movements. We used the information gathered
from this catalog to add to our list of missing works.
In addition to the Gallerie, we visited the Museo Correr. This museum is located in Saint
Mark’s Square and houses a collection that covers both the art and history of Venice. The
museum originated from Teodoro Correr’s collection that was bequeathed to the city.7 We used a
similar process as the one outlined above for the Accademia to find missing art in the Correr
Museum. We also made visits to various other museums, such as The National Gallery in
London, The Louvre in
Paris, and the Gallerie
dell’Accademia in Florence
during our travels
throughout the term. Our
findings at these museums
followed the same outlined
process.
2.1.2.2 Virtual Museums
Researching missing works using virtual museums and collections on the internet
followed a similar procedure to that of visiting a physical museum. First, we selected an online
resource that contained a large collection of paintings from Renaissance artists. We then went
through each individual piece in the collection until one displaced from Venice was found. We
utilized whatever provenance research the museum had completed to trace the previous locations
of the artwork we gathered.
The Web Gallery of Art (WGA), a virtual museum with an online catalogue of over
36,000 pieces of art, was utilized to add missing works to our list and to fill in missing
7 Building and History. (n.d.). Museo Correr.
Figure 8: Museum Research Process

10
information in item descriptions.8 The
Frick Collection website, an online
catalog of the collection of Henry Clay
Frick, was utilized in a similar way as
the WGA.9
The Churches of Venice website
also proved to be invaluable in locating
additional pieces of missing artwork.
This website, focusing on the history of
Venetian Churches, was created by an
independent researcher. It documents major changes to the churches and highlights “lost art” that
was once in these religious buildings.10 We cross-referenced this list of “lost art” with the list of
displaced artwork we compiled from our other sources. Any paintings that we did not already
have were added to our dataset.
2.2 Gathering Other Necessary Art Data
The creation of an effective visualization tool required more than just previous locations
of art to be collected. GPS coordinates of each piece of artwork’s locations, both past and
present, were gathered for use in our interactive map and websites. These coordinates were
obtained using Google Maps. In addition, photographs of each location were taken following the
procedure outlined in Section 3.2. It was also necessary to collect images of each piece of
artwork. We found that the ideal place to find these images was Wikimedia Commons. Most of
the images in this collection have no copyright restrictions and are protected under fair use
policies.
8 Web Gallery of Art (n.d.).
9 History. (n.d.). Frick Collection
10 Cotton, J. (n.d.). The Churches of Venice. The Churches of Venice.
Figure 9: Web Gallery of Art

11
2.3 Results
At the beginning of
our research, the original
goal was to create a list of
approximately 70 pieces of
artwork. After hundreds of
hours of research and field
investigation, we gathered
101 pieces. This result was
not easily attained. For each
piece that we found to have
been originally located in
Venice, we researched about 25 paintings, bringing the total number of paintings we evaluated as
possible candidates to approximately 2500. Although time consuming, we believe that this
achievement speaks to the effectiveness of the method that we have developed for tracking
displaced Venetian artwork. We also have created a timeline graphic, which can be seen in
Figure 11. This graphic compares the amount of art displaced, with the year they it was removed
and who removed it.
Figure 11: Identifying Displaced Venetian Artwork
Figure 10: Number of Art Pieces Relocated Over Time

12
3. CHURCHES AND CONVENTS Churches have always been a significant part of
Venetian history and culture. The traditional founding
of Venice was associated with the dedication of
Venice’s first church, San Giacomo.11 Since then, over
140 churches have been constructed on the island.
While the vast majority of Venetian churches are
Catholic, there are a handful of other denominations,
including Anglican and Orthodox Christian. Because
of the large religious community in Venice, convents
were also very numerous. Convents were often
attached to churches. During the early 1800’s, when
Venice was under the control of Napoleon, many
churches and convents were suppressed in an attempt
at secularization. As time went on, and Venice changed
hands from the French to the Austrians, some of these buildings were either destroyed or
repurposed for other uses. The buildings of these “repurposed” structures are still present;
however, they have been transformed to serve different functions. New functions for repurposed
churches and convents in Venice include schools, prisons, public housing, museums, and concert
halls.
Churches were not only affected by new governments, but by new forms of art and
architecture as well. It was not uncommon for a church to be “remodeled” in order to conform
with the contemporary artistic period. Church facades were often “remodeled” from gothic to
renaissance architecture. Although these buildings have been modified, they still serve as
churches.
Many churches in Venice are very ornate and are decorated by paintings and sculptures
created by world renowned Gothic and Renaissance artists. Because of this, churches in Venice
are an attraction to not only the religious, but to art lovers as well. Tens of thousands of tourists
visit Venice’s most famous church, the Basilica of Saint Mark, every year.
11
Cotton, J. (n.d.). The Churches of Venice. The Churches of Venice.
Figure 12: Demolished Church of Santa Lucia

13
3.1 Verifying and Expanding Church Data
Due to the scope of the changes in
Venetian architecture, we chose to focus
our efforts on demolished and repurposed
structures. We did not research remodeled
churches due to time constraints. Previous
IQP teams had compiled a list of
demolished churches which we updated
and expanded.12 To uncover additional demolished churches, we utilized a book titled Venezia
Scomparsa which translates to “Disappeared Venice.” This book contains information regarding
several demolished churches along with other building types that have been destroyed. One
challenge presented by this book is that it is written in Italian. To overcome this challenge, we
translated each demolished church page by scanning it into Google Translate. From these
translations, we were able to extract the necessary information for each church.
3.2 Photographing Demolished Church Locations
In order to help visualize where demolished churches were located, modern photographs
of former church locations were
taken. Due to the large number of
photographs taken, weather
constraints, and the distance between
locations, it was necessary to
develop an efficient system of
collecting these images. Using
Google Maps, we plotted the GPS
coordinates of each location we had
to photograph. These points were
divided up into 6 easily manageable
12
Weis, Amanda Michelle et al (2013) Venice through the canals of time -- mapping the physical evolution of the
city
Figure 13: Demolished Church Research Process
Figure 14: Map of Locations to Photograph

14
sections. Each section required one day to complete.
To collect photographs, we downloaded copies of our map to a smartphone in order to
navigate to the locations. At each location several pictures were taken. If we had iconography of
the original church available, we replicated the original image to the best of our abilities. Each
time a photograph was taken, it was recorded on paper to ensure we accurately matched the
image with the location. Upon uploading the images to the computer, the best photograph for
each location was chosen.
3.3 Results
During the course of our research, we added information on two additional demolished
churches not previously present in the WPI dataset. While the addition of two new churches is
important, we feel that our
greatest contribution to the
churches dataset was 27 modern
photographs of demolished
church locations. These
photographs help those who view
our data to better understand
what replaced these structures.
We also have created a timeline
graphic, which can be seen in
Figure 16. This graphic compares
the number of churches and the
year in which they were demolished with the government in power at the time of their
demolition.
Figure 15: Replicating the Photo of a Demolished Church

15
Figure 16: Number of Churches Demolished Over Time

16
4. RII TERÀ Some of the modern alleyways in Venice actually
cover former canals, which were transformed into streets as
early as the 14th century. In Venice, filled-in canals are
called Rii Terà, meaning “earthed canals”. Two different
types of Rii Terà exist: Rii Terà “tombati”, which are actually
“entombed” (i.e. completely filled with dirt), and Rii Terà “a
volto”, where the canal was enclosed in a conduit and capped
by a street. Entombing a canal greatly disrupts the flow of
surrounding canals, but eliminates any need for periodic
dredging. When a canal is capped, water still flows
underneath it, so the overall hydrodynamics of the area are
not affected; however, the hidden conduit under the street
requires periodic cleaning to remove accumulated sediment.
All governments who have controlled Venice have been responsible for filling some of its
canals, about half of which were filled by the Austrians. 13
4.1 Verifying and Photographing Rii Terà
In order to effectively incorporate Rii Terà into our deliverables, data collected by
previous teams was verified and images of each Rio Terà were added to the VPC database. In
order to do this, we went to each Rio Tera’ and photographed it. The procedure we used to gather
photographs is the same one used to gather images of art and demolished church locations.
Images of both the street sign and the street itself were taken when possible. Several misspellings
and GPS locations in previously collected data were corrected.
4.2 Results
Over the course of several weeks, we took 86 photographs of Rii Terà around Venice. These
photographs were added to the data collected by previous WPI teams. An example of the types
of photographs that were taken can be found in Figure 18. We also have created a timeline
13
Rii Tera' (n.d.). Venipedia.
Figure 17: Rio Terà de le Colonne

17
graphic, which can be seen in (FIGURE X). This graphic compares the number of canals and the
year they were filled with the government who filled them.
Figure 19: Number of Rii Tera Over Time
Figure 18: Two Types of Rii Terà Photos

18
5. CREATING INTERACTIVE DATA SOLUTIONS To display our data we created a website, an interactive timeline map, and a smartphone
game design. We also updated the de’Barbari Explorer and created Venipedia pages. To
accomplish this, proper data management was necessary.
5.1 Managing and Collecting Data
In order to create effective ways to display our data, it was necessary to retrieve and
modify existing data, as well as create entirely new datasets. All of these datasets are currently
stored on the City Knowledge (CK) Console. The CK Console is an online database used to store
information that has been collected by teams at the Venice Project Center over the past 25 years.
Each year, teams add to the Console as well as utilize data previously stored there. We utilized
the following datasets from the Console: demolished churches, repurposed churches, repurposed
convents14, and Rii Terà.
5.1.1 Creating a Better CK Console Viewer In order to more efficiently view data collected in the CK Console by previous teams, we
created a web application, the CK Console Viewer, to organize and display data in an easily
digestible fashion. The CK
Console interface, although
very helpful in storing data, can
often be hard to navigate. In
order to view a dataset in the
CK Console, permission from
the administrative account must
be granted. After a dataset
becomes accessible, it is very
difficult to navigate due to the
structure of the Console. It is
14
Convents were researched in Ecclesiastical architecture -- preserving convents, churches, bells and bell towers.
Figure 20: CK Console Viewer

19
also challenging to quickly browse through the expansive amount of data that can be found there;
datasets are broken up by the groups that created them which makes switching between datasets
from different projects frustratingly slow.
The CK Console Viewer allows the user much easier access to the content in any and all
of the datasets. It allows users to view all data in the Console, regardless of administrative
permission; however, data cannot be edited in the Viewer. In addition, there are many advanced
sorting options available.
The CK Console Viewer greatly assisted in our research and finding data that is relevant
to our project. It also greatly increased our efficiency in updating and validating old information.
The CK Console Viewer has been made available to future project teams to enhance the
accessibility of the vast amounts of data stored in the CK Console.
5.1.2 Recording Data
All of the data we collected was uploaded to the CK Console. This preserves our data for
future teams and allows our website and interactive map to dynamically load our data. In order to
upload the data to the console, we first placed our data into a series of Microsoft Excel
spreadsheets. These spreadsheets contained all of the information associated with each missing
treasure. Since all items do not share the same characteristics, we created a different spreadsheet
for each type of missing item. For example, a piece of missing art has a date moved while a
demolished church has a date destroyed. Once the spreadsheets were completed, they were
exported as comma separated value (CSV) files and uploaded to the CK Console. Images cannot
be uploaded as comma separated values, thus it was necessary for us to upload them separately.
Each spreadsheet contains a column with the name of its associated picture file. After uploading
the images and the data to the console, they were merged together using the filename of the
image. An example of a data spreadsheet can be found in Appendix A.
5.2 Deliverables
To effectively display our research, we developed a series of electronic aids, including a
website, an interactive timeline map and a design for a mobile application.

20
5.2.1 Developing a Website
Since the beginning of this project, we felt that publishing out data on an easily navigable
webpage would allow for the greatest access to our research findings. The first step in this
process was to determine what we wanted to display on this website. Based on the data we had
available and the scope of our research, we decided to include displaced artwork, demolished
churches, repurposed churches, repurposed convents, and Rii Terà. Next, we compiled a list of
the features we wanted our site to have and what we thought users would want to see.
In addition to a list of
potential features, we also
needed a website design. We
began searching for websites
similar in concept to ours and
found inspiration in Poland’s
“Lost Museum” website. The
Lost Museum website,
created by the Polish
Ministry of Culture and
National Heritage, contains images of art stolen from Poland during WWII that have yet to be
recovered.15 We decided to use a similar collage layout in our website because it is visually
appealing and it allows users to easily browse a catalog of images.
We began to create our website by drawing out several collage-style designs on a
whiteboard. When we were satisfied with these sketches, we moved to pen and paper. Next, we
photoshopped different designs and used mock-up tools to show the different ways the site could
look. The mock-ups we created allowed us to discuss the designs with our advisors and make
multiple revisions before putting anything into code. Several of our mock-ups can be found in
Appendix B. In each mock-up we tried to address as many of the different use cases as possible
in order to appeal to the greatest amount of users.
15
Obiekty utracone w wyniku wojny. (n.d.). Ministerstwo Kultury i Dziedzictwa Narodowego
Figure 21: Polish Lost Museum Website

21
After we had a list of features and decided upon
our favorite pieces of the mock-ups, we began to develop
our site. For the backbone of our website, we chose a
template which displays images in collage style. Although
this template may seem visually similar to our final site
design, the resemblance is merely passing. In addition to
cosmetic changes, large parts of the templates were
recoded and many additional features were added to
optimize the way we display our data. An advanced
search function was added to allow users to search the
large catalog of items. In order to display more detailed information for each item in the collage,
an information page was created. This page, accessed by clicking on an image, shows all of the
relevant information we have available for each item. It will usually include a description of the
item, a data table, and a carousel of pictures. An example of the information page for a
demolished church can be seen in (FIGURE X). This page will help users who are looking for
detailed information on an individual page.
Figure 23: Collage Style Template
Figure 22: Example Website Information Page

22
Unlike the original
template, all images in this
collage are loaded
dynamically from the CK
Console. This allowed us to
use both our own data and
data collected by previous
WPI teams. The dynamic
loading also allows for any
changes made to data in the
CK Console to be instantly
reflected on the website. This feature makes maintaining and expanding the website much easier.
When a new piece is found, it can be added to our website by simply adding the new piece to the
existing dataset in the console. This dynamic data flow can
be seen in Figure 23.
We also wanted to make our website accessible to
smartphone users. In order to do this we needed to make the
website viewable on all sizes of screens. The website was
coded to automatically resize to any screen. An example of
the website being displayed on a smartphone can be seen in
Figure 24. In addition to optimizing its display for
smartphones, the website also has an option to load the
items closest in proximity to the user first. This is
accomplished using GPS data associated with each
individual item and comparing it to the GPS data provided
by the user’s smartphone. For more in-depth technical
details about our website, see Appendix C.
Our website also includes a built-in interactive
timeline map which is described below.
Figure 24: Project Data Flow Diagram
Figure 25: Website Displayed on Smartphone
23
5.2.2 Creating an Interactive Timeline Map
Although our website offers a wealth of information to users about art and its movement
from Venice, it can be difficult to visualize just how much the landscape of Venetian art has
changed in the last 500 years. In order to allow user to better visualize this movement, we
decided upon the creation of an interactive timeline map. This map shows the travels of different
art pieces as they leave Venice and are transported to their new locations around the world.
Each point on the map is a place where Venetian art has been at some point in history.
When a single location is selected, the paths of the associated pieces are highlighted. A list of the
pieces also appears in the sidebar, which links to their respective information pages on our
website. When a path is selected, only the locations associated with that piece are displayed.
Finally, we added a slider function to allow the user to select the range of dates during
which pieces could have moved to be displayed on the map. This makes the map more practical
for research purposes. It is a useful tool for researches to help establish trends in the movement
of Venetian art over certain periods of time. For more in-depth technical details about our map,
see Appendix D.
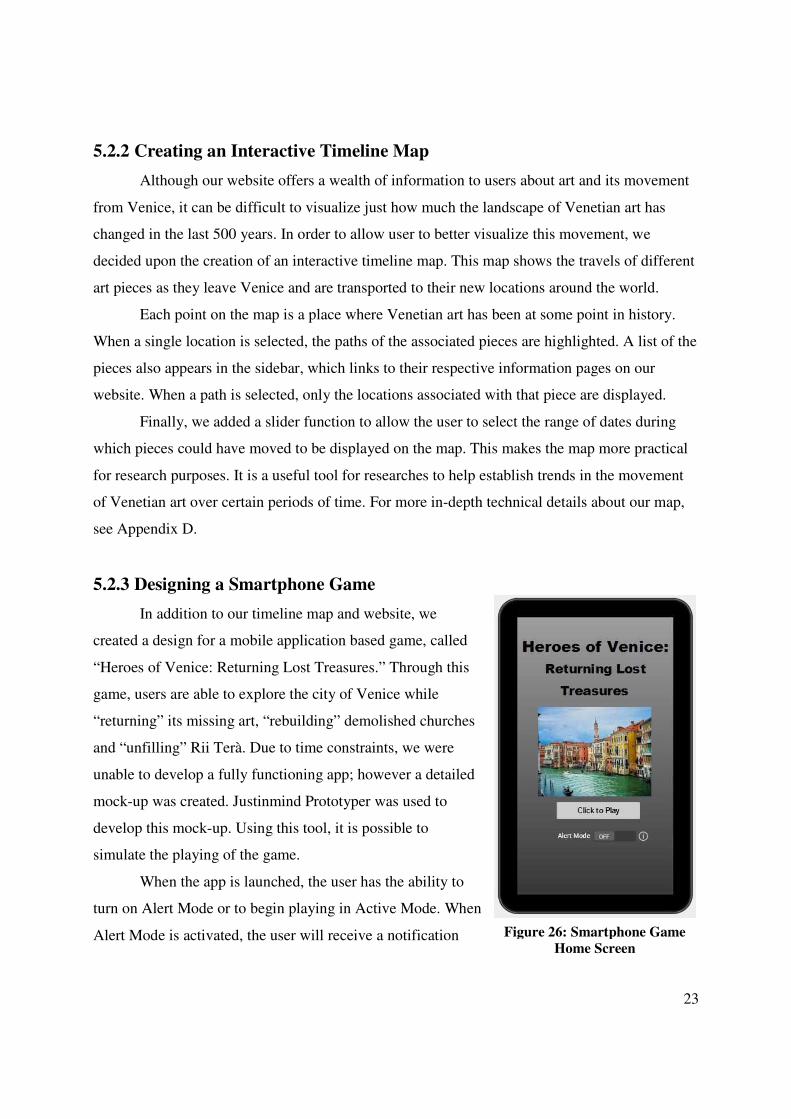
5.2.3 Designing a Smartphone Game
In addition to our timeline map and website, we
created a design for a mobile application based game, called
“Heroes of Venice: Returning Lost Treasures.” Through this
game, users are able to explore the city of Venice while
“returning” its missing art, “rebuilding” demolished churches
and “unfilling” Rii Terà. Due to time constraints, we were
unable to develop a fully functioning app; however a detailed
mock-up was created. Justinmind Prototyper was used to
develop this mock-up. Using this tool, it is possible to
simulate the playing of the game.
When the app is launched, the user has the ability to
turn on Alert Mode or to begin playing in Active Mode. When
Alert Mode is activated, the user will receive a notification Figure 26: Smartphone Game Home Screen
24
when he or she walks near a location where art used to be, the site of a demolished church, or a
Rio Terà. Further information regarding this missing treasure will appear.
Active Mode can be played using several different settings. The user has the ability to
choose a playing style, game length, playing level, and navigation style. Users will have the
ability to choose a specific treasure or to receive a random treasure to return. Game lengths range
from one hour to a full day. The length of game will determine how many treasures will be
returned and the area of the city that will be covered. Playing levels range from easy to hard.
Each level includes all categories of missing treasures. Some treasures are easier to locate than
others because they are marked or have not been fully demolished. The user has two choices for
navigation style: navigating utilizing a map or receiving turn-by-turn GPS based directions.
When a missing treasure is “returned,” the user will be provided with an image of the
treasure and some basic information. In addition, he or she can earn points for returning each
missing treasure. These points can be accumulated to earn badges that can be shared on social
media sites such as Facebook and recorded on the High Scores board at the end of the game.
People of any age can use this app to learn more about this history of Venice while exploring the
city.
5.2.4 Updating the de’Barbari Explorer
In 1500, Jacopo de’Barbari created an ultra-accurate map of Venice that was about four
square meters in size. It was created using six large blocks of wood carved with the impressions
in reverse so they could be pressed into paper. At the time, this was one of, if not the largest
prints in existence and remains one of the most impressive pieces of the Renaissance period.16 A
past WPI IQP team took the de’Barbari Map and created the de’Barbari Explorer.17 The
Explorer, created from high quality scans of a reproduction of the original map, is an online tool
which allows users to explore what Venice looked like during 1500. It allows viewers to zoom in
and out of the map to reveal ultra-fine details. Layers have also been created that allow users to
highlight specific types of locations, such as demolished churches.
16 The British Museum 17
Weis, Amanda Michelle et al (2013) Venice through the canals of time -- mapping the physical evolution of the
city

25
While we were verifying previously collected data, we came across several demolished
churches and Rii Terà that had not been highlighted on the de’Barbari Explorer. We updated the
de’Barbari by comparing the locations highlighted on the Explorer to the locations on the map
we created for gathering photographs. Any discrepancies were corrected; a total of three Rii Terà
and five demolished churches were added to the de’Barbari Explorer.
5.2.5 Creating Venipedia Templates
Templates for Venipedia pages are automatically generated by the CK Console. After
uploading all of our data to the CK console, the template for missing art was edited to display the
appropriate data fields and images. From this template a Venipedia page for each art piece was
automatically generated.
Figure 27: The de'Barbari Explorer

26
6. CONCLUSIONS The fundamental purpose of the WPI Interactive Qualifying Project is to perform
“applied research that connects science or technology with social issues and human needs.”18 We
believe that we accomplished this goal. The platform that we created has made previously
unavailable information accessible to the public. Not only is this information publicly accessible,
it is displayed in a format that is easy to understand through the use of our visualizations.
When we started this project, we were told a multitude of times that our project would
not be possible in our given timeframe. Undeterred, we were able to establish a process to track
down “missing treasures,” in particular displaced Venetian artwork. We believe that through our
research, we have proved this methodology to be repeatable and successful. This research
platform could be used for both the continuation of our research in Venice, as well as other cities
around the world.
Similar to our research process, our technological platform can also be expanded upon.
We believe that our platform is an ideal solution for tracking missing treasures due to its
modularity and ease of use. For example, one of these modules, the interactive timeline map
could be used as a tool for both a casual enthusiast and a professional researcher. This map can
be used to establish trends in the global movement of art throughout history and answer
questions regarding these trends.
Due to their interactive nature, our visualizations make learning about history more
interesting. We hope that our work will inspire people of all ages to take an interest in Venetian
treasures.
18
"Interactive Qualifying Project" Worcester Polytechnic Institute
27
7. FUTURE RECOMMENDATIONS Unfortunately, due to time constraints and available software, we were not able to fully
bring to fruition all of our ideas. Some of these ideas, along with other recommendations for
future teams are included here. Very little information is available regarding the Venetian
treasures that no longer exist, have been moved from their original location, or repurposed from
their original use. The scarcity of this information makes it difficult for art lovers and tourists to
get a full appreciation for Venice’s colorful past. It also makes it difficult for researchers to find
the information they need in an easily digestible format.
In the timeframe available to conduct this project, we demonstrated the value of this
information, developed a process to efficiently and effectively continue to conduct the research
necessary to uncover these treasures, and created innovative tools to display and analyze this
information in a meaningful and interesting way.
While we made significant progress on this important task, much work remains before
missing Venice is fully documented in a single, easily accessible database. Below is a list of
projects we recommend to continue this important work.
7.1 Continuation of Missing Item Research
Although we made considerable progress, there are still many pieces of missing art
unaccounted for. When we began this project, there was very little published data available in a
single location about missing Venetian artwork. We believe that the one of the greatest
contributions we have made has been our creation of a consolidated list of artwork removed from
its original location. When published in the public domain, this list will make life easier for
researches, art lovers, and tourists alike to gain a better understanding of Venice’s colorful past.
We strongly encourage future teams to continue to expand upon this data.
Another candidate for additional research should be remodeled churches. The VPC
currently does not have any data on remodeled churches. Due to the ubiquity of churches in
Venice, and their historical ties to the city, we believe research upon the remodeled churches
would be met with enthusiasm by the Venetian community, researchers, and tourists.
Due to the nature of our platform, missing item research is not only limited to Venice,
any other city could be examined as well. We also recommend that future teams apply our
process to examine the displacement of art in other countries.

28
7.2 Creation of Advanced Data Interaction and Visualization Tools
Although the creation of our website and interactive timeline map make great advances
toward helping people to visualize the history of Venetian artifacts, architecture, and
infrastructure, more advanced solutions can be created. The solutions below, which we believe to
be ideal, require a very high level of programing ability and would make excellent goals for the
future.
7.2.1 Development of Mobile Applications
Each year, smartphones are making greater strides towards ubiquity, not only in the
United States but around the world. We believe that the creation of applications made
specifically for the mobile platform would greatly enhance the usability of our data.
7.2.1.1 Development of “Heroes of Venice”
Millions of mobile games have been created since the inception of the smartphone. We
created the “Heroes of Venice” mock-up because we wanted to add a fun and informative game
to this total. Although we were limited by time, a significant amount of the research necessary to
create “Heroes of Venice” has been gathered. We recommend
a future team develop this application to completion. Not only
will it provide tourists with an entertaining way to see Venice,
it will undoubtedly help to instill an appreciation for Venetian
history and provide insight on the changes Venice has
experienced, which would have otherwise gone unnoticed.
7.3.1.2 Development of a “Visulization” Application
Perhaps the most used part of a smartphone is the
camera; we recommend the creation of a mobile application
which will utilize the camera and GPS capabilities of
smartphones. This application will allow the user to “see”
items, such as churches and wellheads, in their original
locations. Using the camera, the phone will overlay an image
of the “missing” item over what the user is viewing through
their camera, allowing the user to see what it would have
originally looked like. A mock-up of this concept can be seen Figure 28: Visualization
Application Mock-up

29
in Figure 27. The application would have other functionality as well, such as walking directions
around the city and alerts when the user approaches previous locations of relocated items.
7.2.2 Creation of a Rendered 3D Missing Item Tour
We believe that 2D images, maps, and sketches can only go so far in illustrating where
churches, convents, and canals used to be located. We strongly believe that the creation of a
rendered 3D environment would allow residents, tourists, and researchers to gain a full
appreciation of “Missing Venice.” We recommend the creation of a 3D environment, similar to
Google Street View. This set of 3D maps would include all demolished churches and convents in
their former glory and all Rii Terà would be seen as canals. Users would be able to navigate this
map in two ways, as if they were on street level, or as if they were viewing the city from an
elevated position. When the user selects the street level option, they could enter demolished
buildings, see where art used to hang, and travel in a gondola down a Rio Terà. When the user is
viewing the city from an elevated position, they would be able to pan around the outside of
buildings and see the detailed architecture that is so prominent throughout Venice. Ideally, this
application could be run both on a mobile device and traditional computer. We recognize that
this would be a challenge; a significant amount of research would still need to be completed and
advanced programing skills would be necessary. Despite these challenges, we believe that it
would be a worthwhile endeavor and a great achievement for the VPC.
7.2.3 Virtualizing the Canal Filling Process
While we were walking around the city verifying data and gathering the pictures, one
thing that we found to be interesting was the work that would have been necessary to fill in a
canal. We believe that it would be very informative if an animation of the canal-filling process
were to be created. This animation would show the difference between filling and capping a
canal, as well as the hydrodynamic effects created by modifying the Venetian canals. They
would also shed light on the engineering challenges faced in both the construction and
modernization of Venice. We believe these animations would be valuable education tools. In
combination with our research and other recommendations above, they would add to the
usefulness of the data we have collected.

30
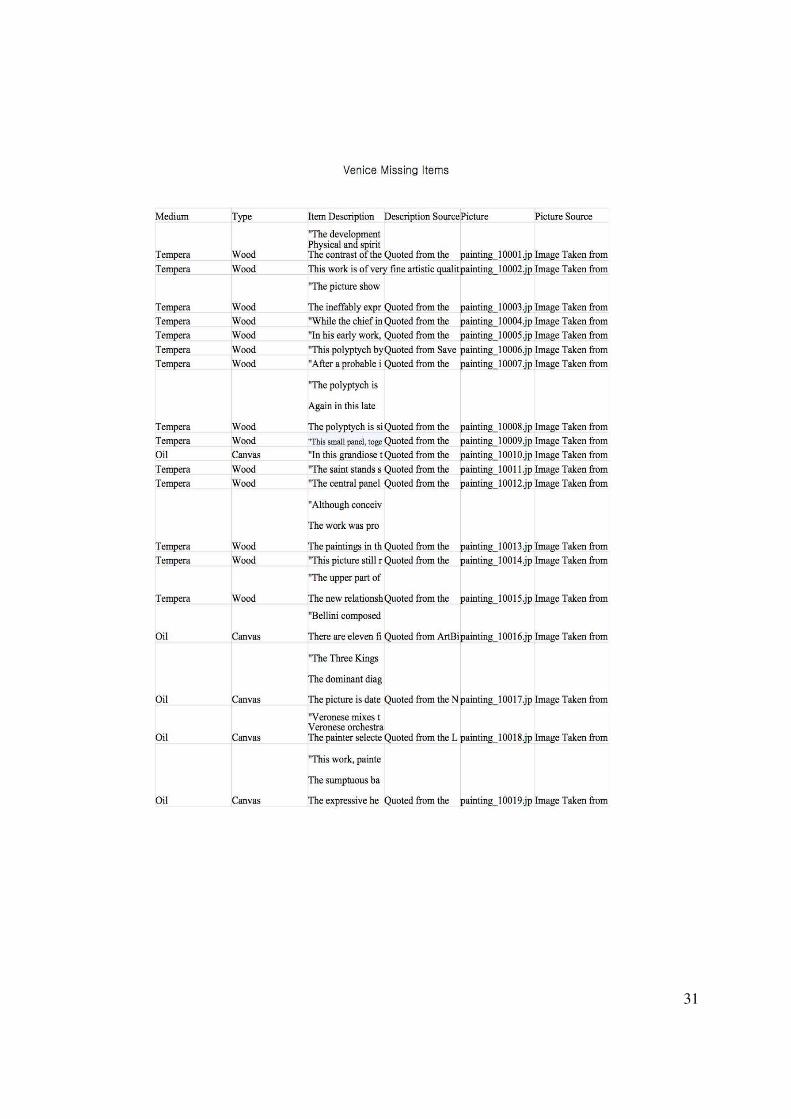
APPENDICES
A. Data Spreadsheets
The following is example of the spreadsheets we used to collect our data and upload it to the CK Console. Due to its size, only portions of the sheet were included.
31

32

33

34
B. Website Mock-Ups
The following two sketches were our concept of the first and second page, respectively, of our website design.

35
The following image is from the second phase of our mock-ups. It depicts what we expected would be on an information page of our website.
The image below shows how we originally envisioned our website would appear on a mobile
device. This approach was abandoned after we were able to dynamically change the size of our
collage to fit various screen sizes.

36
The website in its beginning stages can be seen below. Note the template in the background and the lack of a navigation bar.
The website in an intermediate stage of construction can be seen below. Note the lack of a search bar.

37
C. Coding the Website
After multiple revisions to our mock-ups we began to code the website. The website is
written using multiple javascript libraries and loaded and displayed dynamically using Angular.
We used javascript to create a single standardized dataset class from each of our different types
of missing treasure datasets. This class retrieves and parses the fields that are relevant for display
on our website and creates an object of this class for each treasure. These objects are then
displayed in the collage picture format on the main page of our website. When one picture is
selected, a second page retrieves the object’s data fields and displays it in a table format, with the
pictures in a carousel, and other relevant information in paragraph format.
In order to make our website available to all users we had took into consideration how it
would look when displayed on a smartphone. We made sure that the user would be able to easily
navigate using the buttons in the header of our website, as well as the search bar and the collage
itself. The website dynamically resizes to fit the size of the window, which makes is useable
from any smartphone. When the screen resizes, all of the images in the collage change sizes
proportionally and the buttons create rows so they do not overlap.
Finally, after the completion of our website we ran a series of tests to analysis the
usability of our interface. We tested the site both amongst ourselves and with people from
outside of the group. We tested to make sure that each of the users could find different parts of
the website and could find specific pieces. We also asked them for opinions which we used to
improve the layout of our website. This greatly helped to increase the usefulness of our website.
D. Coding the Interactive Map
Over the course of the past term we experimented with many different javascript libraries
and other visualization tools in the development of our timeline map. We started by designing
the map in the Google Maps Application Programming Interface (API) as a proof of concept. We
knew that we would not be able to use this API to accomplish the entirety of our desired
functionality so we began to look into alternatives. We researched and contacted a team creating
a new map data visualization program, Datacollider. Unfortunately, this program was
temporarily in a closed, private beta period.

38
Next we created a 3-Dimensional map using the D3js javascript libraries. We used this to
create a functional globe that the user could zoom in on and manipulate by clicking and
dragging. Although this form of the map was aesthetically pleasing, it experienced shortcomings
in its ability to give the user the ability to interact with our data.
Finally, we moved on to the Mapbox.js and Leaflet javascript libraries. The mapbox tools
and plugins gave us all of the functionality that we needed for a successful map visualization. It
allows the user to click on any point or line drawn on the map which could be created
dynamically from the CK console. It also allows us to import plugin features such as the ability
to locate the user. By clicking on an icon, the map will zoom into the user’s exact location from
their GPS data on their phone or computer. Another feature we added through mapbox plugins
was the implementation of a full screen mode.
After getting the base functionality of the map we needed to display our data. Each of the
points on the map are places where one of the art pieces was displayed at some point in history.
We parsed through the data from the CK console as described above and recorded location data
in the fields of the standardized dataset object. This location data is then parsed and added as a
marker to the map. The markers’ sequence numbers in the piece’s movement is also recorded
(e.g. current, original, second, third, etc..). These are used to create the polyline strings, displayed
on the map as an arc, which are placed on the map as the path the piece travels.
The user can add a filter to the markers and lines that are displayed on the map by
inputting a certain range of years. This will limit the points shown on the map to the pieces
which moved during this range.
When one point or line is selected, we iterate through all of the other points and lines and
dull the colors to make it appear as though the selected point is highlighted. To clear the
selection, the user can click on the “Clear Selection” button and we again iterate through all the
points and lines and reset the colors to be their original values.

39
BIBLIOGRAPHY
Art Project. (n.d.). Cultural Institute. Retrieved October 1, 2014, from http://www.google.com/culturalinstitute/about/artproject/
Blair, V. (2002, October 22). Venice: Napoleon's Italian Thorn. Research Subjects: Government & Politics, The Napoleon Series. Retrieved October 1, 2014, from http://www.napoleon-series.org/research/government/diplomatic/c_venice.html
Building and History. (n.d.). Museo Correr. Retrieved November 19, 2014, from http://correr.visitmuve.it/en/il-museo/museum/building-and-history/ Charney, N. (2011, October 24). The Secret History of Art Noah Charney on Art Crimes and Art
Historical Mysteries. 5-Minute History of Napoleonic Art Looting. Retrieved October 1, 2014, from http://blogs.artinfo.com/secrethistoryofart/2011/10/24/5-minute-history-of-napoleonic-art-looting/
Cotton, J. (n.d.). The Churches of Venice. The Churches of Venice. Retrieved October 1, 2014, from http://www.churchesofvenice.co.uk History. (n.d.). Frick Collection. Retrieved November 19, 2014, from http://www.frick.org/collection/history Holocaust Restitution: Recovering Stolen Art. (2014, September 1). Recovering Stolen Art from the Holocaust. Retrieved September 30, 2014, from
https://www.jewishvirtuallibrary.org/jsource/Holocaust/lostart.html "Interactive Qualifying Project" Worcester Polytechnic Institute., 2014. Web. 14 Dec. 2014. http://www.wpi.edu/academics/igsd/iqp.html "Jacopo De’ Barbari, Bird’s Eye View of Venice, a Woodcut." The British Museum. The British
Museum, n.d. Web. http://www.britishmuseum.org/explore/highlights/highlight_objects/pd/j/jacopo_de_barbari_venice.aspx
Main Page. (n.d.). Venipedia. Retrieved October 1, 2014, from
http://www.venipedia.org/wiki/index.php?title=Main_Page
Manor, Nolan P. Student author -- RBE, Maitland, Ian Maxwell Student author -- BE, Kahn, Lauren Michelle Student author -- CS, Heinricher, Dylan Joseph Student author -- CE, &

40
Hart, F. L. Faculty advisor -- CE. (2013). Ecclesiastical architecture -- preserving convents, churches, bells and bell towers. Worcester, MA: Worcester Polytechnic Institute.
Obiekty utracone w wyniku wojny. (n.d.). Ministerstwo Kultury i Dziedzictwa Narodowego .
Retrieved October 1, 2014, from http://www.mkidn.gov.pl/pages/strona-glowna/kultura-i-dziedzictwo/ochrona-dziedzictwa-kulturowego/obiekty-utracone-w-wyniku-wojny.php
Provenance. (n.d.). Merriam-Webster. Retrieved October 2, 2014, from http://www.merriam- webster.com/dictionary/provenance Rii Tera' (n.d.). Venipedia. Retrieved November 19, 2014, from http://www.venipedia.org/wiki/index.php?title=Rii_Terà Rullmann, Kevin Alexander Student author -- ME, Orszulak, Jeffrey Student author -- RBE, Hennessey, Meghan D. Student author -- CE, Dechaine, Danielle Catherine Student author -- CM, Zeugner, John F. Faculty advisor -- HU, & Carrera, Fabio Faculty advisor - - ID. (2013). Treasure's underfoot -- persevering venice's church floor artifacts [sic]. Worcester, MA: Worcester Polytechnic Institute. The Museum. (n.d.). Gallerie dell’Accademia. Retrieved November 19, 2014, from http://www.gallerieaccademia.org/the-museum/?lang=en
"Venice History" Venice World. Web. 10 Dec. 2014. http://www.veniceworld.com/venice_guide_history_culture.htm Web Gallery of Art (n.d.). Retrieved November 19, 2014, from http://www.wga.hu/ Weis, Amanda Michelle Student author -- MIS, Eoff, Eric Student author -- ME, Chines, Justin Francis Student author -- CS, Reynolds, Alexander Christian Student author -- ME, & Hart, F. L. Faculty advisor -- CE. (2013). Venice through the canals of time -- mapping the physical evolution of the city