Embed Size (px)
Citation preview

2 EXISTING CONDITIONS ANALYSIS 28
FIGURE 2.3 | HISTORIC PRESERVATION DIAGRAM
HISTORIC LANDMARKS
P ST. SW
M ST. SW
‘I’ ST. SW
I-395
MA
INE AVE
4TH ST. SW
SOUTH
CAPIT
OL ST.
N

29 SOUTHWEST NEiGHBORHOOD PLAN
Existing Land Use
The Southwest neighborhood features a blend of residential and commercial land uses as well as a number of public amenities and municipal facilities. The neighborhood is predominately residential in character with an eclectic mix of high and low density residential housing typologies, from single family townhomes to apartment towers. Commercial uses are focused on 4th Street between ‘I’ and M Streets and also on South Capitol Street. The neighborhood values its commercial center along 4th Street between ‘I’ and M Streets and in recent years has leveraged public and private investment to attract improved retail and active uses. South Capitol Street serves as the Planning Area’s most eastern boundary, and has the viability to function as an active, mixed-use corridor in the future. Parks and community facilities are also interspersed throughout the Planning Area and are valuable assets that enhance the neighborhood’s amenities.
There are 21 publicly-owned (federal and local) properties in the Planning Area – a very high number given the neighborhood’s size. Aside from parks and the library, public land is concentrated north of M Street SW near South Capitol Street. Several sites feature low-density single use buildings that house city services and are surrounded by surface parking that render them underused and contribute to stormwater runoff.
The 2006 DC Comprehensive Plan designated future land use in most of the neighborhood as moderate to medium density residential with scattered high density parcels throughout the planning area.
Neighborhood commercial uses are also strategically targeted along the 4th Street SW and South Capitol Street commercial corridors. The Comprehensive Plan identifies a number of city-owned parcels along M Street as local public land uses, such as the Department of Motor Vehicles and Metropolitan Police Department buildings. This Government Cluster is being evaluated, given that the District’s municipal services and facility needs are increasing with population growth, and there is recognition of the importance of responsible management of public assets. Future opportunities exist for the District to consolidate these properties and optimize municipal uses or to release them through a competitive bidding process to the private sector for redevelopment that can best meet the community’s needs.
TIBER ISLAND | PREDOMINATE CHARACTER OF SOUTHWEST IS RESIDENTIAL

2 EXISTING CONDITIONS ANALYSIS 30
DEPARTMENT OF MOTOR VEHICLES (DMV) SITE
FIRE AND EMERGENCY MEDICAL SERVICES DEPARTMENT MAINTENANCE SITEDEPARTMENT OF MOTOR VEHICLES (DMV) INSPECTION STATION SITE

31 SOUTHWEST NEiGHBORHOOD PLAN
FIGURE 2.4 | COMPREHENSIVE PLAN FUTURE LAND USE MAP, 2006
MODERATE DENSITY RESIDENTIAL (1-3 STORIES)MEDIUM DENSITY RESIDENTIAL (4-7 STORIES)HIGH DENSITY RESIDENTIAL (8+ STORIES)LOW DENSITY COMMERCIALMODERATE DENSITY COMMERCIALMEDIUM DENSITY COMMERCIALHIGH DENSITY COMMERCIALPARKS AND OPEN SPACELOCAL PUBLIC PUBLIC, INSTITUTIONALSTRIPING INDICATES A MIX OF USES
N

2 EXISTING CONDITIONS ANALYSIS 32
These sites can enable new populations to move into the neighborhood, while striving to meet neighborhood goals for preserving income and family diversity and physical character.
The Comprehensive Plan future land use designations were based on market expectations from 2004-2006, which had not fully anticipated the robust population growth or developments such as the proposed soccer stadium. The Plan proposes revised land use designation for targeted opportunity sites, where future demand, community interest and the market analysis completed during this planning process provides improved development opportunities for the Southwest neighborhood.
Additionally, the plan recognizes an ongoing community need to preserve and enhance existing green space. In addition to the government uses identified above, the Planning Area is home to the following local schools, all of which add to the livability of the Planning Area: Amidon-Bowen Elementary School and Jefferson Middle School Academy. The Appletree Early Learning Public Charter School, located temporarily within the Jefferson campus, is focused on early childhood education for pre-kindergarten levels. The Southwest Public Library Branch provides a valuable educational amenity and also hosts a variety of community programs including family and kids programs, educational activities, yoga and meditation, job readiness preparation, author talks, and more. For more on the library, please see the summary box on page 107.
Recreational and Arts Uses
Arena Stage and Nationals Park are two entertainment venues that draw visitors from the metropolitan region. Arena Stage is a leading producer and presenter of theater and other performing arts, bringing audiences totaling over 300,000 people to the neighborhood each year. Located at the intersection of Maine Avenue and 6th Street SW, it is two blocks from the Waterfront Metro Station and adjacent to The Wharf development. Nationals Park is the stadium for Washington DC’s baseball team, the Nationals, and also hosts a variety of concerts and other activities throughout the year. Located on the border of the Planning Area along South Capitol Street, the venue attracts four million visitors each year.
The Planning Area also has a variety of neighborhood serving facilities. Numerous parks provide green space, playgrounds, athletic fields and courts, and an outdoor pool. The Randall Recreation Center and King Greenleaf Recreation Center provide indoor spaces for community education, fitness, and recreational activities for all age groups. The Anacostia Riverwalk is a pedestrian and bicycle trail, which will provide a continuous path from the National Arboretum to Georgetown once completed. These facilities play a role in making Southwest a family-friendly, livable neighborhood.

33 SOUTHWEST NEiGHBORHOOD PLAN
Existing Zoning
A variety of high and low building heights is unique to Southwest, an intentional mix of townhouses and high-rise towers. Most buildings in the area are under four stories or over eight stories. This defining feature of Southwest is valued by the community; however, most of the current land use and zoning designations call for densities that would not permit new buildings as tall as the existing towers in Southwest and some zoning would permit construction of new buildings in green space.
For example, a medium density residential land use with an R-5-B zone allows, by right, a maximum height of 50 feet with a 1.8 floor area ratio (FAR). Under this designation, any new development on that parcel would not be able to achieve the current high-low
FIGURE 2.5 | ZONING MAP
C-2-CC-3-AC-3-CR-3R-4R-5-AR-5-BR-5-CR-5-DR-5-EW-1
N

2 EXISTING CONDITIONS ANALYSIS 34
mix as reflected in the existing Southwest area because the zoning height restrictions prevent constructing a building over five floors. Although this model may be desirable in other neighborhoods, in Southwest, it would discourage developers from varying building heights or building upwards to free up more room for open space.
The Plan recommends some changes to the Comprehensive Plan future land use designations in targeted areas to both accommodate growth and reinforce the neighborhood pattern of high and low scale development. Corresponding Design Guidelines will ensure that future developments going through the Planned Unit Development process will further reinforce the neighborhood’s esthetic.
FIGURE 2.6 | PROPERTY OWNERSHIP MAP
DC OWNEDDCHA OWNEDFEDERALLY OWNEDPRIVATELY OWNEDRELIGIOUS PROPERTIES
N
* The DC Housing Authority (DCHA) is an independent authority serving the District of Columbia

35 SOUTHWEST NEiGHBORHOOD PLAN
Recent developments and current planning efforts, however, attempt to reverse the planning missteps of earlier generations. The Waterfront Metrorail Station, opened in 1991, connects Southwest with the rapidly developing Green Line corridor. Two streetcar routes are being explored, which could connect Southwest with its neighbors to the east and north. These new transportation options are being supplemented by smaller efforts, such as a Bikeshare station, bicycle lanes and improved pedestrian safety, as well as the DC Circulator which are targeted at improving transportation both within and across Southwest.
MetrorailThe Planning Area has one centrally located Metrorail station, Waterfront Station, which anchors the main street core on 4th Street and supports transit-oriented development. The station offers quick access to other stations. Within a five-minute walk of the Planning Area boundaries are the L’Enfant Plaza, Federal Center Southwest and Navy Yard-Ballpark stations. These locations provide direct access to four of the five Metrorail lines: Green, Yellow, Blue and Orange.
BusSouthwest has seven major bus routes that traverse the Planning Area. These routes connect to the north to the Rhode Island Metrorail Station and Farragut Square; to the south to Buzzard Point, Congress Heights and Fort Washington; and to the East to Anacostia and Benning Heights.
Transportation
Southwest has a unique set of challenges when it comes to circulation and transportation. With limited street grid connections across I-395 and South Capitol Street, Southwest ties into the city fabric of DC at just a few key locations. The neighborhood has good access to Metrorail, bus and bicycle facilities, giving residents a wide range of transit alternatives. These options will be vital to improving sustainability and serving the community as the neighborhood and surrounding areas experience growth in years to come. The great irony of “Old” Southwest was that transportation and infrastructure improvements, designed to speed the movement of people and goods across Washington, DC, isolated the small community from the city as a whole. Southwest became an island, defined by its watery edges (including the Washington and James Creek Canals and Potomac River) and by railroad tracks along Maryland and Virginia Avenues. These factors fostered commercial and industrial activity, which contributed to the Southwest’s diverse urban mix and vitality.
Urban renewal erased much of the industrial and commercial legacy of Southwest, yet did little to improve its connectivity with the rest of urban Washington. Certain elements, like the Southwest Freeway (Interstate 395) and the dead-end cul-de-sacs created by new residential superblocks, served to underscore Southwest’s sense of seclusion and impeded vehicular circulation within the neighborhood.

2 EXISTING CONDITIONS ANALYSIS 36
TO: LIVINGSTON & FORT WASHINGTON
FIGURE 2.7 | BUS SERVICE MAP
BUS LINESBUS STOPS
TO: RHODE ISLAND AVE. STATION
TO: RHODE ISLAND AVE. STATION
TO: ARCHIVES STATION, FARRAGUT SQUARE
TO: FARRAGUT SQUARE
N

37 SOUTHWEST NEiGHBORHOOD PLAN
CARS ON M STREET BICYCLE LANE ALONG 4TH STREET SW
CarThe Planning Area is bounded by a two major arterials—I-395 and South Capitol Street. Due to the fragmented street grid in Southwest, much of the neighborhood’s traffic is channeled onto just a few key streets. Only ‘I’, M and P Streets connect to South Capitol, and only 4th, 6th and 7th Streets connect under I-395 to the street grid to the north. Most streets are collector or local serving, and reinforce the internally focused structure of the urban renewal developments in Southwest. However, channeling traffic onto a small number of through streets also means that a tie-up on one arterial can quickly create gridlock.
BicycleThe neighborhood has one Capitol Bikeshare station which is centrally located across from the Waterfront Station on 4th Street at M Street SW. Other stations are located just outside of the Planning Area at the Federal Center Metrorail station and Navy Yard. The bicycle network in Southwest is continuing to evolve with recent striping of bicycle lanes along ‘I’ Street and 4th Street as well as signed routes along P Street and Half Street.

2 EXISTING CONDITIONS ANALYSIS 38
FIGURE 2.8 | MAJOR CORRIDORS AND BICYCLE LANES DIAGRAM
BICYCLE LANES AND SIGNED ROUTESMAJOR CORRIDORS
P ST. SW
M ST. SW
‘I’ ST. SW
I-395
MA
INE AVE
4TH ST. SW
SOUTH
CAPIT
OL ST.
N

39 SOUTHWEST NEiGHBORHOOD PLAN
Corridors and Public Realm
Southwest has a well-established public realm with mature trees lining streets, landscaped frontages along private buildings and varied building setbacks that collectively establish a sense of greenery along many corridors. The public realm is part of what makes Southwest distinctive, and it is important to retain and improve upon this character in the future.
The mid-twentieth-century urban renewal of Southwest also changed the design and perception of public space within the neighborhood. To allow for the creation of residential superblocks, some of the original L’Enfant street grid was closed. These closures dictate the pattern today of more limited pedestrian and vehicular connectivity throughout neighborhood. Some (although not all) former streets remained in the public right-of-way and were converted to pedestrian walkways lined with shady tree canopies. The orientation of buildings around these superblocks was carefully considered to create transitions between public (parks, streets, and sidewalks), semi-public (setbacks, cul-de-sacs, parking lots and lawns), and private (inner plazas, gardens, and swimming pools) spaces.
Public space in Southwest has remained fluid. Some residential communities have sought to assert the privacy of their properties by adding fences, signage and other visual indicators. In other cases, L’Enfant streets have been restored, including 4th Street, rendering them back to full public use. As the urban character of Southwest relies on this interplay of public and private spaces, it is important to strike a balance in preserving that relationship while also providing for twenty-first century needs.
‘I’ StreetThe ‘I’ Street corridor has a dense, mature tree canopy with large setbacks and a number of civic buildings along the street. This cultural corridor has four churches, two schools, three parks and a diverse range of housing scales and styles.
M StreetThe M Street corridor is one of Southwest’s key connections to Southeast. This street is bordered by a number of underutilized, publicly-owned parcels. With heavy traffic and sporadic tree canopy, M Street is not an ideal corridor for pedestrians. Fortunately, this corridor has the highest capacity for growth and opportunity to create a desirable boulevard within the community. In December 2012, the District Department of Transportation (DDOT) completed the M Street SE/SW Transportation Study which identified existing and future transportation challenges and ways to address them within a 1.7-square-mile area along M Street SE/SW, and the Southwest waterfront from 12th Street SE to 14th Street SW and from the Southwest/Southeast Freeway south to the Anacostia River/Washington Channel. It provides direction for integrating multiple modes - transit, bicycling and walking with motor vehicle traffic in-order to best serve neighborhoods in this burgeoning section of the city. In addition, the study sought ways to most safely and effectively balance the travel needs of residents with those of visitors and workers in the area.

2 EXISTING CONDITIONS ANALYSIS 40
FIGURE 2.9 | VEGETATION AND GREENSPACE MAP
VEGETATION IN THE PUBLIC REALMVEGETATION IN COURTYARD SPACES
4th StreetThe central portion of the 4th Street corridor North of M Street is gradually becoming a neighborhood retail hub for the community. With the Waterfront Metrorail station and surrounding Planned Unit Development, many public realm improvements have been completed in this section of the street, creating a pleasant urban environment. North and south segments of 4th Street have mature tree canopies and large building setbacks, creating a distinctive experience entering Southwest from the north under I-395.
South Capitol StreetCurrently, South Capitol Street has an uninviting public realm for pedestrians. Heavy traffic moves along this corridor and the street lacks trees or buffers so pedestrians have little protection from moving vehicles. Fortunately, the District sees great opportunity for South Capitol Street and envisions it as a walkable boulevard with ground floor retail and mixed-uses in years to come.
N

41 SOUTHWEST NEiGHBORHOOD PLAN
FIGURE 2.10 | ROAD NETWORKS MAP
STREETS
I-395
MAINE AVE.
M ST. SW
P ST. SW
SOU
TH C
AP
ITO
L ST
.
4TH
ST.
SW
Maine Avenue SWThis is a major thoroughfare for commuters through the neighborhood seeking access to downtown and also to points outside of the city. With the build-out of The Wharf development, the street will be reconstructed and serve as more of a gateway and urban boulevard for not only cars but also bicycles and pedestrians. The improvements will better connect Southwest with the new amenities and destinations on the Waterfront.
N

2 EXISTING CONDITIONS ANALYSIS 42
Parks and Open Space Existing Conditions
Residents in Southwest take pride in the verdant landscapes enveloping the neighborhood. A large number of parks and open spaces, in addition to some of the District’s most established tree canopies, provide places to stroll, exercise, play and gather. Pursuant to the tree canopy analysis by Casey Trees, the tree canopy in the Southwest Planning Area is currently 25 percent of land area.
Yet many of Southwest’s parks do not meet the programmatic needs of the community. In some cases, residents have formed groups such as the Neighbors of the Southwest Duck Pond to lead maintenance and programmatic improvements. The following key parks and open spaces have helped build community pride and are revered as community gems:
Lansburgh ParkThis multi-use park is home to a community garden, basketball courts, pavilion, and dog park. Lansburgh Park is important to residents and serves a number of needs. Although existing conditions identify underutilized amenities that are essentially hidden from plain view within the neighborhood, efforts to improve the use of the park and publicly-owned parcels surrounding its open space provide the unique opportunity to recast this park as Southwest’s “central park”.
AERIAL IMAGE OF LANSBURGH PARKN
M Street SW
‘I’ Street SW
Dela
war
e Av
enue
SW

43 SOUTHWEST NEiGHBORHOOD PLAN
Randall Recreation CenterThe recreation center is home to an outdoor pool as well as recreational fields and a couple of aging buildings. The community desires renovations and improvements to make this park more accessible and visible. Both existing buildings are in dire need of repair. Community sentiments regarding future improvements include more robust arts-centered programming to meet the demand of an expanding art culture within the neighborhood. Additionally, both buildings exhibit unique historic character and are likely to be considered historic should a landmark application be considered. Overall, Randall Recreation Center is considered by neighborhood residents of high historic value.
King Greenleaf Recreation CenterThis large venue in the center of the study area offers both indoor and outdoor facilities. Its fields are frequented by sports groups, and the indoor recreation center has a gymnasium, meeting rooms and other facilities for the community. Recent investments in the park and surrounding recreation center offer improved services and amenities for all Southwest residents.
Southwest Duck PondThe Neighbors of the Southwest Duck Pond community group has taken on programming and fundraising for this beloved and historic park. With its central location in Southwest and proximity to nearby elementary schools, Arena Stage and 4th Street, the Southwest Duck Pond is a great community gathering venue.
FROM TOP LEFT TO BOTTOM RIGHT – AERIAL IMAGES OF RANDALL RECREATION CENTER, KING GREENLEAF RECREATION CENTER, SOUTHWEST DUCK POND,
LIBRARY PARK, JEFFERSON MIDDLE SCHOOL ACADEMY FIELDS AND AMIDON-BOWEN ELEMENTARY SCHOOL FIELDS
N

2 EXISTING CONDITIONS ANALYSIS 44
Library ParkLibrary Park recently completed major improvements including the addition of a playground. This park complements the Southwest Library and serves as a small oasis in the heart of the community.
Jefferson Middle and Amidon-Bowen Elementary School FieldsThe recreation fields located at the local schools are both gated and typically not open for public use during school hours. These facilities provide space for student recreation during school hours and are sometimes used for external events.
FIGURE 2.11 | PARKS AND OPEN SPACE MAP
PARKSRECREATION FIELDS
N

45 SOUTHWEST NEiGHBORHOOD PLAN
ARENA STAGEPLACES OF WORSHIPPUBLIC SCHOOLSLIBRARYRECREATION CENTERSBLIND WHINO
FIGURE 2.12 | ARTS AND CULTURAL AMENITIES MAP N
2 EXISTING CONDITIONS ANALYSIS 46
Arts, Culture and Community Facilities
Over time, Southwest has developed and upheld a vibrant art and cultural scene. Residents take pride in the unique identity established in Southwest over the years. Although Southwest is located only a few blocks from the National Mall, Smithsonian museums and downtown Washington, its residents have a longstanding tradition of fostering art and culture within their own neighborhood. To instill a sense of community after the wholesale redevelopment of Southwest in the 1960s, residents inaugurated an annual Festival of the Arts, featuring craft demonstrations, folk music, modern dance, film screenings and art exhibitions. Murals and sculptural installations were carefully integrated throughout the neighborhood, reflecting the high value placed on public art and good design—both by the planners of Southwest and the residents themselves. Enduring institutions like the Arena Stage have broken the mold of a neighborhood arts venue, staging productions of a national caliber within an intimate, community setting.
In the recent past, neighborhood art amenities have diversified, engaging the unique venues and talents latent in the community. The expansion of the historic Arena Stage Theater has truly transformed Southwest into a beacon for locally produced art and cultural activities. The vividly imaginative reuse of the former Friendship Baptist Church to house the non-profit arts venture Blind Whino testifies to the tradition of engaging arts and culture in Southwest. Approved PUDs for the historic Randall School and The Wharf combined with recent interest in the redeveloping Southeastern University, demonstrate the huge potential of Southwest to become an even more dynamic center for art and culture in Washington DC.
Local schools, nearby places of worship, and a neighborhood library add to the livability of the Planning Area. There are eight churches of varying denominations, many in beautiful buildings that also serve as a venue for various community uses. The Amidon-Bowen Elementary School and Jefferson Middle School Academy are within walking distance for those living within the Planning Area. The Southwest Public Library Branch provides a valuable educational amenity and also hosts a variety of community programs including family and kids programs, educational programs, yoga and meditation, job readiness preparation, author talks, and more.
47 SOUTHWEST NEiGHBORHOOD PLAN
Market Analysis Summary and Outlook
A market analysis was conducted to assess neighborhood demographics, real estate conditions and trends, infrastructure and planned development projects to better understand potential opportunities and limitations for real estate development in the Southwest Planning Area. The Plan’s market analysis offers findings to inform policy, design and development recommendations for the Southwest neighborhood.
DemographicsThe market analysis projects neighborhood population growth from 11,929 in 2013 to approximately 15,500 people in 2023 and more than 20,100 people in 2033. Many people moving into the planning area for the first time are young professionals in their 20s and 30s – a growing segment of the population citywide. Community residents have expressed support for seeing real estate development that retains the neighborhood’s balance and diversity.
The Planning Area saw very little real estate development between 2000 and 2010, and correspondingly, the neighborhood population gained only 745 residents between 2000 and 2013 — a 0.5 percent annual rate of growth (DC’s annual growth rate during these years, by comparison, was 1.01 percent).
Development has since increased quite dramatically with two new apartment communities currently leasing and more than 2,600 housing units proposed in the neighborhood over the next 5-10 years. This sudden surge in real estate development likely stems from the recovery after the recent economic downturn. Developers and residents across the city are starting to pay attention to Southwest— an often overlooked residential neighborhood in the past.
While historically families have tended to move out of the District when children reach school age, there is indication that this trend is starting to reverse. The DC Public School system notes that more families with young children are remaining in the District and projects that the number of children in the city will start to increase.
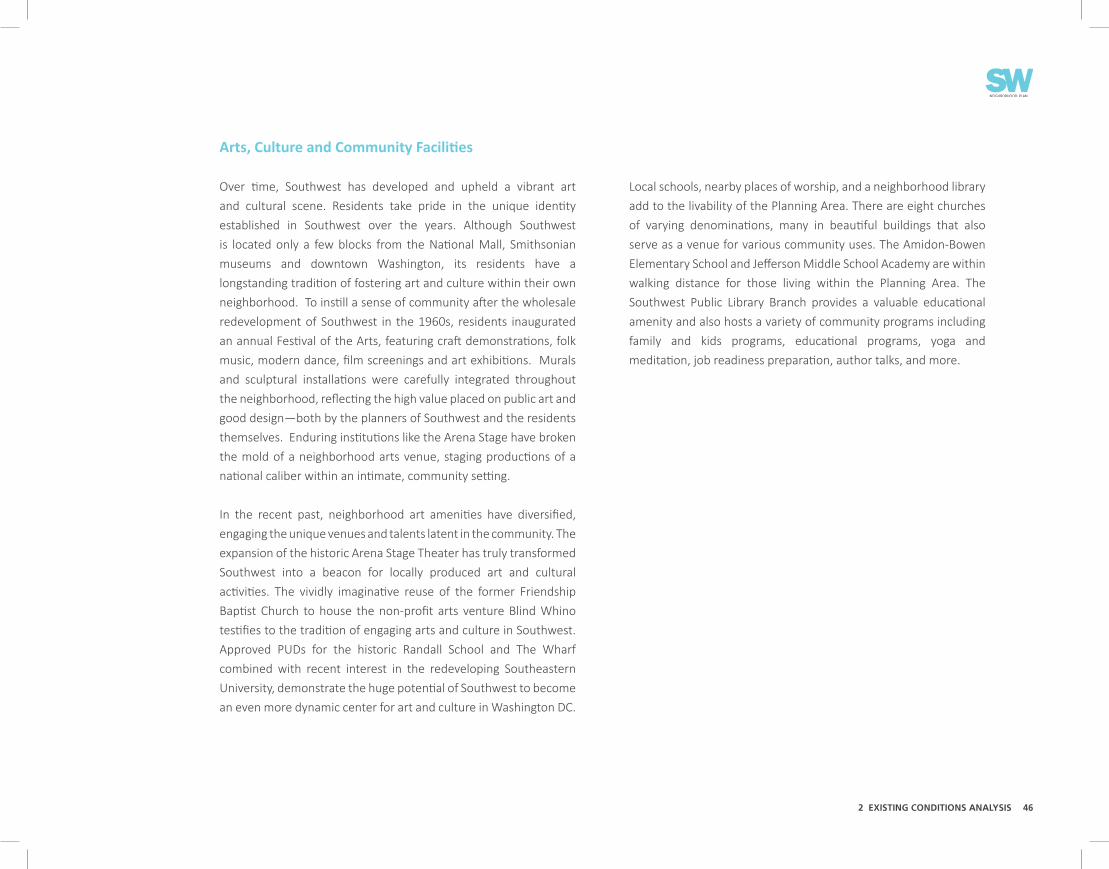
Future development in the neighborhood should support the needs of current and future residents while helping to retain the character and diversity of the Planning Area’s population. The Planning Area has a particularly diverse population. The senior population is larger than the city-wide average (22 percent of residents are over 65 as opposed to 19.7 percent across DC), which reflects the supply of senior-oriented housing and the fact that many residents have lived in the neighborhood for a long period of time. The Planning Area has a much smaller proportion of families with children (11 percent) than DC does as a whole (17 percent). Overall, the average
FIGURE 2.13 | HOUSEHOLD COMPARISONS - DC VS PLANNING AREA
SWPo v e r t y R a t e
P O V E R T Y R AT E14% 19%
DCPo v e r t y R a t e

2 EXISTING CONDITIONS ANALYSIS 48
age in the Planning Area is 39.1 while the average age in DC is 33.8. However, in 2000, 20 percent of households in DC had children; in 2010, the number had declined to 17 percent of households. The Planning Area has historically had fewer households with children than the DC average and has experienced a similar decline in family households, from 13 percent in 2000 to 11 percent in 2013. Over this period, DC’s average age has declined slightly between 2000 and 2010 (34.6 to 33.8) while the average age in the Planning Area has increased slightly from 38.8 to 39.1.
HousingThe neighborhood housing market is anticipated to continue to be strong and absorb a significant number of units in the near and long term. Southwest is largely tucked away from the rest of the city by the Potomac River, Anacostia River and Interstate 395. It lacks the large supply of retail sought by many of DC’s new residents who are drawn to neighborhoods with those amenities. Until recently, it was unclear whether sufficient rents could be collected in Southwest to cover construction costs for new development. So far, both actively-leasing apartment developments in the neighborhood – Sky House and Camden South Capitol – have absorbed units quickly and at high lease rates, a sign that the Planning Area is becoming a viable location for new residential development.
Much of the new construction that is currently leasing and that is in the development pipeline for the Planning Area are higher-end apartment complexes with in-building amenities such as pools and fitness centers, and with units ranging from studios to two-bedrooms. This housing typology is oriented towards young professionals and can be unaffordable for households with moderate or lower incomes or households with multiple children. Despite an expected increase in young professional households, the population of elderly individuals and families is not expected to decline.
Since 2000, home prices in the Planning Area have appreciated at a much lower rate (3.9 percent per year) than the DC average (6.3 percent per year), and home sales prices and rents are considerably lower than the DC average. This situation is starting to change as the apartment communities that are currently leasing cater to a higher-income demographic.
The Planning Area is also home to a diverse community. The senior population is larger than the city wide average. Approximately 775 households with children live in the Planning Area, many of whom live in subsidized apartment buildings. The neighborhood also has a larger proportion of low-income households (19 percent) than the citywide figure (13 percent). However, there are many households within all income levels, age brackets and family types.

49 SOUTHWEST NEiGHBORHOOD PLAN
In all, the average household size is projected to remain approximately the same in the near future, staying around 1.69 per household. DC, meanwhile, has 2.23 people per household on average. Housing sizes in the Planning Area reflect the fact that most units are located in multifamily buildings. There are fewer three-, four-, and five-bedroom units than the DC average, and a greater concentration of studios and one-bedrooms.
There is likely to be an increase in housing demand in the Planning Area for most income brackets and family types. The greatest increase in demand is expected to come from the young professional demographic. However, if the proportion of families below the poverty level (19 percent), families with children (11 percent), or households with elderly residents 65 or older (22 percent) are to be retained, new housing must cater to these populations as well.
Income, Poverty, and EmploymentApproximately 19 percent of the units in the planning area are subsidized—a nearly 50 percent higher proportion than the city-wide average, where 13 percent of units are subsidized. The planning area also has 19 percent of household units below the poverty rate (DC’s overall poverty rate is 14 percent). Despite this, the median household income in the SW planning area is slightly higher than the DC average ($67,750), at $68,106. However, the average household income for the city of Washington, DC, ($103,429), exceeds that of the planning area, $93,096. Also, when compared to the city, Southwest has quite a diversity of household incomes, with a lower percentage of households either making

2 EXISTING CONDITIONS ANALYSIS 50
ready spaces, small day-time population, and local-serving retail market limit the overall retail opportunity. However, The Wharf, a large redevelopment on the waterfront, will bring a wide variety of retail uses within walking distance of the Planning Area, and will generate enough pedestrian traffic at the Waterfront Metrorail station to allow for additional local-serving retail at that location. Successful retail development on 4th Street could promote the corridor as the Planning Area’s retail main street, better serve the community and provide a pedestrian-oriented gateway from the Waterfront Metrorail station to The Wharf.
Additionally, with the recent creation of a Southwest Business Improvement District (BID), there is a potential to bolster market positions and perception by marketing the corridor to future tenants and retailers. This is an expected and necessary action to help foster visibility and attractiveness of this main street corridor. The BID and other District Agency partners should also establish temporary urbanism activities, such as pop-up retail and creative placemaking activities to incite interest and viability to existing vacant space. This collaborative approach to changing the market perception is a vital step to achieving a successful, vibrant, neighborhood serving town center.
under $25,000 a year in income (approximately 10 percent) or making over $250,000 a year in income (less than 10 percent). A greater proportion of households (approximately 30 percent) make between $50,000 -$100,000.
It is estimated that approximately 243 new housing units are needed each year to satisfy the expected demand for new housing, or a total of approximately 2,429 new housing units combined over the next ten years. The demand projection also accounts for two additional factors: first, that limited recent supply means a level of pent-up demand that should result in higher housing demand over the next few years; and second, that The Wharf development will draw a sizeable portion of households that would otherwise not move to the Planning Area. The Market Analysis projected annual new housing demand from 2014 through 2034. In all, it is estimated that a total of 2,255 new housing units can be sold or leased up at a healthy absorption pace between the year 2014 and 2023, and 5,517 new housing units can be sold or leased by 2034.
RetailThe retail market is somewhat limited in scale and opportunity, but can be bolstered through branding and tenant attraction, growth in the residential population, and the increased recognition that nearby entertainment destinations will generate.
Residents within the Planning Area want to see more local-serving retail such as restaurants, coffee shops, bars, a hardware store, a laundromat, a hair salon, a bank and a bakery. Over the last few years, a Safeway, CVS drug store and multiple new restaurants have opened on 4th Street. However, the Planning Area’s lack of retail-

51 SOUTHWEST NEiGHBORHOOD PLAN
The Market Analysis finds that there will be demand for between 11 and 20 additional stores within the Planning Area by 2023, totaling between 75,000 and 110,000 square feet of retail. It is important to note that these figures reflect the amount of retail space that could potentially be supported within the Planning Area under ideal conditions, not the amount that is likely to be built. For example, the analysis demonstrates that there is demand for as many as three automotive stores and two gas stations. Despite the necessary market demand to make these uses viable, there are numerous reasons why these uses are unlikely: there are not an abundance of parcels that are large enough and have the type of vehicular access necessary to support these uses, the community may not support one or more auto-centric uses, and it is unlikely that three of the same uses would decide to locate in such close proximity.
SUBWAYDRY CLEANERSRESTAURANTS
CVSSAFEWAYSTARBUCKS
CAPITOLSKYLINEHOTEL
7-ELEVEN
GRANDCHINA
CAPLIQUOR
FIGURE 2.15 | RETAIL AMENITIESGROUND FLOOR RETAIL
N

2 EXISTING CONDITIONS ANALYSIS 52
SummaryThere is a significant amount of development planned for the Planning Area, and the type and quantity of land use supply generally aligns well with projected neighborhood need. The market analysis projects market demand for approximately 2,330 new residential units in the Planning Area over the next ten years. There are currently 2,690 units proposed – some of which will likely come on line close to ten years in the future. In addition, the 55,000 square feet of proposed retail space also fits demand projections relatively well. One incongruity between projected future land use needs and proposed supply is office space. The 440,000 square feet of new office space planned for Waterfront Station may be difficult to lease. As a result, the developer should have the flexibility to request a modification to the approved Planned Unit Development to incorporate residential uses within the buildings.
OfficeThe Planning Area’s office market is weak, although it may continue to attract future government office uses given the concentration of public land. In the first phase of the Waterfront Metrorail Station development, two new office towers were built totaling 640,000 square feet of space leased by DC government agencies. While this land use helps diversify the activity around the station, it did not establish a private sector office market in the Planning Area. In fact, office real estate trends indicate that the Planning Area is a challenged market for office development. New office construction in the Capitol Riverfront neighborhood to the east is marked by high vacancies and lease rates that are too low to justify new construction. In addition, upcoming office supply at The Wharf, Capitol Riverfront and Southwest EcoDistrict to the north make developing office space in the Planning Area a difficult proposition over the next 10 to 20 years.
There are two planned projects in the Planning Area that call for office development. The Waterfront Station development calls for two additional office towers to be constructed, totaling 440,000 square feet, and has been approved by the city as a Planned Unit Development. As a result, these proposed office developments could prove less viable in the near term than residential developments with ground-floor retail uses. The second planned office project in the Planning Area, a vacant parcel on the corner of L Street SW and South Capitol Street owned by the Ruben Companies, would be more viable if it included a mix of retail and residential uses as well.

53 SOUTHWEST NEiGHBORHOOD PLAN
COMMUNITY MEETING 1 | MEMBERS OF THE COMMUNITY SHARED THE STRENGTHS AND ISSUES IN SOUTHWEST
03 COMMUNITY ENGAGEMENT | PROCESS TO VISION
3 COMMUNITY ENGAGEMENT PROCESS TO ViSiON 54
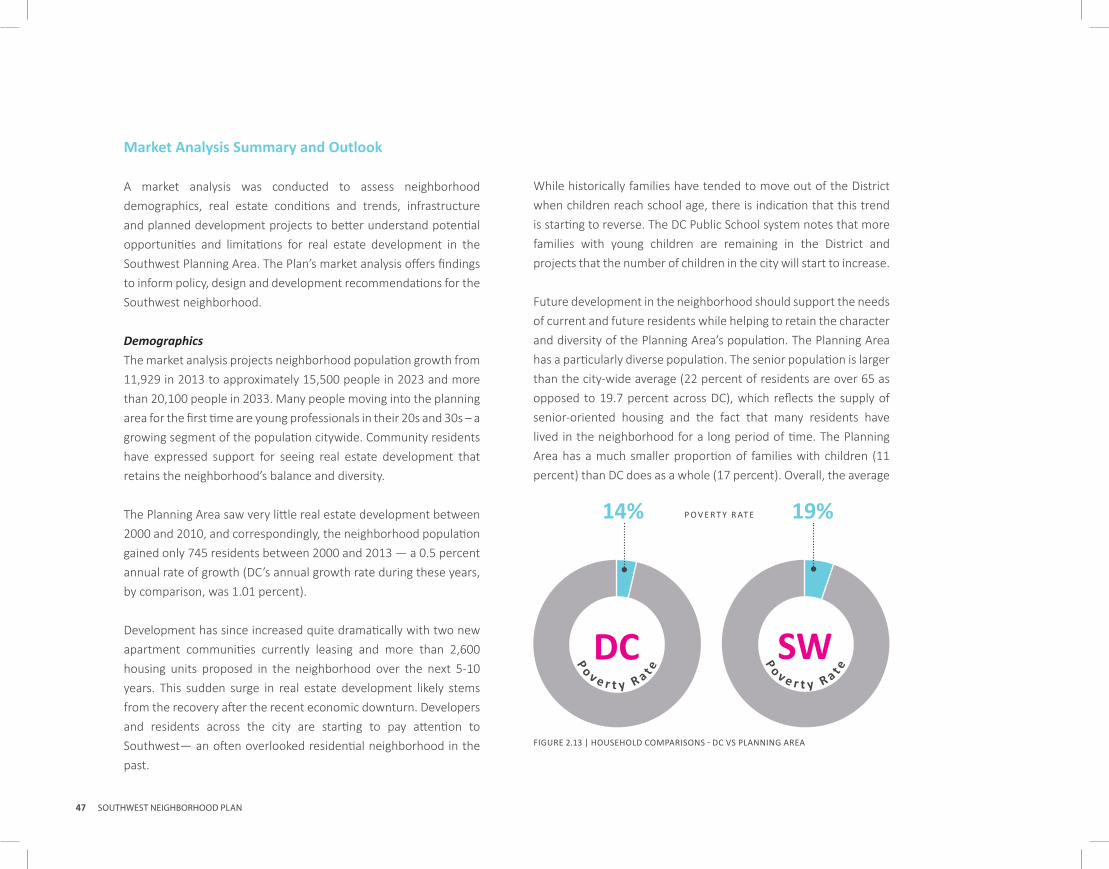
Overview The Southwest Neighborhood Plan is a community-based Small Area Plan. The document is envisioned as a framework that balances growth with the community’s values and neighborhood culture. A robust community engagement process was carried out to learn about community preferences, build a collective vision, identify guiding principles, and receive feedback on proposed recommendations.
The community engagement approach for the Southwest Neighborhood Plan included community meetings, an Advisory committee, focus groups, consultation with other District agencies, input from neighborhood groups, an extensive review of existing plans, and a thorough site and market analysis. This level of engagement was critical to building a comprehensive neighborhood plan with input from all stakeholders.
COMMUNITY MEETING 3
COMMUNITY MEETING 4COMMUNITY MEETING 2
COMMUNITY ENGAGEMENT: PROCESS TO VISION
55 SOUTHWEST NEiGHBORHOOD PLAN
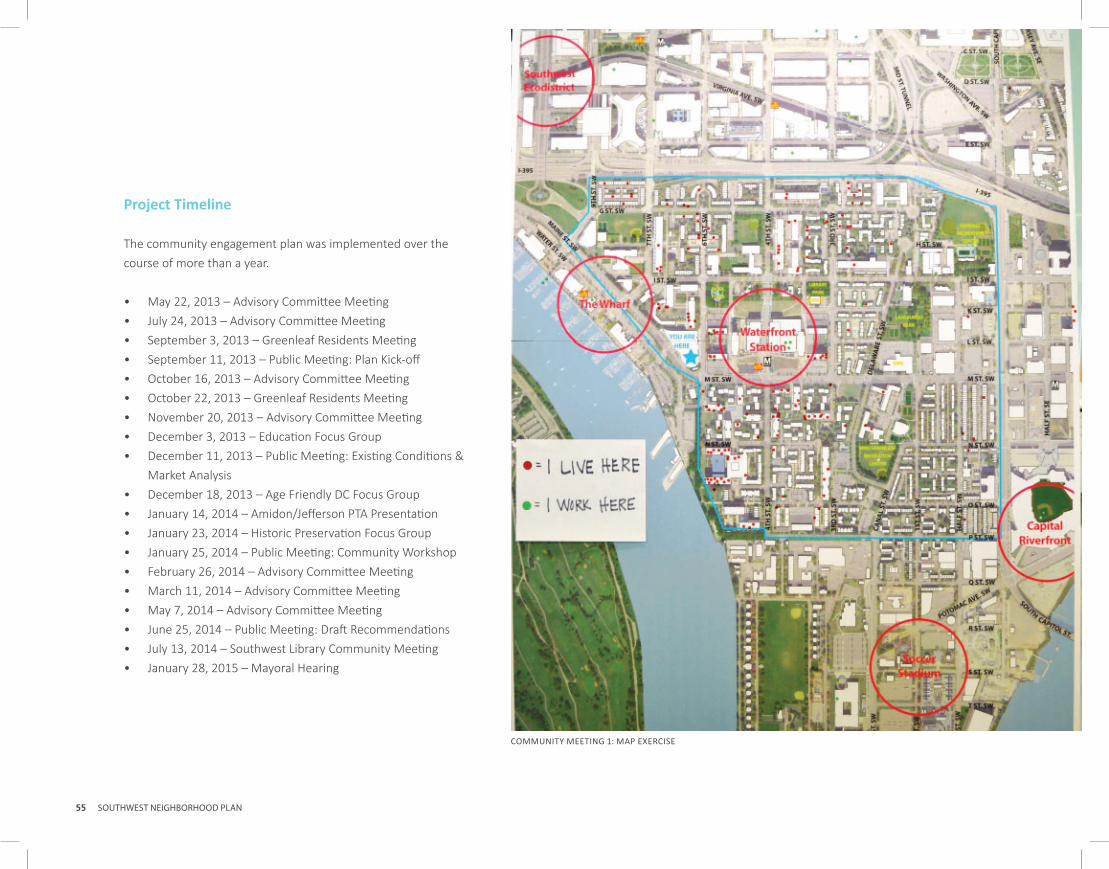
Project Timeline
The community engagement plan was implemented over the course of more than a year.
• May 22, 2013 – Advisory Committee Meeting• July 24, 2013 – Advisory Committee Meeting• September 3, 2013 – Greenleaf Residents Meeting• September 11, 2013 – Public Meeting: Plan Kick-off• October 16, 2013 – Advisory Committee Meeting• October 22, 2013 – Greenleaf Residents Meeting• November 20, 2013 – Advisory Committee Meeting• December 3, 2013 – Education Focus Group• December 11, 2013 – Public Meeting: Existing Conditions &
Market Analysis• December 18, 2013 – Age Friendly DC Focus Group• January 14, 2014 – Amidon/Jefferson PTA Presentation• January 23, 2014 – Historic Preservation Focus Group• January 25, 2014 – Public Meeting: Community Workshop• February 26, 2014 – Advisory Committee Meeting• March 11, 2014 – Advisory Committee Meeting• May 7, 2014 – Advisory Committee Meeting• June 25, 2014 – Public Meeting: Draft Recommendations• July 13, 2014 – Southwest Library Community Meeting• January 28, 2015 – Mayoral Hearing
COMMUNITY MEETING 1: MAP EXERCISE

3 COMMUNITY ENGAGEMENT PROCESS TO ViSiON 56
PROJECT TIMELINE
MAY 2013
JUNE 2013
JULY 2013
AUG 2013
SEPT 2013
OCT 2013
NOV 2013
DEC 2013
JAN 2014
FEB 2014
MARCH 2014
APRIL 2014
MAY 2014
JUNE 2014
JULY 2014
AUG 2014
SEPT 2014
OCT 2014
NOV 2014
DEC 2014
JAN 2015
Mee
ting -
Com
mitt
ee Fo
rmati
on
MAY
22
, 201
3
Mee
ting -
Pla
nnin
g Pro
cess
JULY
24,
201
3
Mee
ting -
Visi
on St
atem
ent
OCTO
BER
16, 2
013
Mee
ting -
Exis
ting C
ondi
tions
NOVE
MBE
R 20
, 201
3
Mee
ting -
Land
Use
FEBR
UARY
26,
201
4 M
eetin
g - La
nd U
se /
Histo
ric P
rese
rvati
on
MAR
CH 1
1, 2
014
Mee
ting -
Dra
ft Re
com
men
datio
ns
MAY
7, 2
014
Gree
nlea
f Res
iden
ts M
eetin
g #1
SEPT
EMBE
R 3,
201
3 Gr
eenl
eaf R
esid
ents
Mee
ting #
2
OCTO
BER
22, 2
013
Age F
riend
ly Fo
cus G
roup
DECE
MBE
R 18
, 201
3
Scho
ols F
ocus
Gro
up
DEC
EMBE
R 3,
201
3
Histo
ric P
rese
rvati
on Fo
cus G
roup
JANU
ARY 2
3, 2
014
Com
mun
ity M
eetin
g - K
ick-o
ff
SEPT
EMBE
R 11
,201
3
Com
mun
ity M
eetin
g - Ex
isting
Con
ditio
ns
DEC
EMBE
R 11
, 201
3Am
idon
/Jeff
erso
n PT
A Pr
esen
tatio
n
JANU
ARY 1
4, 2
014
Com
mun
ity M
eetin
g - W
orks
hop
JANU
ARY 2
5,20
14
Com
mun
ity M
eetin
g - D
raft
Reco
mm
enda
tions
JUNE
25,
201
4
May
oral
Hea
ring
JANU
ARY 2
8,20
15
Draft
Pla
n Re
leas
ed fo
r Pub
lic C
omm
ent
OCTO
BER
16, 2
014
Rel
ease
d Dr
aft R
ecom
men
datio
ns fo
r
Publ
ic Co
mm
ent
JUNE
25,
201
4
Advisory Committee Meetings
Community Meetings
Focus Groups
Draft Report
Legend
End
of th
e Pub
lic C
omm
ent P
erio
d
JANU
ARY 3
1,20
15

57 SOUTHWEST NEiGHBORHOOD PLAN
Advisory Committee
An Advisory Committee composed of over 35 Southwest neighborhood members was convened to advise the Project Team. Then Ward 6 Councilmember Tommy Wells and his staff played an integral role on the Advisory Committee (ANC) and regularly attended public meetings. The Advisory Committee was also comprised of Commissioners from the Advisory Neighborhood Commission and leadership from the Community Benefits Coordinating Council (CBCC), Southwest Neighborhood Assembly (SWNA), resident organizations and homeowner associations, Neighbors of the Southwest Duck Pond, and others representing a cross section of the Southwest neighborhood . The Advisory Committee represented the interests of the community and engaged in a robust dialogue with the Office of Planning through seven Advisory Committee meetings.
• May 22, 2013 – Kick-off meeting, Purpose/Goals of Advisory Committee and the Small Area Plan, Breakout Group Discussions
• July 24, 2013 – Discussion of the Planning Process, Format and Goals of the Kick-off Meeting
• October 16, 2013 – Recap/Discussion of the Kick-off Meeting, Finalizing the Vision Statement, Preview and Discussion of Existing Land-use/Planning Conditions
• November 20, 2013 – Discussion and Edits to Guiding Principles, Further Review of Existing Conditions Analysis
• February 26, 2014 – Recap of January 25 Community Workshop, Beginning of Land Use Designation Recommendations Discussion
• March 11, 2014 – Review of “Roles and Responsibilities” of Advisory Committee Members, Discussion on Historic Character and Continuation of Land Use Discussion
• May 7, 2014 – Open House with Draft Recommendation Boards, Discussion, Notes and Edits from Advisory Committee.
ADVISORY COMMITTEE MEETING
ADVISORY COMMITTEE MEETING