Embed Size (px)
Citation preview
2/5/2011
1
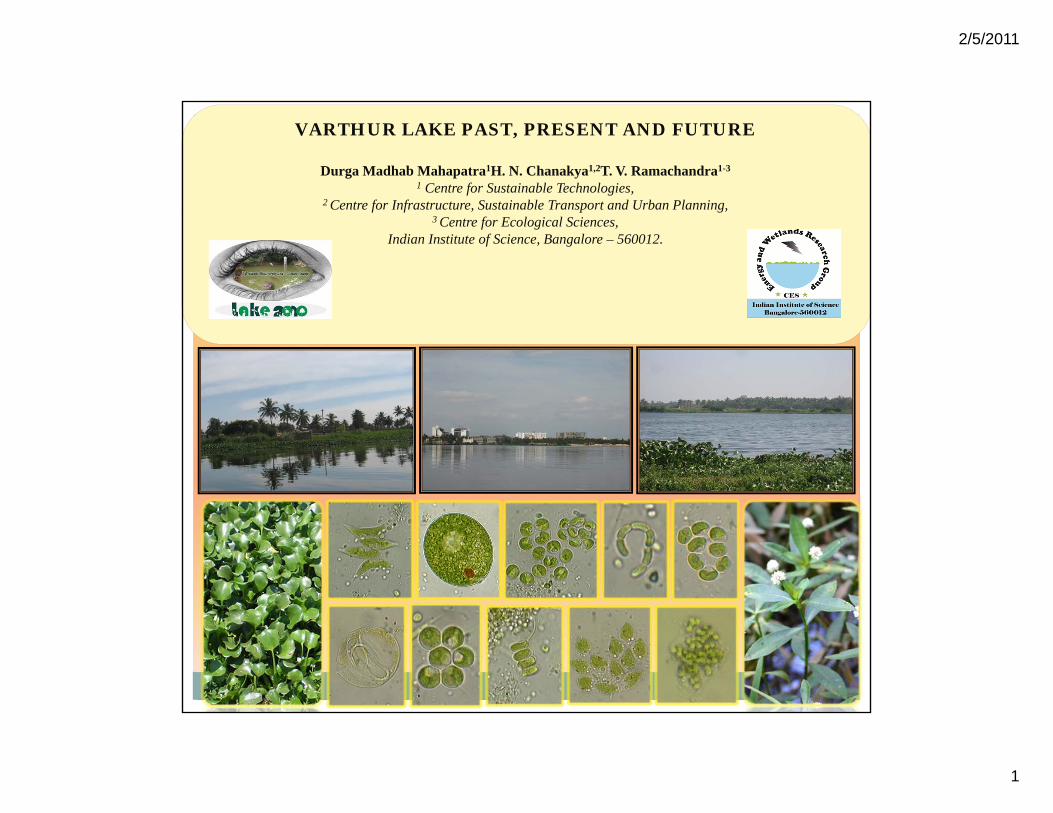
VARTHUR LAKE PAST, PRESENT AND FUTURE
Durga Madhab Mahapatra1H. N. Chanakya1,2T. V. Ramachandra1-3 1 Centre for Sustainable Technologies,
2 Centre for Infrastructure, Sustainable Transport and Urban Planning, 3 Centre for Ecological Sciences,
Indian Institute of Science, Bangalore – 560012.

2/5/2011
2
Importance of lakes
Detoxifies water, sink to myriads of pollutants.
Maintains the microclimate.
Regulates temperature.
Maintains the ecological integrity.
Livelihood for local people.
2
LAKE 2010: WETLANDS, BIODIVERSITY AND CLIMATE CHANGE

2/5/2011
3
Lakes of Bangalore – Varthur Lake Past
Constructed by the Ganga kings 100 yrs back.
Meant for drinking, irrigation and other domestic purposes.
Rice, raggi, coconut, flowers, and a variety of fruits and vegetables are grown
The Bangalore South taluk alone has experienced a surge in its population from 2,84,556 to 4,45,581 between 1971 and 1981 (Census of India, 1981).
Earlier studies Morphometric Survey of Varthur Lake. Water Quality Survey Socio-Economic Survey
3
LAKE 2010: WETLANDS, BIODIVERSITY AND CLIMATE CHANGE

2/5/2011
4
Current status of lakes in Bangalore
Enormous wastewater is genetrated everyday in Bangalore which finally pollutes the receiving waterbodies.
1275 MLD >500 MLD (40%) wastewater flows through Bellandur -Varthur chain of lakes.
The topography of the place with undulating terrain makes it a natural flow course which draws water is interconnected water bodies to downstream regions.
4
LAKE 2010: WETLANDS, BIODIVERSITY AND CLIMATE CHANGE

2/5/2011
5
Varthur Present -Nutrient Overload FISH KILLS GROWTH OF AQ.
WEEDS
ALGAL BLOOMS FROTH FORMATION (Nut. Accumulation)
5
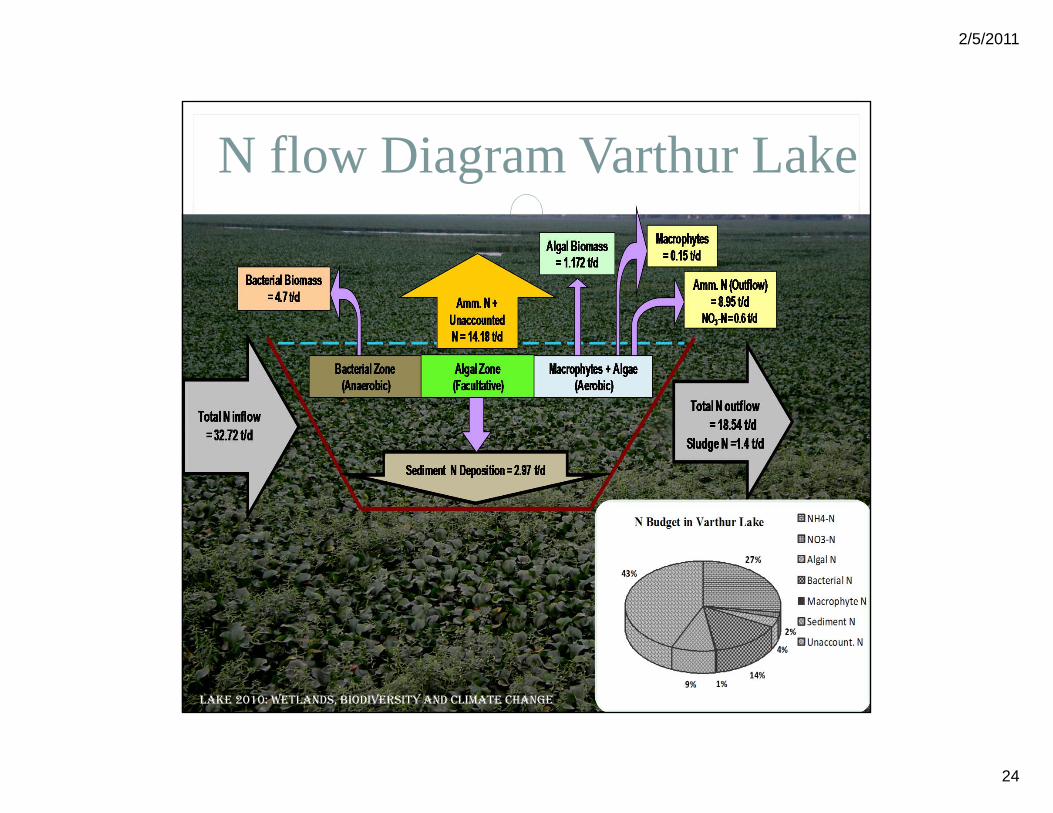
In Bangalore lakes N is critical (N - 32 t/d; P - 6 t/d)
LAKE 2010: WETLANDS, BIODIVERSITY AND CLIMATE CHANGE

2/5/2011
6
Topography Bangalore: Source: ENVIS
6

2/5/2011
7
7
Fig: Interconnected network of water bodies.
LAKE 2010: WETLANDS, BIODIVERSITY AND CLIMATE CHANGE

2/5/2011
8
Study Area
8
LAKE 2010: WETLANDS, BIODIVERSITY AND CLIMATE CHANGE

2/5/2011
9
Present :Varthur Lake 9
2 ft 0.5 ft
700 m 1000 m 50 m
Inflow Outflow
6 ft 4 ft
LAKE 2010: WETLANDS, BIODIVERSITY AND CLIMATE CHANGE

2/5/2011
10
Wastewater Characteristics (Varthur Lake)
Parameters Units 2002 PAST
2010 PRESENT SD Min Max
BIS S std.
Nitrates ppm 1.07 0.304 0.219 0.1 0.96 45 Ammonium ppm >3 15.06 7.6 3.93 30.73 <0.3 Phosphates ppm >1 0.98 0.7 0.14 3.5 <.025 Total Phosphates ppm --- 7.86 2.44 3.14 9.87 BOD ppm 74 89.65 38.54 44 186.1 <3 COD ppm 84 98.2 21.24 52 197.3 <20 pH units 7.59 7.61 0.64 6.2 8.22 6.5-8 EC µS/cm 474 1054.4 158.64 751 1420 10-1000 DO ppm 2.5 1.56 0.67 0 13 >6 Transparency cm 27 23 3.16 18 28 Turbidity NTU 50 78.5 25.6 29 224 ORP mV --- -9.33 -- -235 135 TDS ppm 332 237.78 23.3 113 460
10
LAKE 2010: WETLANDS, BIODIVERSITY AND CLIMATE CHANGE

2/5/2011
11
Results Significant BOD reduction 55% (Total)
<30 ppm (filtrable) During Rainy season
COD reduction of about 62.3 %. Removal of TN = 51.2%. Ammonia removal = 57 %.
Nutrients: No significant change in the nitrates
levels (<1 mg/l)
Orthophosphates increased towards the outlets during the warm period.
Algae played a major role in the uptake of nutrients during the monsoon period.
40
80
120
160
200
Jul A S O N D Ja F M A M Jun
Inlet
Outlet40
80
120
160
200
Jul A S O N D Ja F M A M Jun
Inlet
Outlet
Nitrates
0
1
2
3
4
Jul A S O N D J F M A May Jun
mg/
l
VSO VNNitrates
0
1
2
3
4
Jul A S O N D J F M A May Jun
mg/
l
VSO VNPhosphates
0
1
2
3
4
Jul A S O N D J F M A May Jun
mg/
l
VSO VN Phosphates
0
1
2
3
4
Jul A S O N D J F M A May Jun
mg/
l
VSO VN
11
LAKE 2010: WETLANDS, BIODIVERSITY AND CLIMATE CHANGE
2/5/2011
12
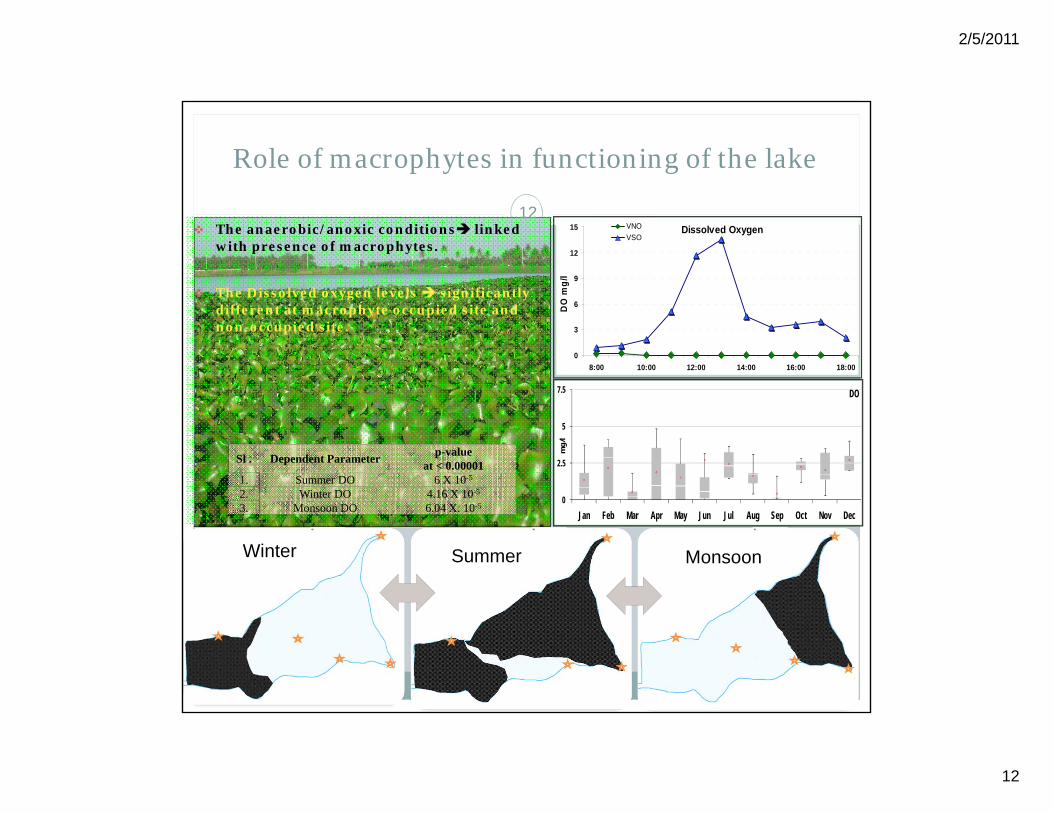
Role of macrophytes in functioning of the lake
The anaerobic/anoxic conditions linked with presence of macrophytes.
The Dissolved oxygen levels significantly different at macrophyte occupied site and non-occupied site.
a) b) c)
Winter Summer Monsoon
Sl . Dependent Parameter p-value at < 0.00001
1. Summer DO 6 X 10⁻⁵ 2. Winter DO 4.16 X 10⁻⁵ 3. Monsoon DO 6.04 X. 10-5
0
2.5
5
7.5
Jan Feb Mar Apr May Jun Jul Aug Sep Oct Nov Dec
mg/
l
DO
0
2.5
5
7.5
Jan Feb Mar Apr May Jun Jul Aug Sep Oct Nov Dec
mg/
l
DO
Dissolved Oxygen
0
3
6
9
12
15
8:00 10:00 12:00 14:00 16:00 18:00
DO
mg/
l
VNOVSO
Dissolved Oxygen
0
3
6
9
12
15
8:00 10:00 12:00 14:00 16:00 18:00
DO
mg/
l
VNOVSO
12

2/5/2011
13
Summer the entire water body became anoxic– high values of NH3 and low values of NO3
0
5
10
15
20
25
S1 S2 S3 S4 S5 S6 S7 S8 S9
mg/
l
Amm N Nitrate N
0
5
10
15
20
25
S1 S2 S3 S4 S5 S6 S7 S8 S9
mg/
l
Amm N Nitrate N
Comparison between NH4 -N and NO3-N during Warm season
13
LAKE 2010: WETLANDS, BIODIVERSITY AND CLIMATE CHANGE

2/5/2011
14
Aquatic plant species in the lake 14
Plant species Common Name Typha augustifolia cat tail Colocasia essculanta taro Cyperus haspans dwarf papyrus sedge Alternanthera phyloxiriodes alligator weed Eichhornia crasssipes water hyacinth Lemna major duckweed Lemna minor lesser duckweed Pistia stratiotes water lettuce Cyanodon dactylon burmuda grass
LAKE 2010: WETLANDS, BIODIVERSITY AND CLIMATE CHANGE

2/5/2011
15
Nutrient content in Macrophytes
The floating macrophytes showed higher N content compared to the emergent types. The Lemna sp. Was positively correlated with Amm-N concentration. Lemna minor (NH4-N 28.5-35 ppm); Lemna major (NH4-N 14-19.5 ppm)
15
LAKE 2010: WETLANDS, BIODIVERSITY AND CLIMATE CHANGE

2/5/2011
16
Carbon content in macrophytes
Cyperus and Typha sp. showed higher C content.
16
LAKE 2010: WETLANDS, BIODIVERSITY AND CLIMATE CHANGE

2/5/2011
17
Algal abundance
17
LAKE 2010: WETLANDS, BIODIVERSITY AND CLIMATE CHANGE

2/5/2011
18
Trachelomonas
Microalgal abundance and species assemblage
18

2/5/2011
19
Oedogoniun
Oscillatoria
Euglenoides
Phacus
Scenedeesmus
Lepocinclis
104 cells/ml 2 X 10⁵ cells/ml 105 cells/ml
19
Microalgal abundance and species assemblage

2/5/2011
20
Bacterial abundance Gasol et al, 1999; Duhamel et al, 2005; Amalfitano et al, 2009.
107 cells/ml
Sludge Bacteria Wastwater bacteria
Beads for ctrl (std.)
20
LAKE 2010: WETLANDS, BIODIVERSITY AND CLIMATE CHANGE

2/5/2011
21
Multivariate spatio-temporal analysis of lake dynamics
T1
T2
T3
T4
T5
21
LAKE 2010: WETLANDS, BIODIVERSITY AND CLIMATE CHANGE

2/5/2011
22
0 0.6 1.2 1.8 2.4 3 3.6 4.2 4.8 5.4 6-3
-2.7
-2.4
-2.1
-1.8
-1.5
-1.2
-0.9
-0.6
-0.3
0
Sim
ilarit
y
T4 T2 T3 T5 T1
0 1.6 3.2 4.8 6.4 8 9.6 11.2 12.8 14.4 16-30
-27
-24
-21
-18
-15
-12
-9
-6
-3
Sim
ilarit
y
S6
S11
S7
S14
S8
S9
S15
S10
S12
S13
S5
S4
S1
S2
S3
Inflow to outflow transects
% Removal efficiency TCOD SCOD TBOD SBOD Nitrates Amm N Phosphates
North Shoreline 41.50% 8% 26.85% 20.80% 27.08% 39.99% 7% Mid of Lake 30.45% 16.20% 26% 21.33% 35.93% 46.15% 22.75%
South Shoreline 8.61% 24.45% 18.77% 29.46% 64.77% -12.48% 41.05%
Multivariate spatio-temporal analysis of lake dynamics
22
LAKE 2010: WETLANDS, BIODIVERSITY AND CLIMATE CHANGE

2/5/2011
23
Nutrient content in the sludge/sediments
The C:N - origin of the sludge.
Very high C:N organic matter of terrestrial origin. As a function of residence the C:N ratio significantly increases.
N limitation in the sludge Leaching of N from sludge Rapid uptake of N by microbiota Losses of N due to volatilisation
0
10
20
30
40
50
60
Z1 Z2 Z3 Z4 Z5Zones
C:N
Non MonsoonMonsoon
0
10
20
30
40
50
60
Z1 Z2 Z3 Z4 Z5Zones
C:N
Non MonsoonMonsoon
Z1 Z2
Z3 Z4
Z5 23
LAKE 2010: WETLANDS, BIODIVERSITY AND CLIMATE CHANGE
2/5/2011
24
N flow Diagram Varthur Lake
24 LAKE 2010: WETLANDS, BIODIVERSITY AND CLIMATE CHANGE

2/5/2011
25
Future (if not restored): Varthur lake
The ingress of sedge communities as cyperus is an indication that 50% of succession (conversion of wetland to marsh).
No water – irrigational requirements is hampered.
Implications on immediate microclimate.
Hydrology deteriorates.
Alteration in water regime surface water as well as ground water.
25
LAKE 2010: WETLANDS, BIODIVERSITY AND CLIMATE CHANGE

2/5/2011
26
Conclusions
A significant BOD reduction 55% (Total) <30 ppm (filtrable) during rainy season; COD reduction of about 62.3 %; removal of TN = 51.2%; ammonia removal = 57 %.
The anaerobic/anoxic conditions were linked with presence of macrophytes.
The floating macrophytes showed higher N content compared to the emergent types. The
Lemna sp. were positively correlated with Amm-N concentration.
Spatio-temporal analysis showed aerobic regions towards the outlets and anaerobic region towards the inlets. The C:N content showed progressive increase in the ratio towards outlets.
The N budget is suggestive of a reasonably high potential for sustainable N (and other
nutrient) recycling.
These findings creates new challenges for creating efficient N recovery systems from sewage and urban wastewater for the future.
26
LAKE 2010: WETLANDS, BIODIVERSITY AND CLIMATE CHANGE
2/5/2011
27
References
APHA (American Public Health Association) AWWA WEF, 1995. Standard Methods for Examination of Water and Wastewater, 19th edition. Washington DC.
Bergey's Manual of Systematic Bacteriology, Volume Two: The Proteobacteria, Parts A - C ; Garrity, George M.; Brenner, Don J.; Krieg, Noel R.; Staley, James R; 2005 Springer - Verlag .
Chanakya, H.N. and Sharatchandra, H.C., 2008. Nitrogen pool, flows, impact and sustainability issues of human waste management in the city of Bangalore. Current Science. 94(11), 1447-1454.
Chanakya, H. N., Karthick, B. and Ramachandra, T. V., 2008. Nitrogen and Carbon flows through Bellandur Lake, In Environmental Education for Ecosystem Conservation (ed. Ramachandra, T. V.), Capital Publishing Co, pp. 25–32.
GW Prescott,1970: How to Know the Freshwater Algae; Wm C Brown, Dubuque.
Oswald, W.J., Green, F.B., Lundquist, T.J., 1995. Performance of methane fermentation pits in advanced integrated wastewater pond systems. Wat. Sci. Tech. 30 (12), 287–295.
Ramachandra, T. V., Ahalya, N., and Mandy Payne. (2006) ‘Status of Varthur Lake: Opportunities for Restoration and Sustainable Management. Technical Report: 102, CES, Bangalore.
Ramachandra, T.V, Rajasekara Murthy, C., and Ahalya, N. (2001). Restoration of lakes and wetlands. Proceedings of Lake 2000. CES Technical Report 87, CES, Bangalore.
Images: http://www.uiweb.uidaho.edu/micro_biology/250/IDFlowcharts.pdf
27
LAKE 2010: WETLANDS, BIODIVERSITY AND CLIMATE CHANGE

2/5/2011
28
28 28
SUNSET@VARTHUR LAKE 2010: WETLANDS, BIODIVERSITY AND CLIMATE CHANGE