Embed Size (px)
Citation preview
University of Texas at El PasoDigitalCommons@UTEP
Open Access Theses & Dissertations
2018-01-01
Variety-Dependent Physiologic And BiochemicalEffects Of Copper Nano Particles On Rosie AndGreen Bok Choy (brassica Rapa) PhenotypesChaoyi DengUniversity of Texas at El Paso, [email protected]
Follow this and additional works at: https://digitalcommons.utep.edu/open_etdPart of the Chemistry Commons
This is brought to you for free and open access by DigitalCommons@UTEP. It has been accepted for inclusion in Open Access Theses & Dissertationsby an authorized administrator of DigitalCommons@UTEP. For more information, please contact [email protected].
Recommended CitationDeng, Chaoyi, "Variety-Dependent Physiologic And Biochemical Effects Of Copper Nano Particles On Rosie And Green Bok Choy(brassica Rapa) Phenotypes" (2018). Open Access Theses & Dissertations. 1421.https://digitalcommons.utep.edu/open_etd/1421

VARIETY-DEPENDENT PHYSIOLOGIC AND BIOCHEMICAL EFFECTS OF
COPPER NANO PARTICLES ON ROSIE AND GREEN
BOK CHOY (BRASSICA RAPA) PHENOTYPES
CHAOYI DENG
Master’s Program in Chemistry
APPROVED:
Jorge L. Gardea-Torresdey, Ph.D., Chair
Geoffrey B Saupe, Ph.D.
Genhua Niu, Ph.D.
Charles Ambler, Ph.D.
Dean of the Graduate School
Copyright ©
by
Chaoyi Deng
2018
Dedication
This thesis is dedicated to my parents and my wife, for their unconditional love and support.
I admire and love you.
Even with all the hustle and hard times, they let me know I will never walk alone.

VARIETY-DEPENDENT PHYSIOLOGIC AND BIOCHEMICAL EFFECTS OF
COPPER NANO PARTICLES ON ROSIE AND GREEN
BOK CHOY (BRASSICA RAPA) PHENOTYPES
by
CHAOYI DENG, B.S.
THESIS
Presented to the Faculty of the Graduate School of
The University of Texas at El Paso
in Partial Fulfillment
of the Requirements
for the Degree of
MASTER OF SCIENCE
Department of Chemistry and Biochemistry
THE UNIVERSITY OF TEXAS AT EL PASO
August 2018

v
Acknowledgments
First and foremost, I would like to thank Lixin Deng and Liwen Zhao for their unconditional love
and support. I am forever grateful for all the sacrifices you have made for me. Thank you for
always believing in me.
Sunshine in my life: Yi Wang. Thank you for all that you did for me. All my accomplishments are
also yours. Thank you for being my wife, stay with me, keeping me positive and perseverant and
fill my life with happiness.
I would like to express my gratitude to my advisor, Dr. Jorge Gardea-Torresdey of the Chemistry
Department at The University of Texas at El Paso, not only because of pushing me to achieve more
goals and many opportunities he gave me, but also his leadership and cares so deeply for me in
several things. I joined his group in fall 2015 and since then, his advice, encouragement, lessons
of life attitude and support have been never-ending. I believed in him when the first moment I
meet him. There is no better mentor that the one who helps you and cares about you so much.
Thanks to Dr. Gardea for your guidance and patience through all these wonderful years.
I am indebted to Dr. Jose R Peralta-Videa and Dr. Jose Hernandez-Viezcas (Pepe) for all the
time advising and yearlong support my studies. Dr. Peralta has always been educational, and he
always welcomes me when I have questions or want to talk about my project. Even when his eye
doesn’t feel good he still gives me a lot of advice and guides me to keep my research in a right
way. I wish your eyes feel better and thank you for teaching me some many things. Thanks also to
Dr. Hernandez’s for all the time he spent with me. His door was always open for me even on the

vi
weekend night no matter the problem is small or huge. His suggestion and generous help to
improve the quality of my research.
My committee member, Dr. Geoffrey B Saupe, the Great teacher also a wonderful friend to me.
I learn a lot in your class and your teaching skill really impress me. Also, thank you for giving me
helping hand all the time, I am truly grateful you have been there for me.
My other committee member, Dr. Genhua Niu, from the Texas A&M AgriLife Research center
at El Paso. she took care of me when I need anything or any help in the Research Center. Your
research attitude and ability have had a great impact on me. Thank you for continuing to support
me to this day.
I also want to thank the financial support from the University of Texas at El Paso and its Graduate
School, the College of Science and the Department of Chemistry and Biochemistry for the teaching
assistantship and funds, also thanks United States Department of Agriculture (USDA), the
University of California- Center for Environmental Implications of Nanotechnology (UC-CEIN),
the National Science Foundation (NSF) support my academic research.
Thanks to my colleagues for lending their helping hand and being my friends: Dr. Wenjuan Tan,
Dr. Ilya A. Medina-Velo, Swati Rawat, Suzanne Apodaca, Dr. Nubia Zuverza-Mena, Ana C.
Barrios, Loren Ochoa, Mariana Molina-Hernandez, Dr. Cyren M. Rico, Carlos Tamez, Reagan
Turley, Dr. Nestor Bonilla, Venkata Reddy, Ishaq Adisa and Dr. Keni Cota. Special thanks to
Osvaldo E. Dominguez for his help and brotherhood. You guys make me become not just a better

vii
scientist also a better person. and I look forward to continuing to work with you. Thank you for
being there for me.

viii
Abstract
The effects of Cu-based nanoparticles (NPs) in bok choy (Brassica rapa subsp. chinensis)
are unknown. In this study, Rosie and Green, two varieties of bok choy, with different anthocyanin
content, were cultivated for 70 days in soil amended with copper oxide nanoparticles (nano CuO),
bulk copper oxide (bulk CuO) and copper chloride (CuCl2) at 75, 150, 300 and 600 mg Cu/kg soil.
Cu and essential elements in tissues, and relative chlorophyll content, were determined. In both
varieties, nano CuO treatments caused significantly more Cu uptake in roots and shoots, compared
with bulk CuO and ion CuCl2 (p ≤ 0.05). Additionally, under the same concentration treatments,
Cu uptake in Rosie was higher than in Green. At all concentration the copper compounds reduced
the biomass of both Rosie and Green bok choy. At 150 mg/kg, nano CuO reduced K by 45% in
Rosie leaves, while at 600 mg/kg reduced it by 41% in Green root, with respect to each control (p
≤ 0.05). Fe accumulation in roots was significantly reduced in the range of 18-50% in both Rosie
and Green plants, compared with control (p ≤ 0.05). Similarly, root P was also significantly
decreased up to 70% with Cu-based compounds (p ≤ 0.05), with respect to control. Total sugar,
starch and protein content were not significantly altered by any of the treatments, except for bulk
CuO at 150, 300, and 600 mg/kg, which increased total sugar in Rosie leaves by 56.87%, 51.89%
and 49.46%, respectively, compared with control (p ≤ 0.05). Rosie bok choy, with significantly
higher anthocyanin content, accumulated more Cu in both root and leaf and the growth of plants
was inhibited more than Green bok choy significantly (p ≤ 0.05). Results showed that nano CuO
was more toxic to bok choy plants than bulk CuO, especially at higher concentrations (300 and
600 mg/kg).
Keywords: Engineered nanomaterials; copper; anthocyanin; bok choy; elemental analysis;
nutritional quality

ix
Table of Contents
Dedication ………………………………………………………………………………..……... iii
Acknowledgements ..........................................................................................................................v
Abstract ........................................................................................................................................ viii
Table of Contents ........................................................................................................................... ix
List of Tables ................................................................................................................................. xi
List of Figures ............................................................................................................................... xii
List of Illustrations ....................................................................................................................... xiv
Chapter 1: Introduction ....................................................................................................................1
1.1 References .........................................................................................................................7
Chapter 2: Variety-Dependent physiologic and biochemicaleffects of copper nanoparticles on
Rosie and Green bok choy (Brassica rapa) phenotypes ........................................................10
2.1 Introduction .....................................................................................................................10
2.2 Matrerials and methods ...................................................................................................11
2.2.1 Preparation of nanoparticle suspensions and other treatments ...........................11
2.2.2 Pot soil preparation .............................................................................................13
2.2.3 Seed Germination and plant growth ...................................................................14
2.2.4 Plant harvest and physiological parameters ........................................................15
2.2.5 Chlorophyll content ............................................................................................16
2.2.6 Elemental quantification .....................................................................................16
2.2.7 Sugar and Starch .................................................................................................17
2.2.8 Protein content ....................................................................................................17
2.2.9 Two-photon microscope .....................................................................................18
2.2.10 Statistical analysis .............................................................................................19
2.3 Results and Discussion ...................................................................................................20
2.3.1 Copper uptake and translate ................................................................................20
2.3.1.1 Copper uptake ........................................................................................20

x
2.3.1.2 Copper translocation to leaves ...............................................................26
2.3.2 Chlorophyll content ............................................................................................32
2.3.3 The inhibition of bok choy growth .....................................................................36
2.3.3.1 Leaf dry weight ......................................................................................36
2.3.3.2 Leaf fresh Weight ..................................................................................38
2.3.3.3 Height .....................................................................................................41
2.3.3.4 Foliar area ..............................................................................................43
2.3.4 Elements accumulation .......................................................................................47
2.3.4.1 Elements translate to leaves ...................................................................47
2.3.4.2 Elements accumulation in roots .............................................................49
2.3.4.2.1 Positively charged elements ....................................................49
2.3.4.2.2 Negatively charged elements ..................................................50
2.3.5 Sugar and starch ..................................................................................................51
2.3.5.1 Sugar ......................................................................................................51
2.3.5.2 Starch .....................................................................................................52
2.3.6 Soluble Protein ....................................................................................................54
2.3.7 Gas exchange ......................................................................................................55
2.4 Conculusion ...................................................................................................................59
2.5 References ......................................................................................................................61
Appendix ........................................................................................................................................65
Vita .............................................................................................................................................80
xi
List of Tables
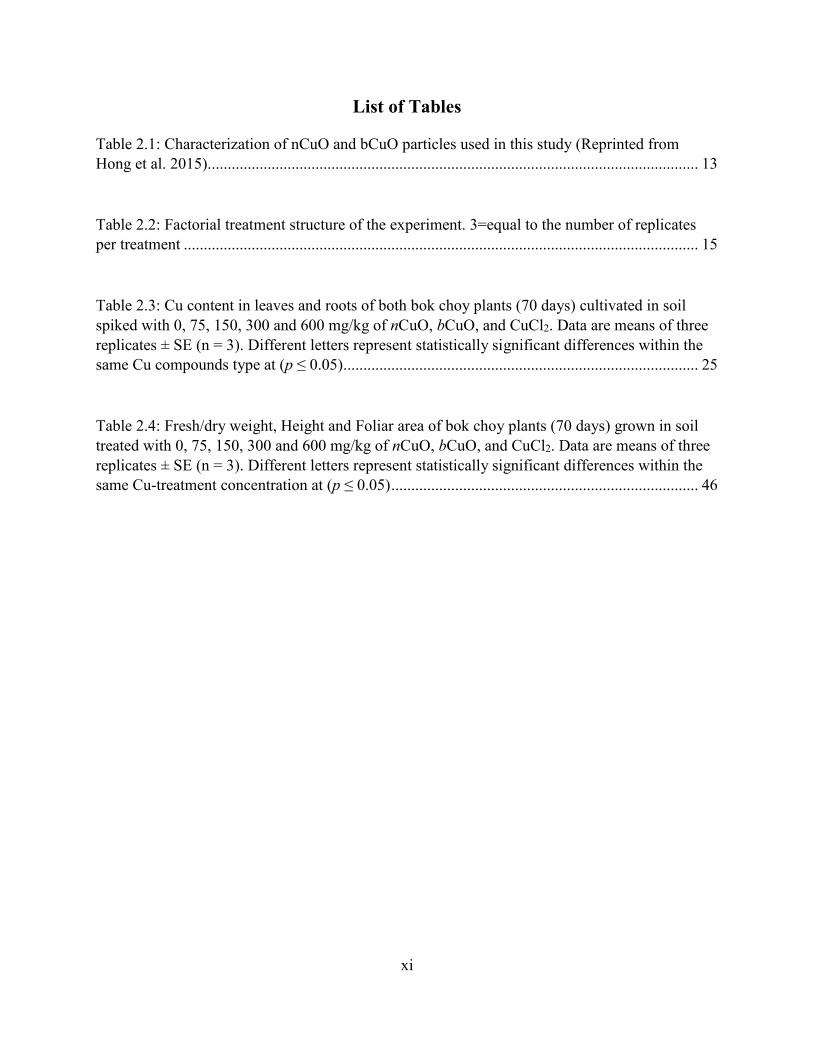
Table 2.1: Characterization of nCuO and bCuO particles used in this study (Reprinted from
Hong et al. 2015)........................................................................................................................... 13
Table 2.2: Factorial treatment structure of the experiment. 3=equal to the number of replicates
per treatment ................................................................................................................................. 15
Table 2.3: Cu content in leaves and roots of both bok choy plants (70 days) cultivated in soil
spiked with 0, 75, 150, 300 and 600 mg/kg of nCuO, bCuO, and CuCl2. Data are means of three
replicates ± SE (n = 3). Different letters represent statistically significant differences within the
same Cu compounds type at (p ≤ 0.05) ......................................................................................... 25
Table 2.4: Fresh/dry weight, Height and Foliar area of bok choy plants (70 days) grown in soil
treated with 0, 75, 150, 300 and 600 mg/kg of nCuO, bCuO, and CuCl2. Data are means of three
replicates ± SE (n = 3). Different letters represent statistically significant differences within the
same Cu-treatment concentration at (p ≤ 0.05) ............................................................................. 46

xii
List of Figures
Figure 1.1: Global material flows for Cu and Cu oxides (metric tons/year) in 2010 (Reprinted
from Keller et al. 2013) ................................................................................................................... 2
Figure 1.2: Production quantity of bok choy from the leading area worldwide in 2014.
(Data retrieved from Food and agriculture organization) ............................................................... 4
Figure 2.1: Cu content in leaves and roots of both bok choy plants (70 days) cultivated in soil
spiked with 0, 75, 150, 300 and 600 mg/kg of nCuO, bCuO, and CuCl2. Data are means of three
replicates ± SE (n = 3). Different letters represent statistically significant differences within the
same Cu-treatment concentration at (p ≤ 0.05) ............................................................................. 24
Figure 2.2: Cu Translocation rate in leaves and roots of both bok choy plants (70 days) cultivated
in soil spiked with 0, 75, 150, 300 and 600 mg/kg of nCuO, bCuO, and CuCl2. Data are means of
three replicates ± SE (n = 3). Different letters represent statistically significant differences within
the same Cu-treatment concentration at (p ≤ 0.05) ....................................................................... 27
Figure 2.3: Chlorophyll a and b content in leaves of both bok choy plants (70 days) cultivated in
soil spiked with 0, 75, 150, 300 and 600 mg/kg of nCuO, bCuO, and CuCl2. Data are means of
three replicates ± SE (n = 3). Different letters represent statistically significant differences within
the same Cu-treatment compounds at (p ≤ 0.05) .......................................................................... 36
Figure 2.4: Dry weight in leaves of both bok choy plants (70 days) cultivated in soil spiked with
0, 75, 150, 300 and 600 mg/kg of nCuO, bCuO, and CuCl2. Data are means of three replicates ±
SE (n = 3). Different letters represent statistically significant differences within the same Cu-
treatment compounds at (p ≤ 0.05) ............................................................................................... 38
Figure 2.5: Weight in leaves of both bok choy plants (70 days) cultivated in soil spiked with 0,
75, 150, 300 and 600 mg/kg of nCuO, bCuO, and CuCl2. Data are means of three replicates ± SE
(n = 3). Different letters represent statistically significant differences within the same Cu-
treatment compounds at (p ≤ 0.05) ............................................................................................... 41

xiii
Figure 2.6: Height in leaves of both bok choy plants (70 days) cultivated in soil spiked with 0,
75, 150, 300 and 600 mg/kg of nCuO, bCuO, and CuCl2. Data are means of three replicates ± SE
(n = 3). Different letters represent statistically significant differences within the same Cu-
treatment compounds at (p ≤ 0.05) ............................................................................................... 43
Figure 2.7: Foliar area of both bok choy plants (70 days) cultivated in soil spiked with 0, 75, 150,
300 and 600 mg/kg of nCuO, bCuO, and CuCl2. Data are means of three replicates ± SE (n = 3).
Different letters represent statistically significant differences within the same Cu-treatment
compounds at (p ≤ 0.05) ............................................................................................................... 45
Figure 2.8: Sugar content of both bok choy plants (70 days) cultivated in soil spiked with 0, 75,
150, 300 and 600 mg/kg of nCuO, bCuO, and CuCl2. Data are means of three replicates ± SE (n
= 3). Different letters represent statistically significant differences within the same Cu-treatment
compounds at (p ≤ 0.05) ............................................................................................................... 52
Figure 2.9: Starch content of both bok choy plants (70 days) cultivated in soil spiked with 0, 75,
150, 300 and 600 mg/kg of nCuO, bCuO, and CuCl2. Data are means of three replicates ± SE (n
= 3). Different letters represent statistically significant differences within the same Cu-treatment
compounds at (p ≤ 0.05) ............................................................................................................... 53
Figure 2.10: Soluble protein content of both bok choy plants (70 days) cultivated in soil spiked
with 0, 75, 150, 300 and 600 mg/kg of nCuO, bCuO, and CuCl2. Data are means of three
replicates ± SE (n = 3). Different letters represent statistically significant differences within the
same Cu-treatment compounds at (p ≤ 0.05) ................................................................................ 54
Figure 2.11: Evaporation rate, Intercellular CO2 concentration, Net photosynthetic rate and
Vapor pressure deficit of both bok choy plants (70 days) cultivated in soil spiked with 0, 75, 150,
300 and 600 mg/kg of nCuO, bCuO, and CuCl2. Data are means of three replicates ± SE (n = 3).
Different letters represent statistically significant differences within the same Cu-treatment
compounds at (p ≤ 0.05) ............................................................................................................... 58

xiv
List of Illustrations
Illustration 2.1: nCuO and bCuO particles in SEM. (Reprinted from Hong et al. 2015) ............. 12
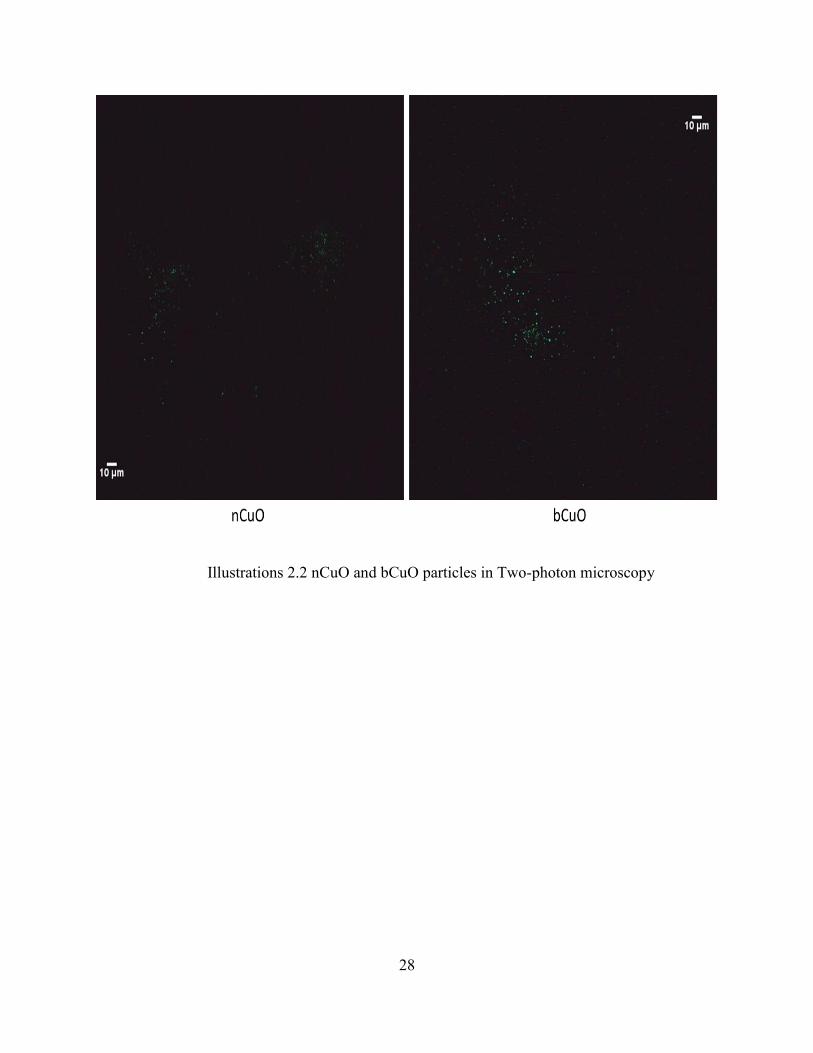
Illustration 2.2: nCuO and bCuO particles in Two-photon microscope ....................................... 28
Illustration 2.3: Rosie bok choy control and treat with nCuO, bCuO particles ............................ 30
Illustration 2.4: Green bok choy control and treat with nCuO, bCuO particles ........................... 31

1
Chapter 1: Introduction
Nanotechnology, also referred sometimes as molecular nanotechnology, has become one
of the most promising and fastest-growing industries in the 21st century. The estimation of the
global market for 2022 may surpass $7.3 billion dollars (McWilliams, 2018).
Nanoparticles (NPs), as the foundation of nanotechnology, are defined by the American
Society for Testing and Materials (ASTM, 2006) as “ultrafine particles with lengths in two or three
dimensions greater than 0.001 micrometer (1 nanometer) and smaller than about 0.1 micrometer
(100 nanometers).” According to this definition, particles with two or more dimensions larger than
100 nm would be characterized as bulk materials. The small size, plus the higher surface area to
volume ratio, give NPs unique physical and chemical properties, when compared with the bulk
counterparts, such as higher chemical reactivity and electrical conductivity, enhanced catalytic
effect and physical strength, as well as unique magnetism, and optical effects (Keller et al., 2013).
Unfortunately, a huge number of NPs are released to the environment after the end user
application. Knowledge of the interaction and effects of the released NPs in living systems are
urgently needed. Terrestrial ecosystems are the most impacted since soil is one of the largest
sinks for all the released NPs. Plants, the main food source for living creatures, are in direct
interaction with the released NPs. Any effects of NPs in plants would ultimately affect the food
chain, including humans, which are the final consumers. The effects of different types of NPs on
various species of plants have been studied in the last two decades. Tan et al. (2017) reported that
hydrophobic nano TiO2 reduced germination, biomass, and root length of basil plants. In addition,
at 750 mg/kg nano-TiO2 in soil, total sugar content in basil decreased significantly. Medina-Velo
et al. (2017) found that Zn content in nano ZnO treated bean seeds was significantly increased.
However, the nutritional composition of bean seeds changed by different treatment concentrations.
Significant increase in Mg and decrease in Ni were detected in the seeds of plants exposed to nano-
ZnO at 125 or 250 mg/kg, compared with control seeds.

2
Figure 1.1 Global material flows for Cu and Cu oxides (metric tons/year) in 2010
(Reprinted from Keller et al. 2013)
By 2010, the production of copper (Cu)-based materials was higher than 200 metric tons
per year, with the main applications in electric engineering, pipes, and vehicles (Keller et al.,
2013). Indeed, Cu use in catalysts for organic systems, sensors, solar cells and additives in
lubricants is widely implemented. As a result, the substantially increased nano-CuO production is
now raising the risk to the environment after disposal. Studies are urgently needed to explore the
potential effect to plants by the leaching and abrasion of nano CuO materials.
Studies on the effects of nano CuO on plants, especially edible vegetables, are still limited.
Apodaca et al. (2017) grew kidney bean (Phaseolus vulgaris) plants for 90 days in soil amended
with nano Cu at 50 and 100 mg/kg and discovered that root Cu content was more than 10 times
higher than in other tissues. Du et al. (2018) cultured for 60 days oregano (Origanum vulgare) in

3
soil amended with nano Cu and bulk Cu at 0–200 mg Cu/kg soil and found that bulk Cu was more
toxic than nano Cu. Du et al. reported that at 50 mg/kg, bulk Cu decreased root biomass and length
by 48.6% and 20.5%, respectively; while at 100 and 200 mg/kg, it reduced water content by 1.8%
and 3.9%, respectively. However, nano Cu increased Ca and Fe accumulation, but decreased Mn
and Zn concentration. Hong et al. (2015) reported that both nano CuO and bulk CuO at a applied
concentration of 5, 10, and 20 mg/L decreased root length of lettuce (Lactuca sativa) and alfalfa
(Medicago sativa) plants by 49% with 15 days of hydroponic growth after 10 days’ hydroponic
exposure. Nutrient contents and enzyme activity were also altered. Cu, P, and S in alfalfa shoots
increased by more than 100%, 50% and 20%, respectively, compared with the control. Furthemore,
P and Fe decreased by more than 50% in lettuce shoots. Moreover, Rawat et al. (2018) cultivated
bell pepper to full maturity in soil amended with nano CuO, bulk CuO, and ionic copper at 62.5-
500 mg/kg) soil. These authors did not find differences in root copper concentration. However, at
500 mg/kg, nano CuO reduced Zn by 55% in leaves and 47% in fruit, compared with the control.
The above literature clearly shows that the response of plants to nano CuO exposure is not uniform.
Factors include the type of plant, the growth medium, the growth environment, the copper product,
and the exposure concentration.
Bok choy (Brassica rapa subsp.), also referred to as Pak choi or Chinese cabbage, is grown
worldwide as a leafy vegetable. It has been popular since ancient times and is well-know for its
sweet flavor and high mineral contents including Ca, Fe, and Mg. There are two popular varieties
of bok choy: green, with green leaves and rosie with purple leaves. These two varieties differ in
anthocyanin content. Rosie contains more than fifteen types of anthocyanins, totaling 3.13
milligrams per gram dry weight, while green bok choy leaves have no anthocyanin content.
Anthocyanins are considered to be healthy to human beings because they have antioxidant and
anti-inflammatory properties, trace metals chelation, and lipid peroxidation inhibition (Hosseinian
and Beta 2007). They may also attenuate the damage from cold, drought, and UV irradiation in
plants (Hosseinian and Beta 2007). There are previous reports about the effects of NPs on bok
4
choy. Xiang et al. (2015) studied the toxicity of four different types of zinc oxide nanoparticles
(ZnO NPs) to the germination of bok choy by soaking the seeds in ZnO suspensions at
concentrations of 1–80 mg/L. They found that ZnO NPs significantly inhibited the root and shoot
elongation in bok choy seeds germination after 3 days.
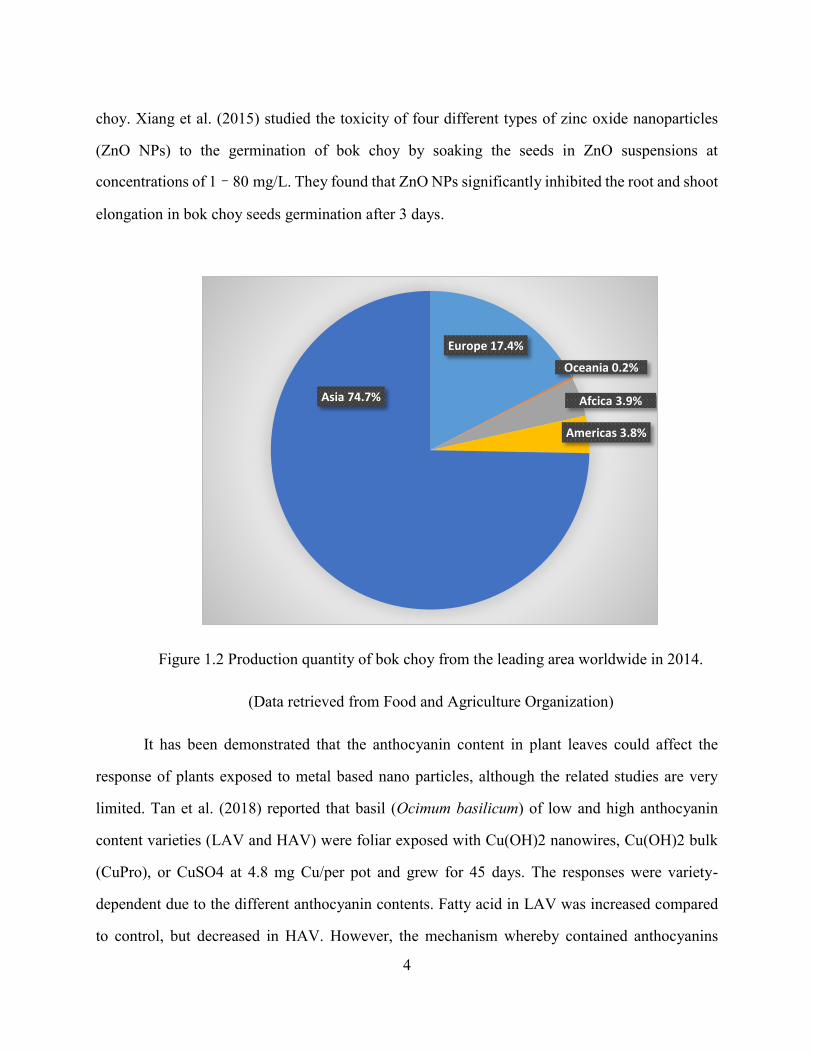
Figure 1.2 Production quantity of bok choy from the leading area worldwide in 2014.
(Data retrieved from Food and Agriculture Organization)
It has been demonstrated that the anthocyanin content in plant leaves could affect the
response of plants exposed to metal based nano particles, although the related studies are very
limited. Tan et al. (2018) reported that basil (Ocimum basilicum) of low and high anthocyanin
content varieties (LAV and HAV) were foliar exposed with Cu(OH)2 nanowires, Cu(OH)2 bulk
(CuPro), or CuSO4 at 4.8 mg Cu/per pot and grew for 45 days. The responses were variety-
dependent due to the different anthocyanin contents. Fatty acid in LAV was increased compared
to control, but decreased in HAV. However, the mechanism whereby contained anthocyanins
Europe 17.4%
Oceania 0.2%
Afcica 3.9%
Americas 3.8%
Asia 74.7%

5
within plants affect the interaction between nanoparticles and plants, especially with nano CuO
particles, is still unknown.
There is currently no data in the interature about the effect of nano CuO on bok choy plants.
Nano CuO has a great potential to be used as nanofertilizer (Dimkpa et al., 2017) and nanopestice
(Kah et al., 2014). Therefore, it is likely that nanoCuO will be used as a fertilizer in bok choy
cultivation. This research is aimed to generate basic knowledge regarding the effects of different
concentrations of nanoCuO in plants varying in anthocyanin content. It is expected that the results
will have application in modern day agriculture.
Rosie and Green bok choy varieties were cultivated for 70 days in local nature soil amended
with nano CuO, bulk CuO, and CuCl2 at 75, 150, 300, 600 mg/kg soil. The response to the
treatments was evaluated through fresh and dry weight, leaves elongation, foliar area, Cu uptake
and macro-and micro-element concentrations in tissues. In addition, the chlorophyll, protein, sugar
and starch contents in leaves were determined. Inductively coupled plasma optical emission
spectroscopy (ICP-OES), UV-Vis absorption, biochemical assays, and two-photon microscopy
were used as analytical techniques.
Hypothesis
This research project was performed under the working hypothesis that the differences in
anthocyanin content would alter the response of the plants to the copper treatments.
Research Objectives
The objectives of this study were to determine the response of the plants to different copper
concentrations and the possible effect of anthocyanin in the response of plants to Cu stress.

6
The specific objectives were to:
1. Evaluate and compare the different physiologic and biochemical effect of three Cu-
based compounds (nano CuO, bulk CuO and CuCl2) on two types of bok choy plants grown to the
mature stage.
2. Analyze the uptake and translocation of Cu from plant roots to plant shoots, as well as
rate of translocation.
3. Determine the possible accumulation of nano CuO and bulk CuO in leaves.
4. Determine the interactions among compounds, concentrations, and plant type.
5. Evaluate the nutritional changes in plant leaves caused by the Cu-based compounds.

7
1.1 References
Andrew McWilliams. (2018). Nanocomposites, Nanoparticles, Nanoclays and Nanotubes:
Global Markets to 2022. https://www.bccresearch.com/market-
research/nanotechnology/nanocomposites-nanoparticles-nanoclays-and-nanotubes-global-
markets-to-2022-nan021h.html
Anjum, N. A., Adam, V., Kizek, R., Duarte, A. C., Pereira, E., Iqbal, M., ... & Ahmad, I. (2015).
Nanoscale copper in the soil–plant system–toxicity and underlying potential
mechanisms. Environmental research, 138, 306-325.
ASTM. (2006). Standard E2456-06: Standard Terminology Relating to Nanotechnology.
American Society for Testing and Materials.
Apodaca, S. A., Tan, W., Dominguez, O. E., Hernandez-Viezcas, J. A., Peralta-Videa, J. R., &
Gardea-Torresdey, J. L. (2017). Physiological and biochemical effects of nanoparticulate copper,
bulk copper, copper chloride, and kinetin in kidney bean (Phaseolus vulgaris) plants. Science of
the Total Environment, 599, 2085-2094.
Chen, H., Roco, M. C., Son, J., Jiang, S., Larson, C. A., & Gao, Q. (2013). Global
nanotechnology development from 1991 to 2012: patents, scientific publications, and effect of
NSF funding. Journal of nanoparticle research, 15(9), 1951.
Du, W., Tan, W., Yin, Y., Ji, R., Peralta-Videa, J. R., Guo, H., & Gardea-Torresdey, J. L. (2018).
Differential effects of copper nanoparticles/microparticles in agronomic and physiological
parameters of oregano (Origanum vulgare). Science of The Total Environment, 618, 306-312.
Gardea-Torresdey, J. L., Rico, C. M., & White, J. C. (2014). Trophic transfer, transformation,
and impact of engineered nanomaterials in terrestrial environments. Environmental science &
technology, 48(5), 2526-2540.
Hong, J., Rico, C. M., Zhao, L., Adeleye, A. S., Keller, A. A., Peralta-Videa, J. R., & Gardea-
Torresdey, J. L. (2015). Toxic effects of copper-based nanoparticles or compounds to lettuce

8
(Lactuca sativa) and alfalfa (Medicago sativa). Environmental Science: Processes &
Impacts, 17(1), 177-185.
Hosseinian, F. S., & Beta, T. (2007). Saskatoon and wild blueberries have higher anthocyanin
contents than other Manitoba berries. Journal of agricultural and food chemistry, 55(26), 10832-
10838.
Ivanov, V. K., Usatenko, A. V., & Shcherbakov, A. B. (2009). Antioxidant activity of
nanocrystalline ceria to anthocyanins. Russian Journal of Inorganic Chemistry, 54(10), 1522.
Keller, A. A., McFerran, S., Lazareva, A., & Suh, S. (2013). Global life cycle releases of
engineered nanomaterials. Journal of Nanoparticle Research, 15(6), 1692.
Ma, C., Chhikara, S., Xing, B., Musante, C., White, J. C., & Dhankher, O. P. (2013).
Physiological and molecular response of Arabidopsis thaliana (L.) to nanoparticle cerium and
indium oxide exposure. ACS Sustainable Chemistry & Engineering, 1(7), 768-778.
Medina-Velo, I. A., Dominguez, O. E., Ochoa, L., Barrios, A. C., Hernández-Viezcas, J. A.,
White, J. C., ... & Gardea-Torresdey, J. L. (2017). Nutritional quality of bean seeds harvested
from plants grown in different soils amended with coated and uncoated zinc oxide
nanomaterials. Environmental Science: Nano, 4(12), 2336-2347.
Peralta-Videa, J. R., Zhao, L., Lopez-Moreno, M. L., de la Rosa, G., Hong, J., & Gardea-
Torresdey, J. L. (2011). Nanomaterials and the environment: a review for the biennium 2008–
2010. Journal of hazardous materials, 186(1), 1-15.
Rawat, S., Pullagurala, V. L., Hernandez-Molina, M., Sun, Y., Niu, G., Hernandez-Viezcas, J.
A., ... & Gardea-Torresdey, J. L. (2018). Impacts of copper oxide nanoparticles on bell pepper
(Capsicum annum L.) plants: a full life cycle study. Environmental Science: Nano, 5(1), 83-95.
Syu, Y. Y., Hung, J. H., Chen, J. C., & Chuang, H. W. (2014). Impacts of size and shape of
silver nanoparticles on Arabidopsis plant growth and gene expression. Plant physiology and
biochemistry, 83, 57-64.

9
Thiruvengadam, M., Gurunathan, S., & Chung, I. M. (2015). Physiological, metabolic, and
transcriptional effects of biologically-synthesized silver nanoparticles in turnip (Brassica rapa
ssp. rapa L.). Protoplasma, 252(4), 1031-1046.
Tan, W., Du, W., Barrios, A. C., Armendariz, R., Zuverza-Mena, N., Ji, Z., ... & Gardea-
Torresdey, J. L. (2017). Surface coating changes the physiological and biochemical impacts of
nano-TiO 2 in basil (Ocimum basilicum) plants. Environmental pollution, 222, 64-72.
Zuverza-Mena, N., Medina-Velo, I. A., Barrios, A. C., Tan, W., Peralta-Videa, J. R., & Gardea-
Torresdey, J. L. (2015). Copper nanoparticles/compounds impact agronomic and physiological
parameters in cilantro (Coriandrum sativum). Environmental Science: Processes &
Impacts, 17(10), 1783-1793.
Tan, W., Gao, Q., Deng, C., Wang, Y., Lee, W. Y., Hernandez-Viezcas, J. A., ... & Gardea-
Torresdey, J. L. (2018). Foliar Exposure of Cu (OH) 2 Nanopesticide to Basil (Ocimum
basilicum): Variety-Dependent Copper Translocation and Biochemical Responses. Journal of
agricultural and food chemistry, 66(13), 3358-3366.
10
Chapter 2: Variety-Dependent physiologic and biochemical effects of copper
nanoparticles on Rosie and Green bok choy (Brassica rapa) phenotypes
2.1 Introduction
Nano CuO based materials are widely applied in batteries, lubricants polymers, ceramic
pigments, gas sensors, and catalysts, among others (Anjum et al., 2015). Several papers have
shown the toxic effect of disposed nano CuO particles to the surroundings. It has been found that
nano CuO inhibits plant growth on several aspects including the decrease of root length, plant
biomass, sugar and protein contents, and alters the nutrient accumulation in different plant parts
(Adrees et al., 2015; Peralta-Videa et al., 2011; Zuverza-Mena et al., 2017).
Bok choy (Brassica rapa subsp.) ranks 6th according to Aggregate Nutrient Density Index
(ANDI) of fruits and vegetables. It is rich in minerals, protein, and vitamins. Bok choy contains
243 μg, 45 mg, and 46 μg per 100 g of Vitamin A, C, and K, respectively, which cover up to 30%,
54%, and 44% of the daily recommended intake. Rosie and Green are two of the most popular
varieties of bok choy in the market. The main difference between these two varieties are the content
of anthocyanin pigments. According to previous studies, anthocyanins perform a protective role
in the growth of plants. Tan et al. (2018) sprayed low and high anthocyanin basil (Ocimum
basilicum) varieties with Cu(OH)2 nanowires, Cu(OH)2 bulk (CuPro), or CuSO4 at 4.8 mg Cu/per
pot and cultivated them for 45 days. Cu concentration was elevated only in the roots of the high
anthocyanin variety when compared to the control (p ≤ 0.05). Additionally, Cu(OH)2 nanowires
significantly increased n-decanoic, dodecanoic, octanoic, and nonanoic acids in the low
anthocyanin variety, but reduced n-decanoic, dodecanoic, octanoic, and tetradecanoic acids in the
high anthocyanin variety as compared with the control.
However, there is no research in the literature about the effects of nanoCuO in bok choy.
No study has examined the translocation of nano-particles from bok choy roots to shoots in mature

11
plants. Additionally, the effects of the anthocyanin content on the reponse to CuO is not known.
A new technique (Two-photon microscopy) was applied in this study to analyze the of uptake and
translocation of nano CuO particles. Compared with other microscope techniques like scanning
electron microscopy (SEM) or transmission electron microscopy (TEM), two-photon microscopy
has the advantage to penetrate the sample and view the internal structure via fluorescence.
Additionally, samples are easily prepared, there is no damage to the sample during the detection,
and the technique can operate at room temperature (Bonilla et al., 2018). In this study, the
physiological and biochemical effects of nano CuO, bulk CuO, and ionic Cu (CuCl2) on Rosie and
Green bok choy were evaluated. Plant fresh and dry biomass, foliar area, Cu concentration in roots
and leaves, leaves nutritional contents, as well as sugar, starch, and protein contents were analyzed.
2.2 Materials and methods
2.2.1 Preparation of nanoparticle suspensions and other treatments
Copper oxide nanoparticles (nanoCuO), bulk coper oxide (bCuO), and ionic copper
(CuCl2) were obtained from The University of California Center for Environmental Implications
of Nanotechnology (UC-CEIN). Their physicochemical properties have been previously reported
and are presented in Table 2.1 (Rawat et al., 2017; Hong et al. 2015). Suspensions/solutions of the
Cu-based products were prepared in millipore water (MPW) and applied to the soil to have final
concetrations of 75, 150, 300, and 600 mg/kg of soil. These concentrations were selected due to
environmental relevance. According to USGS, the average Cu concentration in soil in the United
States is around 30 mg/kg. The Cu concentration in pesticides and fertilizers is in the range of 50
to 300 mg/kg and up to 3000 mg/kg are found in dry sludge. The suspensions/solutions were
freshly prepared and sonicated (Crest Ultrasonic, Trenton, NJ) in a water bath for 25 minutes at 20
- 25°C with a sonication intensity of 180 watts. Bulk and nanoparticle CuO were used to compare
the effect of particle size, while the ionic was used to differentiate the effects of particles and ions.

12
After sonication, 500 mL of the corresponding suspension/solution was added to 5 kg of soil and
manually mixed for 30 min.
Illustrations 2.1 nCuO and bCuO particles in SEM. (Reprinted from Hong et al. 2015)

13
Table 2.1: Characterization of nCuO and bCuO particles used in this study (Reprinted from
Hong et al. 2015 and Rawat et al, 2017)
Property nCuO bCuO
Primary particle size (nm) 20-100 200-2000
Hydrodynamic diameter (nm) 280±15 376 ± 26
Zeta potential (mV) -34.4±0.5 -42.7±0.153
Morphology Rhombus, irregular Prism, irregular
Crystal structure Monoclinic Monoclinic
Cu Content (wt %) 74.3 79.7
Purity (%) 88.3±1.3 92.8±1.1
Other elements present O, C O
Main copper phase CuO CuO
2.2.2 Pot soil preparation
Seventy-eight plastic pots (25 cm in diameter × 26 cm tall) were washed with MPW and
filled with 5 kg of natural soil amended with the respective Cu compound/concentration. The soil
was collected at a field in Socorro, TX, 79927, USA (latitude: 31°67′ N and longitude: 106°28′ W,
elevation: 1115m above sea level). The the soil was previously characterized as medium loam with
19% clay, 44% silt, and 36% sand; 2.8% organic matter, pH = 7.825 ± 0.021, EC = 1705 ± 47.6
µS cm-1, and TDS = 847.5 ± 23.8 mg/L (Medina-Velo et al. 2018).

14
2.2.3 Seed Germination and plant growth
Green and Rosie (F1, Hybrid) bok choy seeds (Brassica rapa var. chinensis) were
purchased from Johnny’s Selected Seeds (Winslow, ME). Seeds were washed with 2%
hypochlorite solution to avoid contamination, rinsed with MPW three times, placed in a 250 mL
Erlenmeyer flask with 200 mL MPW and stirred for 12 h for hydration. After that, two seeds were
planted equidistantly in germination station at 2 cm deep, watered with 20 mL of MPW, and
transferred to a growth chamber (Environmental Growth Chamber, Chagrin Falls, OH) with 14 h
photoperiod (340 µmole m-2 s-1), 25/20 °C day/night temperature and 65-70% relative humidity.
Seedlings were watered daily with 10 mL MPW. Three week old seedlings were transplanted into
pots containing soil amended with with Cu based compounds and transferred into a greenhouse
with 30/20 °C day/night temperature and 50- 75% relative humidity. Each pot was fertilized with
a water-soluble fertilizer (N 15%, K2O 15%, P2O5 5%) at 100 mL per day, the tissues were
harvested 50 days after transplanting.
The 26 treatments were arranged in a completely random design, where the main factors
were the varieties (Rosie, Green) and Cu-based compounds (nCuO, bCuO, CuCl2) at five treatment
concentrations (0 mg/kg, 75 mg/kg, 150 mg/kg, 300 mg/kg, and 600 mg/kg), 0 mg/kg considered
as control in this experiment, while conditions like soil content, daily watering, and fertilization
remained constant. The combination of Cu compounds and plant types gave a total of 26
treatments. Three replications for each treatment were used, giving a total sample size of 78 plants.
Experimental design is shown in Table 2.2

15
Table 2.2: Factorial treatment structure of the experiment. 3 is the number of replicates per
treatment.
Plant Compound Concentration (Cu mg/kg)
0(Control) 75 150 300 600
Rosie Nano CuO 3
3 3 3 3
Bulk CuO 3 3 3 3
CuCl2 3 3 3 3
Green Nano CuO 3
3 3 3 3
Bulk CuO 3 3 3 3
CuCl2 3 3 3 3
2.2.4 Plant harvest and physiological parameters
After 70 days of growth (50 days after transplant), gas exchange within leaves was
measured with a portable gas exchange analyzer (CIRAS-3, PP Systems International, Amesbury,
MA) in the morning (Dou et al., 2018). The stomatal conductance, evapotranspiration, and
photosynthetic rate were measured in the 7th leaf from the core for each plant. Before
measurement, plants were overhydrated with 500 mL water for two days. Then, the plants were
harvested and washed with deionized water to remove attached soil. After measuring the size and
weight, the foliar area was measured using an area meter (LI-3100, LI-COR, Lincoln, NE). All
tissues were collected, washed three times with 0.01M HNO3 deionized water one time, and frozen
at 4 °C in plastic bags until processed. Tissues samples were oven dried in paper envelopes for

16
72h at 65 °C and weighed. Water content was measured by comparing the difference between dry
weight and fresh weights.
2.2.5 Chlorophyll Content
For the chlorophyll content, fresh leaf samples of 0.5g were ground and the chlorophyll
was extracted with 80% acetone, and stored at -80°C until analysis. A UV-Vis Spectrometer
(Perkin Elmer Lamda) was used to measure the absorbance as described by Porra et al. (2002).
2.2.6 Elemental quantification
Dry samples of bok choy leaves and roots were powderized with a coffee grinder (Hamilton
Beach). Samples of ~0.2g of tissue were acid-digested by adding 1 mL of 30% hydrogen peroxide
and 2 mL of plasma pure HNO3 (SPC Science, Champlain, NY), incubated in a Digiprep hot block
(SCP Science) at 115°C for 45 min until sample were totally dissolved. If undigested material
remained, 2 mL of 30% hydrogen peroxide was added and the samples were returned to incubation
for additional 20 min. The digested solutions were adjusted to 45 mL with MPW. Macronutrients
(Ca, Mg, P, S, and K) and micronutrients (Zn, Fe, Mn, Cu, an Ni) were measured by Inductively
coupled plasma – optical emission spectrometry (ICP-OES, Perkin-Elmer Optima 4300 DV;
Shelton, CT). To validate the measurements, a blank (no plant tissues) and standard reference
material (peach leaf, 1547, National Institute of Standards and Technology, Gaithersburg, MD)
were also analyzed in ICP-OES after every 20 samples (Rawat et al., 2017)

17
2.2.7 Sugar and Starch
For sugar and starch determination, dry tissue samples (100 mg) were homogenized in 10
mL 80% ethanol, boiled in water bath (80 °C) for 30 min and centrifuged at 22,000 × g for another
20 min. The extraction steps were repeated three times and all the extracts were mixed together.
The residues after the centrifugation were dried and kept at 80 °C for 24 h. The total volume of the
extracts was reduced to 3 mL by evaporation and then diluted to 25 mL with MPW. The total sugar
content was estimated according to the methods of Dubois et al. (1956). Briefly, 2 mL MPW was
added to dry residues. After heated in water bath (100 °C) for 15 minutes, they were cooled to
room temperature and 2 mL of concentrated H2SO4 were added. After 15 minutes’ incubation,
tubes were brought to 10 mL with MPW. The solutions were centrifuged at 3000 × g for 20 minutes
and the supernatant was recovered. The extraction was repeated using 50% of H2SO4. Then, all
the supernatants were mixed and brought to 50 mL with MPW. The starch content was quantified
according to the method of Dubois et al. (1956)
2.2.8 Protein content
The protein measurements were done according to the Coomassie (Bradford) Protein Assay
Kit (Thermo Scientific) instructions. First, leave samples were prepared by adding 1 mL of MPW
into 20 mg of each dry sample powder. The homogenates were vortexed for 2 minutes and stored
overnight at 4°C. Then, 150 µL of the sample solution was added into microplate wells, following
by 150 µL of the Bradford reagent. The mixture was shaken for 30 seconds and then incubated at
room temperature for 10 minutes in darkness. The BSA (Bovine serum albumin) protein ranging
from 0 to 25 µg/mL was used to generate the standard curve. After the incubation period, the
absorbance was measured at 595nm on a UV-Vis microplate plate reader. Protein content is
expressed as µg/mL.

18
2.2.9 Two-photon microscope
The light source used in microscope was a mode-locked Ti: Sapphire laser. 710 nm light
was selected to achieve two-photon excitation. The laser beam was fed into a home-built video-
rate x-y scanner. The beam passed through a dichroic beam splitter and is then focused onto the
sample by a 60 ×, NA = 1.2, water-immersion microscope objective. The fluoresence signal from
the sample is deflected with a 665 nm long-pass dichroic mirror. A second long-pass dichroic beam
splitter is used to split the blue and green/red fluorescence signal. The blue signal is deflected by
the second dichroic beam splitter, and then is transmitted through a 417-477 nm band-pass filter,
and finally is detected by a photomultiplier tube (PMT). A third long-pass dichroic beam splitter
is used to split the Green and red fluorescence signal. The green signal is transmitted through a
500-550 nm band-pass filter, and finally is detected by another photomultiplier tube (PMT). The
red signal is transmitted through a 570-616 nm band-pass filter, and finally is detected by a third
photomultiplier tube (PMT). The outputs of these three PMTs are fed into red/green/blue channels
of a frame grabber installed on a computer. Two-dimensional images in x-y plane are acquired
through a custom software program. Each frame has 500 × 500 pixels. The imaging speed is 30
frames/sec and each final static image is an average of 50 frames. The power of the laser and the
voltages of the red, green, and blue photomultiplier tubes that were used for obtaining images are
detailed on the figure description. To avoid saturation of the images obtained while still getting
the optimal view of the sample, the photomultiplier tube voltages and power of the laser were
adjusted accordingly. Furthermore, some images exhibited red artifacts, such as streaks across the
image, when processed by the frame grabber; but the artifacts were removed through minimal
image processing (Acosta et al., 2014).
19
2.2.10 Statistical analysis
All the data obtained in this studied was analyzed using the Statistical Package for Social
Sciences 22 (SPSS, Chicago, IL, USA).
The effects of the two main factors (varieties and Cu-based products) and the interactions
of varieties × products, varieties × concentrations, and varieties × products × concentrations were
were evaluated using a three-way ANOVA. The p-value accepted as statistically significant was
0.05. The following simple-simple pairwise comparisons were carried out using a Bonferroni
adjustment to identify the single main effect within Cu based compounds and concentrations
(Medina-Velo et al., 2017).
Furthermore, plant nutrient quality, protein, sugar and starch were evaluated by one-way
ANOVA followed by the Tukeys HSD multi comparison test. The p-value accepted as statistically
significant was also 0.05. Data in the tables are means ± standard errors (SE).

20
2.3 Results and Discussion
2.3.1 Copper uptake and translate
2.3.1.1 Copper uptake
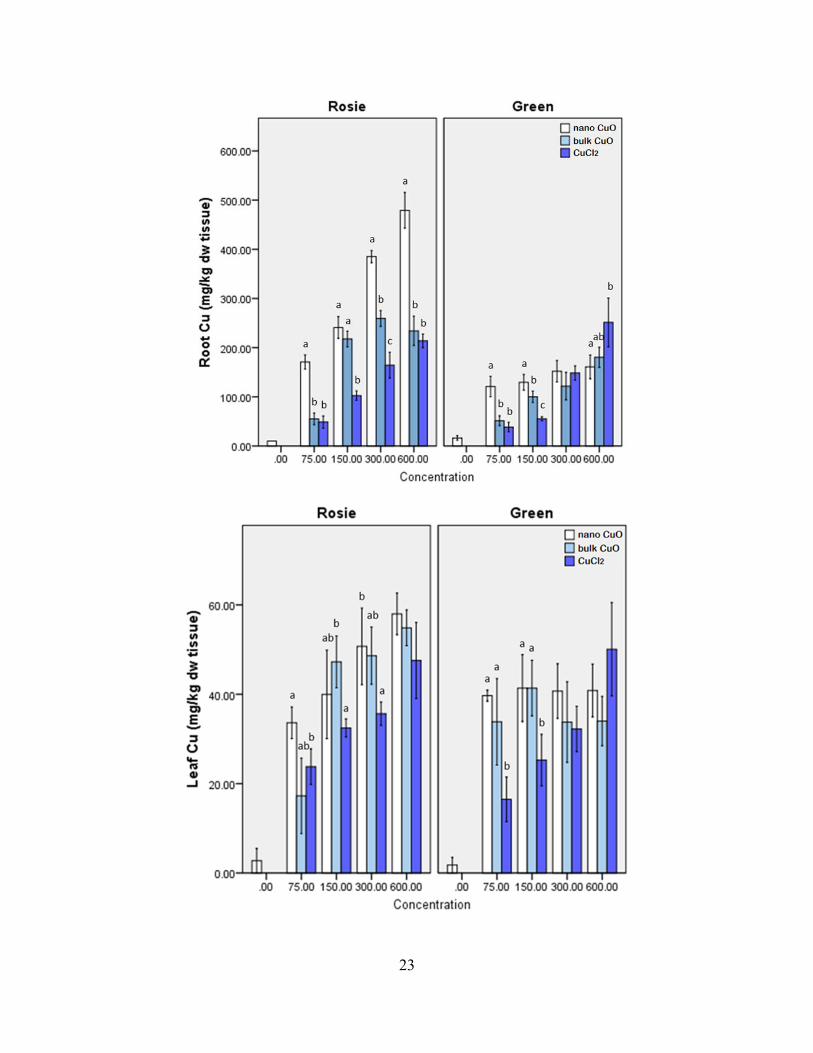
The result of Cu uptake from bok choy roots grown 70 days in soil amended with
nCuO, bCuO, CuCl2 are shown in Table 2.3. The experimental soil had 17.34 ± 0.53 mg of total
natural Cu per kg soil. The tests of normality did not show outliers in the data, as assessed by
inspection of the boxplot. All the data of Cu uptake were normally distributed (p > 0.05), as
assessed by Shapiro-Wilk's test of normality.
The three-way ANOVA (Fig S1) displays significant simple-simple main effects of plant
types, Cu based compounds and exposed concentrations, in addition to the interactions of plant
types × Cu based compounds, plant types × exposed concentrations, and Cu based
compounds × exposed concentrations. Additionally, statistically significant three-way
interactions between plant type × copper compound × concentration (p ≤0 .05) were also found.
All the data presented in Table 2.3 is from the SPSS analysis. As expected, all Cu based
treatments significantly increased the uptake Cu in both varieties, compared with each control. At
all concentrations except at 75 mg/kg, CuCl2 increased the root Cu uptake significantly in green
bok choy.
1. Comparison between Cu based compounds
In both rosie and green bok choy, a simple two-way ANOVA demonstrated a statistically
significant two-way interaction between compounds and concentrations, p < 0.05. So, the effect
of compounds on root Cu uptake by bok choy plants depended on concentrations. In other words,
concentration moderated the effect of compounds on root Cu uptake of bok choy plants.
In Rosie bok choy, Cu uptake in nCuO and bCuO treated plants were significantly different
at all concentrations from the control except at 150mg/kg. At 75, 300, 600 mg/kg, Cu uptake by
Rosie root was 73.61, 33.50, 52.23% lower than nano CuO, at the same treatment concentrations.

21
While for the Green bok choy, Cu accumulation in roots treated with 75 mg/kg bCuO was 70.86%
less than nCuO at the same treatment concentration.
In both Rosie and Green bok choy, Cu uptake in nCuO and CuCl2 treated plants were
examined to be significantly different at all exposed concentrations. In Rosie bok choy at 75, 150,
300, 600 mg/kg, Cu uptake in CuCl2 treated Rosie root was 77.34, 59.93, 58.86, 56.58% lower
than nCuO, respectively. While in the green bok choy, CuCl2 treated plants had less Cu in tissue
at 75 (81.56%), 150 (65.48%), 300 (2.67%) mg/k, and more Cu at 600 (62.63%) mg/kg compared
to nano CuO treated plants.
2. Comparison between exposed concentrations
Except for the main effect of compounds, plants treated with different concentrations
displayed a statistically significant simple simple main effect on root Cu uptake by bok choy plants
exposed with a certain compound. Fig 2.1 shows that for all the compounds, the Cu uptake in roots
by both Rosie and Green bok choy roots were significantly increased with respect to control.
Under the exposure of nano CuO, the Cu accumulation in root was increased significantly
at 75 (15.97 times), 150 (22.95 times), 300 (37.27 times), 600 (46.63 times) mg/kg compared with
control in Rosie bok choy, while at 75 (6.45 times), 150 (6.98 times), 300 (8.36 times), 600 (8.90
times) in the Green bok choy.
Table 2.3 shows that for CuCl2, changes in concentration had a statistically significant
effect on root Cu uptake at all exposed levels in both Rosie and Green bok choy, except for 75 and
150mg/kg in Green. Which means the Cu uptake in root at different additional concentrations were
statistically different from each other.
The different amount of Cu uptake in bok choy root between nano CuO and bulk CuO
treatments could be due to the size effect. It has been evaluated that smaller size would benefit and
22
promote the process of the penetration of CuO particles into the root cells and then be translocated
to shoots (Mukherje et al., 2016). Moreover, it may be a size-dependent effect by anthocyanin on
the uptake of Cu by Rosie bok choy roots. With lower content of anthocyanin, the size-dependent
effect of Cu uptake by Green bok choy roots was not as obvious as in the Rosie plants, indicating
the role that anthocyanin played in the Cu uptake process related to the Cu based particle sizes.
Similar results were reported by Rawat et al. (2018) that nano CuO, bulk CuO and CuCl2
significantly increased the root Cu accumulation by 196%, 184%, and 184% respectively with
respect to control. Moreover, higher uptake of nano CuO compared with ionic Cu compounds was
also detected. Trujillo-Reyes et al. examined Cu compounds in treated lettuce at concentrations of
0, 10, 20 mg/L with Hoagland’s nutrient solution for 15 days. They found more Cu accumulation
from NPs than ionic Cu treatment.
It has been reported before that the uptake of Cu in plants was species-dependent (Hong et
al., 2015; Tan et al., 2018). The root to shoot Cu translocation was also demonstrated. Apodaca et
al. (2017) mentioned the Cu content of bean seeds was enhanced by 5–10% compared with
control by nano CuO and bulk CuO treatments, and root Cu content was at least 10-fold higher,
compared to other tissues. Du et al. discovered that both nano CuO and bulk CuO increased root
Cu (28.4–116.0%) and shoot Cu (83.0–163.0% and 225.4–652.5%), compared with the
control. Copper accumulation from bulk CuO also increased as the concentration of bulk CuO in
soil increased. Moreover, Hong et al. indicated that all Cu based compounds increased Cu uptake
over 100% in alfalfa shoots.
23

24
Figure 2.1 Cu content in leaves and roots of both bok choy plants (70 days) cultivated in soil
spiked with 0, 75, 150, 300 and 600 mg/kg of nCuO, bCuO, and CuCl2. Data are means of three
replicates ± SE (n = 3). Different letters represent statistically significant differences within the
same Cu-treatment concentration at (p ≤ 0.05).

25
Table 2.3 Cu content in leaves and roots of both bok choy plants (harvested at 70 days) cultivated
in soil spiked with 0, 75, 150, 300 and 600 mg/kg of nCuO, bCuO, and CuCl2. Data are means of
three replicates ± SE (n = 3). Different letters represent statistically significant differences within
the same Cu compounds type at (p ≤ 0.05).
Particle Plant Concentration Cu in Leaves Cu in Roots
Control Rosie 0 2.773 ± 1.359 a 10.061 ± 0.008 a
Nano CuO 75 33.620 ± 1.774 b 170.710 ± 7.316 b
Nano CuO 150 39.968 ± 4.952 bc 240.970 ± 11.093 c
Nano CuO 300 50.717 ± 4.281 cd 385.077 ± 6.246 d
Nano CuO 600 57.992 ± 2.329 d 479.216 ± 18.252 e
Bulk CuO 75 17.257 ± 4.225 b 55.106 ± 5.970 b
Bulk CuO 150 47.244 ± 2.900 c 217.532 ± 8.082 c
Bulk CuO 300 48.625 ± 3.207 c 259.463 ± 8.091 d
Bulk CuO 600 54.869 ± 2.002 c 234.159 ± 14.996 cd
CuCl2 75 23.793 ± 1.997 b 48.746 ± 6.287 a
CuCl2 150 32.453 ± 1.019 b 102.582 ± 4.743 b
CuCl2 300 35.647 ± 1.310 bc 164.358 ± 13.166 c
CuCl2 600 47.556 ± 4.257 c 213.791 ± 6.953 d
Control Green 0 1.782 ± 0.858 a 16.236 ± 2.417 a
Nano CuO 75 39.688 ± 0.627 b 120.914 ± 10.416 b
Nano CuO 150 41.369 ± 3.751 b 129.554 ± 8.079 bc
Nano CuO 300 40.709 ± 3.064 b 152.048 ± 10.956 bc
Nano CuO 600 40.854 ± 2.951 b 160.773 ± 12.173 c
Bulk CuO 75 33.847 ± 4.844 b 51.469 ± 5.088 a
Bulk CuO 150 41.378 ± 3.111 b 100.064 ± 5.817 b
Bulk CuO 300 33.777 ± 4.517 b 121.804 ± 14.081 b
Bulk CuO 600 33.987 ± 2.768 b 180.316 ± 10.266 c
CuCl2 75 16.486 ± 2.497 b 38.537 ± 4.8513 a
CuCl2 150 25.272 ± 2.892 bc 55.358 ± 2.067 a
CuCl2 300 32.230 ± 2.548 c 148.428 ± 7.276 b
CuCl2 600 50.083 ± 5.238 d 251.295 ± 24.808 c

26
2.3.1.2 Copper translocation to leaves from roots
The presence of nano CuO in bok choy leaves was demonstrated by Two-photon
Microscopy (Illustrations 2.2, Illustrations 2.3, Illustrations 2.4). The accumulation of Cu in leaves
of both Rosie and Green bok choy are shown in Table 2.3 and Fig 2.1.
All three Cu based compounds significantly increased the Cu accumulation in leaves of
both Rosie and Green bok choy at all concentrations. For Rosie bok choy, the increases were
concentration dependent. In Rosie bok choy leaves, all Cu based compounds significantly
increased Cu uptake at 75, 150, 300, 600 mg/kg by 11.12, 13.40, 17.28, 19.91 (nano CuO), 5.22,
16.03, 16.53, 18.78 (bulk CuO), and 7.58, 10.70, 11.85, 16.14 (ionic CuCl2) times higher than the
control, respectively. For Green bok choy, increase in Cu found in leaves were 18.00-22.21 times
higher for nano CuO, 17.95-22.22 times higher for bulk CuO, and 8.25-27.10 times higher for
CuCl2 with respect to each control.
Nano CuO and bulk CuO had no significant differences in the accumulation of Cu in of
both Rosie and Green bok choy. The only exception was found at 75mg/kg with Rosie bok choy,
where bulk CuO resulted in lower leaf Cu (48.67%) than the nano CuO. Similar results were
collected between nano CuO and ion CuCl2. Only at low treated concentration (75 and 150 mg/kg)
with Green bok choy, the responses of nano CuO and ion CuCl2 were significantly different, where
CuCl2 treated plant leaves accumulated 58.46% and 38.91% less Cu than the nano CuO treated
plants.
Wang et al. (2012) reported that nCuO in maize (Zea mays L.) could be translocated from
roots to shoots via the xylem. The greatest overall concentration of Cu was found in the roots. This
is due to density of Cu, which renders it sparingly mobile in plants and causes the greatest
accumulation to occur in the roots (Adrees et al., 2015).

27
Figure 2.2 Cu Translocation rate in leaves and roots of both bok choy plants (70 days) cultivated
in soil spiked with 0, 75, 150, 300 and 600 mg/kg of nCuO, bCuO, and CuCl2. Data are means of
three replicates ± SE (n = 3). Different letters represent statistically significant differences within
the same Cu-treatment concentration at (p ≤ 0.05).
28
Illustrations 2.2 nCuO and bCuO particles in Two-photon microscopy

29

30
Illustrations 2.3 Rosie bok choy control and treat with nCuO, bCuO particles

31
Illustrations 2.4 Green bok choy control and treat with nCuO, bCuO particles
32
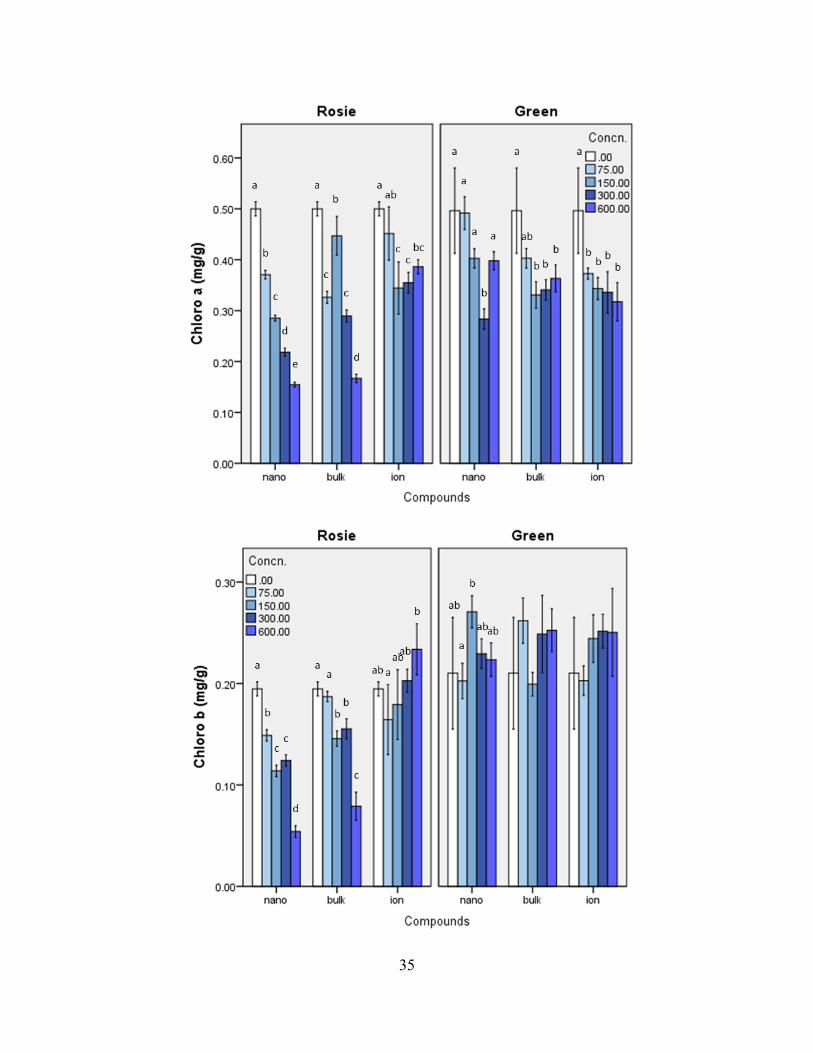
2.3.2 Chlorophyll content
All Cu based compounds exerted harmful effect on leaf chlorophyll a content.
For Rosie bok choy, nano CuO treated plants had significantly lower chlorophyll a at all
exposed concentrations: 75 (25.80%), 150 (43.00%), 300 (56.40%), 600 (69.00%) mg/kg,
compared with the control. Bulk CuO decreased chlorophyll a content significantly at 75 (34.80%),
300 (42.00%), 600 (66.60%) mg/kg compared with the control. Meanwhile, CuCl2 significantly
caused less chlorophyll a content at 150 (31.20%), 300 (29.00%), 600 (22.80%) mg/kg, compared
with the control.
At the highest (600 mg/kg) and lowest (75 mg/kg) concentrations, the responses caused by
nano CuO and bulk CuO had no significant difference. Whereas, at 150 and 300 mg/kg, bok choy
treated with bulk CuO had lower chlorophyll a than nano CuO by 56.84% and 33.03%,
respectively. The harmful effect caused by CuCl2 were significantly different with nano and bulk
CuO at all concentrations. According to Fig 2.3, less toxic effect was caused by ion CuCl2 than
nano and bulk CuO. (Which could be interpreted by the data to root Cu uptake). And among the
three Cu based compounds, nano CuO treated bok choy had the lowest chlorophyll a content,
which were nearly linear along with the treated concentrations.
For Green bok choy, all the compounds decreased the chlorophyll a content in plant leaf
significantly. Bok choy exposed to nano CuO showed less chlorophyll a content at 75, 150, 300,
600 mg/kg by 10.08%, 18.95%, 42.94%, 19.76%, respectively compared with control. While the
decrease was 18.95%, 33.47%, 31.45%, 26.81% with bulk CuO, and 25.00%, 30.85%, 32.46%,
36.09% with CuCl2, compared with control respectively.
Nano CuO caused significantly different response of chlorophyll a than bulk CuO and
CuCl2 at all concentrations. Bulk CuO and CuCl2 showed higher chlorophyll a by 18.13% (75

33
mg/kg), 17.91% (150 mg/kg), 8.79% (600 mg/kg), and 24.24% (75 mg/kg), 14.68% (150 mg/kg),
20.35% (600 mg/kg), respectively, compared with nano CuO treatments respectively, while with
lower Cu by 20.14% (300 mg/kg) and 18.37% (300 mg/kg) respectively compared with control.
There was no statistically significant difference between bulk CuO and CuCl2 at 75 and 150 mg/kg,
except for the higher concentrations (300 and 600 mg/kg). CuCl2 showed the most toxic effect,
while nano CuO was the least one.
Although Cu was considered an essential element related to the transmitting of electrons
and activity of plastocyanin as well as cytochrome-c oxidase (Clemens., 2001; Savini et al., 1990),
but at high accumulated concentrations, it would be toxic to the plants’ photosynthesis process,
inhibited the synthesis of protochlorophyllide reductase and decreased the activity of related
enzymes. This conclusion was demonstrated by several researchers (J.Trujillo-Reyes et al., 2013;
Saglam et al., 2016). Chlorophyll content was decreased by bCuO at 20 mg/kg reported by
Zuverza-Mena et al (2015). Shi et al. (2011) (nCuO at 1 mg/L) and Lalau et al. (2015) (nCuO at
0.1, 1, and 10 g/L) found similar results with the decline of chlorophyll of duckweed (Landoltia
punctata). Nair et al. (2014) also discovered that mung bean chlorophyll reduced after nano CuO
treatments at 100, 200, 500 mg/L for 21 days. Other studies also demonstrated that nCuO could
affect chlorophyll in plants. (O. Dimkpa et al., 2012; Gopalakrishnan et al., 2014; Kumar et al.,
2014; Nair et al., 2015; Shaw et al., 2013; Trujillo-Reyes et al., 2014). The released Cu2+ could be
one of the reasons. It has been reported that Cu2+ could inhibit the reactions of chloroplast and
changing the essential factor of the energy-transfer mechanism by affecting electron transport
(Uribe, 1982). Similar to chlorophyll a, all the exposure of Cu based compounds decreased the
chlorophyll b content in the leaves of both Rosie and Green bok choy.
For Rosie bok choy, nano CuO decreased chlorophyll b content at all experimental
concentrations by 23.59% (75 mg/kg), 41.54% (150 mg/kg), 35.90% (300 mg/kg) and 72.31%
(600 mg/kg) compared with control. Whereas for bulk CuO and CuCl2, the only significant
difference was found at 600 mg/kg with bulk CuO, where the mean value is 0.079 (59.49%

34
compared with control). All Cu based compounds decreased chlorophyll b content from control
by the range of 23.59%-72.31% with nano CuO, 4.10%-59.49% with bulk CuO, and 4.10%-
20.00% with CuCl2.
The significant difference between nano and bulk CuO only occurred at 75 mg/kg, the
lowest concentration. (more Cu uptake did not affect the response of plant on chlorophyll b). On
the other hand, nano CuO were demonstrated to cause significant different response compared
with CuCl2 at almost all concentrations (except for 75 mg/kg). Plants with CuCl2 had higher
chlorophyll b at 150 (20.70%), 300 (62.84%) and 600 (149.03%), compared with nano CuO.
For the Green bok choy, only nano CuO at 150 mg/kg caused a significant different
response (29.05%), compared with control. The significant difference between compounds were
only detected at low concentrations (75 and 150 mg/kg), where bulk CuO treated plants had lower
chlorophyll b than nano CuO (by 18.13% and 17.91% respectively) and CuCl2 (by 8.06% and %
respectively).
35

36
Figure 2.3 Chlorophyll a and b content in leaves of both bok choy plants (70 days) cultivated in
soil spiked with 0, 75, 150, 300 and 600 mg/kg of nCuO, bCuO, and CuCl2. Data are means of
three replicates ± SE (n = 3). Different letters represent statistically significant differences within
the same Cu-treatment compounds at (p ≤ 0.05).
2.3.3 The inhibition of bok choy growth
2.3.3.1 Leaf dry weight
All types of exposure inhibited the growth of Rosie and Green bok choy, including the
lowest concentration. And 20 of the total 24 responses were significantly different, compared with
each control (exceptions come only with Green bok choy).
For the Rosie bok choy, all Cu based compounds decrease the dry weight of plants
significantly at all treated concentrations, compared with control. The inhibition with nano CuO
was 26.21% (75 mg/kg), 29.26% (150 mg/kg), 32.79% (300 mg/kg) and 68.42% (600 mg/kg),
compared with control. For bulk and CuCl2, the decrease was 5.07% and 20.52% (75 mg/kg),
27.40% and 51.81% (150 mg/kg), 50.94% and 67.19% (300 mg/kg), 77.23% and 63.22% (600
mg/kg), respectively compared with control.
There was a significant difference between nano CuO and CuCl2 treated Rosie bok choy at
150 and 300 mg/kg, where the dry weight was 31.87% and 51.18% lower with CuCl2, compared
with nano CuO, respectively. CuCl2 treated plants had significantly lower dry weight, compared
with bulk CuO by 16.27% (75 mg/kg), 33.12% (300 mg/kg) and more Cu by 61.54% at 600 mg/kg.
For Green bok choy, nano CuO decreased plant dry weight significantly compared with
control at 75 (28.59%), 150 (15.63%), 300 (34.18%) and 600 (31.85%). similarly, the significant
decrease caused by bulk CuO was 24.08%, 22.53%, 34.22% and 19.23%, respectively, compared
with control. There was no significant difference of dry weight between nano CuO and bulk CuO
37
treatments at any concentrations. CuCl2 exposure only caused significant difference at high
concentrations (300 and 600 mg/kg), where the dry weight was reduced by 34.09% and 50.70%
respectively compared with control. At the highest concentration (600 mg/kg), CuCl2 was the most
poisonous one among the three compounds. It initiated lower dry weight by 27.65% of nano CuO
and 38.96% of bulk CuO at the same concentration.
The reduction in biomass could be related to the releasing of Cu2+ and particle size induced
toxicity. In the literature, Le Van et al. (2016) reported that after nano CuO exposure at 200, 1000
mg/L, transgenic cotton and conventional cotton growth in basic nutrient solution were
significantly diminished. Wang et al. (2012) found inhibition of corn seedling hydroponic growth
at 2, 5, 10, 20, 30, 40, 50, 100 mg/L nano CuO. Musante and White (2012) also found squash
growth and transpiration reduced by 60-70% (same bulk and nano Cu) at concentration of 100,
500 mg/L. Shaw and Hossain (2013) demonstrated at 40, 80, 120 mg/L, nano CuO decreased root
and shoot growth, weight and germination yield of rice in aqueous media. Shaw et al. (2014)
mentioned the decrease in shoot and root growth of Barley at 40, 80, 120 mg/L after seeds exposed
to NPs suspensions. Dimkpa et al. (2015) reported growth inhibition of bean by 100, 250, 500 ppm
CuO NPs mixed with sand. Dimkpa et al. (2012) discovered wheat growth inhibition (roots and
shoots) at 500 mg/kg nano CuO mended with sand. Trujillo-Reyes et al. (2014) reported that dry
biomass, water content and seedlings’ growth of lettuce were impaired at 10, 20 mg/L in
Hoagland’s nutrient solution.

38
Figure 2.4 Dry weight in leaves of both bok choy plants (70 days) cultivated in soil spiked with 0,
75, 150, 300 and 600 mg/kg of nCuO, bCuO, and CuCl2. Data are means of three replicates ± SE
(n = 3). Different letters represent statistically significant differences within the same Cu-treatment
compounds at (p ≤ 0.05).
2.3.3.2 Leaf fresh Weight
Since leaf is the main edible part of bok choy plant, leaf fresh weight is among the most
essential variables. All treatments with Cu based compounds declined the fresh weight of both
Rosie and Green bok choy at all concentrations (75-600 mg/kg) significantly, compared with
control.
39
For Rosie bok choy, the fresh weight exposed with nano CuO were 25.50% (75 mg/kg),
85.33% (150 mg/kg), 50.84% (300 mg/kg) and 51.74% (600 mg/kg), significantly less than the
control. Bulk CuO and CuCl2 also reduced plant fresh weight significantly at all concentrations,
by the rage of 4.73% - 90.23% and 19.83% - 83.29%, respectively, compared with control.
The response of leaf fresh weight among the three Cu based compounds was significantly
different at 150, 300, 600 mg/kg. For both nano CuO and CuCl2, leaf dry weight was increased by
the exposure from 150 to 300 mg/kg, and then decrease from 300 to 600 mg/kg. The trend of bulk
CuO treated plants were on the opposite.
For Green bok choy, all the three compounds caused significant weight decrease at all
exposed concentrations with the range of 16.57%-30.33% (nano CuO), 10.65%-31.09% (bulk
CuO) and 4.56%-57.67% (CuCl2), compared with control.
There were no significant differences between nano CuO and bulk CuO treated plants,
except for the concentration of 150 mg/kg. CuCl2 exposed Green bok choy had significant different
fresh weight than nano and bulk CuO at all concentrations (except for the one between CuCl2 and
bulk CuO at 150 mg/kg).
Similar results were reported by Thounaojam el at. (2012) who treated rice with CuCl2 (0,
10, 50 and 100 mM) for 5 days in hydroponic conditions. The growth of rice was decreased along
with the increasing level of Cu treatments. (Wu et al., 2012) CuO NPs (100–2000 mg/L) showed
harmful effect on seed germination and root elongation of lettuce, radish, and cucumber.
(J. Trujillo-Reyes et al., 2014). Root length and dry biomass of lettuce were reported to reduce
after the exposure to 10 - 20 mg/L nano CuO by hydroponic method. Zuverza-Mena et al. (2015)
state that nCuO, bulk CuO and copper chloride (CuCl2) at 20 and 80 mg/kg inhibited the
germination of cilantro (Coriandrum sativum). Shi et al. (2011) and Lalau et al. (2015) reported
the growth of duckweed (Landoltia punctata) was inhibited by nCuO at 1 mg/L and 0.1, 1, and 10
g/L respectively compared with control. Du (2018) states that, compared with nano CuO, bulk
40
CuO showed more inhibiting effects on oregano root growth. Du also found both nano CuO and
bulk CuO reduce oregano shoot biomass by 21.6–58.5%, with respect to control. In addition, at
50 mg/kg, bulk CuO decreased oregano root biomass and length (48.6% and 20.5%, respectively).
Hong et al. (2015) reported all Cu NPs/compounds reduced the root length by 49% in alfalfa and
lettuce plants and reduced the sizes. Nair and Chung (2015) found the reduce of shoot growth and
root shortening of Mustard treated after 20, 50, 100, 200, 400, 500 mg/L nano CuO for 14 days.
Moreover, they also found plant biomass reduction, root growth retardation of Arabidopsis 0.5, 1,
2, 5, 10, 20, 50, 100 mg/L nano CuO grew for 21 days. In another study, Nair and Chung (2014)
assert that 50, 100, 200, 400, 500 mg/L nano CuO diminished fresh weight and root size of soybean
grew for 14 days. Agar. Nair et al. (2014) reported that mung bean root length and biomass was
reduced at all concentrations 20, 50, 100, 200, 500 mg/L by nano CuO particles. Bulk CuO has
generally been considered to have harmful effects on the weight of plant tissues (Atha et al., 2012;
Nair et al., 2014; Trujillo-Reyes et al., 2014).

41
Figure 2.5 Weight in leaves of both bok choy plants (70 days) cultivated in soil spiked with 0, 75,
150, 300 and 600 mg/kg of nCuO, bCuO, and CuCl2. Data are means of three replicates ± SE (n =
3). Different letters represent statistically significant differences within the same Cu-treatment
compounds at (p ≤ 0.05).
2.3.3.3 Height
Height is one of the main factors that would affect the overall yield of the plants. Same as
weight, all Cu based compounds significantly reduced plant height of both Rosie and Green bok
choy at all exposed concentrations, compared with the control.
For Rosie bok choy, plant weight decreased along with the increase of exposed compound
concentrations. Plants’ height with nano CuO declined by 27.51% (75 mg/kg), 29.26% (150
mg/kg), 32.75% (300 mg/kg) and 57.21% (600 mg/kg), compared with control. Meanwhile, bulk

42
CuO and CuCl2 also caused lower height by 6.77% and 15.72% (75 mg/kg), 25.00% and 49.02%
(150 mg/kg), 41.81% and 55.90% (300 mg/kg) and 55.13% and 62.01% (600 mg/kg), compared
with control.
The plant height showed no significant difference when comparing nano CuO with bulk
CuO treatments at all concentrations, except for 75 mg/kg. At 75mg/kg, nano CuO treatment had
% lower height than bulk CuO.
For Green bok choy, nano CuO, bulk CuO and CuCl2 significantly reduced the height of
plants by the range of 9.01%-29.66%, 12.02%-28.04% and 3.13%-43.68%, compared with control.
There was no significant difference between nano and bulk treatments at any exposed
concentrations. Higher concentrations generated more harmful effect on the height of plants.
Similarly, mung bean, zucchini and wheat were studied and showed the same results. Lee
et al. (2018) detected that nCuO reduced wheat root at 200 mg/L and wheat shoot at 800 mg/L. In
another study, length of root and shoot in radish seedlings were reduced by 10 mg nCuO/L by 46%
and 4%, respectively. Moreover, 1000 mg nCuO/L declined radish root and shoot by 97% and
79%, with respect to control (Wu et al., 2012).

43
Figure 2.6 Height in leaves of both bok choy plants (70 days) cultivated in soil spiked with 0, 75,
150, 300 and 600 mg/kg of nCuO, bCuO, and CuCl2. Data are means of three replicates ± SE (n =
3). Different letters represent statistically significant differences within the same Cu-treatment
compounds at (p ≤ 0.05).
2.3.3.4 Foliar area
Another evidence of the inhibition of all the Cu based compounds to the growth of both
Rosie and Green bok choy is the significant decrease of foliar area, compared with each control
along with the increased exposure concentrations.
For Rosie bok choy, nano CuO treated plants had significantly lower foliar area by 31.73%
(75 mg/kg), 33.32% (150 mg/kg), 32.73% (300 mg/kg) and 76.95% (600 mg/kg) than control.
44
While the decline of bulk CuO treatments were 11.69%, 21.15%, 38.50% and 81.01% respectively.
Plants height exposed with CuCl2 decreased almost linearly with the increasing concentration by
7.92%, 34.50%, 51.48% and 70.96%, respectively, compared with control.
Nano CuO and bulk CuO showed significantly different influence on height only at low
concentrations (75 and 150 mg/kg), where bulk CuO related height were 29.37% and 18.24%
higher than nano CuO. While the responses generated by CuCl2 and bulk CuO were significantly
different except for 75 mg/kg.
For Green bok choy, nano and bulk CuO decreased the height of plants by the range of
9.64% - 27.52% and 8.02% - 23.88%, compared with control without any significance. Plant
height with CuCl2 significantly dropped by 6.30% (75 mg/kg), 24.03% (150 mg/kg), 28.59% (300
mg/kg) and 52.72% (600 mg/kg), compared with control. No significant difference was observed
between nano and bulk treatments at any exposed concentrations.

45
Figure 2.7 Foliar area of both bok choy plants (70 days) cultivated in soil spiked with 0, 75, 150,
300 and 600 mg/kg of nCuO, bCuO, and CuCl2. Data are means of three replicates ± SE (n = 3).
Different letters represent statistically significant differences within the same Cu-treatment
compounds at (p ≤ 0.05).

46
Table 2.4 Fresh/dry weight, Height and Foliar area of bok choy plants (70 days) grown in soil
treated with 0, 75, 150, 300 and 600 mg/kg of nCuO, bCuO, and CuCl2. Data are means of three
replicates ± SE (n = 3). Different letters represent statistically significant differences within the
same Cu-treatment concentration at (p ≤ 0.05).
Particle Plant Concentration Dry Weight Weight Height Foliar area
Control Rosie 0 21.509 ± 1.189 306.266 ± 16.721 30.533 ± 1.596 2940.053 ± 137.564
Nano CuO 75 15.871 ± 0.403 a 228.167 ± 5.668 22.133 ± 1.087 a 2007.070 ± 72.933 a
Bulk CuO 75 20.417 ± 0.236 b 216.900 ± 11.026 28.467 ± 0.367 b 2596.447 ± 39.359 b
CuCl2 75 17.096 ± 0.937 a 206.967 ± 7.425 25.733 ± 1.991 b 2707.243 ± 169.585 b
Nano CuO 150 15.215 ± 0.767 a 44.933 ± 4.215 a 21.600 ± 1.537 ab 1960.567 ± 134.467 a
Bulk CuO 150 15.616 ± 0.572 a 291.767 ± 3.453 b 22.900 ± 0.954 b 2318.197 ± 79.538 b
CuCl2 150 10.366 ± 0.679 b 223.733 ± 8.111 c 15.567 ± 1.398 c 1925.703 ± 74.076 a
Nano CuO 300 14.458 ± 0.519 a 150.567 ± 4.705 a 20.533 ± 0.549 ab 1977.647 ± 55.763 a
Bulk CuO 300 10.553 ± 0.329 b 29.933 ± 1.981 b 17.767 ± 0.644 a 1808.213 ± 57.415 a
CuCl2 300 7.058 ± 0.438 c 245.533 ± 14.578 c 13.467 ± 0.726 c 1426.623 ± 87.284 b
Nano CuO 600 6.792 ± 0.594 ab 147.800 ± 9.786 a 13.067 ± 0.809 677.777 ± 63.5770 ab
Bulk CuO 600 4.898 ± 0.238 a 101.033 ± 6.179 b 13.700 ± 0.529 558.393 ± 35.464 a
CuCl2 600 7.912 ± 0.686 b 51.167 ± 5.053 c 11.600 ± 0.872 853.693 ± 84.026 b
Control Green 0 16.917 ± 0.684 260.100 ± 10.333 26.633 ± 1.338 2623.040 ± 103.875
Nano CuO 75 12.082 ± 1.276 a 217.000 ± 4.739 a 21.767 ± 0.333 a 2370.277 ± 32.664
Bulk CuO 75 12.844 ± 0.978 ab 232.400 ± 5.384 a 22.700 ± 1.562 ab 2412.590 ± 102.462
CuCl2 75 15.179 ± 1.197 b 175.900 ± 4.251 b 25.800 ± 0.666 b 2457.783 ± 46.942
Nano CuO 150 14.273 ± 0.411 181.200 ± 6.620 a 24.233 ± 0.410 2297.777 ± 92.978 a
Bulk CuO 150 13.105 ± 0.638 217.900 ± 17.331 b 23.433 ± 0.481 2395.680 ± 81.850 a
CuCl2 150 13.919 ± 0.822 224.500 ± 6.270 b 21.433 ± 0.606 1992.723 ± 43.785 b
Nano CuO 300 11.135 ± 0.556 196.033 ± 3.129 a 18.733 ± 0.913 2014.683 ± 31.308 ab
Bulk CuO 300 11.128 ± 0.800 179.700 ± 3.816 a 21.233 ± 0.267 2241.483 ± 84.564 a
CuCl2 300 11.151 ± 0.899 248.233 ± 4.524 b 19.967 ± 0.584 1872.990 ± 33.651 b
Nano CuO 600 11.528 ± 0.321 a 207.800 ± 2.495 a 18.733 ± 0.393 a 1901.193 ± 43.589 a
Bulk CuO 600 13.665 ± 1.055 a 179.233 ± 5.190 b 19.167 ± 0.601 a 1996.547 ± 16.483 a
CuCl2 600 8.341 ± 1.497 b 110.100 ± 5.950 c 15.000 ± 0.252 b 1240.243 ± 89.200 b

47
2.3.4 Elements accumulation
Several literatures report that nano CuO could alter the accumulation of plants micro and
macro elements contents due to the disturbing of metabolism and the changing of gene expression.
Besides, nano CuO may block the channel of the uptake and translate of other elements from plant
roots to shoots. Moverover, the responses were species-dependent (Hong et al,, 2015; Tan et al.,
2018).
The concentration of the accumulation of each element including: Al, Ca, Fe, K, Mg, Mn,
Ni, P, Pb, S, Zn was showed in Table S1.
2.3.4.1 Elements translate to leaves
K: The alteration of K uptake in bok choy leaf was dependent on different types and parts of bok
choy plants. In the leaf of Rosie bok choy, nano CuO decreased the content of K at all
concentration, with the only significance at 150 mg/kg, where K was reduced by 45%, with respect
to the control. On the other hand, nano CuO increased K uptake in Rosie bok choy root at all
exposed concentrations. At the highest concentration (600mg/kg), K accumulation was 48% lower
significantly, compared with control.
While in Green bok choy, the accumulation of K was altered by nano CuO on the opposite
way with respect to the Rosie one. In Green bok choy leaf, at all concentrations nano CuO
increased K content.
Al: In Rosie bok choy leaf, Cu based compounds did not alter the uptake of Al. The only two
exceptions were below: nano CuO at 150 mg/kg and CuCl2 at 300 mg/kg increased Al
accumulation by 59% and 83%, respectively, compared with control.

48
Green bok choy leaf treated with all Cu based compounds, at all concentrations, had higher
Al uptake, with respect to control. At 75, 300, 600 mg/kg, nano CuO treatments caused
significantly higher Al accumulation by 82%, 102% and 105%, respectively. Meanwhile, bulk
CuO at 75 mg/kg significantly increased Al uptake by 118% with respect to control.
Ni: Nearly all Cu based compounds at all concentration increased Ni accumulation in leaves of
Rosie bok choy; on the other hand, all Cu based compounds decreased leaf Ni uptake at all
concentrations in Green bok choy but without any significance.
For Rosie bok choy at 150 mg/kg, nano CuO treated Al content was significantly higher
than control by 59%. CuCl2 at 75, 150, 300 mg/kg significantly increased Al uptake by the range
of 68-72%.
Zn: All Cu based compounds decreased leaf Zn accumulation at all treated concentrations with
both Rosie and Green bok choy.
For Rosie bok choy, nano CuO treatments had significantly lower leaf Zn content at 150
and 300 mg/kg by 21% with respect to control. The significant decrease by bulk CuO and CuCl2
were 26% - 31% and 23% - 21% respectively at 150 and 600 mg/kg, compared to control.
For Green bok choy, at 600 mg/kg, Zn uptake was significantly reduced by 25% (nano
CuO), 37% (bulk CuO) and 23% (CuCl2), with respect to control. At 300 mg/kg, nano CuO and
CuCl2 significantly decreased leaf Zn content by 23% and 21%, respectively, compared with
control.
Similarly, Rawat et al. (2018) mentioned the reduce of Zn by 55% in leaves and 47% in
fruits of bell pepper plants, with respect to control.

49
2.3.4.2 Elements accumulation in roots
2.3.4.2.1 Positively charged elements
Since all of the Cu based compounds had Cu2+ dissolution in the soil, which compete with those
positively charged elements when uptook by the plant roots (Rawat el at., 2018). Root content of
K, Al, Fe, Ni were analyzed to be declined by Cu based compounds.
K: In the Green bok choy root, at 600 mg/kg, K uptake was significantly lower by 41%,
compared with control. While no obvious alteration was found in Rosie bok choy.
Al: In Rosie bok choy root, no obvious alteration of Al accumulation was found after the
exposure with all Cu based compounds. Only bulk CuO at 600 mg/kg, CuCl2 at 75 and 600 mg/kg
decreased the Al content by 36%, 26% and 52%, respectively, compared with control.
While for Green bok choy root, all Cu based compounds at all concentrations reduced the
uptake of Al. Specifically, nano CuO at 150, 300, 600 mg/kg significantly decreased Al uptake by
the range of 38-41%. Meanwhile, 300 and 600 mg/kg bulk CuO treated plant root had significantly
lower Al by 39% and 35%, respectively, compared with control. Analogously, CuCl2 at 150, 300,
600 mg/kg significantly reduced Al accumulation in Green bok choy root by the range of 18-39%,
with respect to the control.
Fe: In root of Rosie bok choy, bulk CuO at 75 mg/kg, CuCl2 at 75 and 600 mg/kg, decreased
Fe accumulation by 30%, 18% and 50%, respectively, compared with control.
Meanwhile in the root of Green bok choy, nano CuO and CuCl2 reduced Fe uptake at all
concentrations. Specifically, Fe uptake were significantly decreased by nano CuO by the range of

50
24-31% (150, 300, 600 mg/kg), and CuCl2 by 28% (150 and 600 mg/kg), with the respect to
control. At 600 mg/kg, bulk CuO also reduced Fe content significantly by 32%, compared to
control.
Apodaca et al. (2017) found that nano CuO treated bean seeds had significantly lower Fe
content by ~29% compared with control. Ochoa et al. (2017) reported that leaf Fe of bean plant
was decreased by nano CuO exposures. Hong et al. (2015) reported that all Cu based compounds
decreased Fe accumulation in lettuce shoots over 50% compared with control.
Ni: In the root of both Rosie and Green bok choy, Ni uptake were reduced by all types of
compounds at all concentrations. CuCl2 at all exposed concentrations significantly decreased Ni
content by 35-60%, with respect to the control. Bulk CuO exposed at 75, 300,600 mg/kg
significantly reduced Ni uptake by 65%, 45% and 38%, respectively, compared with control.
2.3.4.2.2 Negatively charged elements
P: While in root, all compounds at nearly all concentrations (exceptions lay only within Rosie
bok choy) decreased the P accumulation of both Rosie and Green bok choy.
At 600 mg/kg, nano CuO caused lower Rosie and Green bok choy root P uptake by 38%
and 47%, with respect to control. Meanwhile, decline was also caused by nano and bulk CuO in
Green bok choy at 150 mg/kg significantly by 70% and 43%, respectively, compared with control.
Only nano CuO and bulk CuO significantly reduced the P uptake in roots. The reason could
be the negative Zeta potential of the surface of nano and bulk CuO particles, which physically
blocked the uptake of phosphate ions (H2PO4−, HPO4
2−). Rawat et al. (2018) reported similar

51
results that at 125 mg/kg leaf P was decreased by nano CuO by 41% compared by bCuO treatment
of bell pepper. According to Apodaca et al. (2017) P content of bean plants were reduced by 33%
to 97% with bulk CuO and CuCl2 treatments.
2.3.5 Sugar and starch
Sugar and starch contents were analyzed for bok choy leaves, and the data are presented as
normalized relative sugar/starch content, with respect to the control.
2.3.5.1 Sugar
The evaluation of total sugar of all the treatments in bok choy leaves were shown in Table
S2.
For both Rosie and Green bok choy, the total sugar contents were not significantly altered
by nano CuO or ion Cucl2 at any related concentrations.
On the other hand, Rosie leaves treated with bulk CuO at 150, 300, 600 mg/kg had higher
total sugar contents, with significant increases of 56.87%, 51.89% and 49.46%, respectively,
compared with control. Total sugar content of Green bok choy leaves were also significantly
altered by bulk CuO. At 600 mg/kg, bulk CuO decreased Green bok choy sugar content by 49.03%
compared with control. The different response by Rosie and Green bok choy to the interaction of
bulk CuO may be attributed to their different anthocyanin content and Cu uptake.

52
Figure 2.8 Sugar content of both bok choy plants (70 days) cultivated in soil spiked with 0, 75,
150, 300 and 600 mg/kg of nCuO, bCuO, and CuCl2. Data are means of three replicates ± SE (n =
3). Different letters represent statistically significant differences within the same Cu-treatment
compounds at (p ≤ 0.05).
2.3.5.2 Starch
Mean value and SE of Boch choy leaf starch contents after exposed with Cu based
compounds were shown in Table S2.
As determined by one-way ANOVA, no significant impact was founded among starch
accumulation of all the treatments, compared with control. As showed in Fig S6, bulk CuO with
Rosie bok choy, nano CuO and ion Cucl2 with Green bok choy, increased leaf starch content at the

53
range of 2.26-39.39%, 10.72-44.11% and 8.35-32.38%. The highest increase in the above three
cases were all happened at 75 mg/kg, respectively, which indicated that at the lowest exposing
concentration (75 mg/kg) Cu based compounds could enhance the starch content in certain type of
bok choy plants.
Figure 2.9 Starch content of both bok choy plants (70 days) cultivated in soil spiked with 0, 75,
150, 300 and 600 mg/kg of nCuO, bCuO, and CuCl2. Data are means of three replicates ± SE (n =
3). Different letters represent statistically significant differences within the same Cu-treatment
compounds at (p ≤ 0.05).

54
2.3.6 Soluble Protein
As presented in Table S2, all applied Cu based compounds reduced bok choy leaf protein
at all concentrations (only except for nano CuO at 300 and 600 mg/kg with Rosie bok choy) but
without any significance. According to previous literature, Cu2+ could take part in the process of
the plants’ development and metabolism. It is species dependent of the plant protein response after
the interaction with Cu based compounds (Majumdar et al., 2015).
Figure 2.10 Soluble protein content of both bok choy plants (70 days) cultivated in soil spiked with
0, 75, 150, 300 and 600 mg/kg of nCuO, bCuO, and CuCl2. Data are means of three replicates ±
55
SE (n = 3). Different letters represent statistically significant differences within the same Cu-
treatment compounds at (p ≤ 0.05).
2.3.7 Gas exchange
The gas exchange data including evaporation rate, intercellular CO2 concentration, net
photosynthetic rate and vapor pressure deficit are presented in Fig 2.11. No significant difference
was found in leaf evaporation rate and vapor pressure deficit, compared with control. Intercellular
CO2 concentration of Rosie bok choy treated with bulk CuO and Geen bok choy treated with nano
CuO at 600 mg/kg were lower by 21.3% and 19.8%, respectively, compared with each control.
Net photosynthetic rate of Green bok choy were also significantly altered by bulk CuO and CuCl2.
At 300 mg/kg bulk CuO decreased the rate by 28.3%, compared with control. At 75 mg/kg CuCl2
decreased the rate by 29.6%.

56

57

58
Figure 2.11 Evaporation rate, Intercellular CO2 concentration, Net photosynthetic rate and Vapor
pressure deficit of both bok choy plants (70 days) cultivated in soil spiked with 0, 75, 150, 300
and 600 mg/kg of nCuO, bCuO, and CuCl2. Data are means of three replicates ± SE (n = 3).
Different letters represent statistically significant differences within the same Cu-treatment
compounds at (p ≤ 0.05).
59
2.4 Conclusion
In this study, a three-way interaction effect was found among bok choy plant types (Rosie
and Green), applied Cu based compounds (nano CuO, bulk CuO and ion CuCl2) and exposed
concentrations (75, 150, 300, 600 mg/kg) on the independent variables of plant fresh weight, dry
weight, height, foliar area, chlorophyll content, and Cu uptake in roots as well as leaves. Both Cu
based compounds and applied concentrations were analyzed to be a simple-simple main effect on
the above responses. The different anthocyanin content in each bok choy plants may be considered
as one of the reasons for the different responses to the same treatments. For both Rosie and Green
bok choy, the increase of root Cu uptake was concentration-dependent for each of the Cu based
compounds. The evaluation shows that roots accumulate more Cu than leaves, and Rosie bok choy
had more Cu uptake than Green. As a result, Cu based compounds inhibited the growth of Rosie
bok choy more than the Green, and that nano CuO is the most toxic compared among the three Cu
based treatments at same exposed concentrations. Plant fresh weight, dry weight, height, foliar
area and chlorophyll content decreased in Rosie and Green bok choy overall as compared to the
control. Additionally, nutrient contents were altered by the treatments. Nano CuO significantly
reduced K content in Rosie bok choy leaf by 45% at 150 mg/kg, and Green bok choy root by 41%
at 600 mg/kg with respect to each control. Also, Fe accumulation in bok choy root was significantly
decreased by the range of 18-50% in both Rosie and Green bok choy plants as compared with the
control. Similarly, root P was also significantly decreased by the Cu based exposures by up to 70%
with respect to control. Moreover, All Cu based compounds decreased leaf Zn accumulation at all
treated concentrations with both Rosie and Green bok choy. Only Al accumulation was
significantly increased in leaves, while being significantly decreased in roots after the treatments
with respect to control. Total sugar, starch and protein content were not significantly altered by
any of the treatments. Pictures taken by Two-photon Microscopy demonstrated the presence of
nano CuO inside bok choy leaf tissues.
60
Future work should focus on the interaction mechanism among Cu based compounds and
plants with anthocyanin, as well as the uptake pathway of nano CuO particles. To the author’s best
knowledge, this is the first study determining the interaction effect among plants with different
anthocyanin levels, Cu based compounds (nano CuO, bulk CuO and ion Cucl2) and concentrations
in the growth of bok choy plants.

61
2.5 References
Adrees, M., Ali, S., Rizwan, M., Ibrahim, M., Abbas, F., Farid, M., ... & Bharwana, S. A. (2015).
The effect of excess copper on growth and physiology of important food crops: a review.
Environmental Science and Pollution Research, 22(11), 8148-8162.
Apodaca, S. A., Tan, W., Dominguez, O. E., Hernandez-Viezcas, J. A., Peralta-Videa, J. R., &
Gardea-Torresdey, J. L. (2017). Physiological and biochemical effects of nanoparticulate copper,
bulk copper, copper chloride, and kinetin in kidney bean (Phaseolus vulgaris) plants. Science of
the Total Environment, 599, 2085-2094.
Apodaca, S. A., Medina-Velo, I. A., Lazarski, A. C., Flores-Margez, J. P., Peralta-Videa, J. R., &
Gardea-Torresdey, J. L. (2018). Different forms of copper and kinetin impacted element
accumulation and macromolecule contents in kidney bean (Phaseolus vulgaris) seeds. Science of
The Total Environment, 636, 1534-1540.
Atha, D. H., Wang, H., Petersen, E. J., Cleveland, D., Holbrook, R. D., Jaruga, P., ... & Nelson, B.
C. (2012). Copper oxide nanoparticle mediated DNA damage in terrestrial plant models.
Environmental science & technology, 46(3), 1819-1827.
Acosta, Y., Zhang, Q., Rahaman, A., Ouellet, H., Xiao, C., Sun, J., & Li, C. (2014). Imaging
cytosolic translocation of Mycobacteria with two-photon fluorescence resonance energy transfer
microscopy. Biomedical optics express, 5(11), 3990-4001.
Bush, P. G., Wokosin, D. L., & Hall, A. C. (2007). Two-versus one photon excitation laser scanning
microscopy: critical importance of excitation wavelength. Frontiers in bioscience: a journal and
virtual library, 12, 2646.
Dou, H., Niu, G., Gu, M., & Masabni, J. G. (2018). Responses of Sweet Basil to Different Daily
Light Integrals in Photosynthesis, Morphology, Yield, and Nutritional Quality. HortScience, 53(4),
496-503.
Dubois, M., Gilles, K. A., Hamilton, J. K., Rebers, P. T., & Smith, F. (1956). Colorimetric method
for determination of sugars and related substances. Analytical chemistry, 28(3), 350-356.
Daei, A. R., Majumdar, D., & Filip, P. (2015). Performance of Low-metallic Cu-free Brake Pads
with Two Different Graphite Types (No. 2015-01-2677). SAE Technical Paper.
Du, W., Tan, W., Yin, Y., Ji, R., Peralta-Videa, J. R., Guo, H., & Gardea-Torresdey, J. L. (2018).
Differential effects of copper nanoparticles/microparticles in agronomic and physiological
parameters of oregano (Origanum vulgare). Science of The Total Environment, 618, 306-312.
Dimkpa, C. O., McLean, J. E., Latta, D. E., Manangón, E., Britt, D. W., Johnson, W. P., ... &
Anderson, A. J. (2012). CuO and ZnO nanoparticles: phytotoxicity, metal speciation, and induction
of oxidative stress in sand-grown wheat. Journal of Nanoparticle Research, 14(9), 1125.

62
Dimkpa, C. O., McLean, J. E., Britt, D. W., & Anderson, A. J. (2015). Nano-CuO and interaction
with nano-ZnO or soil bacterium provide evidence for the interference of nanoparticles in metal
nutrition of plants. Ecotoxicology, 24(1), 119-129.
Dimkpa, C. O., Latta, D. E., McLean, J. E., Britt, D. W., Boyanov, M. I., & Anderson, A. J. (2013).
Fate of CuO and ZnO nano-and microparticles in the plant environment. Environmental science &
technology, 47(9), 4734-4742.
Dimkpa, C. O., White, J. C., Elmer, W. H., & Gardea-Torresdey, J. (2017). Nanoparticle and ionic
Zn promote nutrient loading of sorghum grain under low NPK fertilization. Journal of agricultural
and food chemistry, 65(39), 8552-8559.
Hong, J., Rico, C. M., Zhao, L., Adeleye, A. S., Keller, A. A., Peralta-Videa, J. R., & Gardea-
Torresdey, J. L. (2015). Toxic effects of copper-based nanoparticles or compounds to lettuce
(Lactuca sativa) and alfalfa (Medicago sativa). Environmental Science: Processes & Impacts,
17(1), 177-185.
Kah, M., & Hofmann, T. (2014). Nanopesticide research: current trends and future
priorities. Environment international, 63, 224-235.
Le Van, N., Ma, C., Shang, J., Rui, Y., Liu, S., & Xing, B. (2016). Effects of CuO nanoparticles on
insecticidal activity and phytotoxicity in conventional and transgenic cotton. Chemosphere, 144,
661-670.
Le Van, N., Rui, Y., Cao, W., Shang, J., Liu, S., Nguyen Quang, T., & Liu, L. (2016). Toxicity and
bio-effects of CuO nanoparticles on transgenic Ipt-cotton. Journal of Plant Interactions, 11(1),
108-116.
Ivanov, V. K., Shcherbakov, A. B., & Usatenko, A. V. (2009). Structure-sensitive properties and
biomedical applications of nanodispersed cerium dioxide. Russian chemical reviews, 78(9), 855-
871.
Lee, W. M., An, Y. J., Yoon, H., & Kweon, H. S. (2008). Toxicity and bioavailability of copper
nanoparticles to the terrestrial plants mung bean (Phaseolus radiatus) and wheat (Triticum
aestivum): plant agar test for water‐insoluble nanoparticles. Environmental toxicology and
chemistry, 27(9), 1915-1921.
Lalau, C. M., de Almeida Mohedano, R., Schmidt, É. C., Bouzon, Z. L., Ouriques, L. C., dos
Santos, R. W., ... & Matias, W. G. (2015). Toxicological effects of copper oxide nanoparticles on
the growth rate, photosynthetic pigment content, and cell morphology of the duckweed Landoltia
punctata. Protoplasma, 252(1), 221-229.
Medina-Velo, I. A., Barrios, A. C., Zuverza-Mena, N., Hernandez-Viezcas, J. A., Chang, C. H., Ji,
Z., ... & Gardea-Torresdey, J. L. (2017). Comparison of the effects of commercial coated and
uncoated ZnO nanomaterials and Zn compounds in kidney bean (Phaseolus vulgaris) plants.
Journal of hazardous materials, 332, 214-222.

63
Musante, C., & White, J. C. (2012). Toxicity of silver and copper to Cucurbita pepo: differential
effects of nano and bulk‐size particles. Environmental toxicology, 27(9), 510-517.
Ma, Chuanxin, Sudesh Chhikara, Baoshan Xing, Craig Musante, Jason C. White, and Om Parkash
Dhankher. "Physiological and molecular response of Arabidopsis thaliana (L.) to nanoparticle
cerium and indium oxide exposure." ACS Sustainable Chemistry & Engineering 1, no. 7 (2013):
768-778.
Nair, P. M. G., Kim, S. H., & Chung, I. M. (2014). Copper oxide nanoparticle toxicity in mung
bean (Vigna radiata L.) seedlings: physiological and molecular level responses of in vitro grown
plants. Acta physiologiae plantarum, 36(11), 2947-2958.
Nair, P. M. G., & Chung, I. M. (2015). Study on the correlation between copper oxide nanoparticles
induced growth suppression and enhanced lignification in Indian mustard (Brassica juncea L.).
Ecotoxicology and environmental safety, 113, 302-313.
Nair, P. M. G., & Chung, I. M. (2015). Biochemical, anatomical and molecular level changes in
cucumber (Cucumis sativus) seedlings exposed to copper oxide nanoparticles. Biologia, 70(12),
1575-1585.
Ochoa, L., Medina-Velo, I. A., Barrios, A. C., Bonilla-Bird, N. J., Hernandez-Viezcas, J. A.,
Peralta-Videa, J. R., & Gardea-Torresdey, J. L. (2017). Modulation of CuO nanoparticles toxicity
to green pea (Pisum sativum Fabaceae) by the phytohormone indole-3-acetic acid. Science of the
Total Environment, 598, 513-524.
Porra, R. J. (2002). The chequered history of the development and use of simultaneous equations
for the accurate determination of chlorophylls a and b. Photosynthesis Research, 73(1-3), 149-156.
Rawat, S., Pullagurala, V. L., Hernandez-Molina, M., Sun, Y., Niu, G., Hernandez-Viezcas, J. A., ...
& Gardea-Torresdey, J. L. (2018). Impacts of copper oxide nanoparticles on bell pepper (Capsicum
annum L.) plants: a full life cycle study. Environmental Science: Nano, 5(1), 83-95.
So, P. T., Dong, C. Y., Masters, B. R., & Berland, K. M. (2000). Two-photon excitation
fluorescence microscopy. Annual review of biomedical engineering, 2(1), 399-429.
Scientific, T. (2010). Coomassie Bradford Protein Assay Kit. Retrieved April, 24, 2010.
Shaw, A. K., & Hossain, Z. (2013). Impact of nano-CuO stress on rice (Oryza sativa L.) seedlings.
Chemosphere, 93(6), 906-915.
Shaw, A. K., Ghosh, S., Kalaji, H. M., Bosa, K., Brestic, M., Zivcak, M., & Hossain, Z. (2014).
Nano-CuO stress induced modulation of antioxidative defense and photosynthetic performance of
Syrian barley (Hordeum vulgare L.). Environmental and experimental botany, 102, 37-47.
Shi, J., Abid, A. D., Kennedy, I. M., Hristova, K. R., & Silk, W. K. (2011). To duckweeds

64
(Landoltia punctata), nanoparticulate copper oxide is more inhibitory than the soluble copper in
the bulk solution. Environmental Pollution, 159(5), 1277-1282.
Shi, Y., Rhodes, N. R., Abdolvahabi, A., Kohn, T., Cook, N. P., Marti, A. A., & Shaw, B. F. (2013).
Deamidation of asparagine to aspartate destabilizes Cu, Zn superoxide dismutase, accelerates
fibrillization, and mirrors ALS-linked mutations. Journal of the American Chemical Society,
135(42), 15897-15908.
Trujillo-Reyes, J., Majumdar, S., Botez, C. E., Peralta-Videa, J. R., & Gardea-Torresdey, J. L.
(2014). Exposure studies of core–shell Fe/Fe3O4 and Cu/CuO NPs to lettuce (Lactuca sativa)
plants: are they a potential physiological and nutritional hazard? Journal of hazardous materials,
267, 255-263.
Thounaojam, T. C., Panda, P., Mazumdar, P., Kumar, D., Sharma, G. D., Sahoo, L., & Sanjib, P.
(2012). Excess copper induced oxidative stress and response of antioxidants in rice. Plant
Physiology and Biochemistry, 53, 33-39.
Uribe, E. G., & Stark, B. (1982). Inhibition of photosynthetic energy by cupric ion. Evidence for
Cu 2+—coupling factor 1 interaction. Plant Physiol, 186, 1040-1045.
Wu, S. G., Huang, L., Head, J., Chen, D. R., Kong, I. C., & Tang, Y. J. (2012). Phytotoxicity of
metal oxide nanoparticles is related to both dissolved metals ions and adsorption of particles on
seed surfaces. J Pet Environ Biotechnol, 3(4), 126.
Wang, Z., Xie, X., Zhao, J., Liu, X., Feng, W., White, J. C., & Xing, B. (2012). Xylem-and phloem-
based transport of CuO nanoparticles in maize (Zea mays L.). Environmental science & technology,
46(8), 4434-4441.
Zuverza-Mena, N., Medina-Velo, I. A., Barrios, A. C., Tan, W., Peralta-Videa, J. R., & Gardea-
Torresdey, J. L. (2015). Copper nanoparticles/compounds impact agronomic and physiological
parameters in cilantro (Coriandrum sativum). Environmental Science: Processes & Impacts,
17(10), 1783-1793.
Zuverza-Mena, N., Martínez-Fernández, D., Du, W., Hernandez-Viezcas, J. A., Bonilla-Bird, N.,
López-Moreno, M. L., ... & Gardea-Torresdey, J. L. (2017). Exposure of engineered nanomaterials
to plants: Insights into the physiological and biochemical responses-A review. Plant Physiology
and Biochemistry, 110, 236-264.
Syu, Y. Y., Hung, J. H., Chen, J. C., & Chuang, H. W. (2014). Impacts of size and shape of silver
nanoparticles on Arabidopsis plant growth and gene expression. Plant physiology and
biochemistry, 83, 57-64.
Thiruvengadam, M., Gurunathan, S., & Chung, I. M. (2015). Physiological, metabolic, and
transcriptional effects of biologically-synthesized silver nanoparticles in turnip (Brassica rapa ssp.
rapa L.). Protoplasma, 252(4), 1031-1046.

65
Appendix
Supporting material for Chapter 2
Figure S1 Concentration × Compound interaction plot of Root, Leaf Cu uptake of Rosie and Green bok choy in different concentration
(75, 150, 300 and 600 mg/kg) soil amended with nano CuO, bulk CuO and CuCl2. Data are means of three replicates ± SE.
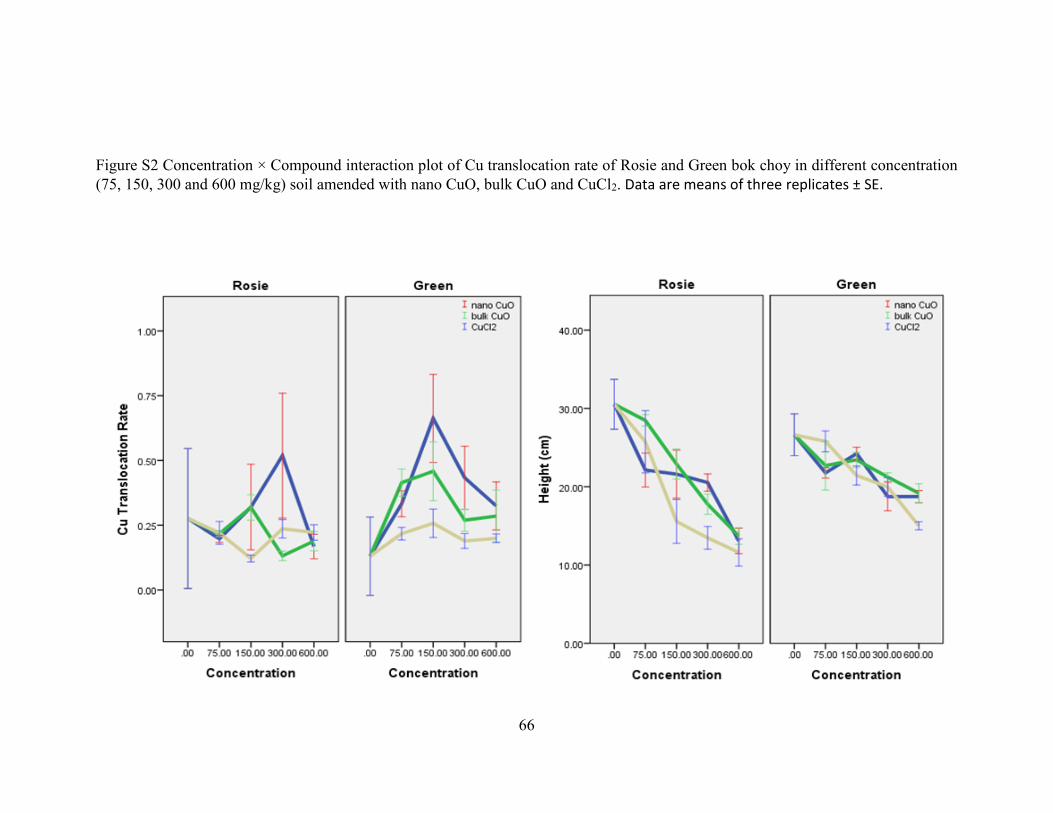
66
Figure S2 Concentration × Compound interaction plot of Cu translocation rate of Rosie and Green bok choy in different concentration
(75, 150, 300 and 600 mg/kg) soil amended with nano CuO, bulk CuO and CuCl2. Data are means of three replicates ± SE.

67
Figure S3 Concentration × Compound interaction plot of Dry and Fresh weight of Rosie and Green bok choy in different concentration
(75, 150, 300 and 600 mg/kg) soil amended with nano CuO, bulk CuO and CuCl2. Data are means of three replicates ± SE.

68
Figure S4 Concentration × Compound interaction plot of Chlorophyll a and b of Rosie and Green bok choy in different concentration
(75, 150, 300 and 600 mg/kg) soil amended with nano CuO, bulk CuO and CuCl2. Data are means of three replicates ± SE.

69
Figure S5 Concentration × Compound interaction plot of Foliar area and Protein of Rosie and Green bok choy in different concentration
(75, 150, 300 and 600 mg/kg) soil amended with nano CuO, bulk CuO and CuCl2. Data are means of three replicates ± SE.

70
Figure S6 Concentration × Compound interaction plot of Sugar and Starch of Rosie and Green bok choy in different concentration (75,
150, 300 and 600 mg/kg) soil amended with nano CuO, bulk CuO and CuCl2. Data are means of three replicates ± SE.

71
Figure S7 Concentration × Compound interaction plot of Evaporation rate and net photosynthetic rate of Rosie and Green bok choy in
different concentration (75, 150, 300 and 600 mg/kg) soil amended with nano CuO, bulk CuO and CuCl2. Data are means of three replicates ± SE.
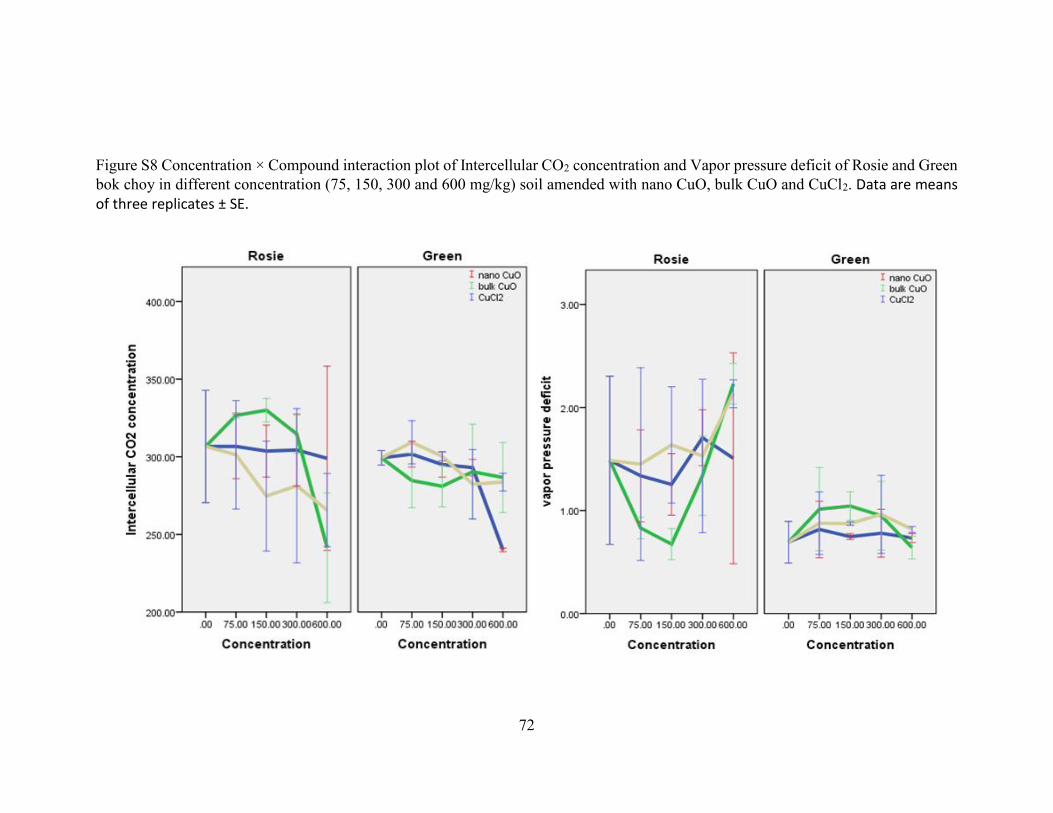
72
Figure S8 Concentration × Compound interaction plot of Intercellular CO2 concentration and Vapor pressure deficit of Rosie and Green
bok choy in different concentration (75, 150, 300 and 600 mg/kg) soil amended with nano CuO, bulk CuO and CuCl2. Data are means of three replicates ± SE.

73
Table S1 Element content in leaves and roots of both bok choy plants (70 days) cultivated in soil spiked with 0, 75, 150, 300 and 600
mg/kg of nCuO, bCuO, and CuCl2. Data are means of three replicates ± SE (n = 3). * mark represent statistically significantly different
compared with control at (p ≤ 0.05).

74
Plant Compounds Concentration
Root Al Root Ca Root Fe Root K Root Mg
Rosie 0 7950.052 ± 667.522 70701.371 ± 9740.353 8472.111 ± 609.394 4045.079 ± 387.442 8361.529 ± 352.744
nano CuO 75 8348.852 ± 390.849 78564.914 ± 5674.760 8941.970 ± 535.176 5297.737 ± 159.939 7605.751 ± 301.782
nano CuO 150 7161.278 ± 837.817 69472.059 ± 5727.409 7571.013 ± 605.861 5043.590 ± 279.708 8196.024 ± 478.354
nano CuO 300 7718.331 ± 469.229 77488.543 ± 3932.645 7937.311 ± 141.912 4998.200 ± 248.225 6294.391 ± 410.000
nano CuO 600 7247.473 ± 185.979 55328.754 ± 6031.246 8569.157 ± 331.316 5995.870 ± 473.702* 6679.198 ± 688.834
bulk CuO 75 5370.328 ± 154.871* 46715.290 ± 1831.240* 5972.011 ± 507.181* 4602.805 ± 278.502 6857.553 ± 334.924
bulk CuO 150 8788.130 ± 149.885 46224.281 ± 1025.815* 9334.243 ± 248.348 5487.367 ± 217.450 7437.425 ± 571.217
bulk CuO 300 7252.531 ± 586.171 55222.280 ± 2458.180 7438.253 ± 476.004 5471.936 ± 266.184 8105.223 ± 564.572
bulk CuO 600 5110.256 ± 340.150* 60844.440 ± 3912.981* 6483.212 ± 392.551 4430.348 ± 385.582 7368.804 ± 306.493
CuCl2 75 5845.697 ± 208.405* 55253.169 ± 1332.151 6918.397 ± 142.921* 5181.485 ± 186.714 6640.543 ± 496.956
CuCl2 150 9677.315 ± 139.217 59835.526 ± 4650.967 9275.357 ± 74.768 5253.671 ± 393.078 7637.490 ± 311.535
CuCl2 300 6779.271 ± 423.080 58181.811 ± 4744.237 7707.854 ± 212.673 3762.006 ± 282.511 6209.638 ± 591.603
CuCl2 600 3844.436 ± 62.240 * 43581.586 ± 2607.034 4196.145 ± 259.856* 3729.443 ± 197.013 5876.721 ± 307.504*
Green 0 8461.068 ± 130.382 45961.105 ± 2674.060 7459.756 ± 376.851 5384.469 ± 112.333 7918.929 ± 397.829
nano CuO 75 6935.215 ± 618.301 48920.959 ± 3186.830 7260.325 ± 462.591 4040.353 ± 346.190* 8054.859 ± 176.927
nano CuO 150 5211.906 ± 336.365* 52034.354 ± 1549.442 5665.089 ± 319.718* 3710.340 ± 285.290* 6215.428 ± 372.936*
nano CuO 300 4953.360 ± 324.707* 51891.068 ± 720.136 5132.094 ± 40.411 * 4626.669 ± 66.552 5640.087 ± 161.643*
nano CuO 600 5259.256 ± 469.956* 51820.196 ± 2922.113 5581.094 ± 348.802* 3190.774 ± 93.624* 4977.869 ± 358.826*
bulk CuO 75 6213.573 ± 550.474 41602.957 ± 2449.529 9500.006 ± 619.039* 5293.310 ± 374.281 4683.105 ± 309.532*
bulk CuO 150 6819.007 ± 282.082 39109.866 ± 4509.983 8622.212 ± 515.774 5444.320 ± 340.371 6133.859 ± 785.798
bulk CuO 300 5471.415 ± 724.902* 37714.650 ± 3713.083 5680.548 ± 221.408 4887.743 ± 222.120 6092.468 ± 710.071
bulk CuO 600 5136.522 ± 565.274* 50785.552 ± 4910.733 5043.778 ± 162.789* 6295.491 ± 269.693 6176.449 ± 376.257
CuCl2 75 7176.341 ± 452.559 44734.867 ± 2429.522 6298.410 ± 592.314 4704.148 ± 303.940 6067.688 ± 519.458
CuCl2 150 6317.053 ± 151.124* 42194.007 ± 1062.354 5356.109 ± 238.045 4379.227 ± 720.006 5035.850 ± 346.034*
CuCl2 300 6954.107 ± 303.952* 48079.028 ± 1696.096 6934.249 ± 401.432 4577.111 ± 88.239 6562.033 ± 326.970
CuCl2 600 5172.352 ± 386.077* 51345.210 ± 768.854 5344.325 ± 305.577* 3691.281 ± 246.411 5270.085 ± 521.573

75
Root Mn Root Ni Root P Root Pb Root S Root Zn
Rosie 0 266.460 ± 7.203 25.168 ± 1.960 2006.455 ± 109.530* 43.393 ± 1.747 1984.339 ± 89.916 56.886 ± 4.610
nano CuO 75 352.425 ± 17.529 19.199 ± 4.780 1907.672 ± 167.663 44.003 ± 6.600 2472.785 ± 170.965 47.011 ± 2.575
nano CuO 150 309.051 ± 22.708 14.423 ± 2.646 2318.183 ± 201.722 17.988 ± 1.044* 2621.347 ± 691.274 45.151 ± 2.763
nano CuO 300 309.757 ± 24.503 15.500 ± 2.688 2201.805 ± 167.675 27.776 ± 2.975 1619.420 ± 152.569 48.946 ± 4.260
nano CuO 600 273.014 ± 26.743 19.267 ± 4.326 1246.785 ± 136.012 28.884 ± 2.665 2566.924 ± 765.904 41.289 ± 0.825*
bulk CuO 75 196.032 ± 24.187* 8.766 ± 0.471* 1183.410 ± 277.784 15.278 ± 2.066* 1344.743 ± 25.918* 32.668 ± 2.155*
bulk CuO 150 300.060 ± 8.647 18.406 ± 2.231 1310.476 ± 201.242 30.150 ± 3.823 1406.545 ± 132.330 40.000 ± 0.860*
bulk CuO 300 258.018 ± 15.174 13.858 ± 1.547* 2053.479 ± 278.907 32.475 ± 4.786 2372.467 ± 152.871 39.764 ± 3.016*
bulk CuO 600 198.802 ± 5.689* 16.663 ± 1.134* 1935.389 ± 142.739 22.868 ± 1.261* 3799.650 ± 171.178* 44.498 ± 0.624
CuCl2 75 228.916 ± 19.740 11.766 ± 0.459* 1642.005 ± 102.072 21.057 ± 2.811* 1815.347 ± 363.091 38.713 ± 4.606
CuCl2 150 283.665 ± 0.812 12.710 ± 0.752* 1004.763 ± 66.984 33.787 ± 5.078 2578.429 ± 328.930 42.700 ± 2.992
CuCl2 300 246.325 ± 2.283 16.280 ± 0.444* 929.774 ± 112.528 25.100 ± 2.639* 1774.300 ± 398.361 41.602 ± 2.112
CuCl2 600 219.507 ± 7.308* 9.904 ± 1.236* 2328.967 ± 564.943 25.112 ± 1.136* 2533.854 ± 444.004 49.199 ± 5.406
Green 0 367.746 ± 38.325 14.218 ± 2.531 3252.583 ± 384.356 25.810 ± 2.365 2072.814 ± 204.923 60.461 ± 2.483
nano CuO 75 213.959 ± 8.523* 14.015 ± 0.912 2404.976 ± 126.553 22.840 ± 5.803 1442.258 ± 61.983* 36.479 ± 2.881*
nano CuO 150 185.608 ± 9.838* 12.861 ± 1.492 980.040 ± 110.471* 41.637 ± 1.625 1392.037 ± 133.221* 40.289 ± 4.242*
nano CuO 300 228.023 ± 17.171* 13.112 ± 1.088 2277.719 ± 306.773 26.151 ± 5.931 2317.382 ± 154.234 52.231 ± 2.473
nano CuO 600 212.085 ± 8.663* 10.836 ± 0.650 1727.270 ± 422.065* 19.157 ± 5.675 1335.196 ± 34.401* 39.253 ± 3.801*
bulk CuO 75 207.804 ± 8.702* 16.005 ± 2.020 1591.778 ± 314.853* 25.876 ± 1.523 1495.379 ± 158.314 39.531 ± 2.046*
bulk CuO 150 284.079 ± 21.270 13.508 ± 1.298 1848.454 ± 21.090* 27.838 ± 0.018 1754.741 ± 41.590 55.221 ± 3.451
bulk CuO 300 224.332 ± 13.436* 10.291 ± 1.056 2262.528 ± 183.601 19.967 ± 4.394 1931.469 ± 358.469 39.568 ± 2.939*
bulk CuO 600 169.744 ± 20.762* 8.926 ± 0.991 2145.493 ± 102.174 17.761 ± 0.968 2891.104 ± 290.216 37.742 ± 0.719*
CuCl2 75 205.555 ± 5.760* 10.790 ± 0.379 2338.549 ± 299.243 19.957 ± 2.963 1440.458 ± 225.745 43.317 ± 1.326*
CuCl2 150 184.948 ± 9.251* 12.295 ± 0.585 1948.515 ± 524.873 18.923 ± 1.533 1296.401 ± 152.166 49.314 ± 4.624
CuCl2 300 229.304 ± 1.811* 13.772 ± 1.876 2196.269 ± 76.023 20.776 ± 2.880 2001.670 ± 388.538 44.595 ± 3.270*
CuCl2 600 196.542 ± 9.251* 9.648 ± 0.151 1952.926 ± 69.087 15.608 ± 2.578 2081.102 ± 311.396 32.416 ± 1.987*

76
Leaf Ca Leaf Al Leaf Fe Leaf K Leaf Mg
Rosie 0 27150.930 ± 2777.768 27.102 ± 1.681 40.126 ± 2.897 60717.747 ± 4591.298 6915.169 ± 165.368
nano CuO 75 30847.209 ± 3524.840 31.320 ± 3.411 44.953 ± 3.571 48521.796 ± 7030.080 5489.366 ± 398.644*
nano CuO 150 29220.584 ± 1701.682 43.033 ± 3.386* 37.196 ± 4.201 33220.546 ± 6957.357* 5550.832 ± 178.529*
nano CuO 300 30896.027 ± 1470.403 28.729 ± 1.783 42.112 ± 3.709 50912.153 ± 4698.894 5991.633 ± 31.885
nano CuO 600 32583.664 ± 1718.340 22.987 ± 2.402 54.067 ± 2.608 41687.685 ± 5712.218 6314.149 ± 338.331
bulk CuO 75 29759.981 ± 1153.232 34.531 ± 2.045 62.338 ± 4.876* 68920.955 ± 3064.923 5064.340 ± 171.639*
bulk CuO 150 29866.652 ± 2365.503 13.802 ± 0.842* 45.398 ± 3.956 71135.571 ± 9305.739 5068.936 ± 445.949*
bulk CuO 300 30255.969 ± 2803.643 28.145 ± 3.479 33.366 ± 0.149 31718.723 ± 1530.250* 5951.504 ± 219.177
bulk CuO 600 24458.302 ± 1382.397 27.094 ± 2.800 69.280 ± 0.929* 60318.055 ± 7595.734 6328.609 ± 329.741
CuCl2 75 35481.368 ± 1189.050 21.456 ± 2.526 45.107 ± 3.663 47765.767 ± 2139.189 5824.988 ± 295.352
CuCl2 150 22377.047 ± 2794.919 36.246 ± 3.118* 41.706 ± 3.453 76351.592 ± 6678.560 5203.993 ± 403.124
CuCl2 300 33397.879 ± 2743.605 49.690 ± 7.504* 47.562 ± 0.408 71106.346 ± 6302.762 6140.627 ± 525.834
CuCl2 600 35291.630 ± 2670.003 33.219 ± 3.293* 44.013 ± 3.167 55445.451 ± 9030.287 6780.472 ± 609.118
Green 0 31915.750 ± 1819.063 14.753 ± 3.816 65.432 ± 5.786 58819.332 ± 3795.568 5767.125 ± 213.715
nano CuO 75 31522.373 ± 420.9493 26.900 ± 1.714* 68.148 ± 3.429 70638.467 ± 6055.573 5227.963 ± 213.906
nano CuO 150 27609.879 ± 573.3892 20.196 ± 3.240 69.196 ± 2.882 70817.938 ± 6128.150 4766.013 ± 290.966*
nano CuO 300 29135.671 ± 1114.320 29.809 ± 1.041* 68.543 ± 3.257 66947.267 ± 2095.708 5723.534 ± 195.897
nano CuO 600 34269.169 ± 1300.771 30.192 ± 1.029* 61.365 ± 2.036 72310.307 ± 3141.502 5626.732 ± 119.148
bulk CuO 75 29322.517 ± 1294.605 32.186 ± 1.673* 61.319 ± 1.102 67426.137 ± 2422.620 5440.063 ± 482.844
bulk CuO 150 30150.016 ± 1405.927 20.940 ± 2.489 58.422 ± 5.282 66225.156 ± 2180.906 5025.532 ± 148.110
bulk CuO 300 35763.695 ± 2289.297 20.284 ± 1.542 51.655 ± 4.906 57470.719 ± 1794.099 5377.161 ± 58.117
bulk CuO 600 32021.820 ± 2139.865 17.077 ± 3.193 51.482 ± 2.511 66049.194 ± 4852.356 4759.740 ± 420.401
CuCl2 75 34026.219 ± 1432.260 22.257 ± 1.961 61.930 ± 0.344 53388.658 ± 1670.656 5167.800 ± 154.736
CuCl2 150 34648.649 ± 960.909 23.118 ± 5.261 71.618 ± 4.981 68046.345 ± 4867.385 5447.220 ± 175.205
CuCl2 300 31229.085 ± 2789.136 17.756 ± 1.631 60.541 ± 4.311 72847.018 ± 8720.696 5224.824 ± 166.432
CuCl2 600 40079.557 ± 3536.945 18.531 ± 2.028 49.045 ± 2.603 67158.918 ± 3145.620 5253.018 ± 208.511

77
Leaf Mn Leaf Ni Leaf P Leaf Pb Leaf S Leaf Zn
Rosie 0 37.476 ± 4.048 2.243 ± 0.110 2335.733 ± 570.014 7.646 ± 5.556 8681.943 ± 550.032 33.071 ± 1.209
nano CuO 75 38.891 ± 4.628 2.839 ± 0.237 2886.550 ± 304.446 10.674 ± 4.578 9543.336 ± 1090.815 30.918 ± 1.535
nano CuO 150 32.616 ± 1.538 3.571 ± 0.138* 2196.263 ± 816.747 9.872 ± 4.439 10551.882 ± 1473.530 26.069 ± 1.156*
nano CuO 300 54.520 ± 3.493* 3.022 ± 0.304 3437.340 ± 147.318 13.030 ± 2.170 11634.812 ± 1112.302 26.083 ± 1.937*
nano CuO 600 44.001 ± 1.698 2.603 ± 0.111 2129.318 ± 566.295 4.936 ± 2.571 7823.625 ± 567.798 26.476 ± 1.151
bulk CuO 75 56.706 ± 4.292* 2.182 ± 0.103 3200.153 ± 257.726 8.351 ± 1.729 8718.066 ± 290.312 29.868 ± 2.239
bulk CuO 150 53.516 ± 3.623 2.516 ± 0.112 3129.577 ± 371.440 8.891 ± 4.958 8426.018 ± 672.045 24.359 ± 1.197*
bulk CuO 300 68.064 ± 4.682* 2.412 ± 0.160 1741.598 ± 91.854 5.673 ± 0.744 10278.200 ± 1145.357 28.512 ± 1.717
bulk CuO 600 37.371 ± 1.021 2.826 ± 0.146 2490.146 ± 608.346 5.985 ± 3.422 8378.570 ± 589.966 22.810 ± 0.913*
CuCl2 75 41.393 ± 3.509 3.806 ± 0.145* 2492.221 ± 356.551 20.773 ± 2.938 12253.160 ± 2112.390 32.708 ± 2.178
CuCl2 150 35.604 ± 1.414 3.855 ± 0.218* 3887.900 ± 391.437 15.136 ± 2.931 8438.029 ± 458.534 25.569 ± 0.850*
CuCl2 300 55.193 ± 2.382* 3.777 ± 0.132* 3516.409 ± 223.360 6.015 ± 1.052 10109.331 ± 287.136 31.315 ± 1.425
CuCl2 600 39.156 ± 1.610 2.513 ± 0.168 2079.433 ± 627.897 11.559 ± 2.116 8572.017 ± 838.458 26.122 ± 1.460*
Green 0 74.849 ± 0.909 3.401 ± 0.224 3539.548 ± 493.129 11.315 ± 4.712 9542.996 ± 485.923 35.317 ± 1.151
nano CuO 75 50.473 ± 2.017* 3.142 ± 0.209 5488.374 ± 1118.116 14.411 ± 4.181 9862.305 ± 353.631 31.665 ± 1.819
nano CuO 150 74.128 ± 1.796 3.009 ± 0.200 3593.4124± 38.793 10.663 ± 1.056 9101.455 ± 1171.528 31.173 ± 1.195
nano CuO 300 74.536 ± 2.416 2.830 ± 0.146 4436.592 ± 321.880 7.935 ± 3.827 10655.041 ± 618.466 27.350 ± 0.196*
nano CuO 600 80.070 ± 3.814 2.937 ± 0.160 4467.320 ± 534.062 5.282 ± 2.269 10567.640 ± 565.533 26.550 ± 0.290*
bulk CuO 75 69.105 ± 2.757 3.079 ± 0.160 3844.177 ± 314.916 8.662 ± 1.699 8936.872 ± 1340.250 32.359 ± 2.565
bulk CuO 150 76.358 ± 2.901 3.084 ± 0.108 4277.178 ± 296.620 12.116 ± 7.529 9492.316 ± 36.790 30.726 ± 1.607
bulk CuO 300 85.914 ± 2.625 3.273 ± 0.124 3218.810 ± 485.499 13.846 ± 5.924 9133.325 ± 389.410 31.344 ± 0.985
bulk CuO 600 87.438 ± 15.854 2.553 ± 0.257 3639.757 ± 220.876 4.888 ± 2.442 11917.538 ± 1477.471 22.327 ± 1.616*
CuCl2 75 82.598 ± 2.202 2.909 ± 0.162 3605.452 ± 229.263 5.134 ± 2.497 11679.343 ± 774.258 32.585 ± 1.256
CuCl2 150 62.356 ± 5.337 2.691 ± 0.227 4521.722 ± 388.332 8.092 ± 3.404 10861.875 ± 739.063 34.350 ± 0.344
CuCl2 300 52.474 ± 1.686* 2.670 ± 0.180 3905.942 ± 177.599 7.238 ± 2.909 11221.535 ± 1024.235 27.785 ± 2.275*
CuCl2 600 44.854 ± 3.394* 2.676 ± 0.096 2802.317 ± 130.431 1.507 ± 5.429 11073.100 ± 735.717 27.320 ± 0.919*

78
Table S2 Sugar, Starch and Protein content in leaves of both bok choy plants (70 days) cultivated in soil spiked with 0, 75, 150, 300 and
600 mg/kg of nCuO, bCuO, and CuCl2. Data are means of three replicates ± SE (n = 3). * mark represent statistically significant
differences within the control at (p ≤ 0.05).

79
Plant Compounds Concentration Sugar Starch Protein
Rosie 0 3.604 ± 0.549 0.203 ± 0.051 1.186 ± 0.105
nano CuO 75 3.767 ± 0.026 0.232 ± 0.023 1.057 ± 0.087
nano CuO 150 4.015 ± 0.45* 0.154 ± 0.006 1.128 ± 0.071
nano CuO 300 2.997 ± 0.034* 0.248 ± 0.024 1.143 ± 0.068
nano CuO 600 3.077 ± 0.25*6 0.196 ± 0.002 1.126 ± 0.059
bulk CuO 75 4.035 ± 0.035 0.283 ± 0.027 1.185 ± 0.042
bulk CuO 150 5.653 ± 0.388 0.208 ± 0.039 1.063 ± 0.045
bulk CuO 300 5.474 ± 0.111 0.235 ± 0.006 0.959 ± 0.128
bulk CuO 600 5.386 ± 0.004 0.23 ± 0.032 1.096 ± 0.085
CuCl2 75 3.554 ± 0.029 0.234 ± 0.042 1.129 ± 0.007
CuCl2 150 3.131 ± 0.069 0.391 ± 0.137 1.179 ± 0.130
CuCl2 300 3.399 ± 0.088 0.251 ± 0.03 0.995 ± 0.163
CuCl2 600 2.782 ± 0.076 0.175 ± 0.008 0.933 ± 0.089
Green 0 3.789 ± 0.646 0.189 ± 0.031 1.621 ± 0.268
nano CuO 75 4.091 ± 0.091 0.273 ± 0.003 1.491 ± 0.119
nano CuO 150 4.02 ± 0.236 0.231 ± 0.015 1.409 ± 0.109
nano CuO 300 3.505 ± 0.399 0.211 ± 0.048 1.475 ± 0.087
nano CuO 600 2.991 ± 0.277 0.21 ± 0.022 1.063 ± 0.143
bulk CuO 75 4.016 ± 0.016 0.205 ± 0.016 1.448 ± 0.187
bulk CuO 150 3.329 ± 0.181 0.231 ± 0.048 1.295 ± 0.133
bulk CuO 300 3.581 ± 0.49 0.172 ± 0.016 1.231 ± 0.085
bulk CuO 600 1.931 ± 0.142* 0.193 ± 0.034 1.275 ± 0.036
CuCl2 75 3.905 ± 0.111 0.251 ± 0.06 1.095 ± 0.020
CuCl2 150 3.416 ± 0.34 0.205 ± 0.043 1.150 ± 0.100
CuCl2 300 3.416 ± 0.012 0.224 ± 0.007 1.403 ± 0.145
CuCl2 600 3.101 ± 0.104 0.211 ± 0.006 1.069 ± 0.142

80
Vita
Chaoyi Deng was born on September 29th, 1990 in Hunan province, China. He graduated
from No.1 middle school in Changsha in 2009. Afterwards, he earned his Bachelor of Science
degree in Environmental Science and dual degree in Business management in University of
Science and Technology of China in 2013. During his bachelor’s studies he was accepted into the
Undergraduate Research Mentoring program in Environmental science in the spring of 2011 to
conduct research on an independent project with Dr. Renbin Zhu in the School of Earth and Space
Sciences. He won “Most Improved Undergraduate Student Award” in Environmental Science
department. He completed his bachelor’s thesis entitled “The distribution of typical enzymes
activity in Antarctic tundra soils and its affecting factors”. In fall 2013, he participated in the Joint
Training Laboratory Internship program at National center for Nanoscience and technology.
Chaoyi started his pre-master’s degree in Environmental Science department of University
of Marshall. The same year, Chaoyi began his master’s degree in Chemistry science under the
mentorship of Dr. Jorge L. Gardea-Torresdey, of which he holds a 3.94 GPA. His research focuses
on the effects of copper-oxide nanoparticles in bok choy and rice plant. His study comprehends
the importance of a full life cycle study to understand the effects on biochemical and physiological
parameters in the rice and bok choy plant. In August 2018, Chaoyi will start his Ph.D. degree in
Environmental Science and Engineering at the University of Texas at El Paso.
Contact Information: 208 Argonaut Dr
El Paso, TX 79912